
Surface Chemistry and Catalysis 2.1
Unit�II
CHAPTER 2: Surface Chemistry
INTRODUCTION
Surface Chemistry is closely related to interface and colloidal science. Surface chemistry is important in many criticalchemical processes, such as enzymatic reactions at biological interfaces found in cell walls and membranes, in electronics at the surfaces and interfaces of microchips used in computers, and the heterogeneous catalysts found in the catalytic converter used for cleaning emissions in automobile exhausts.
DEFINITION Surface science is the study of chemical phenomena that occur at the interface
of two phases (solid–liquid interfaces, solid–gas interfaces, solid–vacuum interfaces, and liquid-gas interfaces). (or)
It is defined as the study of chemical reactions at interfaces. 2.1
SURFACE CHEMISTRY AND CATALYSIS
Introduction - Terminologies in surface chemistry - Difference between adsorption and absorption - Types of adsorption - Adsorption isotherm- Freundlich Adsorption Isotherms- Langmuir Adsorption Isotherm - Contact Theory (or) Mechanism of Heterogeneous Catalysis - Kinetics of Surface Reaction - Kinetics of Bimolecular Reaction (Langmuir-Hinshelwood) - Types of Adsorption Isotherm - Application of Adsorption- Terms - Mechanism of Catalytic Reaction- Criteria (or) Characteristics for Catalyst Types of Catalysis - Homogeneous Catalysis - Heterogeneous Catalysis- Catalytic Poisoning and Promoters Application of Catalysis- Biological Catalyst— —Enzymes - Kinetics of Enzyme Catalysed Reaction Or Michaelis and Menten equation - Factors Affecting Enzyme Activity

2.2
TE
ERMINOLO
Adsor
Adsor
adsorb
Adsor
the sur
(Eg.) O
hydrog
Desor
called
Interfa
Absor
the bod
Sorpti
is calle
Occlu
called
OGIES IN
rbate: The su
rbent: The su
bent.
rption: The pr
rface of a soli
Occlusion of
gen gas is ads
rption: The
desorption.
ace: The plan
rption: When
dy of a solid o
ion: The phen
ed sorption.
usion: When
occlusion.
N SURFACE
ubstance whic
ubstance on th
rocess whereb
id.
f Hydrogen g
sorbate.
Figure 2.1
removal of
ne which sepa
n the molecule
or liquid. Thi
nomenon in w
adsorption o
1
E CHEMIS
ch gets adsorb
he surface of
by molecules
gas on Palladi
Adon
Adsorbent -adsorption ta
: Adsorption Pr
f the adsorbe
arates any two
es of a substan
is phenomeno
which adsorpti
of gases occ
STRY
rbed on any su
f which adsor
s of gases or li
ium where pa
dsorbent - the n the surface of
the solid wherakes place
rocess
ed substance
o phase is gen
nce are uniform
on is called ab
ion and absorp
curs on the su
urface is calle
rption takes p
iquids adhere
alladium is ad
gas adsorbed f solids
re
e from a sur
nerally called a
mly distribute
bsorption.
ption occur si
urface of me
Chemistry
ed adsorbate.
place is called
chemically to
dsorbent and
rface is
an interface.
ed throughout
imultaneously
etals it is
y
.
d
o
d
t
y

Surface Chemistry and Catalysis 2.3
Adsorption Desorption Absorption
Figure 2.2 : Occlusion Process
Positive adsorption: When the concentration of solute adsorbed on the solid
adsorbent surface is greater than in the bulk it is called positive adsorption.
(Eg.) Concentrated solution of KCl is shaken with blood charcoal, it shows positive
adsorption
Negative adsorption: When the solvent from the solution may be absorbed by the
adsorbent so that the concentration of the solute decreases and the concentration of
solution increases than the initial concentration and it is called negative adsorption.
(Eg.) Dilute solution of KCl is shaken with blood charcoal it shows negative adsorption.
Enthalpy or heat of adsorption
Amount of heat evolved when 1 mole of an adsorbate gets adsorbed on the surface of an adsorbent is called Molar Heat or Molar Enthalpy of Adsorption.
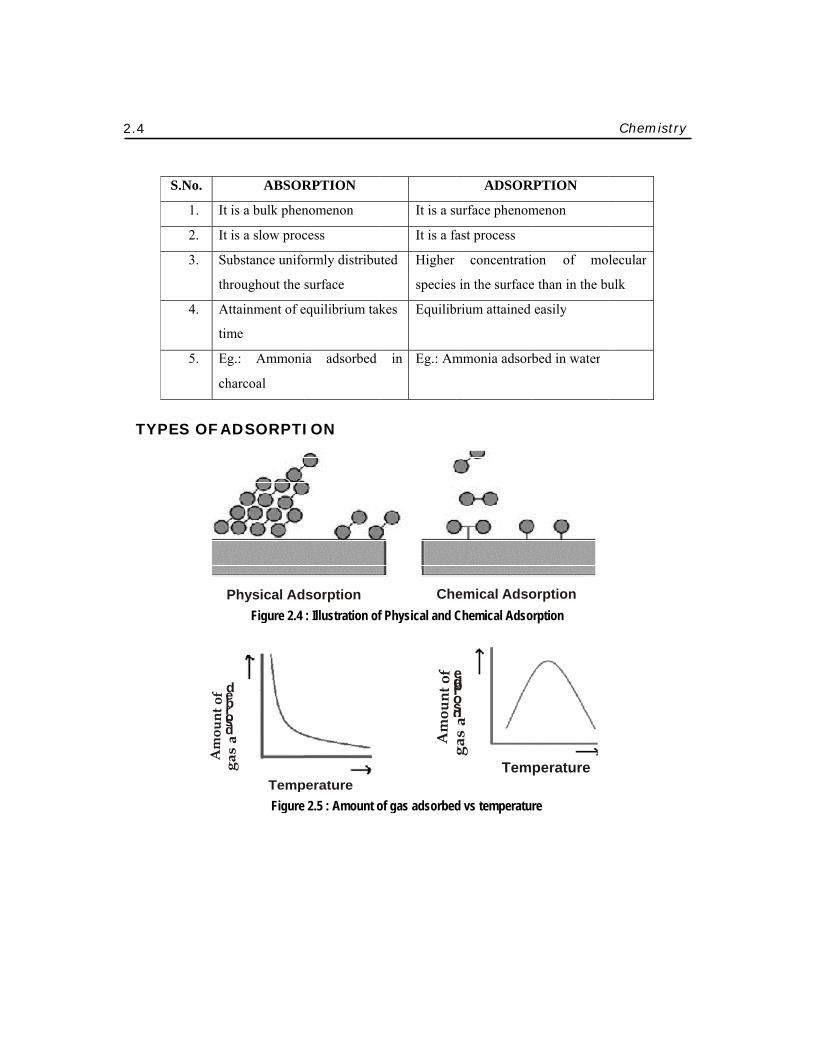
DIFFERENCE BETWEEN ADSORPTION AND ABSORPTION
Figure 2.3 : Illustration of Absorption and Adsorption
Adsorbant
Chemisorption Physisorption
Absorption Adsorption
2.4
TY
debrosd
S.No.
1. It
2. It
3. Su
th
4. A
tim
5. Eg
ch
YPES OF A
P
d e b r o s d
ABSOR
is a bulk phen
is a slow proc
ubstance unifo
hroughout the
Attainment of e
me
g.: Ammoni
harcoal
ADSORPTI
Physical AdFigure 2.4
TempFigure
RPTION
nomenon
cess
ormly distribu
surface
equilibrium tak
ia adsorbed
ION
dsorption : Illustration of
perature 2.5 : Amount o
ebdrosd
It is a su
It is a fa
uted Higher
species
kes Equilib
in Eg.: Am
Chef Physical and C
of gas adsorbed
e bd r o s d
ADSOR
urface phenom
ast process
concentrati
in the surface
rium attained
mmonia adsorb
emical AdsoChemical Adso
Tem
d vs temperatu
RPTION
menon
on of mo
e than in the bu
easily
bed in water
orption orption
perature
re
Chemistry
lecular
ulk
y
Surf
S.N
Ads
gas a
face Chemis
No
1. Caus
vand
2. Not s
3. Reve
4. Mult
on th
5. Heaa
KJ/m
6. No a
7. Depe
Liqu
easil
8. Occu
9. Incre
adso
orption of
In adsorpadsorbed is c
stry and Cat
Physical ad
Physiso
sed by
derwaal’s force
specific in nat
ersible in natur
timolecular lay
he adsorbed su
at of adsorptio
mole)
activation ener
ends on nature
uefiable gase
y
urs at low temp
ease
rption
in pr
Gases on S
ption of gasesalled adsorb
Solid Surface
F
talysis
dsorption or
orption
es
intermolec
ture
re
yers are forme
urface
on is less (20 to
rgy is required
e of gas. Easily
es are adso
mperature
ressure incr
olids
on solid surfbate. The exte
igure 2.6 : Adso
Chem
cular Caused
Highly
Irrever
ed Unimo
surface
o 40 Heat o
KJ/mo
d High a
y
orbed
Depen
adsorb
Increas
rease High p
pressur
face, the solident of adsorp
orption of gase
mical adsorpt
d by chemical
y specific in na
rsible in nature
olecular layers
e
f adsorption is
ole)
activation ener
ds
bate
on natu
ses with increa
pressure is favo
re does not ca
d surface is caption depends
AbsGas M
es on solids
tion or Chem
bond formati
ature
e
s are formmed
s large (8
rgy is required
ure of adso
ase in tempera
ourable. Decre
ause desorption
alled the adsors on many fac
sorbed Molecules
Solid
2.
misorption
on
d on the
0 to 240
d
orbent and
ature
ease in
n
rbent and thectors.
5
e

2.6 Chemistry
2.2 FACTORS AFFECTING THE EXTENT OF ADSORPTION
(i) Nature of Adsorbent
The adsorption depends on the type of adsorbents used. When the adsorbent is highly porous the rate of adsorption increases. Activated carbon, metal oxides like aluminum oxide, silica gel and clay are commonly used adsorbents. The rate of adsorption can be increased by activation process. It helps in enhancing the pores in the adsorbent Eg. charcoal adsorbs 0.011 gms of CCl4 at 24°C and activated charcoal adsorbs 1.48 gm of at 24°C.
Activation of adsorbent
During activation, the adsorbent is heated in steam to about 1500°C. Heating drives out all impurities and leads to a lager free surface for adsorption. It can be done in 3 given ways
By making the surface of adsorbent rough.
By heating the adsorbent in vacuum so that the water vapour present in pores leave those pores.
By increasing the surface area of adsorbent
(ii) Surface area of adsorbent
Increase in surface area of the adsorbent increases the adsorption of gases and the extent of adsorption depends on two factors
Greater the surface area greater the adsorption-Increase in surface area increases the number of adsorbing sites.
Larger the porosity greater the adsorption-Finely divided and highly porous materials acts as good adsorbents.
Eg. Charcoal and silica gel (excellent adsorbents).
(iii) Nature of Gases
The amount of gas adsorbed by a solid depends on the nature of the gas. Easily liquefiable gases like HI, NH3, CI2, SO2 etc., are adsorbed more easily then the permanent gases like H2, N2, and O2 etc. Physical adsorption is non-specific in nature, so any gas will be adsorbed on the surface under any given conditions of temperature and pressure. Chemisorption is specific in nature so only those gases which forms chemical bonds will be adsorbed.
Surface Chemistry and Catalysis 2.7
The nature of gas depends on two factors:
Critical Temperature (maximum temperature above which the gas cannot be
liquefied). Liquefactions of gases depend on critical temperature. When the critical
temperature is more the gases will be liquefied and more adsorption occurs.
Van der Waal’s forces: Easily liquefiable gases possess greater Vander Waal’s forces
than permanent gases, so they are adsorbed more readily.
(iv) Exothermic Nature
Heat of adsorption is defined as the energy liberated when 1 g mol of a gas is adsorbed on a solid surface. Increase in temperature increases the kinetic energy of the gas molecules and it results in more number of collisions of gas molecules over the adsorbent surface.
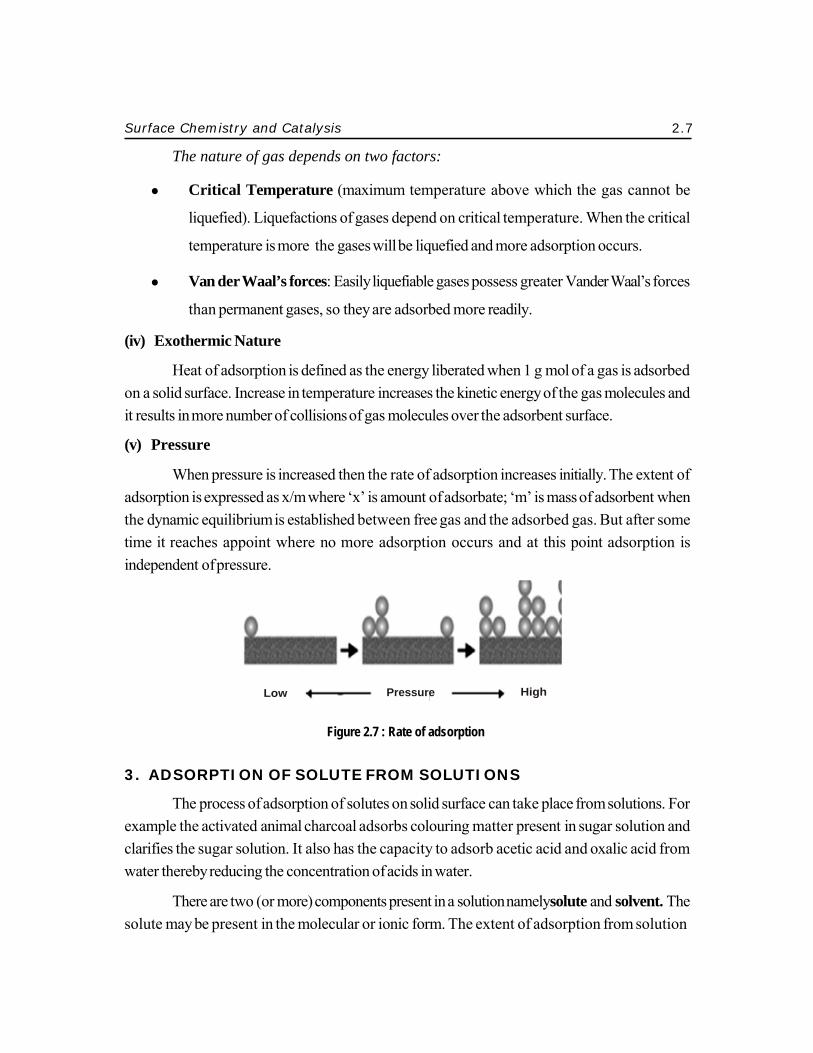
(v) Pressure
When pressure is increased then the rate of adsorption increases initially. The extent of adsorption is expressed as x/m where ‘x’ is amount of adsorbate; ‘m’ is mass of adsorbent when the dynamic equilibrium is established between free gas and the adsorbed gas. But after some time it reaches appoint where no more adsorption occurs and at this point adsorption is independent of pressure.
Figure 2.7 : Rate of adsorption
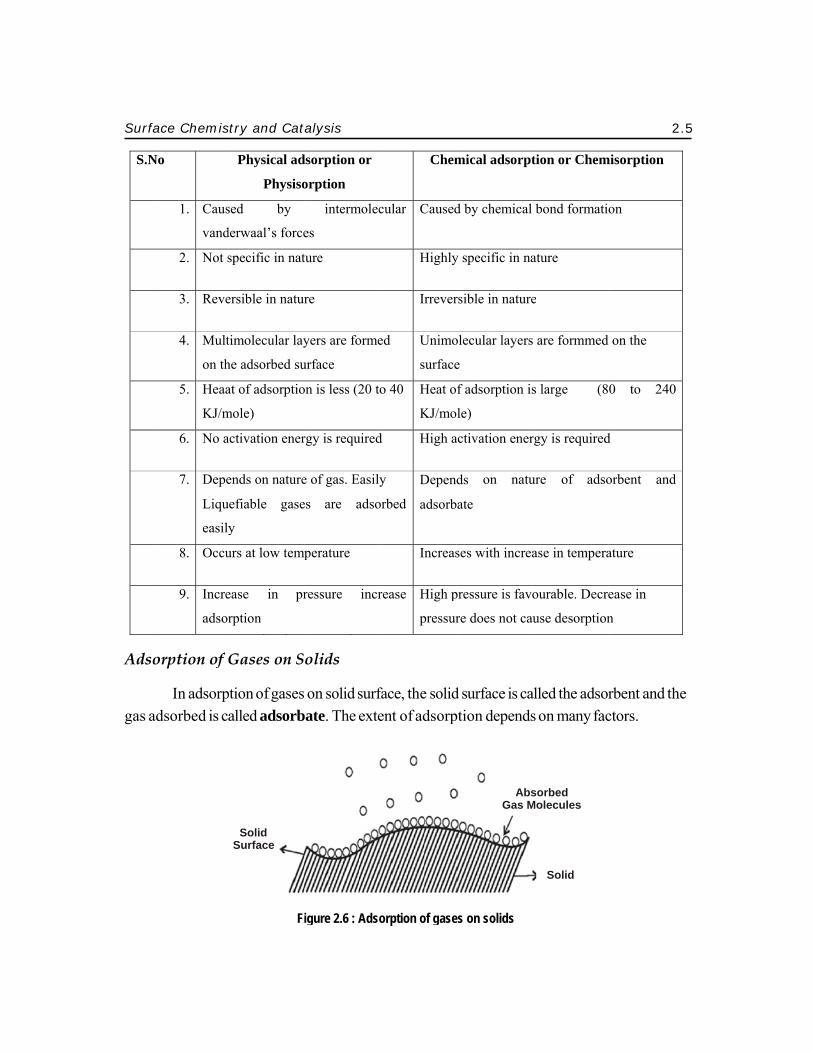
3. ADSORPTION OF SOLUTE FROM SOLUTIONS
The process of adsorption of solutes on solid surface can take place from solutions. For example the activated animal charcoal adsorbs colouring matter present in sugar solution and clarifies the sugar solution. It also has the capacity to adsorb acetic acid and oxalic acid from water thereby reducing the concentration of acids in water.
There are two (or more) components present in a solution namelysolute and solvent. The solute may be present in the molecular or ionic form. The extent of adsorption from solution
Low Pressure High
2.8 Chemistry
depends upon the concentration of the solute in the solution, and can be expressed by the Freundlich Isotherm.
(or)
x = k ⋅c(1⋅n) m
log x = log k + 1 log C
m n
where, x- is the mass of the solute adsorbed,
m -is the mass of the solid adsorbent,
c -is the concentration of the solute in the solution &
n -is a constant having value greater than one,
k -is the proportionality constant.
The value of k depends upon the nature of solid, its particle size, temperature, and the nature of solute and solvent etc. It the graph is plot between x/m against c which gives a straight line which is similar to Freundlich adsorption isotherm.
FACTORS AFFECTING ADSORPTION OF SOLUTES FROM
SOLUTION
Nature of adsorbent
Adsorption ofsolute from solution is highly specific. Adsorption depends mainly on nature of adsorbent.
Temperature
Adsorption from solution decreases with rise in temperature.
Concentration of solute
Adsorption from solution decrease with decrease in concentration of solution.eg charcoal adsorbs water from dilute KCl solution whereas charcoal adsorbs KCl from concentrated KCl solution.
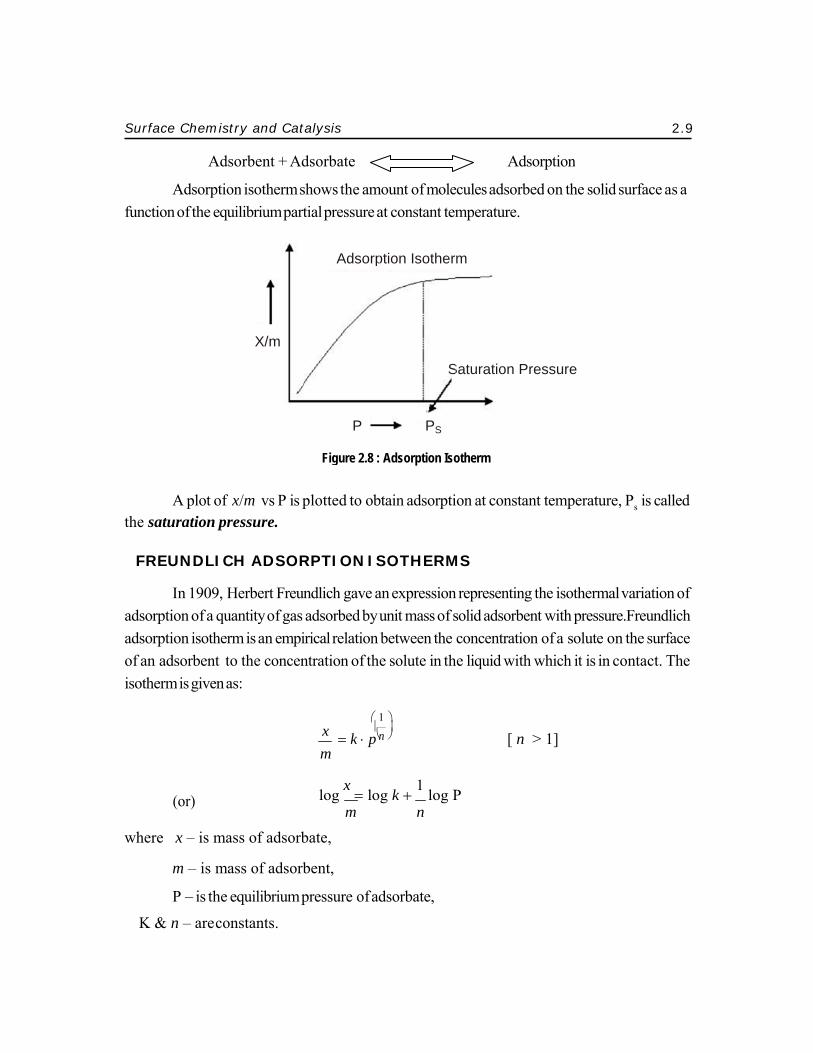
4. ADSORPTION ISOTHERM
The process of adsorption is usuallystudied through graphs know as adsorption isotherm. It is the graph between the amounts of adsorbate (x) adsorbed on the surface of adsorbent (m) and pressure (P) at constant temperature.
Surf
funct
the s
FR
adsoadsoof anisoth
wher
K
face Chemis
Ad
Adsorptiotion of the equ
A plot of saturation pr
REUNDLIC
In 1909, Horption of a quorption isothern adsorbent therm is given a
(or)
re x – is ma
m – is ma
P – is the
& n – are co
stry and Cat
sorbent + Ad
on isotherm suilibrium part
X/m
f x/m vs P is pressure.
CH ADSOR
Herbert Freunuantity of gas rm is an empito the concenas:
ass of adsorb
ass of adsorb
equilibrium p
onstants.
talysis
n
dsorbate
shows the amtial pressure a
Adsorp
P
Figure 2.8 :
plotted to ob
RPTION IS
ndlich gave aadsorbed by u
irical relationntration of the
⎛ 1⎜
= k ⋅ p⎝
m
log x = lo
m
bate,
bent,
pressure of ad
x n
mount of moleat constant tem
ption Isotherm
S
PS
Adsorption Iso
btain adsorpti
SOTHERM
an expressionunit mass of sbetween the e solute in th
1 ⎞ ⎟
⎝ ⎠
g k + 1 log Pn
dsorbate,
Ads
cules adsorbemperature.
m
Saturation Pr
otherm
on at constan
MS
representingsolid adsorbenconcentratione liquid with
[ n
P
orption
ed on the soli
ressure
nt temperatur
the isothermnt with pressun of a solute owhich it is in
> 1]
2.
d surface as a
re, Ps is called
mal variation oure.Freundlichon the surface
n contact. The
9
a
d
f h e e
2.10 Chemistry
n
n
At low pressure, extent of adsorption is directly proportional to pressure:
x ∝ p1
m
At high pressure, extent of adsorption is independent of pressure:
x ∝ p0
m
At intermediate value of pressure, adsorption is directly proportional to pressure raised
to power 1 ⋅ n value is greater than 1.
n
x ∝ p(1/ n) m
To remove proportionality a proportionality constant ‘k’ is used which is known as adsorption constant and we get
⎛ 1 ⎞ ⎜ ⎟
= k ⋅ p⎝ ⎠ m
The above equation is known as Freundlich Adsorption equation.
Plotting of Freundlich Adsorption Isotherm
⎛ 1 ⎞ ⎜ ⎟
= k ⋅ p⎝ ⎠ m
Taking log both sides of equation, we get,
log x = log k + 1 log P
m n
The equation is comparable with equation of straight line, y = m x + c where, m represents slope of the line and c represents intercept on y axis. Plotting a graph between log (x/m) and log p, we will get a straight line with value of slope equal to 1/n and log k as y-axis intercept.
x
x

Surface Chemistry and Catalysis 2.11
log
Figure 2.9 : log (x/m) vs. log p graph
Limitation of Freundlich Adsorption Isotherm
1. Freundlich equation is purely empirical and has no theoretical basis.
2. The equation is valid only upto a certain pressure and invalid at higher pressure.
3. The constants k and n are not temperature independent, they vary with temperature.
4. Frendilich’s adsorption isotherm fails when the concentration of the adsorbate is very high.
LANGMUIR ADSORPTION ISOTHERM
In 1916, Irving Langmuir proposed another adsorption Isotherm which explained the variation of adsorption with pressure
layer
Figure 2.10 : Equilibrium between tree molecule and adsorbed molecules
195 K
X m
244 K273 K
P
bQ
X m
a1
Slope = nlog K (intercepted)
log p
A
AB A1
st
Surface Surface

2.12 Chemistry
Assumptions of Langmuir Isotherm
Langmuir proposed his theory by making following assumptions.
(i) Surface is energeticallyuniform. Fixed number ofvacant or adsorption sites are available on the surface of the solid.
(ii) All the vacant sites are of equal size and shape on the surface of adsorbent.
Each site can hold maximum of one gaseous molecule and a constant amount of heat energy is released.
(iii) Heat of adsorption is constant throughout the surface and it ranges from 0 to 1.
(iv) Dynamic equilibrium exists between adsorbed gaseous molecules and the free gaseous molecules.
(v) Adsorption is monolayer or unilayer.
Derivation
Langmuir Equation depicts the relationship between the extent of adsorption and pressure. Langmuir proposed that dynamic equilibrium exists between adsorbed gaseous molecules and the free gaseous molecules. Using the equilibrium equation, equilibrium constant can be calculated.
A(g)+B(s) Adsorption
AB Desorption
where A(g ) − is unadsorbed gaseous molecule
B(s) − is unoccupied metal surface and
AB − is adsorbed gaseous molecule
According to Kinetic theory,
Rate of forward reaction = Ka [A] [B]
Rate of backward reaction = Kd [AB]
At equilibrium, Rate of forward reaction is equal to Rate of backward reaction
Ka [A] [B] = Kd [AB]
A new parameter ‘θ’ is introduced.

Surface Chemistry and Catalysis 2.13
Let θ be the number of sites of the surface which are covered with gaseous molecule and (1–è) be the fraction of surface unoccupied by gaseous molecule. Rate of forward direction depends upon two factors, number of sites available on the surface of adsorbent, (1 – θ) and pressure, P.
Rate of forward reaction ∝ P (1 − θ)
Rate of adsorption ∝ P (1 − θ) or
Rate of adsorption = Ka P (1 − θ)
Rate of backward reaction or rate of desorption depends upon number of sites occupied by the gaseous molecules on the surface of adsorbent.
Rate of desorption ∝ θ (or)
Rate of desorption = Kd θ
At equilibrium, rate of adsorption is equal to rate of desorption.
Ka P (1 − θ) = Kd θ
The above equation can be written in terms θ.
Ka P − Ka Pθ = Kd θ
Ka P = Ka Pθ + Kd θ
Ka P = ( Kd + Ka P)θ
θ = Ka P (Kd + Ka P)
Divide numerator and denominator on RHS by Kd , we get
Ka P
θ =
But K = Ka
Kd
Kd
Kd + Ka P Kd Kd

2.14 Chemistry
KP
Substituting in the above equation we get
θ = 1 + KP
This is known as Langmuir Adsorption Equation.
Alternate form of Langmuir Adsorption Equation
Langmuir adsorption equation can be written in an alternate form in terms of volume of gas adsorbed. Let V be volume of gas adsorbed under given sets of conditions of temperature and pressure and Vmono be the adsorbed volume of gas at high pressure conditions so as to cover the surface with a unilayer of gaseous molecule.
θ = V Vmono
Substituting the value of θ in Langmuir equation
V Vmono
KP
1 + kP
(or) Vmono =1+ 1
kP
in terms of pressure P we get, Langmuir Adsorption Equation in alternate form.
Thus, if we plot a graph between P/V vs P, we will obtain a straight line with Slope = 1/Vmono and intercept =1/ KVmono.
Limitations of Langmuir Adsorption Equation
(i) The adsorbed gas has to behave ideally in the vapour phase. Langmuir equation is valid under low pressure only.
(ii) Langmuir Equation assumes that adsorption is monolayer. But, monolayer formation is possible only under low pressure condition. Under high pressure condition the assumption breaks down as gas molecules attract more and more molecules towards each other.
(iii) Another assumption is the surface of solid is homogeneous but in real solid surfaces is heterogeneous.
=

Surf
(
(
5.
catal
(
(
(
(
(
face Chemis
(iv) Langmimposs
(v) In adsobut the
CONTACTCATALYS
This theolysis. Heterog
(i) Diffuscatalysthat inc
(ii) Adsorthe suris know
(iii) Reactireactin
(iv) Desorpwhich
(v) Diffus
final pr
stry and Cat
muir equationsible as weak
orption liquefae value is not z
T THEORYSIS (OR) Aory postulategeneous catal
Figure
ion of Reactsts. Some of thcludes paths a
rption of rearface of the cawn as the Stic
ion: The reang with each o
ption of prodagain become
ion of Produ
roducts and th
talysis
n assumed thak force of attra
action of gasezero.
Y (OR) MEADSORPT
ed by Faradalysis has five
e 2.11 : Mechani
tant(s) to thehe reactant crand cracks on
actants: Bonatalyst. The acking Co-effic
actants, whenother, and afte
ducts: The intes available fo
uct(s): The in
he products a
at moleculesaction exists
s taking place
CHANISMTION THEOay in 1883. It
steps.
ism of heteroge
e Surface: Thross the barrien the external
nds are formeability for an acient.
n bound to ther the reaction
termediate comfor adsorption
ntermediate co
are then deso
do not interaeven between
e, which result
M OF HETEORY t explains the
eneous catalys
he reactants der and enter thl surface.
ed as the reacatom or mole
he surface han, they forman
mpound getsn for other mo
ompound the
orbed from th
act with eachn molecules o
ts in decrease i
EROGENE
e action of h
is
diffuse to the he interior exp
ctant(s) are aecule to stick t
ave a higher pn intermediat
s desorbed froolecules
en disintegrate
he surface of t
2.1
h other. This isof same type.
in randomnes
OUS
eterogeneou
surface of thexposed surface
dsorbed ontoto the surface
probability ote compound.
omthe surface
es to form the
the catalyst.
5
s
s
us
e e
o e
f .
e,
e

2.16
For e
1. C
2. H
expe
follow
6
example,
Conversion o
Ni
Haber–Bosc
The origiensive iron-b
The reactwing steps:
1. N
2. N
3. H
of ethylene
surface
Ethylesurface
Figu
ch reaction
inal Haber–Bbased catalys
tion mechanis
N2 (g) → N2 (
N2 (adsorbed)
H2 (g) → H2 (
to ethane
Ethylene
ene absorbed oe breaking π bo
ure 2.12 : Conv
Bosch reactist, which is s
N2 ( g) + 3
sm, involving
(adsorbed)
) → 2 N (ads
(adsorbed)
A ( g ) + B ( s )
N 2 ( g ) + 3 H 2 ( g ) ⎯ ⎯ → 2 N 3 ( g ) →
A ( g )
B ( g ) A ( a d s ) + B ( a d s ) ⎯ r ⎯ d s → A B ( a
k θ θ A B
θ = b ⋅ P
on nds
ersion of ethyle
ion chamberstill used tod
H2 ( g) ⎯⎯→
the heterogen
sorbed)
← ⎯ → A ( a d s )
← ⎯ → B ( a d s )
d s ) ⎯ f ⎯ a s t ⎯ → A B ( g )
ene to ethane
s used osmiuday.
⎯→ 2 NH3 (g)
neous catalys
um as the ca
st, is believed t
Chemistry
atalyst, less
to involve the
y
e

Surface Chemistry and Catalysis 2.17
4. H2 (adsorbed) → 2 H (adsorbed)
5. N (adsorbed) + 3 H (adsorbed) → NH3 (adsorbed)
6. NH3 (adsorbed) → NH3 (g)
6. KINETICS OF SURFACE REACTION
The kinetics of heterogeneously-catalyzed reactions might vary with the partial pressures of the reactant gases above the catalyst surface which can be predicted by using the Langmuir isotherm.
6.1 KINETICS OF UNIMOLECULAR DECOMPOSITION
Examples of unimolecular decomposition
1. Decomposition of NH3 to N2 and H2 on metal surfaces,
2. Decomposition of Phosphine on glass,
3. Decomposition of Formic acid on glass, Pt, Ag, Au, or TiO2.
Consider the surface decomposition of a molecule A , i.e. the process
A(g) ⎯⎯→ A (adsorbed) ⎯⎯→ Pr oduct
Assumption
1. The decomposition reaction occurs uniformly across the surface sites. Molecule ‘A’ may be
adsorbed and is not restricted to a limited number of specific sites.
2. The products are very weakly bound to the surface and, they can be easily deformed.
3. The rate determining step is the surface decomposition step.
According to Langmuir adsorption isotherm molecule ‘A’ adsorbed on the surface is in equilibrium with the gas phase and the surface concentration is represented as:
θ = b ⋅ P (1+ b ⋅ P)

2.18 Chemistry
k
The rate of the surface decomposition is given by an expression :
Rate = k θ
Substituting, θ , in the rate expression we get:
Rate = k b P
(1+ b P)
The reaction is expressed within two limits:
a. Low pressure limit: b ⋅ P <<1(First order reaction with a first order constant k ′= k ⋅b )
Rate = k ′⋅ P (1+ bP)
Rate = K′⋅ P + K′ b
K′
So Rate k ⋅b ⋅ P as b is constant.
Under low pressure ‘è’ is very small and rate is directly proportional to pressure
b. High pressure limit: b ⋅ P >>1 (Zero order reaction)
Rate
Rate
= k ⋅b ⋅ P (1+ bP)
= (1+ bP)
Therefore
(1 + b ⋅ P) ~ b⋅ P and Rate ~ k
Under high pressure θ is almost unity.

Surface Chemistry and Catalysis 2.19
Rate ~ k (zero order)
Rate
Rate ~ kbP (first order)
Figure 2.13 : Graphical representation of unimolecular surface decomposition
6.2 KINETICS OF BIMOLECULAR REACTION (Langmuir-Hinshelwood)
Between molecular adsorbates.
Consider the reaction:
Assumption:
A(g ) ←⎯→ A(ads)
B( g ) ←⎯→ B(ads)
A(ads) + B(ads) ⎯r⎯ds→ AB(ads) ⎯f⎯ast⎯→ AB(g)
The surface reaction between the two adsorbed species is the rate determining step. The rate of the reaction of the two adsorbed molecules for biomolecular surface will be given by:
Rate = k θA θB
According to Langmuir adsorption isotherm:
θ = b⋅ P (1+ b ⋅ P)
where two molecules (A & B) are competing for the same adsorption sites then
θA = bA PA
1+ bA PA + bB PB
and θB =
bBPB
1+ bA PA + bB PB
Substituting these into the rate expression gives:
Rate = k θ θ = k bA PA ⋅bB PB A B (1+ b P + b P )2
A A B B

2.20 Chemistry
(b P )
Condition
1. Reactant Aand B in first order then
bA PA <<1 and bB PB <<1
θA & θB are very low.
Hence, Rate → k bA PA bB PB = k ′PA PB
2. First order in A, but negative first order in B then
bA PA <<1<< bB PB
θA → 0, θB →1 so Rate =
k bA PA
B B = k ′PA
PB
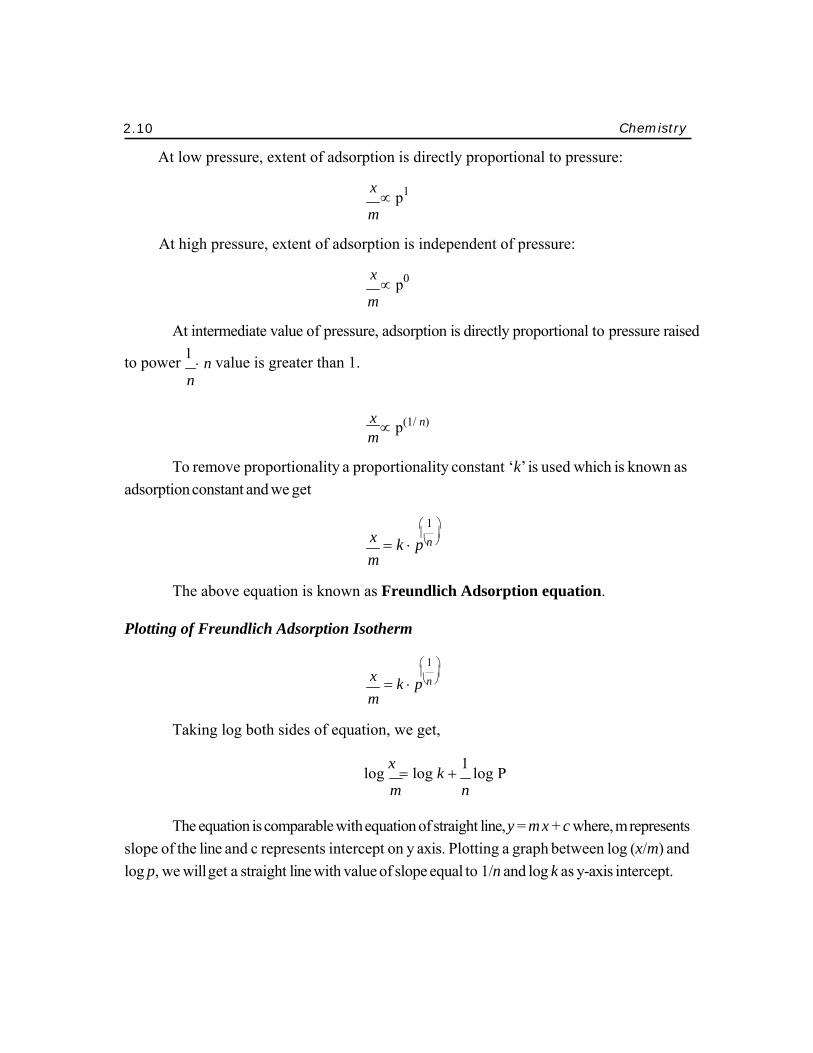
7. TYPES OF ADSORPTION ISOTHERM
Adsorption process is usually studied through graphs known as adsorption isotherm. After saturation pressure Ps, adsorption does not occur anymore, as there are limited numbers of vacancies on the surface of the adsorbent. At high pressure when all the sites are occupied and further increase in pressure does not cause any difference in adsorption process. At high pressure, adsorption is independent of pressure. There are 5 different types of adsorption isotherms and each of them has specific characteristics.
Figure 2.14 : Illustration of different types of Adsorption Isotherm
Monolayer
I
III II
Multilayer
IVV
Condensation in pores/capillaries

Surface Chemistry and Catalysis 2.21
2
Type I Adsorption isotherm is for very small pores or microporous adsorbents. Adsorption occurs by filling of micropores and it mainly depicts Monolayer adsorption.
Eg. Adsorption of Nitrogen or Hydrogen on charcoal around −1800°C.
Figure 2.15 : Type I
Type IIAdsorption isotherm shows large deviation from Langmuir modelof adsorption. They are most frequently encountered when adsorption occurs on nonporous powders or macroporous adsorbents with unrestricted monolayer -multilayer adsorption.
The intermediate flat region in the isoth2H K2 (Cg )Ol 3+ H⎯ 2⎯Mn e(gO(o2 )⎯→⎯S) 2⎯→ 2KC Hl (+3 3Og ) rm corresponds to monolayer formation. When 3r37 oo0m Cte mp. 2
H 2 + O 2 ⎯ ⎯ ⎯ ⎯ → N o r ea ct io n 2 H 2 + O ⎯2 ⎯Ptb ⎯lac →k 2 H2 O
R C O O R ′+ H O2 ⎯⎯ → R C OO H + R O′ H ( C H6 10 O 5) n + Hn 2 O ⎯ ⎯→ n C1 H2 2 O2 11
2 C H O + Hn O ⎯ ⎯→ n C H O ( 6 10 5 )n 2 12 2 2 11
n C H12 2 O2 11 + n H O2 ⎯ ⎯ → n C H12 2 O2 11 V = V m a [S x ] [ E S ] = K [ E ] [ x S] 0 K +m [ S] 1 (K 2 + K )3
[ E t ] [x S] { [E ] [x S] } [ ES ] = ( K 2+ K 3 )/ K [1 E S] = ([ S] + K m
X [S ] ( V )= V m a x [ S ]+ K
mV ax [S ] 1 ( V )= [ S] + [S ]= 2 V m ax
1 K [ S] R a te (v )= V m [S ]+ V [ S ]
m ax m ax [ ES ] = [{ Et ]x [S ] /([ S ]+ K m }
[{ E t][ S ]} [ ES ] = K
1+ [S ] /K m K m = ( K 2 + K )3
K 1 [ ES ] = [E ] [S ]/ K m
+ C 2 H C5 l ⎯ ⎯A Cl ⎯→l3 C H6 C5 2 H +5 H C l R C O O R + H O ⎯ ⎯H+ ⎯or ⎯OH →− R CO O H + R O′ H
est er 2 2 K M n O + 4 5 H C 2 O2 4 + 3 H 2 S O 4 ⎯ ⎯→ 2 Mc a S n t a ly Os t 4 + K S 2 O 4+ 8 H O2 + 1 0 C O 2
lA2 3O
C 2 H5 O H ⎯ ⎯ ⎯ → C H 2 et =hen CΗe 2 + ΗO2
S O 2 + O 2 ⎯ ⎯P t → 2 S O 3
A OFes2 3 N 2 + 3 H 2 ⎯ ⎯2HS → 2N H 3
/ /// / 2 H 2 + O 2 ⎯ ⎯ tP → 2 H O2 CO the monolayer formation of the adsorbed molec
CC 2 HH5 O OH ⎯ + H⎯ →⎯ C H⎯H+ C→3eth HCano OHl + HO 2
u+ C H O
les are complete, multilayer formation starts to
c1a2 ne sug22 ar1 1 2 6g 1luco 2se 6 6 fruc 12tos 6e
C H C3 O O C H2 5 ⎯ ⎯+H → C H C3 O O H + C2 H O5 H et hyl ace tat e or OH − ac eti c ac i d etha nol
2 N a S2 O 3+ O 2 ⎯ ⎯A lcoh ⎯→ol 2 N a S2 O 4 4 N O + 4 N H + Ο ⎯ ⎯→ 4 N + 6 H O
3 2 2 2 2 N O 2 4+ N H 3 + Ο 2 ⎯ ⎯→ 3 N +2 6 H O 2
+ N H 2 N O 2 ⎯⎯H → N O2 + H O2
N H 2 N O 2 + O H − ⎯ ⎯→ H O2 + N H N O 2− C Int o em rm pl e edi x at e
N H N O 2− ⎯ ⎯→ N 2 O + O H − Fe
Mo 2 N H 3 2 A s H3 ⎯ ⎯→ 2 As + 3H 2
ca t aly st
take place corresponding to the ‘sharp knee’ of the isotherms.
Eg: Iron (Fe) catalyst and Nitrogen (N (g)) adsorbed at −1950°C on silica gel.f
Figure 2.16 : Type II
Type III Adsorption Isotherm also shows large deviation from Langmuir model. This isotherm explains the formation of multilayer. They are characterized principally by heats of adsorption which are less than the adsorbate heat of liquefaction.
X m
Ps
P
X m
PPs

2.22 Chemistry
Eg: Bromine (Br2) at 790°C on silica gel or Iodine (I2) at 790°C on silica gel.

Surface Chemistry and Catalysis 2.23
Figure 2.17 : Type III
Type IV Adsorption Isotherm occur on porous adsorbents possessing pores in the range of approximately 15-1000 angstroms (A). At lower pressure region of graph is quite similar to Type II. This explains formation of monolayer followed by multilayer.
The intermediate flat region in the isotherm corresponds to monolayer formation.
The saturation level reaches at a pressure below the saturation vapor pressure. This can be explained on the basis of a possibility of gases getting condensed in the tiny capillary pores of adsorbent at pressure below the saturation pressure (PS) of the gas.
Eg. Adsorption of Benzene on Iron Oxide (Fe2O3) at 500°C and adsorption of Benzene on silica gel at 500°C.
Figure 2.18 : Type IV
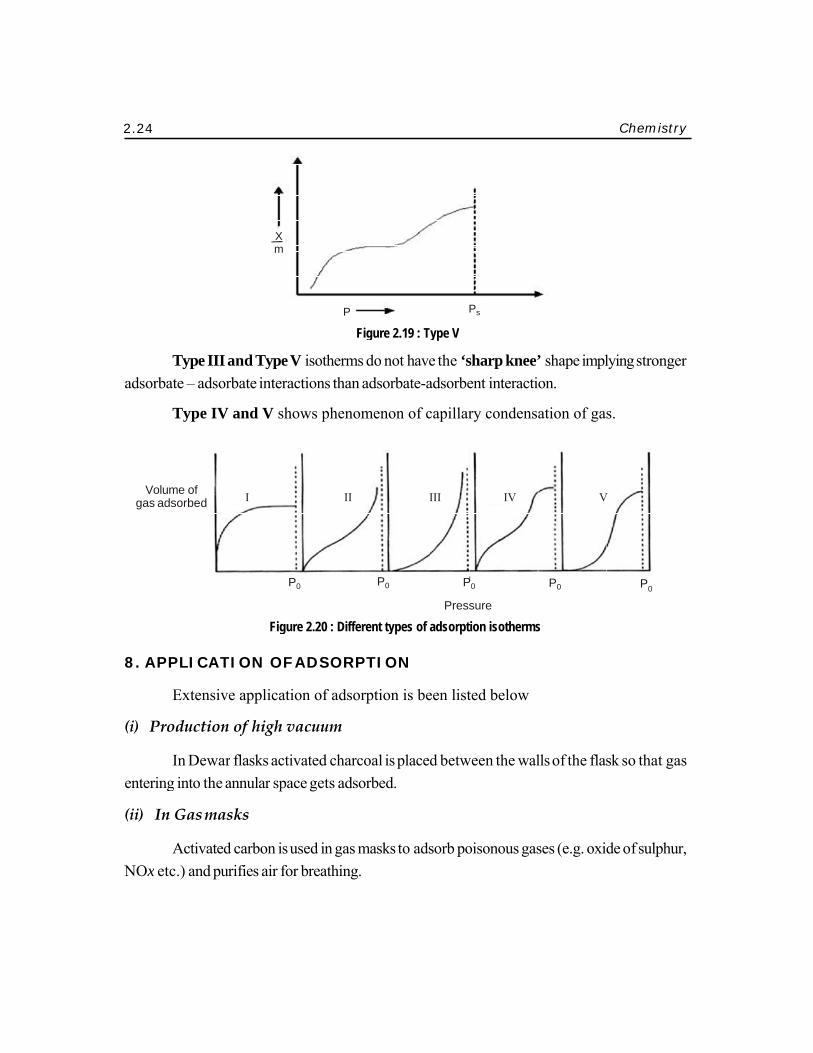
Type V Adsorption Isotherm results from small adsorbate-adsorbent interaction potentials similar to the Type III isotherms. However, Type V isotherms are also associated with pores in the same range as those of the Type IV isotherms.
Eg: Adsorption of Water (vapors) at 1000°C on charcoal.
X m
P Ps
X m
P Ps
2.24
adso
Vgas
8. A
(i) P
enter
(ii)
NOx
4
Type III aorbate – adsor
Type IV
Volume of s adsorbed
APPLICAT
Extensiv
Production
In Dewarring into the a
In Gas mas
Activatedx etc.) and pu
and Type V rbate interact
V and V show
I
P0
Figure
TION OF A
e application
n of high va
r flasks activaannular space
sks
d carbon is useurifies air for b
X m
Figur
isotherms dotions than ads
ws phenome
II
P
2.20 : Different
ADSORPTI
n of adsorpti
cuum
ated charcoale gets adsorbe
ed in gas masbreathing.
P
re 2.19 : Type V
o not have thesorbate-adsor
non of capil
III
P0
Pr
t types of adsor
ION
ion is been l
l is placed beted.
sks to adsorb
V
e ‘sharp kneerbent interact
lary condens
IV
P0
essure
rption isotherm
isted below
tween the wa
poisonous ga
Ps
e’ shape implytion.
sation of gas
V
P0
ms
alls of the flas
ases (e.g. oxid
Chemistry
lying stronger
s.
P0
sk so that gas
de of sulphur,
y
r
s
,

Surface Chemistry and Catalysis 2.25
Figure 2.21 : Adsorption of poisonous gases using activated charcoal
(iii) In desiccation or dehumidification
Certain substances can be used to remove water vapour or moisture present in the air. Silica gel and alumina are used for dehumidification in electronic equipment.
(iv) In clarification of sugar
Sugar is decolorized bytreating sugar solution with animalcharcoalpowder which removes the colour producing substances.
(v) In paint industry
The paint should not contain dissolved gases as it inhibits the adherence capacity of paint to the surface to be coated. The dissolved gases are therefore, removed by suitable adsorbents. This is done by adding suitable liquids which adsorbs these films. Such liquids are called wetting agents. Eg. Use of spirit as wetting agent in furniture painting..
(vi) Adsorption chromatography
Analytical method, in which molecules are separated according to their adsorptive properties, where a mobile fluid phase is passed over an immobile solid adsorptive stationary phase.
(vii) In adsorption indicators
Various dyes which possess adsorption property have been introduced as indicators mainly in precipitation titrations. For example KBr is titrated with AgNO3 using eosin as an indicator
gas molecules
Activated Charcoal

2.26 Chemistry
(viii) Heterogeneous Catalysis
In heterogeneous catalytic reactions adsorption of gaseous reactants on solid catalyst occurs. The adsorption mechanism is responsible for the greater efficiency of the catalyst in the finely divided state and helps us to understand the action of catalyst promoters and poisons. eg,
1. Finely powdered nickel is used for the hydrogenation of oils.
2. In manufacture of sulphuric acid finely divided vanadium pentaoxide (V2O5) is used in the
contact process.
(i) diffusion of reactants to surface; (ii) adsorption of reactants to surface; (iii) reaction on the surface; (iv) desorption of products from surface; (v) diffusion of products away from the
surface.
Figure 2.22 : Process of Heterogeneous Catalysis
(ix) In adsorption indicators
In many precipitation titrations many dyes are used as indicators which work on the principle of adsorption.
(x) In curing diseases
Some pharmaceutical drugs have the capacity to adsorb the germs on them and kill them and protect us from diseases.
(xi) Lake test for aluminium
It is based on adsorption of litmus paper byAl(OH)3 precipitate
diffusion
adsorption
reaction
diffusion

Surface Chemistry and Catalysis 2.27
(xii) Separation of inert gases
Due to the difference in degree of adsorption of gases by charcoal, a mixture of inert gases can be separated by adsorption on coconut charcoal at different low temperatures.
(xiii) In softening of hard water
The use of ion exchangers for softening of hard water is based upon the principle of adsorption chromatography. The ion exchange resins helps to remove hardness causing ions from water and make it useful for industrial and domestic applications.
(xiv) Arsenic Poisoning
Colloidal ferric hydroxide is administered which adsorbs arsenic and removes it from body by vomiting
(xv) Formation of stable emulsions in cosmetics and syrups etc.
(xvi) Froth floatation method
Used for concentration of sulphide ores is based on adsorption.
(xvii) In cleaning action of soaps and detergents
Figure 2.23 : Cleaning actions of soaps and detergents
Fat or Oil Stain Add Surfactant
Adsorbed Surfactant lowers the interfacial tension between the fabric and the stain
fabric substrate fabric substrate
Mechanical agitation
fabric substrate
Stain does not desorb spontaneously
Mechanical agitation
Fat or Oil Globule
Fat or Oil Globule
fabric substrate Clean Fabric + adsorbed surfactant prevents re-adsorption of fat globule
fabric substrate
2.28 Chemistry
(xviii) Application of adsorbents on pollution abatement
o Many pollutants, both natural and synthetic, are gaseous in nature and it need to be effectively removed from the exhaust.
o Gaseous industrial pollutants include HCl, H2SO4, H2S, SOx, NOx, NH3, Ethylene, Benzene, Ethanol, and HAP’s. Adsorption is a mass transfer process in which a porous solid comes in contact with a liquid or gaseous stream to selectively remove pollutants or contaminates by adsorbing them onto the solid.
o The most common adsorbents used in industry are activated carbon, silica gel, activated alumina (alumina oxide), and zeolite. Activated carbon is the most common non-polar adsorbent. Polar adsorbents have a great attraction to absorb moisture.
o Most industrial exhaust streams contain moisture the use of polar adsorbents is significantly limited for air pollution control systems. There are two main types of adsorption systems; fixed bed or continuous.
[1] Fixed Bed or Packed Bed Systems
These are quite simple devices. The fixed bed or packed bed reactors are most commonly used for study of solid catalyst. Afixed bed reactor usually consists of a cylindrical vessel packed with the adsorbent material (eg. activated carbon) and it contains more surface area for adsorption. The contaminated or the polluted air enters the fixed bed system at the side, where there is an exhaust distributor. The exhausted air exits the fixed bed adsorber clean of pollutants or contaminates. Once the adsorbent is fully saturated with adsorbate the system requires change- out of the spent materials, which is then packed with new adsorbent material. The spent adsorbent will be thermally cleaned.
Advantages
1. Ideal plug flow behavior
2. Lower maintenance cost
Disadvantage
1. Plugging of bed due to coke deposition which results in high pressure drop.

Surf
[2]
compadsoadso
face Chemis
ScruTo
ChlorineLaden Gas
Continuou
Continuoplex and prov
orbates from orbate can be
stry and Cat
reacta
Vent gas
bbing ower
C
e
Figure 2.2
s Flow Reac
ous-flow reacvide continuothe adsorben
e condensed,
talysis
nts
Figure 2.24 : F
Recirculating Caustic Liquor
Cooler
Recirculating Pump
5 : Schematic r
ctor Systems
ctors are almoous operationnt. This can bcollected, an
unr
ixed Bed React
Caustic Ma
Blowdown Stream and
Optional Preheater
representation
s
ost always opns. These sysbe done withnd re-used in
products and reacted materiato separation
catalyst on support
diffuser
tor Device
ake-up
“End of PipeFixed Bed Reac
d
of fixed bed rea
perated at stestems providh superheatedn the process
als
e” ctor
LEf(to
or re
actor
eady state. Thde in-situ desod or saturates. There are t
2.2
iquid ffluent o drain ecycle)
hese are moreorption of thed steam. Thetwo adsorber
29
e e e r

2.30
unitswithbene
[3]
flowzeoli
A cataitself rcalled
3.1
Jakoof suand c
that econv
3.1
cons
0
s in the systemh steam. The eficial purpose
Special Typ
A hydropws. An integraite. They have
alyst is defiremaining c
d catalysis.
INTRODU
The wordb Berzelius (1
ubstances, discreated the pr
Catalysts expedite the b
version of star
.1 DEFIN
The procsumed or alte
m. The gases exhaust frome.
Input
pe of Continu
phobic zeoliteated thermal e wide accept
ned as a suchemically u
UCTION
d “catalyst” w1779-1848) wcovered severesent system
are of immenbiochemical rrch to glucose
ITION
cess by whicered in the p
are being adsm the desorbe
Stirre
t Rate
Figure 2.26 : Co
uous System
e is designedoxidizer is u
tance in indus
CHAPTE
ubstance wunchanged
was introducwho also determeral elements im of writing ch
nse importancreactions nece.
ch a substancprocess.
sorbed in oneed bed can be
r
Ou
ontinuous Flow
m (Zeolite Con
in a monolithsed to providstrial air pollu
ER 3: Catawhich alters
at the end
ced into scienrmined the atoincluding selehemical symb
ce in chemistrcessary for lif
ce speeds up
e unit as the ote condensed
Liquid SurfaV
utput Rate
w Reactor
ncentrator, o
hic rotor in wde desorption
ution control a
alysis
the rate of of the reac
nce by the greomic and moleenium, first isobols and react
ry and biologyfe. (eg) Enzym
p a chemica
ther unit is befor solvent r
ce
or Rotary Co
which the conn of the solveapplications.
a chemicaction. The p
eat Swedish ecular weightsolated silicontions.
y. All enzymemes in saliva a
al reaction w
Chemistry
eing desorbedreuse or other
oncentrator)
ntaminated airents from the
l reaction,process is
chemist Jonss of thousand
n and titanium
es are catalystaccelerate the
without being
y
d r
)
r e
s ds m,
ts e
g

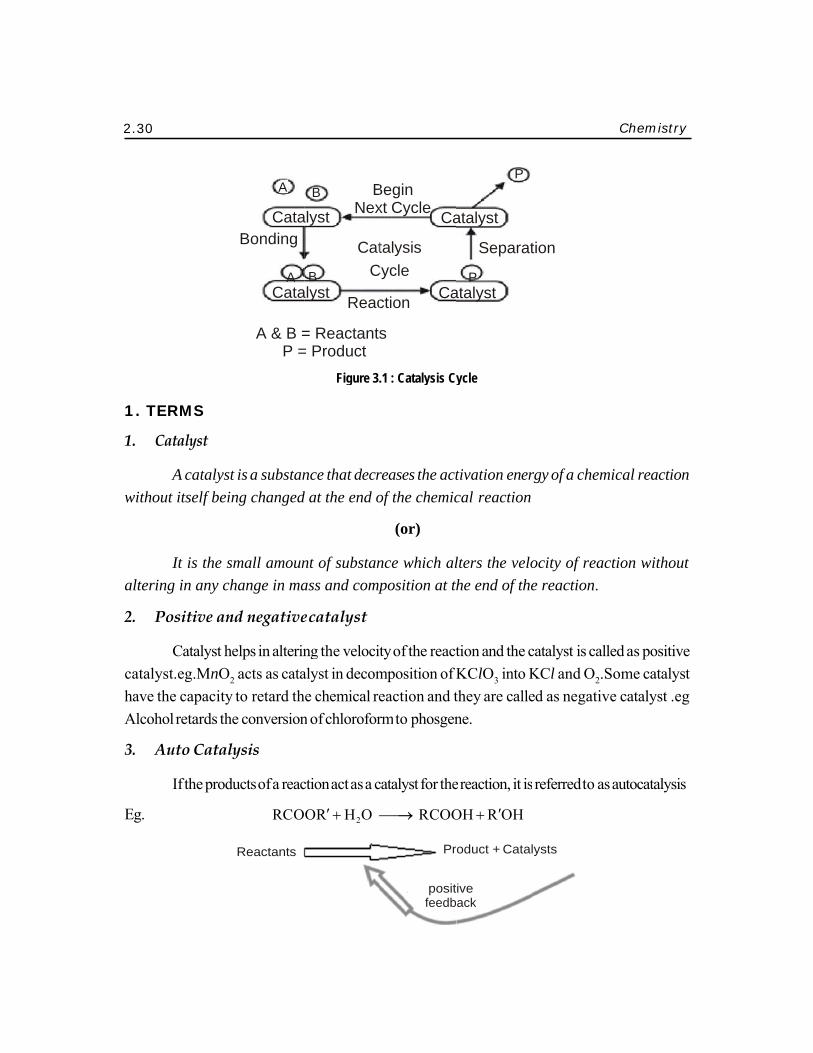
2.30
1. T
1.
with
alter
2.
catalhaveAlco
3.
Eg.
0
TERMS
Catalyst
A catalysout itself bei
It is the sring in any c
Positive an
Catalyst hlyst.eg.MnOe the capacityohol retards th
Auto Cata
If the prod
A
CataBonding
A Cata
A & B =P =
st is a substaning changed
small amounchange in ma
nd negative
helps in alterinO2 acts as catay to retard thhe conversion
lysis
ducts of a reac
RCO
Reactants
B B
alyst Nex
Cat
B Calyst Reac
= Reactants= Product
Figure 3.
nce that decrd at the end o
nt of substanass and comp
e catalyst
ng the velocitalyst in decomhe chemical ren of chlorofor
ction act as a c
OR′ + H2O ⎯
Begin xt Cycle Ca
talysis Cycle
ction Ca
s
.1 : Catalysis Cy
reases the actof the chemic
(or)
nce which alposition at th
ty of the reactmposition of Keaction and trm to phosgen
catalyst for the
⎯⎯→ RCOO
Pr
positfeedb
P
atalyst
Separat
P
atalyst
ycle
tivation enercal reaction
lters the velohe end of the
tion and the cKClO3 into Kthey are callene.
e reaction, it is
OH + R′OH
roduct + Catal
ive ack
tion
rgy of a chem
ocity of reace reaction.
catalyst is callKCl and O2.Sed as negativ
s referred to as
lysts
Chemistry
mical reaction
ction withou
led as positiveSome catalysve catalyst .eg
s autocatalysis
y
n
t
e st g
s

Surf
2. M
incre
3.
(
(
face Chemis
MECHANIS
easing energy
Aa
CRITERI
(i) A catareactioin massmanganchlora
(ii) A smalSometreactanthat is
On the
amoun
anhydroextent an este
stry and Cat
SM OF CA
gas
Adsorption of gasactive sites. The m
bonded
Adsorption as sechemically bond
Ste
Fig
IA (OR) CH
lyst remains on qualitative as ofchemical n
anese dioxide ate is left as a
ll quantity of times a trace nts. For examneeded to c
e other hand,
nt to be effecti
C6 H6
ous aluminiumof 30 per cen
er
talysis
ATALYTIC
s molecule
s molecules on to molecules are che
d to the catalyst
eparate atoms, indded to catalyst act
epwise reactio
gure 3.2 : Mech
HARACTE
unchanged inand quantitatinature. Howe(MnO2) useda fine powde
catalyst is geof a metal c
mple, one ten-atalyse the d
there are cat
ive. Thus in F
+ C2 H5Cl
m chloride funt of the mass
6 5
REACTIO
catalyst emically
dividually tive sites
on on catalyst s
hanism of cataly
ERISTICS
n mass and cive analysis shever, it may und as a catalyst er at the end
nerally needecatalyst is req-millionth of idecompositio
talysts which
Friedel-Crafts
⎯ A⎯lCl3⎯→ C H
unctions as a cs of benzene.
5 2 5
ON
surface
ytic reaction
FOR CATA
chemical comhow that a catndergo a physt in the thermato the reacti
ed to producequired to affeits mass of finon of hydrog
h need to be p
s reaction,
H C H + HC
catalyst effec For the acid
ga
adsorbed
ALYST
mposition at ttalyst undergosicalchange. Taldecomposinion.
e almost unlimect very largnely divided pgen peroxide
present in rel
Cl
ctively when pd and alkaline
2.3
as molecule
desorption of product
product
the end of theoes no changeThus granularng of potassiu
mited reactione amounts o
platinum is alle.
latively large
present to thehydrolysis o
1
e e r um
n f l
e
e f
2.32 Chemistry
2
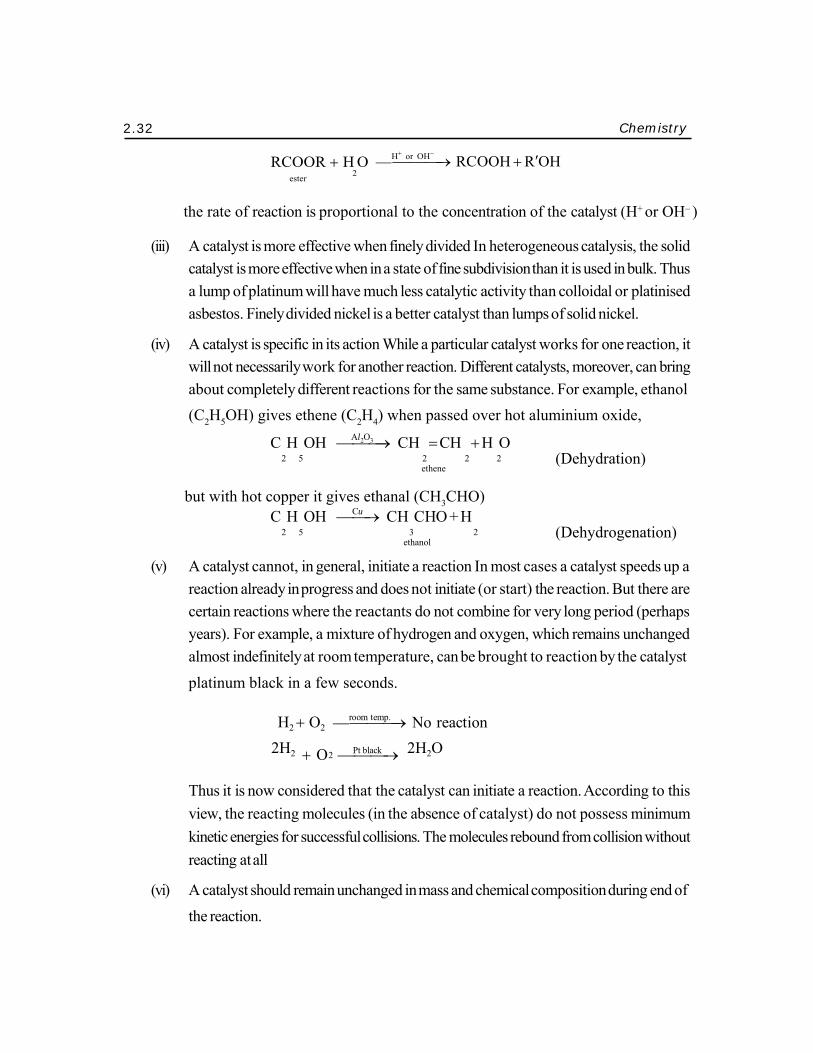
RCOOR + H O ⎯ H⎯+ o⎯r OH⎯
−
→ RCOOH + R′OH ester 2
the rate of reaction is proportional to the concentration of the catalyst (H+ or OH– )
(iii) A catalyst is more effective when finely divided In heterogeneous catalysis, the solid
catalyst is more effective when in a state of fine subdivision than it is used in bulk. Thus a lump of platinum will have much less catalytic activity than colloidal or platinised asbestos. Finely divided nickel is a better catalyst than lumps of solid nickel.
(iv) A catalyst is specific in its action While a particular catalyst works for one reaction, it will not necessarily work for another reaction. Different catalysts, moreover, can bring about completely different reactions for the same substance. For example, ethanol (C2H5OH) gives ethene (C2H4) when passed over hot aluminium oxide,
C H OH ⎯A⎯l2O⎯3 → CH = CΗ + Η O 2 5 2 2 2
ethene
but with hot copper it gives ethanal (CH3CHO)
(Dehydration)
C H OH ⎯⎯Cu → CH CHO + H 2 5 3 2
ethanol (Dehydrogenation)
(v) A catalyst cannot, in general, initiate a reaction In most cases a catalyst speeds up a reaction already in progress and does not initiate (or start) the reaction. But there are certain reactions where the reactants do not combine for very long period (perhaps years). For example, a mixture of hydrogen and oxygen, which remains unchanged almost indefinitely at room temperature, can be brought to reaction by the catalyst
platinum black in a few seconds.
H2 + O2 ⎯ r⎯oom⎯tem⎯p.→ No reaction
2H2 + O ⎯P⎯t bla⎯ck → 2H2O
Thus it is now considered that the catalyst can initiate a reaction. According to this view, the reacting molecules (in the absence of catalyst) do not possess minimum kinetic energies for successful collisions. The molecules rebound from collision without reacting at all
(vi) A catalyst should remain unchanged in mass and chemical composition during end of the reaction.
Surface Chemistry and Catalysis 2.33
(vii) Catalyst can alter only the speed of the reaction but it should not affect the equilibrium of the reaction.
(viii) Catalysts are more active at its optimum temperature. Change of temperature alters the rate of a catalytic reaction as it would do for the same reaction without a catalyst.
(ix) The catalytic activity can be altered by adding a small amount of foreign substance. Such substances which catalyse the catalyst are called as promoters and the substance which inhibits the reaction are called as catalytic poisons or anti-catalyst.
4. TYPES OF CATALYSIS
Catalytic reactions can be broadly divided into the following types,
HOMOGENEOUS CATALYSIS
When the reactants and the catalyst are in the same phase (i.e. solid, liquid or gas) it is said to be homogeneous.
Examples of Homogenous Catalysis
1. The depletion of ozone (O3) in the ozone layer of the Earth’s atmosphere by chlorine free radicals (Cl�) is a an example where the reactant and product exist in gaseous phase. Slow breakdown of manmade chlorofluorohydrocarbons (CFCs), release chlorine free radical into the atmosphere, which converts gaseous ozone to gaseous oxygen (O2).
2. Fischer esterification: Reaction of carboxylic acid with an alcohol involves the use of sulfuric acid as the catalyst and is an example where everything is contained in a liquid phase.
HETEROGENEOUS CATALYSIS
The catalytic process in which the reactants and the catalyst are in different phases is known as heterogeneous catalysis.
Examples of Heterogeneous Catalysis
1. The catalytic converters in automobiles convert exhaust gases such as carbon monoxide (CO) and nitrogen oxides (NOx) into more harmless gases like carbon dioxide (CO2) and nitrogen (N2). Metals (solids) like platinum (Pt), palladium (Pd) and rhodium (Rh) are used as the catalyst.
2.34 Chemistry
2. Manufacturing of sulfuric acid (H2SO4) involve solid vanadium pentoxide (V2O5) as the
catalyst to convert gaseous sulfur dioxide (SO2) into gaseous sulfur trioxide (SO3).
3. Catalytic hydrogenation of liquid Unsaturated hydrocarbons (alkenes) reacts with
gaseous hydrogen (H2) to produce liquid saturated hydrocarbons (alkanes) where metals
like platinum (Pt) and palladium (Pd) as the catalyst..
4. Haber Process
H2 ( g ) + 3H2 ( g) ⎯⎯→ 2H3 (g)
The catalyst is porous iron prepared by reducing magnetite, Fe3O4, with potassium hydroxide
(KOH) added as a promoter.
Positive Catalysis: When the rate of the reaction is accelerated by the foreign substance, it is said to be a positive catalyst and phenomenon as positive catalysis. Examples of positive catalysis are given below.
(i) Decomposition of KClO3
2 KClO3
MnO2 (S)
⎯3⎯70o ⎯C → 2 KCl + 3O2
Negative Catalysis: There are certain, substance which, when added to the reaction mixture, ret ard the reaction rat e instead of increasing it. These are called negative catalyst or inhibitors and the phenomenon is known as negative catalysis.
Some examples are as follows.
(i) Oxidation of sodium sulphite
2 Na2SO3 + O2 ⎯A⎯lcoh⎯ol→ 2 Na2SO4
(ii) Tetra Ethyl Lead (TEL) is added to petrol to retard the ignition of petrol vapours on
compression in an internal combustion engine and thus minimize the knocking effect.
Surface Chemistry and Catalysis 2.35
5. AUTOCATALYSIS
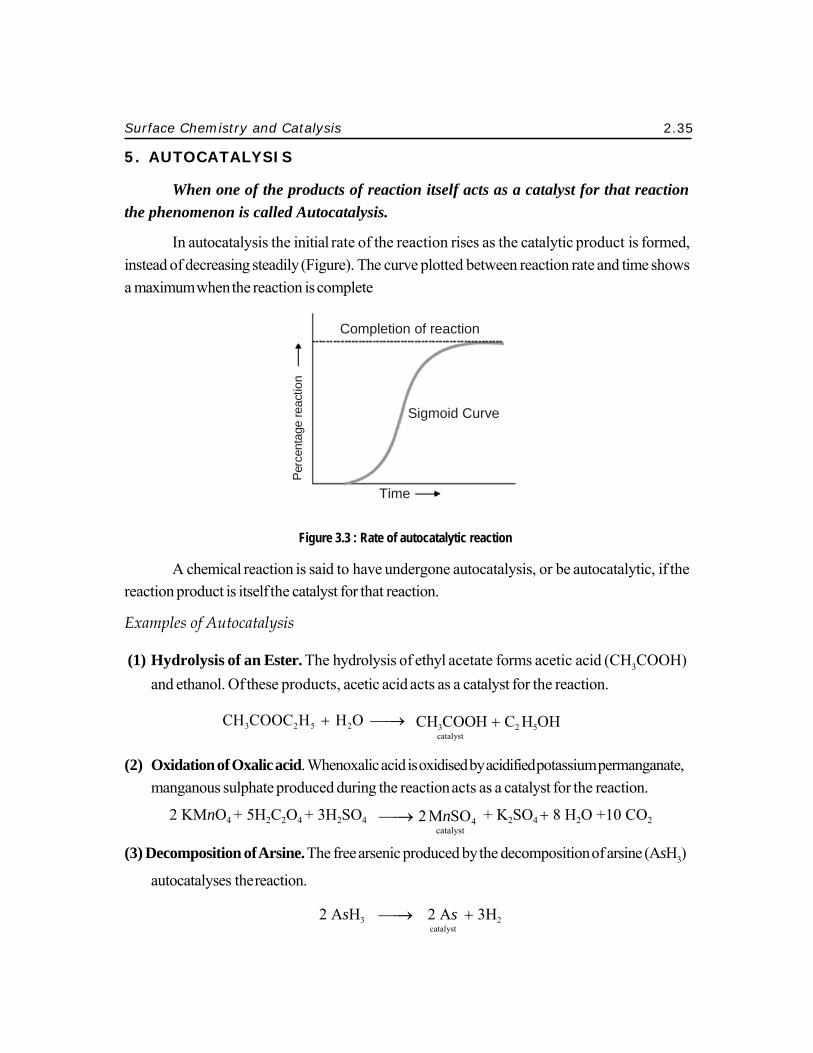
When one of the products of reaction itself acts as a catalyst for that reaction the phenomenon is called Autocatalysis.
In autocatalysis the initial rate of the reaction rises as the catalytic product is formed, instead of decreasing steadily (Figure). The curve plotted between reaction rate and time shows a maximum when the reaction is complete
Figure 3.3 : Rate of autocatalytic reaction
A chemical reaction is said to have undergone autocatalysis, or be autocatalytic, if the reaction product is itself the catalyst for that reaction.
Examples of Autocatalysis
(1) Hydrolysis of an Ester. The hydrolysis of ethyl acetate forms acetic acid (CH3COOH) and ethanol. Of these products, acetic acid acts as a catalyst for the reaction.
CH3COOC2 H5 + H2O ⎯⎯→ CH3COOΗ + C2 H5OH catalyst
(2) Oxidation of Oxalic acid. Whenoxalic acid is oxidised by acidified potassium permanganate, manganous sulphate produced during the reaction acts as a catalyst for the reaction.
2 KMnO4 + 5H2C2O4 + 3H2SO4 ⎯⎯→ 2 MnSO4 catalyst
+ K2SO4 + 8 H2O +10 CO2
(3) Decomposition of Arsine. The free arsenic produced by the decomposition of arsine (AsH3)
autocatalyses the reaction.
2 AsH3 ⎯⎯→ 2 As catalyst
+ 3H2
Completion of reaction
Sigmoid Curve
Time
P erc
enta
ge re
actio
n

2.36 Chemistry
6. CATALYTIC POISONING AND PROMOTERS
Promoters
The activity of a catalyst can often be increased by addition of a small quantity of a second material. This second substance is either not a catalyst itself for the reaction or it may be a feeble catalyst.
A substance which, though itself not a catalyst, promotes the activity of a catalyst is called a promoter. They are substances when added in small concentration can increase the activity of a catalyst.
Example of Promoters
Molybdenum (Mo) or aluminium oxide (Al2O3) promotes the activity of iron catalyst in the Haber synthesis for the manufacture of ammonia.
N2 + Fe
3H2 Mo
2NH3
In some reactions, mixtures ofcatalysts are used to obtain the maximum catalytic efficiency. For example, in the synthesis of methanol (CH3OH) from carbon monoxide and hydrogen, a mixture of zinc and chromium oxide is used as a catalyst.
CO + 2H ⎯ Z⎯nO⎯→ CH OH
Explanation of Promotion Action
2 Cr2O3 3
The theory of promotion of a catalyst is not clearly understood. Presumably:
(1) Change of Lattice Spacing. The lattice spacing of the catalyst is changed thus enhancing the spaces between the catalyst particles. The absorbed molecules of the reactant (say H2) are further weakened and cleaved. This makes are reaction go faster.
(2) Increase of Peaks and Cracks. The presence of the promoter increases the peaks and cracks on the catalyst surface. This increases the concentration of the reactant molecules and hence the rate of reaction.
The phenomenon of promotion is a common feature of heterogeneous catalysis.

Surface Chemistry and Catalysis 2.37
Distance between catalyst particles
Covalent bond much weakened
and cleaves readily
Figure 3.4 : How the change of crystal lattice spacing of catalyst makes the reaction go faster.
CATALYTIC POISONS
Small amounts ofsubstances can reduce the activity of catalyst. If the reduction in activity is reversible, the substances are called inhibitors. Inhibitors are sometimes used to increase the selectivity of a catalyst by retarding undesirable reactions.
A substance which destroys the activity of the catalyst to accelerate a reaction is called a poison and the process is called Catalytic Poisoning.
Examples of Catalytic Poisoning
(1) The platinum catalyst used in the oxidation of sulphur dioxide (Contact Process), is poisoned
by arsenic oxide (As2O3)
SO2 + O2 ⎯ P⎯t
→ As2O3
2SO3
(2) The iron catalyst used in the synthesis of ammonia (Haber Process) is poisoned by H2S.
N2 + 3H2 ⎯ F⎯e
→ H2S
2NH3
(3) The platinum catalyst used in the oxidation of hydrogen is poisoned by carbon monoxide
2H + O ⎯P⎯t → 2H O 2 2 CO 2

2.38 Chemistry
C C C
Types of Catalytic Poison
(i) Temporary Poisoning
Catalyst regains its activity when the poison is removed from the reaction
(ii) Permanent Poisoning
a. Catalyst cannot regain its activity even if the catalytic poison is removed.
b. Eg.AS2O3 poisons catalyst Pt permanently in manufacturing of SO3.
Explanation of Catalytic Poisoning
(1) The poison is adsorbed on the catalyst surface in preference to the reactants. Even a monomolecular layer renders the surface unavailable for further adsorption of the reactants. The poisoning byAs2O3 or CO appears to be of this kind.
O O O
Figure 3.5 : Poisoning of platinum catalyst by carbon monoxide
(2) The catalyst may combine chemically with the impurity. The poisoning of iron catalyst
by H2S falls in this class
Fe + H2S ⎯⎯→ FeS + H2
7. ACID AND BASE CATALYSIS
A number of homogeneous catalytic reactions are known which are catalysed by acids or bases, or both acids and bases. These are often referred to asAcid-Base catalysts. Arrhenius pointed out that acid catalysis was, in fact, brought about by H+ ions supplied by strong acids, while base catalysis was caused by OH– ions supplied by strong bases.

Surf
prototwo d
Exam
Exam
(
(
(
(
Mec
(a) Icm
face Chemis
Many reaon transfer ardifferent way
mple
Acid-spoccurs
Base-s
ketone
mples of Ac
(1) Inversion
(2) Keto-Eno
(3) Decompo
(4) Hydrolys
chanism of A
In acid catalcomplex witmechanism o
stry and Cat
actions are care esterificatiys (Specific ca
pecific (acid cs in presence o
specific (base
es in the prese
cid-Base Ca
n of Cane Sug
C H 12 2cane s
ol Tautomeris
osition of Nitr
NH2 N
is of an Ester
CH C3
eth
Acid-Base Ca
lysis, the H+h the reactanf keto-enol ta
talysis
atalyzed by bion and aldolatalysis and g
catalysis) — Dof sulfuric aci
e catalysis) —
ence of sodium
atalysis
gar:
O + H ⎯22 11 2sugar
sm ofAcetone
ramide :
NO2
r :
⎯H⎯+
→
COOC H ⎯3 2 5 hyl acetate
atalysis
+ (or a protonnt, which theautomerism o
both acids andl reaction. Caeneral catalys
Decompositioid
— Addition o
m hydroxide.
+ ⎯H⎯→ C H 6 12gluco
e :
→ N2O + H2O
⎯ H⎯+
→ CH Cor OH− 3
ace
n donated byn reacts to g
of acetone is:
d bases. Typiatalysis by eitsis).
on of Sucrose
of hydrogen c
.
O + C H O2 6 6 12 6
ose fructose
O
COOH + C 2
tic acid e
y Bronsted acgive back the
ical reactionsther acid or b
e into glucose
cyanide to al
O e
H OH 5 ethanol
cid) forms anproton. For
2.3
s catalysed bybase can be in
e and fructose
ldehydes and
n intermediateexample, the
9
y n
e
d
e e
2.40
(b) It(C
8. A
1.
conv
convIt concarbhydr
ceramRhod
Eg: C
whergets
0
3
In base catato form an in(or BronstedCH COO– io
APPLICAT
Catalytic C
A device iverting polluta
Catalytic verters are usenverts three hon dioxide, n
rocarbons (ca
Catalytic mic beads or dium are used
Consider the
Carbon mre they get addesorbed.
Catalytic
alysis, the OHntermediate cod base). For ons may be ex
NH N2
TION OF C
Converters
incorporatedant gases into
converters aed within interharmful substnitrogen oxidause smog and
converters cohoneycomb cd. Alumina, C
e reaction
2 CO
monoxide anddsorbed to cat
c converters
H– ion (or anyomplex whichexample, th
xplained as fo
NO + OH− ⎯2
NHNO− ⎯2
CATALYSI
d in the exhauso less harmful
are used for mrnal combustiotances into hades (cause acd respiratory
onsist of a staicoated with cCeria can also
+ 2 ΝΟ ⎯
d Nitrogen mtalyst and resu
can be affec
y Bronsted bah then reacts
he decomposfollows: By O
⎯⎯→ H O +2
⎯⎯→ N O +2
IS
st system of aones.
mitigating auon engines fu
armless ones ccid rain and
y problems) in
inless steelbocatalysts (Expo be used whe
⎯⎯→ 2 CO2 +
monoxide willult in formatio
cted by cataly
ase) accepts or decompo
sition of nitrOH– ions:
+ NHNO− 2
Intermediate Complex
+ OH−
a motor vehicl
utomobile exhueled by eithercarbon monoxsmog) into n
nto carbon dio
ox attached topensive metalen combined w
+ N2
l be adsorbedon of carbon d
ytic poison.
a proton fromses to regeneramide by O
le, containing
haust emissior petrol (gasolxide (a poisonnitrogen andoxide and wa
o the muffler als like platinumwith expensiv
d on the surfadioxide and n
Chemistry
m the reactanerate the OH–
OH– ions and
g a catalyst for
ons. Catalyticline) or dieselnous gas) into
d oxygen, andater.
and containingm, Palladiumve metals.)
ace of catalysnitrogen which
y
nt – d
r
c l. o d
g m,
st h
Surface Chemistry and Catalysis 2.41
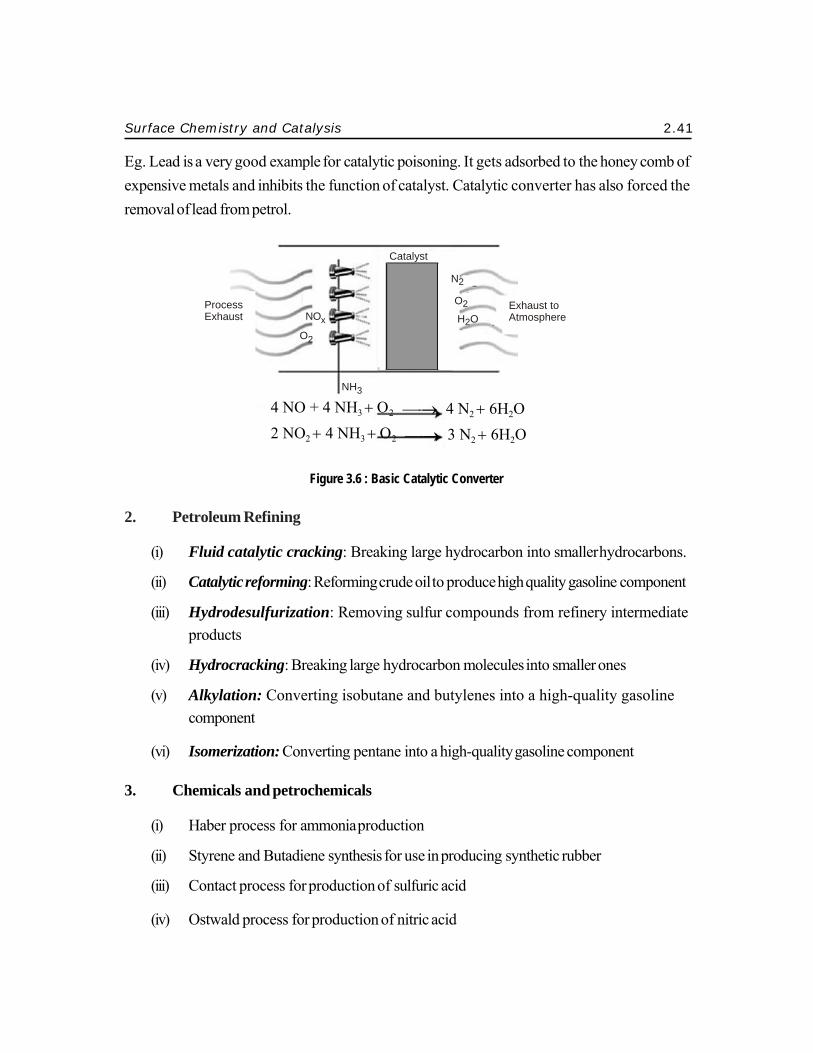
Eg. Lead is a very good example for catalytic poisoning. It gets adsorbed to the honey comb of expensive metals and inhibits the function of catalyst. Catalytic converter has also forced the removal of lead from petrol.
Process Exhaust
Catalyst
N2
O2
NOx H2O O2
Exhaust to Atmosphere
NH3
4 NO + 4 NH3 + Ο2
2 NO2 + 4 NH3 + Ο2
⎯⎯→
⎯⎯→
4 N2 + 6H2O 3 N2 + 6H2O
Figure 3.6 : Basic Catalytic Converter
2. Petroleum Refining
(i) Fluid catalytic cracking: Breaking large hydrocarbon into smaller hydrocarbons.
(ii) Catalytic reforming: Reforming crude oil to produce high quality gasoline component
(iii) Hydrodesulfurization: Removing sulfur compounds from refinery intermediate products
(iv) Hydrocracking: Breaking large hydrocarbon molecules into smaller ones
(v) Alkylation: Converting isobutane and butylenes into a high-quality gasoline component
(vi) Isomerization: Converting pentane into a high-quality gasoline component
3. Chemicals and petrochemicals
(i) Haber process for ammonia production
(ii) Styrene and Butadiene synthesis for use in producing synthetic rubber
(iii) Contact process for production of sulfuric acid
(iv) Ostwald process for production of nitric acid

2.42 Chemistry
n
(v) Methanol synthesis
(vi) Production of different plastics and synthetic fabrics
4. Other
(i) Fischer-Tropsch and Coal gasification processes for producing synthetic fuel gases and liquid fuels
(ii) Various processes for producing many different medicine
9. BIOLOGICAL CATALYST——ENZYMES
Numerous organic reactions are taking place in the body of animals and plants to maintain the life process. These reactions being slow remarkably catalysed by the organic compounds known as Enzymes. All enzymes have been found to be complex protein molecules. Thus: Enzymes are protein molecules which act as catalysts to speed up organic reactions in living cells. The catalysis brought about by enzymes is known as Enzyme Catalysis.
Each enzyme is produced in a particular living cell to catalyse a reaction occurring in that cell. Many enzymes have been identified and obtained in pure crystalline state from the cells to which they belong. However the first enzyme as prepared by synthesis in the laboratory in 1969.
Enzymes are substances found in biological systems that act as catalyst for specific biochemical process. Enzymes are usually protein or steroid which is synthesized in the living cells of animals and plants. Enzymes catalyze reactions inside organism. Enzymes possess a incredible capacity to carry out complex chemical reactions like hydrolysis, oxidation, reduction etc.
Eg.(i) Amylase is an enzyme which breaks down starch into glucose.
(C6H10O5 ) + nH2O ⎯⎯→ nC12H22O11
(ii) Diastase converts starch to maltose and maltase converts maltose to glucose
2(C6 H10O5 ) + nH2O ⎯⎯→ nC12 H22O11
nC12H22O11 + nH2O ⎯⎯→ nC12 H22O11
n

Surf
whenactivreact
Enzy
•
•
•
face Chemis
Enzymes n substrates b
ve site is the lotion catalyzed
ymes do not
• Change th• Change Δ
• Convert a
KINETIAND
Consider
Free
ene
rgy
stry and Cat
speed up reacbind. This is tocation on thd
energy barrier
reactants
course o
Figure
he equilibriumΔG for a react
a nonspontan
ICS OF EN MENTEN E
r the enzyme
talysis
ctions by lowtermed as “inhe enzyme sur
Uncatalyst Reaction
E2
ΔG
produc
f reaction
3.7 : Rate of fre
m constant fortion
neous reaction
NZYME CAEQUATION
e catalyzed r
wering activatinduced fit”. Erface where s
energbarri
reactants
cts
ee energy vs co
r a reaction
n into a sponta
TALYSEDN
reaction:
on energy. MEnzymes havsubstrates bin
gy er
s
Catalyst Reaction
E
course of react
ourse of reactio
aneous reacti
D REACTIO
Many enzymesve active sitesnd, and where
n
2
ΔG
products
tion
on
ion.
ON OR MIC
2.4
s change shapes. The enzymee the chemica
CHAELIS
43
e e
al
2.44
Step
Step
wher
cons
only
4
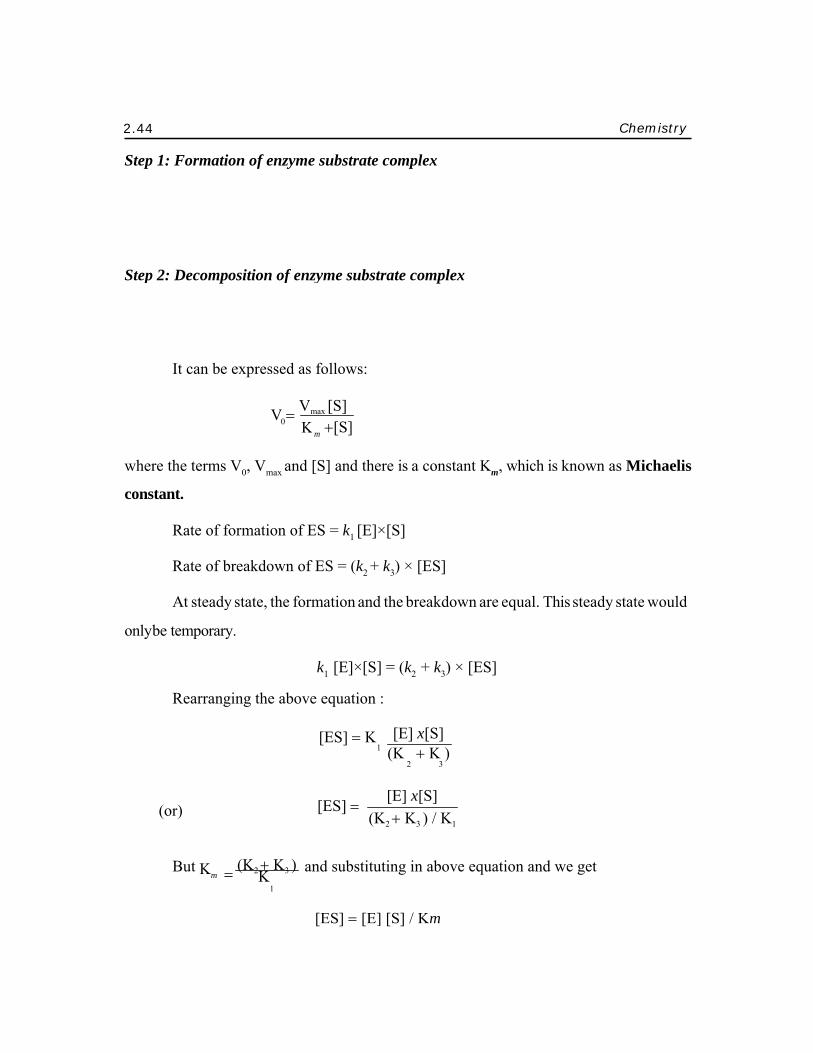
p 1: Formati
p 2: Decomp
It can be
re the terms
stant.
Rate of f
Rate of b
At steady
be temporary
Rearrang
(or)
But Km =
K
ion of enzym
osition of en
expressed a
V = V 0
V0, Vmax and
formation of
breakdown o
y state, the fo
y.
ging the abov
= (K2 + K3 ) K 1
Km
me substrate
nzyme subst
as follows:
Vmax [S]
+[S]
d [S] and the
f ES = k1 [E]×
of ES = (k2 +
ormation and
k1 [E]×[S]
ve equation
[ES] = K
1
[ES] = (K
and substitu
[ES] = [E]
complex
trate complex
ere is a const
×[S]
k3) × [ES]
d the breakdo
] = (k2 + k3) ×
:
[E] x[S] (K + K )
2 3
[E] x[S] K2 + K3 ) / K1
uting in abov
] [S] / Km
ex
ant Km, whic
own are equal
× [ES]
ve equation a
ch is known
l. This steady
and we get
Chemistry
as Michaeli
y state would
y
is
d

Surface Chemistry and Catalysis 2.45
T
The total amount of enzyme equals the free and that bound to substrate
[ET] = [E] + [ES]
[E] = [E ] − [ES]
Substitute the value of E
Then
[ES] =
{[Et][S]}
[ES] = K 1+[S] / Km
{[E] x[S]} ([S] + Km
This simplifies to:
[ES] = {[Et] x[S] / ([S]+ Km }
Multiplying both sides by the kinetic constant k3 gives the velocity of the reaction
V = k3 × [ES] = k3×[ET] ×(([S] ([S] + KM )
and substituting Vmax for k3×[ET] leads to the familiar form of the Michaelis Menten Equation:
The above equation is called Michaelis –Menton equation. This equation is applicable to enzyme catalysed reaction having a single substrate. Aquantitative estimation of initial rate of reaction, maximum velocity and substrate concentration is combined through a constant called Michaelis constant.
Case 1: First order reaction-When concentration of substrate is low.
If Km >> S then s is neglected and then the equation becomes
Rate (v) = Vmax ×[S] | (KM)
Case 2: Zero order reaction-When concentration of substrate is high.
V = V X[S]max [S] + K

2.46 Chemistry
0.15
0.10
0.05
If Km << S then Km is neglected and equation becomes
Rate (v) = Vmax ×[S] | [S] so Vmax = Constant
Case 3: If Km = [S] then
Rate (V) = Vmax [S] = 1 V
[S] + [S] 2
Reciprocating the above equation
max
1 = Km + [S] Rate (v) Vmax [S] Vmax [S]
Rearranging the above equation:
1 = Km + [S] Rate (v) Vmax [S] Vmax [S]
The above equation is similar to an equation of straight line y = mx + c. Agraph is plotted
between 1/rate and 1/[S] we get a straight line.
−0.1 0.0 0.1 0.2 0.3 1/[s]
Figure 3.8
where slope = Km /Vmax and Intercept =1/Vmax
1/V
Surface Chemistry and Catalysis 2.47
FACTORS AFFECTING ENZYME ACTIVITY a. Enzyme Concentration
If we keep the concentration of the substrate constant and increase the concentration of the enzyme, the rate of reaction increases linearly. (That is if the concentration of enzyme is doubled, the rate doubles.)
This is because in practically allenzyme reactions the molar concentration of the enzyme is almost always lower than that of the substrate.
b. Substrate Concentration
If we keep the concentration of the enzyme constant and increase the concentration of the substrate, initially, the rate increases with substrate concentration, but at a certain concentration, the rate levels out and remains constant.
So at some point, increasing the substrate concentration does not increase the rate of reaction, because the excess substrate cannot find any active sites to attach to.
c. Temperature
For enzyme-catalyzed reactions, like all chemical reactions, rate increases with temperature. However, enzymes are proteins, and at higher temperatures proteins become denatured and inactive. Thus, every enzyme has an optimum temperature.
Optimum temperature - the temperature at which enzyme activity is highest-usually about 25oC−40oC.
d. Effect of pH
Small changes in pH can result in enzyme denaturation and loss of catalytic activity.
Because the charge on acidic and basic amino acid residues located at the active site depends on pH. Most enzymes only exhibit maximum activity over a very narrow pH range.
Most enzymes have an optimum pH that falls within the physiological range of 7.0- 7.5.
Notable exceptions are the digestive enzymes pepsin and trysin.
pepsin (active in the stomach) - optimum pH of 1.5
trypsin (active in the small intestine) - optimum pH of 8.0


