
University of Kentucky University of Kentucky
UKnowledge UKnowledge
Theses and Dissertations--Chemical and Materials Engineering Chemical and Materials Engineering
2018
SURFACE FUNCTIONALIZATION VIA PHOTOINITIATED RADICAL SURFACE FUNCTIONALIZATION VIA PHOTOINITIATED RADICAL
POLYMERIZATION FOR RARE CELL ISOLATION AND POLYMERIZATION FOR RARE CELL ISOLATION AND
MECHANICAL PROTECTION MECHANICAL PROTECTION
Calvin Frank Cahall University of Kentucky, [email protected] Author ORCID Identifier: https://orcid.org/0000-0001-7558-4221 Digital Object Identifier: https://doi.org/10.13023/etd.2018.512
Right click to open a feedback form in a new tab to let us know how this document benefits you. Right click to open a feedback form in a new tab to let us know how this document benefits you.
Recommended Citation Recommended Citation Cahall, Calvin Frank, "SURFACE FUNCTIONALIZATION VIA PHOTOINITIATED RADICAL POLYMERIZATION FOR RARE CELL ISOLATION AND MECHANICAL PROTECTION" (2018). Theses and Dissertations--Chemical and Materials Engineering. 93. https://uknowledge.uky.edu/cme_etds/93
This Doctoral Dissertation is brought to you for free and open access by the Chemical and Materials Engineering at UKnowledge. It has been accepted for inclusion in Theses and Dissertations--Chemical and Materials Engineering by an authorized administrator of UKnowledge. For more information, please contact [email protected].

STUDENT AGREEMENT: STUDENT AGREEMENT:
I represent that my thesis or dissertation and abstract are my original work. Proper attribution
has been given to all outside sources. I understand that I am solely responsible for obtaining
any needed copyright permissions. I have obtained needed written permission statement(s)
from the owner(s) of each third-party copyrighted matter to be included in my work, allowing
electronic distribution (if such use is not permitted by the fair use doctrine) which will be
submitted to UKnowledge as Additional File.
I hereby grant to The University of Kentucky and its agents the irrevocable, non-exclusive, and
royalty-free license to archive and make accessible my work in whole or in part in all forms of
media, now or hereafter known. I agree that the document mentioned above may be made
available immediately for worldwide access unless an embargo applies.
I retain all other ownership rights to the copyright of my work. I also retain the right to use in
future works (such as articles or books) all or part of my work. I understand that I am free to
register the copyright to my work.
REVIEW, APPROVAL AND ACCEPTANCE REVIEW, APPROVAL AND ACCEPTANCE
The document mentioned above has been reviewed and accepted by the student’s advisor, on
behalf of the advisory committee, and by the Director of Graduate Studies (DGS), on behalf of
the program; we verify that this is the final, approved version of the student’s thesis including all
changes required by the advisory committee. The undersigned agree to abide by the statements
above.
Calvin Frank Cahall, Student
Dr. Bradley J. Berron, Major Professor
Dr. Stephen Rankin, Director of Graduate Studies

SURFACE FUNCTIONALIZATION VIA PHOTOINITIATED RADICAL POLYMERIZATION FOR RARE CELL ISOLATION AND MECHANICAL
PROTECTION
________________________________________
DISSERTATION ________________________________________
A dissertation submitted in partial fulfillment of the requirements for the degree of Doctor of Philosophy in the
College of Engineering at the University of Kentucky
By
Calvin F Cahall
Lexington, Kentucky
Director: Dr. Bradley J. Berron, Professor of Chemical Engineering
Lexington, Kentucky
2018
Copyright © Calvin Frank Cahall 2018 https://orcid.org/0000-0001-7558-4221
ABSTRACT OF DISSERTATION
SURFACE FUNCTIONALIZATION VIA PHOTOINITIATED RADICAL POLYMERIZATION FOR RARE CELL ISOLATION AND MECHANICAL
PROTECTION
Surface functionalization of living cells for cell therapeutics has gained substantial momentum in the last two decades. From encapsulating islets of Langerhans, to cell laden gels for tissue scaffolds, to individual cell encapsulation in thin hydrogels, to surface adhesives and inert surface camouflage, modification of living cell surfaces has a wide array of important applications. Here we use hydrogel encapsulation of individual cells as a mode of protection from mechanical forces for high throughput cell printing, and chemical stimuli for the isolation of rare cells in blood.
In the first study, we review methods of surface functionalization and establish a metric of potential target biomarkers for circulating tumor cell (CTC) isolation. For extended applications in cancer detection through a fluid biopsy, common surface antigen densities were quantitatively assessed in relation to peripheral blood mononuclear cells (PBMCs) for potential targets of cell specific encapsulation. We then look to commercialization of our process after considering biopsy volumes and cell therapy dose sizes. Undesired batch-to-batch variation in our in-house synthesized photo-initiator could be eliminated by the use of fluorescein, a commercial fluorochrome of similar initiating power to our current eosin initiating system. Fluorescence and hydrogel generation were compared indicating a fluorescein conjugate has comparable power to that of our in-house conjugated eosin. Parameters involving the number of cells and fluid volumes processed were then analyzed systematically. Key parameters were studied to determine optimal equipment and protocol for clinically relevant batch sizes. The final study looks at the mechanical protection provided by thin hydrogel encapsulation. With growing interests in 3D bioprinting and goals of viable whole organ printing for transplant, high resolution and high throughput printing is a growing need. 3D bioprinting presents intense mechanical stimuli in the process that cells must endure. Here we analyze how hydrogel encapsulation reinforces the cellular membrane allowing cells to withstand the damaging forces associated with bioprinting.
KEYWORDS: cell encapsulation, bioprinting, photopolymerization, surface polymerization, isolation.
Calvin Frank Cahall
11/01/2018 Date

SURFACE FUNCTIONALIZATION VIA PHOTOINITIATED RADICAL POLYMERIZATION FOR RARE CELL ISOLATION AND MECHANICAL
PROTECTION
By Calvin Frank Cahall
Dr. Bradley J. Berron Director of Dissertation
Dr. Stephen Rankin
Director of Graduate Studies
11/01/2018 Date

DEDICATION
To Leslie, Roland, and Clinton Cahall, who have supported me in every way possible to help me get to where I am today. Their love and support through my educational career
have been amazing and I could not have done it without them.

iii
ACKNOWLEDGEMENTS
I would first like to thank my advisor, Dr. Brad Berron for being a great mentor
and excellent motivator. His passion for science is contagious and it has been a pleasure
working for him the past few years. I would also like to thank Dr. Ahmed Abdel-Latif for
serving as a co-mentor to me in the Halcomb Fellowship in Medicine and Engineering.
His insights from a clinician point of view proved extremely valuable. Finally, I would
like to thank Dr. Zach Hilt, Dr. Thomas Dziubla, Dr. Ahmed Abdel-Latif, and Dr. Robert
Yokel for being a part of my dissertation committee and outside examiner, respectively.
For out of lab matters and logistical assistance I would like to give a special thanks
to Marlene Spurlock. She is an extremely hardworking woman and was always very
willing to help with any matters.
Lastly, I want to thank my friends and family for all of their support. My parents,
Leslie and Roland Cahall, my brother Clinton Cahall and his wife Bekah, my girlfriend
Rebecca Garrison, and countless others that have helped me along the way. Your support
means the world to me and I am very greatful.

iv
TABLE OF CONTENTS
ACKNOWLEDGEMENTS .............................................................................................................................. iii
LIST OF TABLES ....................................................................................................................................... vii
LIST OF FIGURES .................................................................................................................................... viii
LIST OF ABREVIATIONS .......................................................................................................................... xiii
CHAPTER 1. INTRODUCTION .............................................................................................................1
1.1 Introduction ............................................................................................................................1
CHAPTER 2. BACKGROUND ...............................................................................................................6
2.1 Protection ...............................................................................................................................6
2.2 Drug Delivery ..........................................................................................................................8
2.3 Isolation ................................................................................................................................ 10
2.4 Antigen Specific Lysis ............................................................................................................. 14
2.5 Mechanical Protection .......................................................................................................... 18
CHAPTER 3. Materials and Methods ............................................................................................... 21 3.1 Poly(ethylene glycol) diacrylate synthesis .............................................................................. 21
3.2 Cell culture ............................................................................................................................ 22
3.3 Viability assays...................................................................................................................... 23
3.4 Cell tracking .......................................................................................................................... 24
3.5 Micro array printing .............................................................................................................. 24
3.6 Micro array polymerization ................................................................................................... 25
3.7 Profilometry .......................................................................................................................... 26
3.8 Streptavidin-fluorophore conjugation .................................................................................... 26
3.9 Cell encapsulation ................................................................................................................. 27
3.10 Hypotonic Challenge ............................................................................................................. 28
3.11 Surfactant Challenge ............................................................................................................. 28
3.12 Extrusion ............................................................................................................................... 29
3.13 Shear without pressure change ............................................................................................. 29
3.14 Rapid Pressure Drop .............................................................................................................. 30
3.15 Mechanical properties ........................................................................................................... 30
v
3.16 Flow cytometry ..................................................................................................................... 31
CHAPTER 4. Quantitative Analysis of Surface Markers for CTCs and Current Isolation Strategies ... 33
4.1 Introduction .......................................................................................................................... 33 4.1.1 Current Isolation Strategies .............................................................................................. 34 4.1.2 Common Surface Markers Associated with Metastasis ...................................................... 37
4.2 Materials and Methods ......................................................................................................... 39 4.2.1 Peripheral Blood ............................................................................................................... 39 4.2.2 Surface Marker Immunostaining ....................................................................................... 39 4.2.3 Data Analysis .................................................................................................................... 40
4.3 Results .................................................................................................................................. 41 4.3.1 Image analysis .................................................................................................................. 41 4.3.2 Flow cytometric analysis of surface markers ..................................................................... 43
4.4 Discussion ............................................................................................................................. 49
CHAPTER 5. Commercialization of ASL through the use of FITC for Photoinitiation ........................ 55 5.1 Introduction .......................................................................................................................... 55
5.2 Chemical structures of eosin Y and fluorescein. ...................................................................... 58 5.2.1 Micro array printing ......................................................................................................... 58 5.2.2 Micro array polymerization .............................................................................................. 59 5.2.3 Fluorescent calibration using Cy3 ...................................................................................... 59 5.2.4 Surface polymerization of A549 cells................................................................................. 59
5.3 Results and Discussion........................................................................................................... 61 5.3.1 Spectral Analysis of EITC and FITC ..................................................................................... 61 5.3.2 Polymerization with micro arrays .................................................................................... 63 5.3.3 Cell encapsulation using FITC initiated systems ................................................................. 68
5.4 Conclusion ............................................................................................................................ 71
CHAPTER 6. Scaling Process to Therapeutic Scale for Accurate CTC Detection and Isolation ........... 73
6.1 Introduction .......................................................................................................................... 73
6.2 Materials and Methods ......................................................................................................... 76 6.2.1 Micro array printing ......................................................................................................... 76 6.2.2 Radiation intensity with increase monomer volume .......................................................... 77 6.2.3 Maximum Target Cell Density ........................................................................................... 77
6.3 Results and Discussion........................................................................................................... 78 6.4 Conclusion ............................................................................................................................ 86
CHAPTER 7. Mechanical Protection for High Resolution, High Throughput 3D Cell Printing ............ 87
7.1 Introduction .......................................................................................................................... 87
7.2 Materials and Methods ......................................................................................................... 91 7.2.1 Cell Encapsulation ............................................................................................................ 91
7.3 Results and Discussion........................................................................................................... 92

vi
7.3.1 Mechanical Properties ...................................................................................................... 92 7.3.2 Protective Potential .......................................................................................................... 94 7.3.3 Conclusion...................................................................................................................... 105
CHAPTER 8. Conclusions and future directions ............................................................................. 106
REFERENCES ......................................................................................................................................... 110
CALVIN FRANK CAHALL VITA................................................................................................................. 120
vii
LIST OF TABLES
Table 4.1: Summary of cell types analyzed in the study. Diameter and surface area
calculations are reported as mean ± s.e.m. ...................................................... 42
Table 4.2: Summary of student t-test calculations for surface marker data. .................... 54
Table 7.1: All mechanical properties recorded for each polymer assessed. Data reported
as mean ± standard deviation. ....................................................................... 93
Table 7.2: P-values generated using Student’s t-test for samples following extrusion when
compared uncoated cells (Figure 7.3). ............................................................ 96
Table 7.3: P-values for viability assays of coated cells compared to uncoated cells after
being exposed to shear forces only (Figure 7.6). .......................................... 102
Table 7.4: P-values generated using Student’s t-test for viability before capillary
extrusion (Figure 7.7) to viability following extrusion of each polymer type
and uncoated cells. ....................................................................................... 104

viii
LIST OF FIGURES
Figure 2.1: Schematic of immunoprotection by physical barrier from covalently bound
HPGs to the cell surface from (a) antibody recognition, (b) immune cell
interaction. ....................................................................................................... 7
Figure 2.2: Schematic of the polymerization procedure for micro array and cell surface
polymerization. .............................................................................................. 18
Figure 4.1: Representative bright field micrograph images of cultured breast cancer lines
(MDA-MB-231, MCF-7, T-47D) and non-small cell lung cancer lines (A549,
H358). ........................................................................................................... 43
Figure 4.2: Phycoerythrin labeling per cell comparison for indirect staining conditions on
viable A549 cells. Labeling conditions before streptavidin-phycoerythrin
incubation were (left) covalently biotinylated mouse anti-human EpCAM and
(right) mouse anti-human EpCAM + biotinylated goat anti-mouse. ................ 44
Figure 4.3: Summary of tumor marker expression on viable cells. Presented as fold over
isotype controls for cancer lines and healthy peripheral blood mononuclear
cells (PBMC) as quantified by flow cytometry analysis of a phycoerythrin
reporter label. ................................................................................................ 46
Figure 4.4: Summary of Phycoerythrin labeling density (# PE molecules/µm2 of cell
surface) for various tumor marker targeting conditions on viable cancer line
cells and healthy PBMC................................................................................. 47
Figure 4.5: Summary of phycoerythrin labeling density of all cancer lines studied
presented as fold expression over healthy monocytes from a peripheral blood
sample. .......................................................................................................... 48

ix
Figure 4.6: Summary of phycoerythrin labeling per cell for all markers and cell types.
Error bars represent the standard error of events collected by flow cytometry.
...................................................................................................................... 52
Figure 5.1: Reaction schematic of A) radical polymerization and regeneration of
photoinitiator (I = eosin Y or fluorescein), and B) initiator ability to consume
inhibiting species and regenerate.................................................................... 56
Figure 5.2: Chemical structures of eosin Y and fluorescein. ........................................... 57
Figure 5.3: Analysis of photoinitatior absorbance spectral overlap for (a) SA-FITC and
(b) SA-EITC with a Thorlabs collimated LED emitting green light. Lamp
spectra obtained from manufacturer. .............................................................. 62
Figure 5.4: Specific polymerization of photoinitiator tagged micro arrays. (A) Grayscale
fluorescence scanner image of SA-EITC bound to biotin-BSA printed micro
arrays. Scan at 50 dB gain with 532 nm excitation and 551/25 nm detection
with bandpass filter. (B) Grayscale fluorescence scanner image of SA-FITC
bound to biotin-BSA printed micro arrays. Scan at 50 dB gain with 532 nm
excitation and 551/25 nm detection with bandpass filter. (C) Bright field
optical microscopy example image of a micro array sample tagged with
SA-FITC after photopolymerization at 30 mW/cm2 for 10 minutes. ............... 64

x
Figure 5.5: Comparative analysis of polymer gelation thickness vs. photoinitiator density
for SA-FITC and SA-EITC tagged micro array samples. Analysis was
conducted with cell compatible conditions consisting of 420 mM PEG-
diacrylate, 21 mM triethanol amine, 35 mM vinyl pyrrolidone, in phosphate
buffered media (pH=7.5) with a constant reaction time of 10 minutes. ........... 66
Figure 5.6: Comparison of polymer gelation thickness vs. photoinitiator density with cell
compatible and unconstrained formulations and FITC photoinitiation. All
samples were irradiated with 20mW/cm2 of green light (530 nm LED lamp,
ThorLabs) for 10 minutes. Cell compatible = 420 mM PEG-diacrylate, 21 mM
triethanol amine, 35 mM vinyl pyrrolidone, in phosphate buffered media
(pH=7.5). Unconstrained= 420 mM PEG-diacrylate, 210 mM triethanol amine,
35 mM vinyl pyrrolidone in deionized water. ................................................. 68
Figure 5.7: Polymerization of A549 cells using an eosin or fluorescein photoinitiator
targeted to EGFR and PEGDA3500 as a monomer. (a) Fluoroscence image of
A549 cells coated with red fluorescent hydrogel using an eosin photoinitiator.
(b) Fluoroscence image of A549 cells coated with red fluorescent hydrogel
using a fluorescein photoinitiator. (c) Viability of A549 cells determined using
MTT assay at various stages of polymerization (n=3). ................................... 71
Figure 6.1: Normalized observed radiation intensity for increasing volume of monomer
solution. Values are normalized to observed radiation through a standard
microscope slide in the absence of monomer solution. ................................... 79
Figure 6.2: Thickness of generated polymer film determined by contact profilometry for
multiple monomer volumes within the same chip well. .................................. 80

xi
Figure 6.3: Thickness of generated polymer film determined by contact profilometry for
multiple monomer volumes within the same chip well after nitrogen bubbling
of the monomer solution. Dashed lines indicate nitrogen bubbled monomer
studies, while solid lines indicate studies without bubbling nitrogen through the
monomer before use. ..................................................................................... 82
Figure 6.4: Normalized film thickness generated on micro arrays under varying
conditions. Left: Array centered within the chip well and centered within
radiation area. Middle: Array positioned at the edge of the chip well where the
meniscus is most prominent while centered under radiation area. Right: Array
centered within chip well while positioned at the edge of radiation area where
variation in light intensity is most prominent. Top: Normalized film generation
(x and y axes represent printed microarray position analyzed. Conditions varied
in the x direction). Bottom: Schematic of polymerization set up (View of the x-
z plane). ......................................................................................................... 84
Figure 6.5: Analysis of total cells processed with total volume processed. Lines draw
estimated distinction between observed bulk gelation and individual cell
encapsulation. ................................................................................................ 85
Figure 7.1: (Top) Schematic representation of cell deformation due to mechanical forces
during extrusion printing. As printing resolution increases from left to right
with constant flow rates, fluid velocity increases along with shear stress, τ, and
pressure drop, ∆𝑃. (Bottom) Stress/strain relationship for PEGDA 2000
subjected to uniaxial tension with representation of coated and uncoated cell
response to increasing fluidic shear. ............................................................... 89

xii
Figure 7.2: Sample gating of flow cytometry scatter plots for PEGDA 2000 coated cells
before (a) and after (b) extrusion, and uncoated cells before (c) and after (d)
extrusion. The red circle indicates the gated region consistent with intact cells.
...................................................................................................................... 95
Figure 7.3: Cell viability for each assay type following extrusion for each polymer
coating. (* indicates statistically different means from the corresponding
uncoated group.) ............................................................................................ 96
Figure 7.4: Mechanical properties of each gel plotted against ethidium permeability assay
and scattering properties. (a) swelling ratios, (b) modulus, (c) ultimate tinsel
strength, (d) percent elongation at failure. Polymer legend, scattering data, and
ethidium assay data are vertically in line with one another for a specific
polymer. ........................................................................................................ 98
Figure 7.5: Cell viability for each assay type following exposure to high pressures (~25
bar) and rapid decompression (< 0.1s) back to atmospheric conditions......... 100
Figure 7.6: Cell viability for each assay type following exposure to shear forces in the
absence of pressure changes. (* indicates statistically different means from the
corresponding uncoated group.) ................................................................... 101
Figure 7.7: Viability assessed by EthD-1 and MTT assay following polymerization prior
to extrusion. (* denotes samples that showed a statistically significant drop (p <
0.05) in cell viability following extrusion.) .................................................. 103

xiii
LIST OF ABREVIATIONS
AC Acryloyl Chloride
ASL Antigen specific lysis
bBSA Biotinylated bovine serum albumin
BSA Bovine serum albumin
CTC Circulating tumor cell
DCM Dichloromethane
DIW Deionized water
DMEM Dulbeco’s modified eagle medium
DMSO Dimethyl sulfoxide
ECM Extracellular matrix
EGFR Epidermal growth factor receptor
EITC Eosin-5-isothicyanate
EL Elongation
EMT Epithelial to mesenchymal transition
EpCAM Epithelial cellular adhesion molecule
ER Estrogen receptor
EthD-1 Ethidium homodimer-1
FACS Fluorescent activeated cell sorting
FBS Fetal Bovine Serum
FITC Fluorescein isothiocyanate
FSC Forward scatter
gelMA Gelatin methacryloyl
HER-2 Human epidermal growth factor receptor-2
ICAM1 Intercellular adhesion molecule-1
IgG Immunoglobulin
LED Light emitting diode
MACS Magnetic activated cell sorting

xiv
MNBC Mononuclear blood cell
MTT 3-(4,5-dimethylthiazol-2-ly)-2,5-diphenyltetrazolium bromide
NHS N-hydroxy-succinimide
OPTN Organ Procurement and Transplantation Network
PBA Polymerization based amplification
PBS Phosphate buffered saline
PBSA PBS supplemented with BSA
PE Phycoerythrin
PEG Polyethylene glycol
PEGDA Polyethylene glycol diacrylate
PEGMA Polyethylene glycol monoacrylate
PBMC Peripheral blood mononuclear cell
PR Progesterone receptor
RBC Red blood cell
RPMI Roswell Park Memorial Institute medium
SA Streptavidin
SDS Sodium dodecyl sulfate
SSC Side scatter
TA Triethylamine
TEA Triethanolamine
TEMPO (2,2,6,6-tetramethyl-1-piperidinyl)oxy
TX Triton X-100
UTS Ultimate tensile strength
VP Vinyl pyrrolidinone

1
CHAPTER 1. INTRODUCTION
1.1 Introduction
Cell surface modifications are on the forefront in engineering in medicine because
of the numerous applications and potential benefits they enable. The surface engineering
of living cells is being applied in fields that range from drug delivery for specific diseases,
to immuno-camouflage for transplantations and transfusions, to cyto-protection from
chemical and mechanical insults. These modifications are achieved through a number of
pathways depending on the desired goal or application. Pathways include covalent
coupling, electrostatic interactions, antibody/antigen binding, hydrophobic insertion,
enzymatic reactions and more. Each of these pathways possess advantages and
disadvantages that may be better suited for a specific application over another. For
example, hydrophobic insertion is a technique that is fast and has the ability to insert a
large abundance of desired fluorochromes or functional groups to the cell surface.
However, this technique lacks the specificity that may be desired when dealing with a
heterogeneous population or when trying to isolate a specific cell phenotype.
Specificity is especially important in applications of viable cell sorting. The two
most common methods of isolation are magnetic activated cell sorting (MACS) and
fluorescent activated cell sorting (FACS). Both of these methods rely on surface binding
of phenotypic antigens to distinguish target cells from the rest of the population. MACS
uses magnetic micro beads functionalized with antibodies to bind with target cells. The
population is then subjected to a magnetic field in which bound target cells are retained
while antigen negative cells pass freely through the field. FACS is similar in its antibody
specificity but instead uses fluorochromes. With the help of flow cytometry, cells are

2
analyzed individually for a specified fluorescence channel intensity to determine antigen
positive events from negative events. These methods are both limited by the abundance of
the target antibodies at the cell surface. MACS binding must be strong enough to
immobilize target cells while allowing negative cells to pass through. FACS must bind
sufficient fluorochromes to amplify fluorescent intensity much beyond that of
autofluorescence and non-specific adsorption. Low availability of target surface antigens
greatly decreases the sensitivity of these sorting techniques. While magnetic sorting has
the ability of high cell throughput, it is accompanied with relatively poor isolation purity
when compared to FACS and requires moderately expensive reagents (biorecognition
magnetic beads). Isolation purity is very high for FACS, but at a cost of slow processing
and very expensive equipment. High purity isolation with fast processing time and
inexpensive equipment is greatly needed.
Our lab has developed a novel surface modification strategy in which cells are able
to be individually encapsulated in a thin hydrogel using visible light photoinitiated free
radical polymerization for high purity and high throughput isolation with common
laboratory materials. Hydrogel encapsulation is achieved through the immobilization of a
photoinitiator on the surface of living cells through antigen/antibody recognition. In the
presence of 530 nm initiating light, local polymerization occurs near the surface of target
cells encompassing them in a thin hydrogel while leaving non-target cells unaltered. This
hydrogel acts as a protective barrier to chemical and mechanical stimuli allowing this
technology to have a wide array of applications including cell isolation, or membrane
reinforcement for high throughput cell printing. This technology has the specificity of
antibody/antigen binding with high throughput processing making it a powerful tool in a

3
clinical setting. The system is very easily adapted to fit nearly any desired specification.
Immobilization of the photoinitiator on the surface of the cell can be achieved by
antigen/antibody binding, covalent coupling, or hydrophobic insertion making this a very
versatile technique. Polymer properties are also easily modified to obtain very specific
mechanical properties of the encapsulating hydrogel. Biodegradable moieties, degradation
kinetics, and modulus are all very easily adjusted within this system.
Here, multiple applications of individual cell encapsulation are evaluated, including
rare cell isolation for early cancer detection of circulating tumor cells, and mechanical
protection for high resolution 3D bioprinting. We first review the current methods of cell
surface modification and highlight the major applications of each technique as well as the
potential disadvantages of each within our applications. Then, we looked into isolation of
the highly sought after and rarely occurring circulating tumor cells (CTCs) for the potential
of a fluid biopsy for cancer screening. Major challenges of isolating viable and functional
CTCs are addressed, while also quantifying surface antigens of common cancer cell lines
to find potential targets for isolation strategies. Commonly, surface biomarkers are either
reported as positive/negative, as upregulated or downregulated expression levels. With the
most common types of cell sorting methods relying on surface expression levels of
phenotypic biomarkers, we quantify known metastatic markers in more translatable units
of molecules/µm2, and fold over mononuclear blood cells (MNBCs) as opposed to ‘high
or low’ as commonly reported. As detection of CTCs would depend on distinguishability
of positive events from whole blood, markers must be chosen appropriately as to limit
staining of MNBCs.

4
For the greatest efficacy in clinical applications, processing must be highly
standardized and of sufficient scale to handle the volumes of blood and number of cells in
such a fluid biopsy. To address the standardization of the polymerization process, we look
to commercially available fluorescein. Fluorescein isothiocyanate (FITC) is a commonly
used fluorochrome that is found commercially conjugated to a wide array of biorecognition
molecules. Fluorescein belongs to the same family of xanthene dyes as the currently used
initiator, eosin-5-isothiocyantate (EITC). We assess the potential polymerization power of
using FITC vs EITC in both cellular studies as well as hydrogel film generation on micro
array slides which model the cell surface. In order to ensure that this technology can handle
the necessary volumes and cell numbers associated with clinical applications, we
systematically analyze each parameter associated with the polymerization process.
Parameters such as fluid volume/depth, variation in observed light intensity, chamber
material, meniscus effects, and more were studied to determine what aspects of the process
play the largest roles. This data may allow us to scale the process one to two orders of
magnitude to very feasibly handle the fluid volumes associated with a fluid biopsy.
We assess different applications of this same technology. Individual cell
encapsulation provides membrane reinforcement protecting the cell from mechanical
stimuli associated with fluid flow similar to that observed in high resolution 3D printing.
With ultimate goals of printing viable organs for transplantation, high print rates are
necessary to print on a feasible time scale while single cell resolutions are key to
incorporating vasculature for sustainable viability. Pairing these two requirements
drastically increases the shear forces observed with fluid flow through a pipe which can
mechanically lyse cells hindering the viability of a printed structure. We study a range of

5
monomer formulations that result in polymer coatings that have vastly different mechanical
properties. Coated and uncoated cells are subject to intense mechanical forces as they are
extruded through a 50 µm diameter capillary at flow rates well above what is currently
used in 3D bioprinting. We then correlate the protection potential of each of these polymer
coatings with the observed mechanical properties of bulk hydrogels as well as the viability
of cells upon extrusion. In the growing field of regenerative medicine, protection from
inherent mechanical stimuli during the printing process is invaluable.
The wide range of applications and standardized processing of single cell
encapsulation makes this technology highly desired. Adaptation of the monomer coating
for controlled biodegradation, or enhanced surface functionalization of the outer coating
ensures that this technology is dynamic to the needs of future applications as the world of
engineering and medicine evolve around us.

6
CHAPTER 2. BACKGROUND
2.1 Protection
Interest in cell surface modification primarily began in the 1980s with focus on
harnessing pancreatic islets and their function for treating diabetes[1-3]. In cell therapeutics
like islet transplantation, as well as any sort of allo- or xenographic transplant, immune
response is a major concern. Upon injection of foreign cells, immune response of the host
can eliminate injected cells through antibody recognition and macrophage recruitment
which limits the efficacy of such treatments. T-lymphocytes or T-cells play a major role in
cell-mediated immune response of foreign tissue through the recognition of major
histocompatibility complex molecules found on the surface of nucleated cells. Currently,
treatments to minimize host rejection are through drug mediated T-cell suppression. These
drugs have major drawbacks including numerous side effects and chronic toxicity. As a
physical alternative to immuno-suppressive drugs, research is being conducted in
immunoisolation or immunocamouflage to accomplish similar goals [4, 5]. This concept
was reported early on with the observation of continued functionality with polymer
protected pancreatic islets [1, 2]. Modification or encapsulation of cells within a relatively
bioinert material can protect the cells from a host immune response [5]. Polymeric
networks with tuned mesh sizes can sterically prohibit large molecule permeability, such
as antibodies, while still allowing small molecules such as oxygen and glucose to pass
freely [1, 3, 6]. This allows the cells to remain viable and function normally while
remaining hidden from natural immune responses of the host [3].
Since the initial focus on the transplantation of pancreatic islets, interest in surface
modification has spread to many different cell types [7]. This concept of immunoisolation

7
has been thought to be a potential source for a universal blood ‘type’ or rather allowing
any blood type to be received no matter the recipient’s type. The engraftment of bioinert
molecules on the surface of red blood cells sterically blocks the host from recognizing the
ABO antigens initiating an immune response against the donor blood [4]. A schematic of
this concept is illustrated in Figure 2.1. In the early studies, cells were reacted with one end
of long or bulky polymer chains. This was accomplished through covalent attachment of
methoxypolyethylene glycol [5] or hyperbranched polyglycerols [8] with the commonly
used N-hydroxy-succidimidyl ester (NHS). NHS reacts readily with primary amines found
on proteins forming a covalent link.
Figure 2.1: Schematic of immunoprotection by physical barrier from covalently bound
hypderbranched polyglycerols to the cell surface from (a) antibody recognition,
(b) immune cell interaction.
Many other types of surface modifications, including inorganic coatings, have been
studied for their potential to protect the cell from harmful environments. Due to the lack of
a structurally rigid cell wall, mammalian cells are far more susceptible to toxins and
biological stimuli than many other cell types. Coatings have been developed to protect

8
these vulnerable cells from harsh stimuli such as oxidative stresses, enzymatic attack, and
other cytotoxic molecules. In a similar manner to covalent immunoisolation,
physiochemically adsorbed silica has been used to form a protective barrier on mammalian
cells to protect them from enzymatic attack by trypsin and the cytotoxic agent
poly(allylamine) hydrochloride [9]. An inorganic-organic hybrid coating has also shown
protective potential of mammalian cells. Tannic acid binding to the surface of the cell
followed by complexation with FeIII has shown protection from the cytotoxic agent
polyethyleneimine, again through a physically formed barrier. This coating also provides
protection from UV-C radiation due to the ability of tannic acid to absorb UV rays [10].
Surface modifications also have applications for protection against chemical stimuli by
using reactive moieties in contrast to inert steric barriers. By functionalizing the surface of
red blood cells with a known radical scavenger, (2,2,6,6-tetramethyl-1-piperidinyl)oxy
(TEMPO), these cells were protected from oxidative damage in an in vitro model [11].
These red blood cells were functionalized with TEMPO through covalent coupling of NHS
to primary amines of lysine groups found on the surface proteins of erythrocytes.
2.2 Drug Delivery
Functionalization of cellular surfaces extends from cell protection to drug delivery
as well. The vast majority of drugs are currently delivered to target sites by passive
transport through air ways and the circulatory system. With developments in nanoparticle
systems, drug delivery has made great strides in recent years. However, passive transport
is often accompanied by minimal targeting, short circulation time, and undesired systemic
effects [12]. By harnessing the mobility and homing ability of living cells, drugs can be
delivered more effectively through active transport increasing targeting ability and

9
retention time within the body [12, 13]. In this concept, the therapeutic agent is attached to
the surface of cells by a degradable or diffusive polymer where it is carried directly to the
site of interest for release, or is maintained in circulation for controlled release.
As with applications in cell protection, the cell surface provides a range of
biomolecules and functional groups to which nanoparticles or patches can be attached. The
simplest method for cells to become drug carriers is through nanoparticle adsorption.
Adsorption can be dominated by electrostatic interaction, hydrophobic interaction, and van
der Waal forces depending on the particle being attached [7, 14, 15]. Living cells have a
largely negative charge on the surface due to charged functional groups that make up the
cell membrane. This negative charge creates a simple electrostatic attraction when using a
cationic nanoparticle or polyelectrolyte multilayer patches [16]. The lipid bilayer of the
cell presents a hydrophobic site within an aqueous environment for hydrophobic functional
groups to favorably interact. Each of these functionalization methods are non-specific to
cell phenotype. Through non-specific binding, polystyrene nanoparticles have shown
greater retention times while attached to red blood cells (RBCs) than nanoparticles alone
in vivo [14]. Non-specific adhesion to RBC surfaces has one advantage of allowing the
surface of the nanoparticle to be functionalized with other delivery applications instead of
purely for cell binding motifs. Nanoparticles for potential drug loading have also been
covalently attached to red blood cells (RBCs) with minimal effects on clearance times and
immunogenic pathways [8]. Hyperbranched polyglycerol (HPG) nanoparticles have
similar biocompatibility as PEG due to their molecular similarities but do not have the
potential recognition by PEG antibodies [17] found in some healthy patients. This is
especially important for applications with goals of extended drug circulation time; antibody

10
recognition would clear functionalized RBCs at a much faster rate than unmodified or
unrecognized cells.
For a greater target specificity than is possible by passive transport, surface
modification of homing cells is attracting significant attention [7, 18]. Cellular patches can
be attached to the surface of living cells in similar ways to that of nanoparticles. Hydrogel
patches have been successfully attached to the surface of living cells through localized
photopolymerization [19]. Using initiator functionalized cells and a photomask, very small
sections of cells can be exposed to radiation resulting in extremely localized hydrogel
formation [19]. These patches have the potential to be loaded with small molecule drugs
and carried to target sites by the mobility of cells. Homing cells such as macrophages and
T cells are prime targets for drug vehicles [18, 20].
2.3 Isolation
Surface modifications for high purity cell separation and isolation are more efficient
when compared to specific culturing or density gradient centrifugation as they yield higher
purities than gradient centrifugation and are completed in much less time than specific
culturing. High purity cell isolation is a desired process in many applications including
stem cell therapies, cellular function studies, and circulating tumor cell (CTC) isolation.
Of all surface modification strategies, antibody/antigen binding is the most
common and most effective method of initial binding in applications of cell sorting from a
heterogeneous population. Surface proteins and expression levels on cells vary drastically
depending on species, phenotype, maturity and the surrounding environment [7, 21, 22].
The heterogeneity and large number of surface markers introduces the ability to distinguish
subtypes of cells within a mixed population through the highly specific binding of an

11
antibody to a particular surface antigen. Distinguishability of subtypes or rare populations
becomes very difficult when the distinguishing antigen is expressed in low surface
densities. Initial studies in our lab have shown that the stem cell marker CD34 on stem
cells isolated from human cord blood can be as low as on the order of 10 molecules/µm2,
while other phenotypic antigens such as epithelial cell adhesion molecule (EpCAM) on
epithelial cells can have expression levels on the order of 103 molecules/µm2 [21]. When
targeting cancer cells in peripheral blood, typically markers that are characteristic to the
epithelial phenotype are chosen, such as EpCAM. However, tumor cells are believed to
enter into circulation in part through a phenomenon known as the epithelial to
mesenchymal transition (EMT). In addition to EMT, tumor cells are also believed to spill
into leaky vasculature to create CTCs, which then often results in metastatic disease[23,
24]. In applications of CTC isolation, efforts to better understand EMT are underway.[23-
28] In EMT, tumor cells go through a reversible process where they lose many of their
adhesive epithelial traits and take on a more invasive mesenchymal phenotype. Whether
this happens before entering circulation or once in the peripheral blood, the expression of
the commonly targeted surface markers is decreased. The rarity of these cells paired with
the change in surface antigen expression has made the enumeration, isolation, and
functional study of these highly impactful cells very difficult.
The two most common types of cell sorting methods currently being used are magnetic
activated cell sorting (MACS) and fluorescent activated cell sorting (FACS). Antibody
recognition is used for both of these sorting techniques to distinguish cell types in a mixed
population. Each of these methods have their own advantages and disadvantages making
them better suited for different applications. MACS has the primary advantage of high

12
sorting speed. Magnetic micro beads are functionalized with biorecognition molecules
which are typically either a generic species’ secondary antibody or streptavidin. The mixed
cell population is first treated with a normal primary or a biotinylated primary antibody
that is specific to only the target cell type. Once the primary has bound to the target cells,
the magnetic microbeads are introduced to the system. Through the highly energetically
favorable binding of primary to secondary antibodies, or biotin to streptavidin, magnetic
microparticles bind to the surface of the cells creating a cell-bead complex of target cells
that is susceptible to magnetic fields. Separation is then accomplished by passing the cell
suspension through a column that is within in a strong magnetic field. Non-complexed cells
pass through the column into a collection container, while antigen positive cells are
retained at the wall of the column within the magnetic field. Finally, the column is removed
from the magnetic field where antigen positive cells are washed from the column and
collected. FACS uses the same type of antibody labeling to initially distinguish between
target and non-target cells. Surface markers are labeled with fluorochromes rather than
magnetic beads. Cell separation is achieved through the use of a flow cytometer. The flow
cytometer uses microfluidic alignment of the cells to pass them through an excitation laser
and analyze each cell individually for a range of fluorescent markers. After cells pass by
the fluorescent detectors the microfluidic stream is then aerosolized into droplets
containing individual cells. Droplets containing positive fluorescence are then
electronically charged. The stream of droplets is passed through an electric field where
droplets are diverted into separate containers based on their charge. The individual cell
analysis and aerosolization for separation limits throughput of FACS. The initial labeling
of the target antigen with its antibody is identical for each process. However, the sensitivity

13
and specificity, along with the overall processing time are vastly different. MACS has a
much lower specificity than that of FACS. Magnetic separation has the risk of physically
trapping non-target cells within clusters of target cells and magnetic beads. FACS has the
ability to adjust the sensitivity and specificity of sorted cells. In flow cytometry, it is up to
the user’s discretion to determine the cutoff of what fluorescent intensity is considered
positive or negative. MACS has much less control. Sensitivity in magnetic separation is
governed by the cell’s ability to remain bound to the magnetic bead as the beads are pulled
toward the wall of the column and antigen negative cells pass through. This can become a
major problem if the surface expression of the target antigen is low. Since FACS uses
fluorochromes to detect antigen positive vs. negative cells FACS is not limited to surface
antigens. If cell viability is not desired, fixation followed by permeation and fluorescent
labeling allows for a wider range of intracellular phenotypic biomarkers to be used as
potential targets. In practice, the majority of cell sorting applications require cell viability
to be preserved for use or functional study of the target cells.
CellSeach is currently the only FDA approved method for clinical enumeration of
CTCs. This system combines the MACS with flow cytometric analysis in order to
enumerate CTCs for prognostic information in some cancers. Metastatic breast, prostate,
and colorectal cancers have been shown to display poorer prognosis in patients that exhibit
a CTC concentration above a given threshold. CTC concentrations >5 cells per 7.5 mL of
blood for breast [29] and prostate [30] cancer, and >3 cells per 7.5 mL of blood for
colorectal cancer [31] has been show to indicate a less favorable prognoses for these
metastatic cancers. Along with the significance in CTC presence, the lack of CTC’s among
healthy or non-metastatic patients highlights the fact that CTC specific to metastatic

14
disease, and supports the need for continued research of CTC behavior. Only 0.3% of
healthy patients exhibit CTC concentration ≥2 CTCs in 7.5 mL of blood [32]. CellSearch
first uses MACS as a pre-enrichment step. Magnetic micro beads functionalized with the
antibody against EpCAM are used to positively select cells possessing characteristics of
the epithelial phenotype. The collected cells following MACS are then fixed,
permeabilized and intracellularly stained for cytokeratin and leukocyte common antigen
(CD45). Cell analysis is achieved through the use of a Celltracks Analyzer II to identify
cells that are positively fluorescent for cytokeratin, and are also negative for CD45. The
Celltracks Analyzer II is an automated fluorescent imaging machine in which images of all
positive events are obtained for confirmation by the operator. Pre-enrichment using MACS
decreases the analysis time by reducing the number of cells to be analyzed by flow
cytometry as well as visually, but it is still a limitation in the event that the process be
scaled to larger batches. However, the largest problem with CellSearch is the lack of viable
cells following isolation. Although this is a powerful tool for prognosis, it sheds no light
on the functional properties of CTCs. This system serves its purpose of enumeration
relatively well, but has no translation into further applications due to cell fixation. Pairing
the statistical data of poor prognosis with the presence of CTCs and the absence of
epithelial cells circulating in healthy patients, with the still uncertain mechanism of
metastatic progression and EMT illustrates a need for an isolation technique that results in
viable CTCs for further investigation as well as prognosis.
2.4 Antigen Specific Lysis
A novel cell isolation method has been developed in our lab that combines the
benefits of MACS sorting speed, and FACS high purity sorting, called antigen specific

15
lysis (ASL) [33]. ASL uses surface initiated photopolymerization to encapsulate and
protect specific cells from chemical lysis in the presence of harsh surfactants. Through the
same utilization of primary antibody recognition, ASL preserves the same specificity as
that of FACS for immobilization of a visual light photoinitiator onto the surface of target
cells. Suspending the cell population in an acryloyl monomer solution containing a tertiary
amine co-initiator followed by irradiation with 530 nm initiating light, results in rapid local
polymerization fully encapsulating target cells. Once target cells are protected, the cells are
subjected to harsh environments such as hypotonic conditions or surfactants that effectively
lyse all antigen negative cells. This leaves behind essentially a 100% pure population of
target cells. ASL provides the high throughput advantages of magnetic sorting and the same
purity of fluorescent sorting all with relatively inexpensive materials. These traits make
this technology highly desired in clinical applications of many sorts. The versatility of ASL
is governed largely by cytocompatibility of the monomer solution. As regenerative
engineering and cellular therapies continue to be highly researched, the choice of
cytocompatible monomers is much less of a challenge than in previous years. PEG based
monoacrylates and diacrylates (PEGMA and PEGDA) of many molecular weights, gelatin
methacryloyl, alginate, poly(lactic acid), and more have been successfully used with living
cells while maintaining cell viability [34-36]. A wide variety of monomer materials
available for use with cells means that polymer properties can be highly tuned to desired
specifications. Whether polymer mesh size, degradability, or hydrogel mechanical
properties need to be tuned, simple adjustments in monomer formula can be made without
significantly effecting processing time or targeting specificity.

16
The use of a visible light photoinitiator eliminates the possibility of UV mediated
damage [37] to cell DNA. Eosin Y is a type II, photoinitiator that is excited by light that is
530 nm; well out of the UV range. It is a member of a class of dyes derived from xanthene
[38]. Apart from operating in the range of visible wavelengths, eosin is extremely powerful
due to its ability to generate a large number of initiating radicals per fluorophore [39-41].
Type I photoinitiators are photocleavable molecules that degrade into two radical species
[42] effectively limiting the molecule to a maximum of two initiated polymer chains. Once
these radicals are terminated, polymerization ceases. Eosin however, has the ability to
regenerate. Type II photoinitiators require a co-initiator to produce an active radical and
allow the molecule return to its ground state without degradation[41]. A proposed initiating
mechanism for eosin is first through the absorption of a photon electronically exciting the
dye. The molecule undergoes a phenomenon called intersystem crossing from the singlet
excited state to a triplet excited state. Here the initiator reacts with a co-initiator, commonly
a tertiary amine, to yield radical species. It is believed that electron transfer from the tertiary
amine to the excited eosin molecule followed by proton abstraction from the amine to the
eosin results in two neutral radical species, a radical amine and an eosin radical [40]. Of
these two, the radical amine is much more reactive to acrylate groups than that of the eosin
radical and therefore is primarily responsible for the initiation of propagating chains [38,
41]. Once initiation of a chain is achieved, propagation and termination proceed as normal
free radical polymerization reactions. As the active chains propagate, the excited eosin
radicals then return to the ground state where they can be excited to generate more amine
radicals. Initiation will continue as long as irradiation continues and there are sufficient co-
initiator molecules in solution, until all eosin molecules are photobleached. While the eosin

17
initiator is tethered to the surface of the cell, the amine which becomes the amine radical
is not. Diffusion of active radical species, and therefore monomer molecular weight, away
from the cell surface plays a critical role in film formation. The curvature of the cell in
relation to the film thickness and monomer lengths permits for modeling using a planar
surface. Primary diffusion concerns are unidirectional away from the cell surface. If
diffusion of active radical species away from the cell surface occurs at higher rates than
chain propagation, polymer or oligomer formation may occur without achieving full
encapsulation. A typical characteristic of free radical polymerization is the high reaction
rate due to the high reactivity of most radical species. In our applications, monomers have
a functionality >2 which results in a covalently crosslinked network. At high monomer
conversion, the crosslink density or pore size within the network is greatly governed by the
molecular weight of the major monomer species. The crosslink density determines what
molecules may diffuse through the hydrogel film and what is restricted, which is critical to
protection from surfactants as well as immune response in vivo. Termination is achieved
by a few possible reactions. Active radical chains can undergo combination reactions with
other active chains, radical initiating species, or radicals that are a result of chain transfer
reactions. Active radicals can also be quenched by residual oxygen within the system,
which is why the polymerization is carried out under an inert nitrogen atmosphere.
This polymerization process and powerful initiating mechanism has proved
very useful in sensitive detection of biomolecules on micro array slides. Polymerization
based amplification (PBA) capitalizes on eosin’s ability to continue to generate radicals
while under irradiation to form polymer films entangled with fluorescent nanoparticles
for easy detection [43-45]. It has been shown on micro array slides that
biomolecules can be

18
recognized in surface densities <0.2 molecules/µm2,and can amplify fluorescent signal by
100 fold over standard fluorescent methods [43].
Figure 2.2: Schematic of the polymerization procedure for micro array and cell surface
polymerization.
For cellular applications, this translates to improved biorecognition of low
surface expression antigens. Figure 2.2 illustrates polymerization process on micro
arrays as well as cellular surfaces. Achieving full encapsulation while targeting low
expression molecules is essential in CTC and stem cell isolation. Low expression
levels for MACS or FACS results in poor magnetic bead binding or weak fluorescent
signal to distinguish between positive and negative populations. Using the PBA system
in ASL, we can overcome the surface expression challenge by adjustments in irradiation
time and monomer formula.
2.5 Mechanical Protection
ASL technology provides mechanical protection in applications of bioprinting
as well. Three-dimensional printing has gained substantial momentum in the past
few decades. 3D printing of anatomical structures has been used in the medical field to
better help visualize and understand complex morphologies in ways that a 2D depiction
could not
19
capture. In surgical planning, imaging and subsequently printing target organs or anomalies
of surgical interest allow for a more well-planned surgical process [46, 47]. More recently
3D printing has been used with biomaterials to print cellular and acellular scaffolds for
tissue engineering in regenerative medicine [48-54], 3D organ-on-a-chip platforms for in
vitro drug screening [55, 56], and even functional prosthetics [57, 58]. As goals approach
the printing of large scaffolds and whole organs, the need for high throughput and high-
resolution printing is evident. Mechanical forces are inherent in fluid flow and become a
much larger issue on the microfluidic level when dealing with live cell printing. Many
commercial bioprinters are extrusion-based printers that use pressure driven or
mechanically driven flow to push fluid through a small orifice or nozzle in a direct-write
fashion [59]. Shear forces are the forces created by a radial velocity gradient of the fluid in
laminar flow through a tube. These shear forces increase with higher flow rate and smaller
nozzle diameter, both of which are desired for whole organ printing. These shear forces
have the ability to damage the membrane or completely lyse cells as they pass through the
nozzle during printing. This is the largest disadvantage to extrusion-based printers and
poses a problem to large, functional organ printing. Commonly, 3D cell printing is done at
resolutions much greater than that of a single cell (150-300 µm nozzle diameter; epithelial
cell diameter ~10-20 µm) at flow rates that are typically on the order of 1-10 µL/min [60-
63]. With these print rates it would take 102 days to print one large organ and still without
achieving the necessary detail of high-resolution printing. To achieve the necessary detail
involved with printing vasculature, single cell resolution is highly desired. Much work has
been done to try to minimize shear forces experienced by cells such as altering print heads
[64], using low viscosity bioinks [65] or using shear thinning fluids [63]. Printing

20
techniques have been able to print with high cell viability, but still with moderate resolution
and relatively low throughput. More research must be done to achieve the resolution and
throughput for plausible organ printing.
The same technology that provides protection against chemical stimuli for high
purity isolation also has the ability to provide protection against mechanical forces.
Through individual cell encapsulation, the hydrogel coating provides membrane
reinforcement against mechanical stimuli. As cells travel through a narrow tube, the shear
forces create a tensile strain on the cellular membrane. In high flow rates the tensile strain
becomes more than the membrane can withstand causing cell lysis. Hydrogel coatings
possessing the proper mechanical properties support the membrane allowing the cells to
remain intact upon intense shear forces.

21
CHAPTER 3. MATERIALS AND METHODS
3.1 Poly(ethylene glycol) diacrylate synthesis
Synthesis of poly(ethylene glycol) diacrylate was performed as described
previously [33]. For PEGDA 3400 25 g of poly-(ethylene glycol) (PEG; Mn ~3000-3600
Sigma) were added to a round bottom flask and purged with ultra-pure nitrogen for 10 min.
Anhydrous dichloromethane (DCM; 75 mL) was added to the flask and PEG was allowed
to dissolve under magnetic stirring for 5 min. A water bath was used as a heat sink for the
round bottom flask while stirring continued. Triethylamine (TA; Sigma) and acryloyl
chloride (AC; Sigma) were used with PEG in a 1:4:4 mole ratio of PEG:TA:AC. TA (4.25
mL) was added directly to the dissolved PEG under continuous stirring. AC (2.4 mL) was
mixed with DCM (12.4 mL) and added to the top of the addition funnel by injection through
a septum and purged with nitrogen for 15 min. AC/DCM was then added dropwise to the
PEG/TA/DCM mixture at a rate of ~ 1 drop every five seconds under continuous stirring
and nitrogen purging. Once all of the AC/DCM was added, the flask was sealed and
covered with foil to react overnight under continuous stirring. The reaction mixture was
then filtered through a Buchner funnel and washed with excess DCM to remove insoluble
TA salts. Then 10-fold molar excess sodium carbonated was added to the mixture and
stirred for 1 hour, followed by filtration through a Buchner funnel and washed with DCM
removing any insoluble sodium carbonate. The solution was then passed through a bed of
alumina (Sigma, ~ 3-5 cm thick) in a glass frit column and washed with DCM. The DCM
was evaporated off using a rotary evaporator until ~ 50-100 mL of DCM remained.
PEGDA was precipitated out using ~ 10 x the DCM solution volume of cold ether. Solution
was kept at 4 ˚C for 1 h to ensure precipitation. Precipitated solids were collected by

22
filtration with a Buchner funnel and allowed to dry in the dark, under vacuum overnight.
Precipitation in cold ether was repeated for further purification as needed. Polymer
structure and acrylation was determine by H1 NMR (DMSO). Acrylation was confirmed
by the characteristic peaks for the three hydrogens bound to the carbon-carbon double bond
of the acrylate functional group. PEGDA 1000 (PEG Mn ~950-1050; Sigma), and PEGDA
2000 (PEG Mn ~1900-2200; Sigma), were synthesized following this procedure using the
same reagent equivalents.
3.2 Cell culture
All cell types were cultured in medium supplemented with 10% FBS (VWR) and
1% penicillin/streptomycin (VWR) at 37 ˚C and 5% CO2. H9C2 (ATCC CRL-1446) rat
cardiac myoblasts were cultured in Dulbecco modified eagle medium (DMEM, HyClone).
Human non-small-cell-lung cancer lines (A549 and H358; ATCC CCL-185 and ATCC
CRL-5807 respectively) and human breast cancer lines (T47-D, MCF-7, MDA-MB-231;
ATCC HTB-133, ATCC HTB-22, ATCC HTB-26 respectively) were cultured in Roswell
Park Memorial Institute (RPMI 1640) medium.
Cells were seeded in 75 cm2 tissue culture flasks (VWR) for 24-72 h and were 80-
95% confluent prior to use. Cells were harvested using 0.25% Trypsin-EDTA 1X (VWR)
for 90 s. Then, cells were collected and washed with 5 mL medium to neutralize the trypsin.
Cells were centrifuged at 4 ˚C and 400 x g for 3 min, supernatant was aspirated and cells
resuspended in 1 mL PBS for one wash. Cells were washed twice and resuspended in PBS
(HyClone) for processing.

23
3.3 Viability assays
Cell viability was assessed through multiple methods. Metabolic activity was
assessed through the use of the MTT assay. The MTT assay is a colorimetric method used
to measure mitochondrial activity within the cell giving information on viability and
proliferation relative to a control group of unprocessed cells. 3-(4,5-dimethylthiazol-2-ly)-
2,5-diphenyltetrazolium bromide (MTT; Thermo) is a water soluble dye that in the
presence of active mitochondrial reductase is reduced into (E,Z)-5-(4,5-dimethylthiazol-2-
ly)-1,3-diphenylformazan (formazan), a water insoluble dye. An equal number of cells
(~10,000) from each sample were incubated in 200 µL of medium with 0.45 mg/mL MTT
for 3-4 hours at 37 ˚C (n ³ 3 for each sample). All separate samples were measured in a 96
well plate (Celltreat). After incubation, the plate was centrifuged, wells were aspirated and
well contents were solubilized in 200 µL of DMSO (Sigma). Absorbance of 570 nm light
for each well was measured using a Biotek plate reader. Absorbances for each sample were
averaged and normalized to control cells for relative viability.
Viability by membrane permeability was measured using ethidium homodimer-1
(EthD-1; Thermo Fisher). EthD-1 is a large, membrane impermeable dye that binds to
nucleic acids. It is a red fluorescent dye that is weakly fluorescent until bound to the
nucleus. Due to size of the molecule, the dye is only able to permeate the membrane of a
dead or damaged cell. Healthy cells with complete membrane integrity will show little or
no fluorescence. EthD-1 assays were conducted at a concentration of 2 µg/mL with cells
in PBS at room temperature for 5 mins. Viability was assessed by fluorescent microscopy
and flow cytometry.

24
3.4 Cell tracking
Syto 62 deep red nuclear stain was utilized for cell tracking through cell processing.
The Syto dye is a membrane permeable nucleic acid stain which allowed for better accuracy
during processes that involved cell membrane fragmentation. This stain was used at 1
µg/mL for 5 min on ice. Cells were then washed 2x in PBS before further processing.
3.5 Micro array printing
As a model of the cellular surface protein expression, biotin printed micro array
slides were used. Biotinylated bovine serum albumin (bBSA; Thermo Fisher) was printed
in serial dilutions of 1000, 400, 160, 64, 25.6, and 0 µg/mL. All dilutions were made with
a 1000 µg/mL solution of bovine serum albumin (BSA; Sigma) in PBS (PBSA) in order to
keep the total protein concentration constant at 1000 µg/mL. Micro arrays were printed
using an Affymetrix 417 Arrayer, and Array It epoxy coated microscope slides at 60%
humidity. Each micro array consisted of six columns of the different bBSA concentration,
with each printed four times to make up a 4x6 array. Two arrays were printed on each slide
to be centered within the wells of the Whatman chip clip slide holder. Once printed, slides
were placed back in slide boxes away from light to dry for >12 hours under ambient
conditions. One slide from each batch was analyzed using a streptavidin-Cy3 (SA-Cy3;
Thermo Fisher) conjugate and micro array scanner. SA-Cy3 labeling was performed as
described below for SA-EITC labeling with a working solution of 20 µg/mL SA-Cy3 in
PBSA. Slides were scanned on a Affymetrix 428 Array Scanner using the 532 nm laser
line and 570 nm absorbance. Fluorescent intensities were compared to a Cy3 calibration
slide to ensure successful and consistent bBSA printed surface densities.

25
3.6 Micro array polymerization
Biotinylated BSA (bBSA) slides were placed in a Whatman chip clip side holder
for processing. Each well of the micro array slide was processed one at a time to ensure no
photo-bleaching of the photo-initiator. The well was first washed with 400 µL of 1 mg/mL
BSA in PBS (PBSA) to remove any unreacted bBSA. A blocking step was then performed
by incubation of 400 µL of PBSA for 40 min at room temperature, covered from light.
bBSA printed arrays were functionalized with streptavidin-eosin isothiocyanate (SA-
EITC) or streptavidin-fluorescein isothiocyanate (SA-FITC) by incubation with 400 µL of
~30 µg/mL SA-EITC or SA-FITC in PBSA for 30 min covered from light. Following
initiator labeling, the well was washed 3x with PBS to remove any unreacted SA-EITC.
PEGDA (Mn = 575, 700, 1000, 2000, 3400) monomer formulations were as follows: 25%
wt/v PEGDA, 35 mM triethanol amine (TEA; Sigma), and 35 mM vinyl pyrrolidinone (VP;
Sigma). PEGDA Mn 575 and 700 were purchased from Sigma, while Mn 1000, 2000, and
3400 were synthesized in house based on published protocols [33]. 350 µL of monomer
solution were place in the chip clip well prior to irradiation. The chip clip was placed inside
a polymerization chamber constructed of two petri dishes and purged with ultra-pure
nitrogen for 5 min at 0.8 standard L/min. Nitrogen was bubbled through water prior to
entering the purging chamber to decrease evaporation of the aqueous monomer solution.
After purging, nitrogen flow rate was reduced to 0.2 standard L/min to further reduce
evaporation of the sample. Irradiation was achieved using two possible sources, both at the
same intensity of ~35 mW/cm2, for 10 min. One lamp is a small, collimated LED (M530L3,
Thorlabs) and the other is a large LED array lamp (Photon System Instruments). Both
lamps are green LEDs centered near 530 nm. Following irradiation, slides were removed

26
from the chip clip, washed with DI water, and allowed to dry over-night before further
analysis.
3.7 Profilometry
Profilometry gives topographical information in very fine resolution. Here we
used it to measure step height of the film generated in localized polymerization in micro
arrays on initiator labeled spots. Micro arrays were polymerized and allowed to dry for
>12 hours before profilometry on a Daktek 6M Profilometer. Profilometer scans were
done on all four spots for each individual bBSA print concentration. Profilometry uses
optics to measure deflection angle of light from a cantilever in contact with the surface of
the sample. Scans were done at 1 mg of force with a scan rate of ~40 µm/s. Scans were
zeroed on both sides of each spot before measurement.
3.8 Streptavidin-fluorophore conjugation
The photoinitiator, eosin isothiocyanate (EITC), was conjugated to the
biorecognition molecule, streptavidin (SA) as reported previously [66]. First, 0.1 M sodium
bicarbonate (pH ~8.3) was mixed with 0.1 M sodium carbonate (pH ~11.3) to obtain a
carbonate buffer of pH 10.2. Then 95 µL of 10 mg/mL SA in carbonate buffer was mixed
with 9.5 µL of 10 mg/mL EITC in DMSO. The mixture was covered from light and placed
at 4 ˚C for 8-12 h. The mixture was then diluted with 1 mL PBS before purification. The
SA-EITC conjugate was purified by passing through a 7 kDa molecular weight cut off
desalting column (Zeba Spin, Thermo Fisher). Conjugate ratio was determined using UV-
VIS absorbances at 530 nm and 280 nm (NanoDrop 2000, Thermo Scientific). Using
standard absorbance curves of SA and EITC alone, absorbance corrections were made and

27
ratios were calculated as described previously [66]. Typical SA-EITC ratios range from 4-
6 EITC molecules per SA. Chapter 5 experiments containing SA-FITC and SA-Cy3 were
processed identically measuring absorbances at 495 nm and 550 nm respectively.
3.9 Cell encapsulation
Cells were cultured and harvested as described above. The polymerization
procedure was the same for all cell lines unless stated otherwise. Samples were split into
1.5 million cell aliquots for encapsulation. Biotin was covalently labelled to cell surface
proteins using a biotin-succinimidyl ester conjugate (NHS-biotin; EZ-link Sulfo-NHS-LC-
Biotin, Thermo Fisher). Cells were incubated in 250 µL of 0.55 mg/mL NHS-biotin for 40
min on ice, then washed 3x in PBS. Eosin was then conjugated to the cells using an in-
house synthesized streptavidin (Thermo Fisher)-eosin isothiocyanate (EITC, Sigma)
conjugate (SA-EITC, as described above). Cells were incubated in a PBS solution of ~30
µg/mL SA-EITC for 30 min on ice covered from light. The sample was then washed 3x in
PBS before introduction to the monomer solution. After the final wash in PBS, cells were
pelletized, aspirated, and resuspended in 350 µL of monomer solution. PEG based
monomer solutions were all the same as described for micro array polymerization
above. Gelatin methacryloyl (gelMA) monomer formulations contained 3% wt/v gelMA,
1 % wt/v PEGDA 3400, 35 mM TEA, and 35 mM VP. All monomer formulations were
adjusted to pH 7.3-7.5 for use with living cells. This monomer/cell suspension was
transferred to a chip clip (Whatman) containing a glass slide and placed in a chamber
constructed of two 150 mm clear polypropylene tissue culture dishes. This chamber was
purged with nitrogen with a water bubbler for 5 mins at 0.8 standard L/min before
irradiation. During irradiation, nitrogen was reduced to 0.2 standard L/min to reduce
evaporation of the sample. Cells were

28
irradiated with a 530 nm collimated LED lamp (Thorlabs) at 35 mW/cm2 for 10 min for
the surface polymerization reaction. After polymerization, cells were removed by pipette
and the chip clip was washed 2x with 500 µL PBS. The glass slide was then removed and
scraped with a cell scraper to ensure maximum cell recovery. Cells were washed 2x in PBS
and strained with a 40 µm cell strainer (VWR) to remove any cell aggregates and bulk
polymer particles prior to further processing.
3.10 Hypotonic Challenge
Hypotonic challenge was performed on cells for proof of encapsulation. Cells
without membrane reinforcement will swell and burst in the presence of pure water, while
fully coated cells will remain intact. Cells were centrifuged and aspirated, then resuspended
in DI water at ~ 20,000 cells/mL. Cells remained in DI water for 10 mins at room
temperature. Tonicity balance was restored using 10x PBS before flow cytometry or
viability analysis.
3.11 Surfactant Challenge
Surfactant challenged cells were suspended in PBS prior to introduction of Sodium
dodecyl sulfate (SDS) or Triton-X (TX) 100 (both Sigma). A 10% wt/v solution of SDS,
and a 5 mM solution of TX in PBS were made as stock solutions. Surfactants were
introduced to the suspended cells in a 1:2 dilution. Cells observed surfactant concentration
was 5% wt/v for SDS and 2.5 mM for TX, which are 20x and 10x the concentration of the
critical micelle concentration respectively. Cells were incubated in a particular surfactant
solution for 10 min at room temperature. Cells were then centrifuged, aspirated and washed
with PBS before flow cytometry or viability analysis.

29
3.12 Extrusion
High throughput, high-resolution cell printing was simulated by extrusion of a cell
suspension through a 5 cm long, 50 µm diameter capillary (IDEX Health and Science).
Protection potential of each monomer formulation was determined by percentage of intact
cells following extrusion through the capillary. The capillary was fixed to a luer lock by
compression fitting and attached to a 1 mL syringe (BD Biosciences). The syringe was
loaded with 0.5-1 million cells in 1 mL of PBS, placed in a syringe pump (Harvard
Apparatus) and turned upright so that the syringe was held vertically. The syringe pump
extruded the contents of the syringe at 4.8 µL/s into an open microcentrifuge tube (VWR).
Following extrusion, cells were analyzed by flow cytometry (Accuri C6) using forward
scatter and side scatter gating to determine whole vs. lysed cells both before and after
extrusion, as well as all viability assays mentioned above.
3.13 Shear without pressure change
To observe the effect of shear forces on coated and uncoated cells in the absence of
a pressure drop, a parallel disc viscometer was used (DHR2, TA Instruments). Cell
suspensions were loaded onto the bottom disc of the viscometer and the top disc lowered.
Viscometer studies were performed at a 30 µm gap and a 300 rad/s angular velocity, with
an exposure time of 10 s. Shear stress was measured by the instrument at ~110 Pa during
each run. Cells were then collected and analyzed by flow cytometry and EthD-1 viability
and MTT assays to determine the protective potential for each monomer solution against
uncoated cells.
30
3.14 Rapid Pressure Drop
Cells were subject to high pressures and rapid decompression simulating the pressure
changes extruded cells experienced in the absence of shear forces. Suspended cells were
placed in micro centrifuge tube at similar concentrations to extruded solutions. The open
centrifuge tube was placed inside a pressure chamber (Parr Instrument Company) and
charged with nitrogen to pressures above and below those experienced during the extrusion
process (8-25 bar), followed by sudden decompression back to atmospheric pressure.
Pressure was held constant for two separate lengths of time. First, cells were exposed to
these high pressures for ~2 min to simulate similar time scales of the extrusion process
above. Separate samples were then held at high pressures for ~10 min to determine if longer
exposure times would affect cell viability. Cells were then analyzed through flow
cytometry to determine whole vs. lysed cells, as well as all viability assays mentioned
above.
3.15 Mechanical properties
The swelling ratio of each polymer was determined in deionized water (DIW).
Monomer formulations were supplemented with 1 mM EITC in DMSO at a 1:10 dilution
for a final EITC concentration of 0.1 mM. Each sample was subjected to the same nitrogen
and irradiation conditions as cell coating experiments above. Bulk gels were formed in a
chip clip on a glass slide using a 16 well clip. 75 µL of monomer solution were placed in a
well for polymerization. The chip clip containing the monomer solution was then irradiated
with 530 nm light for 10 minutes. Upon the formation of bulk hydrogel, the gel was placed
in 4 mL of DIW for 4-8 hours on a rocker table to allow for complete saturation. Gels were
31
removed from water, patted to remove excess water and weighed in their swollen state. All
gels were then placed under vacuum for ~24 h and weighed again in their dry state.
Unidirectional tensile testing was also performed on each polymer type. Films were
generated in 9 x 9 cm square tissue culture dish at ~1 mm thickness. Gels were placed in
water for 24 h prior to testing. Test samples were stamped out of the film in a ‘dog bone’
shape (5 mm width at center) and each end glued to glass slides with cyanoacrylate super
glue (HDX). PEGDAs 700, 1000, 2000, and 3400 were tested on an Instron tensile tester.
GelMA/3400 was too soft for the limits of the commercial tensile tester and therefore was
tested using an in house designed tensile tester composed of a step motor (Oriental Motor
Co.) and 10 g load cell (Transducer Techniques). Initial length and film thickness were
measured by digital calipers before force was applied. Tensile strength was measured as
the film was stretched at a rate of 4 mm/min until failure. Stress/strain curves were
generated and modulus, ultimate tensile strength, and percent elongation at failure were
calculated.
3.16 Flow cytometry
Flow cytometry analyses were done on an Acuri C6 table top cell analyzer. Flow
cytometry was used to observe cell size, morphology, and fluorescent characteristics of
cellular events. With this machine light scattering properties as well as fluorescent
properties from four different wavelengths are recorded for each individual event analyzed.
Cells suspended in PBS are pulled up into the machine by a sip and peristaltic pump. Micro
fluidic channels then funnel the sample down using a sheath fluid to pass the cells one-by-
one through the laser. Optical detectors are placed directly in line with the incident light on
the opposite side of the fluid sample and perpendicular laterally to the laser. Size and

32
morphology information is obtained from forward scattered light (FSC) to the inline
detector and side scattered light (SSC) to the perpendicular detector respectively. Four light
detectors with different optical filters collect information regarding fluorescent intensity of
the specific wavelength. All optical information is recorded for each event processed. This
powerful tool gives quantitative information regarding cell viability when using the
fluorescent viability assays mentioned above. EthD-1 and Calcein dyes are easily analyzed
quantitatively through the use flow cytometry and fluorescent filters. Intact cellular events
were determined by FSC and SSC values compared to control samples before particular
processes.

33
CHAPTER 4. QUANTITATIVE ANALYSIS OF SURFACE MARKERS FOR CTCS AND CURRENT ISOLATION STRATEGIES
4.1 Introduction
Metastatic cancers are by far the most deadly form of malignant tumor, attributing
to more than 90% of cancer related deaths [26, 67]. Metastasis occurs when cells from the
primary tumor make their way into circulation before reaching and colonizing distant
tumor sites [67]. These circulating tumor cells (CTCs) have been intensely studied since
the first observation in 1869 [68]. The presence of these CTCs in cancer patients introduces
the potential of a fluid biopsy for cancer screening. Such a biopsy comes with major
advantages of minimally invasive acquisition, early diagnosis, and greater depth of
prognostic information. Solid tumor biopsies can be painful and have associated risks of
invasive procedures. A fluid biopsy that could be achieved through a standard peripheral
blood draw would have great clinical utility. Early diagnosis and treatment of cancer
patients has been shown to greatly increase the treatment efficacy and survival rates [69,
70]. CTC presence is believed to occur at very early stages of cancer. By the time that a
solid tumor is large enough to be observed on a scan, the patient may have had CTCs for
>10 years [71]. Rare cell isolation techniques are an area of intense study due to multiple
applications in CTC isolation, stem cell isolation, and the ability for functional
characterization of these highly impactful populations. The extreme rarity of these CTCs
along with evidence that suggests multiple, distinct populations can arise from a single
tumor primary with variable phenotypic profiles [72-74], greatly hinders current isolation
strategies from accurately isolating functional cells.

34
4.1.1 Current Isolation Strategies
Viable cell sorting is highly desired in clinical settings as well as for cell biology
research. Many current methods are affinity based and use specific cell surface molecules
to distinguish rare populations or subtypes from the rest of the sample [75]. These methods
are considered passive strategies. Separation is achieved by immobilization or deflection
of target cells away from the general flow within microfluidic devices. Nagrath et al
developed a CTC isolation chip that immobilizes CTCs without the need of any pre-
labeling or processing of cells [76]. This microfluidic chip contains micro posts coated
with antibodies against epithelial cell adhesion molecules (EpCAM), a commonly targeted
antigen for CTCs. Whole blood flows through the chip at controlled laminar conditions
where cells expressing EpCAM are bound and then collected by elution [76]. Another label
free microfluidic device uses molecule specific affinity in ‘deterministic cell rolling’ to
isolate target cells [77]. Antibody or protein functionalized grooves initiate cell rolling with
a slightly orthogonal trajectory to the fluid flow, separating positive cells from the rest of
the population where they are collected. This method has been shown to isolate a number
of cell types from a heterogenous population with high purity (>90%) [77] . Deterministic
cell rolling has shown promise of high purity but has not been used for CTC isolation.
While many of the affinity based microfluidic methods are able to achieve relatively high
purity, it comes at the expense of processing speed. Many of these devices operate on the
order of 10 µL/min [75-77].
Magnetic activated cell sorting (MACS) relies on cell surface functionalization
with magnetic micro beads. Magnetic beads coated with biorecognition molecules,
commonly antibodies, are incubated with heterogenous the heterogenous cell population.

35
Antigen positive cells bind with these particles making them susceptible to a magnetic
field. The entire population is then passed through a column in the presence of a strong
magnetic field. Antigen positive cells are retained at the walls of the column while all other
cells pass through freely. The magnetic field is then removed to collect the antigen positive
population. While MACS offers a great advantage of high throughput processing up to 1011
cells in 30 min [75], the isolation purity is much lower than that of alternate strategies. The
product purity of MACS is highly dependent on the abundance of the target cell in the
original population [78]. It has been shown that target cell populations of 1% have yielded
only 37% purity following MACS [79]. For this reason, MACS is often used as a pre-
enrichment step before processing with another isolation method. Depending on the
application of the sorted cells, removal of the magnetic micro beads may also be required.
Fluorescent activated cell sorting (FACS) has been widely used in cell separations
due to its high purity sorting abilities. FACS uses fluorescent labeling in much the same
way as MACS uses magnetic labeling. Fluorochromes are bound to cells by target cell
specific antibodies. Using microfluidics, the cell suspension is funneled down to a single
cell stream where it passes through excitation lasers and optical detectors to determine
fluorescently labeled cells. The cell stream is then aerosolized and droplets are charged
based on their fluorescent characteristics. Droplets are passes through an electric field
where they are directed to different containers based on their charge and therefore their
fluorescent properties. In viable cell sorting with FACS surface antigens are used for
fluorochrome labeling, as opposed to intracellular staining. The surface expression of the
target antigen is a critical factor in cell sorting ability.

36
CellSearch is currently the only FDA approved technique for CTC enumeration.
CTC abundance in peripheral blood has been shown to have significant impact on
prognosis for some cancers [29-31]. This method combines the high throughput enrichment
of MACS with fluorescent labeling of characteristic markers for distinguishability of
CTCs. MACS enriched populations are fixed and permeabilized for intracellular staining
of the nucleus and cytokeratin, while also staining for leukocyte common antigen, CD 45.
Events are considered positive when nucleated, positive for cytokeratin and negative for
CD 45. While this method is a powerful tool for CTC enumeration, it does not yield viable
cells and therefore has little translation to functional CTC analysis or rare cell isolation
applications where viability is necessary.
As many these methods may possess the potential for viable CTC isolation in a
clinically relevant fluid biopsy, surface expression of target cells greatly dictates efficacy
of antibody based techniques. Low surface expression, or more quantitatively, surface
density of target markers decreases the binding of fluorochromes or magnetic beads over
non-specific binding hindering the distinction between positive and negative events. For
passive isolation techniques, low molecule surface density translates to lower binding
affinity leading to decreased retention or rolling initiation of target cells. Currently, the
literature contains very little quantitative information regarding surface expression. Most
reports for common metastatic markers are given as positive/negative or
upregulated/downregulated. Quantitative reports by enzyme immunoassay and enzyme-
linked immunosorbent assay are in units of mass of protein per mass of cell lysate. These
assays measure total antigen presence of lysed and homogenized cells which include
intracellular expression. While this information may be valuable in alternative applications,
37
viable isolation techniques rely only on surface expression. In this chapter we quantify the
surface expression of common cancer related biomarkers.
4.1.2 Common Surface Markers Associated with Metastasis
As most primary tumors are composed of adherent epithelial cells, it is obvious that
most strategies target common epithelial markers. Of these, epithelial cell adhesion
molecule (EpCAM) is by far the most widely used in the literature. EpCAM is a calcium
ion-independent surface protein which is primarily involved in homophilic cell-to-cell
adhesion [80]. EpCAM has been shown to have upregulation of two to three orders of
magnitude in breast cancer tumors as opposed to healthy tissue [81]. While the targeting
of EpCAM on CTCs is highly prevalent, problems can occur such as EpCAM negative
cancers, and downregulation or loss of epithelial characteristics upon EMT and entering
circulation.
In breast cancer, three highly targeted biomarkers are human epidermal growth
factor receptor 2 (HER2), estrogen receptor (ER), and progesterone receptor (PR). These
three markers are used to classify subtypes of breast cancer for therapy selection and
prognostic information. HER2 is a tyrosine kinase that forms heterodimers with other
markers in its family to increase cell division [82, 83]. ER binding with the hormone
estrogen plays a role in promoting proliferation of mammary cells. Upregulation of ER is
believed to be associated with over proliferation and/or formation of genotoxic by-products
[84]. PR is transcription protein that when activated by progesterone controls the regulation
of specific genes.
E-Cadherin and N-Cadherin are adhesion molecules that play different roles in
metastasis. E-Cadherin is a calcium-dependent molecule that plays a role in homotypic

38
cell-to-cell adhesion. Decreased expression of E-Cadherin is thought to be one of the first
steps in the metastatic progression [85] as well as EMT [86] by decreasing cell adhesion to
the primary tumor. N-Cadherin is also a calcium-dependent homotypic cell adhesion
molecule, but is also believed to be responsible for detachment mechanisms [87].
Expression of N-Cadherin has been associated with more invasive cancers [87, 88].
CD44 and integrin αVβ3 are both biomarkers that are adhesive to the extracellular
matrix (ECM). CD44 is a transmembrane protein that is activated by hyaluronan to
stimulate intracellular functions associated with metastasis, including adhesion, migration,
and invasion [89, 90]. Integrins are a family of adhesion molecules that play roles in
migration, survival, and activation of apoptosis suppressors [91]. Within this family,
integrin αVβ3 has been identified as an important marker in early angiogenic activity,
tumor growth, invasion and metastasis [92, 93].
Intercellular adhesion molecule 1 (ICAM1) is another adhesion molecule positively
expressed in breast cancer [94, 95], that has roles in cell morphology, cell-to-cell adhesions,
and migration [96] . Expression of ICAM1 found on CTC suggests that it may play a role
in metastasis by promoting migration of cells through the ECM [96]. A major part of
metastasis is also the ability to initiate tumor growth and sustain transport of nutrients
through angiogenesis. Epidermal growth factor receptor (EGFR) is a member of the
tyrosine kinase family and plays a significant role in angiogenesis, proliferation and
apoptosis resistance apoptosis [97]. Positive expression of EGFR has been linked to less
favorable prognoses over EGFR negative tumors in breast cancer [98].

39
4.2 Materials and Methods
4.2.1 Peripheral Blood
A peripheral blood sample was obtained with informed consent through University
of Kentucky Medical Center IRB protocols and processed within an hour of collection.
Whole blood was mixed with dextran and NaCl to a working concentration of 2 wt/v%
dextran and 0.3 wt/v% NaCl and was allowed to separate by 1 x g in ambient conditions
for 1 hour. The buffy coat containing peripheral blood mononuclear cells (PBMC) was
then pipetted off and exposed to a red blood cell lysis buffer (155 mM NH4Cl, 10 mM
KHCO3, 0.1 mM EDTA) for 5 minutes to further remove red blood cells from the sample.
Nucleated cells were collected by centrifugation at 300 x g for 5 minutes and washed twice
with cold 1 X PBS.
4.2.2 Surface Marker Immunostaining
Tumor cells were cultured and harvested as described in Chapter 3.2. Cell
concentration and mean cell diameter was determined optically with a Cellometer
Automated Cell counter (Nexelcom). Each replicate sample consisted of 1 x 10⁵ cells in a
microcentrifuge tube. For experimentation, a rinsing buffer of 1 X PBS with 3% FBS was
prepared and used for all rinsing steps. All materials and cell samples were kept on ice
throughout the staining procedure. For immunolabeling, samples were incubated with
primary antibodies at ~ 0.5 µg in 150 µL of rinsing buffer for 40 minutes. For all cell lines,
markers were targeted with primary monoclonal mouse antihuman IgG antibodies with
corresponding isotype controls that consisted of: CD326/EpCAM (IgG2b, clone 9C4,
BioLegend, San Diego, CA), HER1/EGFR (IgG1, clone AY13, BioLegend), CD44 (IgG1,
clone BJ18, BioLegend), E-cadherin (IgG1, clone 67A4, BioLegend), erbB2/HER2 (IgG1,

40
clone 24D2, BioLegend), N-cadherin (IgG1, clone8C11, BioLegend), αVβ3 integrin
(IgG1, clone 23C6, BioLegend), ICAM-1 (IgG1, clone HA58, eBiosciences, San Diego,
CA), ER-α (IgG2a, clone F-10, Santa Cruz Biotechnology, Dallas, TX). Samples were then
rinsed twice with rinsing buffer. Cells were then incubated with biotinylated goat anti-
mouse IgG antibody (Vector Labs, Burlingame, CA) at a 1:400 dilution in rinsing buffer
on ice for 40 minutes. Cells were rinsed twice and incubated with streptavidin-
phycoerythrin at ~ 1 µg in 200 µL on ice for 20 minutes. Samples were rinsed three times
and resuspended in ~ 200 µL for immediate analysis with flow cytometry.
4.2.3 Data Analysis
Data was calculated as mean ± standard error of the mean (n=3) for all marker
quantification assays and cell diameter calculations. Standard error was used to as opposed
to standard deviation due to the large variance in fluorescence within a single replicate.
The standard error illustrates how our observation relates to the true mean of marker
expression. Quantibrite PE bead calibration was performed every day of cell
immunofluorescence data collection and fluorescence calibration values were collected
using a 585/40 bandpass filter for red-orange detection. PE per cell values were calculated
using a linear calibration curve (R2 ~0.98) of PE molecules vs. fluorescence generated from
the bead calibration for each on their respective days of collection. Statistical analysis
consisted of a two-tailed student t-test performed in Matlab to calculate p-values.

41
4.3 Results
4.3.1 Image analysis
Morphological comparison of cell lines studied are shown by bright field images in
Figure 4.1. The distinct morphology of the MDA-MB-231 basal like breast cancer cell line
[99] from the other lines studied is present in the elongated, multipolar nature with minimal
cell-to-cell contact. This morphology is characteristic of basal subtypes and is clearly
present in the basal like tumor cells. In contrast, the luminal breast cancer lines MCF-7 and
T-47D [100], and NSCLC line H358 exhibit much less elongation with tightly packed
colonization highly favoring cell-to-cell contact. These traits are characteristic of the
epithelial phenotype and commonly are minimally invasive. All cell types and diameters
are summarized in Table 4.1.

42
Table 4.1: Summary of cell types analyzed in the study. Diameter and surface area
calculations are reported as mean ± s.e.m.
Cell Type Description Diameter (µm) Surface Area (µm2)
MDA-MB-231 mammary adenocarcinoma 11.5 ± 0.3 415 ± 19
MCF-7 mammary adenocarcinoma 17.1 ± 0.4 922 ± 43
T-47D mammary ductal carcinoma 14.5 ± 0.3 663 ± 34
A549 alveolar adenocarcinoma 15.0 ± 0.4 710 ± 38
H358 bronchioalveolar carcinoma 16.8 ± 0.5 890 ± 47
Peripheral Lymphocytes Healthy PBMC 6.7 ± 0.1 142 ± 1
Peripheral Monocytes Healthy PBMC 7.9 ± 0.1 197 ± 2
Peripheral Granulocytes Healthy PBMC 8.2 ± 0.1 209 ± 1
Cell diameters for each cell line were obtained using a Cellometer automated counter
(Nexcelom). Using regression analysis of cell line diameters with mean forward scatter in
flow cytometry, the size of PBMC cells were estimated. For all cells a spherical model was
assumed for surface area calculation.

43
Figure 4.1: Representative bright field micrograph images of cultured breast cancer lines
(MDA-MB-231, MCF-7, T-47D) and non-small cell lung cancer lines (A549,
H358).
4.3.2 Flow cytometric analysis of surface markers
Quantitation of surface markers was done using QuantiBRITE PE beads with a SA-
PE conjugate that served as a fluorescent reporter molecule for antigen expression. The
indirect labeling method used here has minor amplification inherent within. Parallel
comparison of direct staining with a biotinylated anti-EpCAM and a biotinylated anti-
mouse secondary, both followed with SA-PE staining resulted in a 1.3-fold amplification
of the secondary staining method shown in Figure 4.2. Although this amplification may
overestimate the real number of target surface markers, secondary staining was performed
to remain consistent with traditional immunolabeling in applications of CTC isolation. In
these rare cell isolation strategies, amplification of labeling is often desired to further

44
separate positive from negative events. Consistent tagging was used for all markers on all
cell lines to preserve relative expression levels.
Figure 4.2: Phycoerythrin labeling per cell comparison for indirect staining conditions on
viable A549 cells. Labeling conditions before streptavidin-phycoerythrin
incubation were (left) covalently biotinylated mouse anti-human EpCAM and
(right) mouse anti-human EpCAM + biotinylated goat anti-mouse.
Expression levels of the quantified markers varied drastically among the studied
lines and is reported as fold over isotype controls showing expression over non-specific
binding, as well as normalized against surface area for number of PE molecules per µm2
on each cell type. These data are presented in Figures 4.3 and 4.4, respectively. Notably,
the two lines possessing the more invasive morphologies, MB-MDA-231 and A549, are
also the two that showed lower expression of EpCAM and E-Cadherin than the other three
lines exhibiting more epithelial morphologies (p < 0.001, Figure 4.4). All statistical values
are reported in Table 4.2 at the end of this chapter. MD-MBA-231 cells also showed higher
expression of CD 44, EGFR and ICAM1 over MCF-7, T-47D, and H358 cell lines (p <
0.01). CD 44 was also expressed at significantly higher levels in A549 cells over MCF-7,
Biotinylated Primary Primary + Biotinylated Secondary0
10000
20000
30000
40000
50000
60000
# Ph
ycoe
ryth
rin p
er C
ell

45
T-47D and H358 lines (p < 0.01). Integrin αVβ3 has an order of magnitude greater
expression level for MB-MDA-231 than the other lines examined, registering ~30 PE
molecules/µm2 (p <0.001). EGFR and ICAM1 showed relatively high expression, at least
100 PE molecules/µm2, for all lines except MCF-7. These two markers are involved in
many mechanisms that promote metastasis such as cell migration through the ECM and
angiogenesis. Their increased expression has been linked to poorer prognoses [96, 101].
For breast cancer in particular ERa, PR and HER2 are markers used for subclassification
of cancer as well as therapeutic targeting. All three breast cancer lines showed a slight
increase in ERα expression over isotype controls (p-values< 0.05, Figure 4.3 A-C), and
elevation in expression over NSCLC lines (p-values < 0.05) which showed virtually no
ERα expression, with the exception of MCF-7 compared to A549 (p=0.15, Figure 4.4 D,
E). HER2, however had relatively high expression in all lines of 50-100 PE molecules/µm2.

46
Figure 4.3: Summary of tumor marker expression on viable cells. Presented as fold over
isotype controls for cancer lines and healthy peripheral blood mononuclear
cells (PBMC) as quantified by flow cytometry analysis of a phycoerythrin
reporter label.
EpC
AM
EG
FR
CD
44
E-c
adhe
rin
HE
R2
N-c
adhe
rin
aVb3
inte
grin
ICA
M-1
ER
-alp
ha
100
101
102
103
104
Fold
IgG
EpC
AM
EG
FR
CD
44
E-c
adhe
rin
HE
R2
N-c
adhe
rin
aVb3
inte
grin
ICA
M-1
ER
-alp
ha
100
101
102
103
104
Fold
IgG
EpC
AM
EG
FR
CD
44
E-c
adhe
rin
HE
R2
N-c
adhe
rin
aVb3
inte
grin
ICA
M-1
ER
-alp
ha
100
101
102
103
104
Fold
IgG
EpC
AM
EG
FR
CD
44
E-c
adhe
rin
HE
R2
N-c
adhe
rin
aVb3
inte
grin
ICA
M-1
ER
-alp
ha
100
101
102
103
104
Fold
IgG
EpC
AM
EG
FR
CD
44
E-c
adhe
rin
HE
R2
N-c
adhe
rin
aVb3
inte
grin
ICA
M-1
ER
-alp
ha
100
101
102
103
104
Fold
IgG
A549 H358
MDA-MB-231 T-47DMCF-7
PBMC
A
E F
B C
D
EpC
AM
EG
FR
CD
44
E-c
adhe
rin
HE
R2
N-c
adhe
rin
aVb3
inte
grin
ICA
M-1
ER
-alp
ha
100
101
102
103
104
Fold
IgG
Lymphocytes Monocytes Granulocytes

47
Figure 4.4: Summary of Phycoerythrin labeling density (# PE molecules/µm2 of cell
surface) for various tumor marker targeting conditions on viable cancer line
cells and healthy PBMC.
For CTC isolation from peripheral blood, target markers must be chosen such that
CTCs show clear distinction from PBMCs. Targeting markers that are highly expressed in
both cell types effectively eliminates the ability to distinguish target cells within the
population. Nucleated blood cells were fluorescently analyzed by flow cytometry with
gating for the subtypes of leukocytes, monocytes, and granulocytes. Marker quantitation
for each PBMC subtype was reported as fold over IgG (Figure 4.3F), and then as PE
molecules/µm2 after normalization to the size of each subtype (Figure 4.4F). These
EpC
AM
EG
FR
CD
44
E-c
adhe
rin
HE
R2
N-c
adhe
rin
aVb3
inte
grin
ICA
M-1
ER
-alp
ha
IgG
1 Is
otyp
e
IgG
2a Is
otyp
e
IgG
2b Is
otyp
e
100
101
102
103
104
PE
Mol
ecul
es p
er µ
m2
EpC
AM
EG
FR
CD
44
E-c
adhe
rin
HE
R2
N-c
adhe
rin
aVb3
inte
grin
ICA
M-1
ER
-alp
ha
IgG
1 Is
otyp
e
IgG
2a Is
otyp
e
IgG
2b Is
otyp
e
100
101
102
103
104
PE
Mol
ecul
es p
er µ
m2
EpC
AM
EG
FR
CD
44
E-c
adhe
rin
HE
R2
N-c
adhe
rin
aVb3
inte
grin
ICA
M-1
ER
-alp
ha
IgG
1 Is
otyp
e
IgG
2a Is
otyp
e
IgG
2b Is
otyp
e
100
101
102
103
104
PE
Mol
ecul
es p
er µ
m2
EpC
AM
EG
FR
CD
44
E-c
adhe
rin
HE
R2
N-c
adhe
rin
aVb3
inte
grin
ICA
M-1
ER
-alp
ha
IgG
1 Is
otyp
e
IgG
2a Is
otyp
e
IgG
2b Is
otyp
e
100
101
102
103
104
PE
Mol
ecul
es p
er µ
m2
EpC
AM
EG
FR
CD
44
E-c
adhe
rin
HE
R2
N-c
adhe
rin
aVb3
inte
grin
ICA
M-1
ER
-alp
ha
IgG
1 Is
otyp
e
IgG
2a Is
otyp
e
IgG
2b Is
otyp
e
100
101
102
103
104
PE
Mol
ecul
es p
er µ
m2
A549 H358
MDA-MB-231 T-47DMCF-7
PBMC
A
E F
B C
D
EpC
AM
EG
FR
CD
44
E-c
adhe
rin
HE
R2
N-c
adhe
rin
aVb3
inte
grin
ICA
M-1
ER
-alp
ha
IgG
1 Is
otyp
e
IgG
2a Is
otyp
e
IgG
2b Is
otyp
e
100
101
102
103
104
PE
Mol
ecul
es p
er µ
m2
Lymphocytes Monocytes Granulocytes

48
estimates were in fair agreement with the literature [102, 103]. Relatively high staining is
observed on PBMCs, especially with monocytes, which is somewhat expected due to their
tendency for nonspecific binding. For further analysis, we report marker expression for
each cell line over staining for monocytes specifically (Figure 4.5). CD 44 consistently
showed high expression levels for all cancer cells studied, however would not be
considered a suitable target due to high non-specific staining observed of CD 44 in PBMCs.
Targeting CD 44 would likely result in a high occurrence of false positive events. The
greatly attenuated expression of EpCAM for the more morphologically invasive lines of
A549 and MB-MDA-231 would also likely produce false positives as a potential target.
Figure 4.5: Summary of phycoerythrin labeling density of all cancer lines studied
presented as fold expression over healthy monocytes from a peripheral blood
sample.
EpC
AM
EGFR
CD
44
E-ca
dher
in
HER
2
N-c
adhe
rin
aVb3
inte
grin
ICAM
-1
ER-a
lpha
10-1
100
101
102
PE D
ensi
ty F
old
Ove
r Per
iphe
ral M
onoc
ytes
MDA-MB-231 MCF-7 T47-D A549 H358

49
4.4 Discussion
Here we have reported expression levels of commonly studied metastatic associated
cancer biomarkers through antibody recognition for two breast cancer and three NSCLC
lines in comparison to PBMC. In the literature, very little quantitative information has been
reported for surface markers available for viable cell binding. While quantitative assays
may provide prognostic or therapeutic information with positive/negative reporting, they
may not be adequate for portraying highly dynamic surface expression of many tumor cells
for isolation targeting [104-106]. For viable tumor cells the isolation ability is critically
dependent on the unique surface expression of target cells over other cells within the
heterogenous population. We propose these results as a significant step toward highly
effective isolation strategies through informed target marker selection in the isolation
community.
Our results show breast cancer marker expression consistent with the basal or
luminal characteristics of each subtype. Basal subtypes are often more invasive and show
less cell-to-cell contact than luminal cancers which are more epithelial-like [100, 107]. The
basal-like MDA-MB-231 showed elevated levels of metastatic/mesenchymal associated
markers CD44, N-cadherin, αV-β3 integrin, ICAM-1, as well as upregulation of EGFR as
is common in basal-like tumors (Figure 4.3A) [107]. These cells also showed less
expression of the epithelial markers EpCAM and E-Cadherin compared to the luminal T-
47D and MCF-7 lines. Elevation of these mesenchymal markers are indicative of the more
metastatic cancers as they play key roles in migration, invasion and angiogenesis [108].
Invasive cells of this nature are problematic for current isolation strategies that largely
favor the EpCAM+ cells. Highly invasive cells of this nature are more prone to go

50
undetected in isolation methods due to epithelial marker expression lower than determined
threshold.
An interesting result was seen for ERα expression in comparing the basal and
luminal subtypes. MDA-MB-231 cells expressed similar surface densities of ERα
compared to MCF-7 and T-47D. Since this study aimed to determine antigen surface
densities on intact viable cells, differing results may arise from the incorporation of
intracellular expression levels in literature. The antibody chosen for ERα targeting (clone
F-10, Santa Cruz Biotech) targeted the C-terminal ligand binding domain and although
these receptors show presence in the plasma membrane, they are largely a nuclear receptor
[109]. While intracellular incorporation may be relevant in some applications, it holds no
benefit for isolation strategies based on surface binding.
This study offers insight into the expression levels of several metastatic associated
biomarkers including CD 44, N-Caderhin, ICAM1 and integrin αVβ3 as potential target
markers [91, 96, 110]. Poorly expressed surface markers clearly serve little utility in
functional isolation, along with markers that share high expression with that of PBMC
cells. We found that both N-cadherin and integrin αVβ3 were upregulated on MDA-MB-
231 and A549 lines. However, their utility as potential markers was diminished by the fact
that expression density was still approximately equal to or below that found on peripheral
monocytes (Figures 4.4F and 4.5). Additionally, CD44 was consistently high for all cancer
lines (Figure 4.5) as well as PBMCs. All cancer lines showed expression of a factor of
nearly 1 or below that found on monocytes except MDA-MB-231 that retained a seven-
fold increase over monocytes (Figure 4.5). Because these markers show expression similar
to that of peripheral monocytes, they likely would serve poor targets to distinguish CTCs.

51
Further study may be warranted for the expression of N-Cadherin due to the phenomenon
known as the ‘cadherin switch’ in which E-Cadherin expression is downregulated while
N-Cadherin is upregulated is observed in vivo upon cytokine stimulation [88, 111, 112].
This increased N-Cadherin expression is correlated with more invasive phenotypes and
could potentially allow N-Cadherin to serve as a possible target. Our results indicate
ICAM1 as a potential target for isolation of CTCs. ICAM1 is a cell adhesion molecule that
plays a significant role in migration, and has been recently been classified as a
mesenchymal cell marker [113-115]. A recent study has shown that increased populations
of ICAM1 upregulated CTCs correlated to poorer prognosis [96], further suggesting the
potential utility of it as a target.
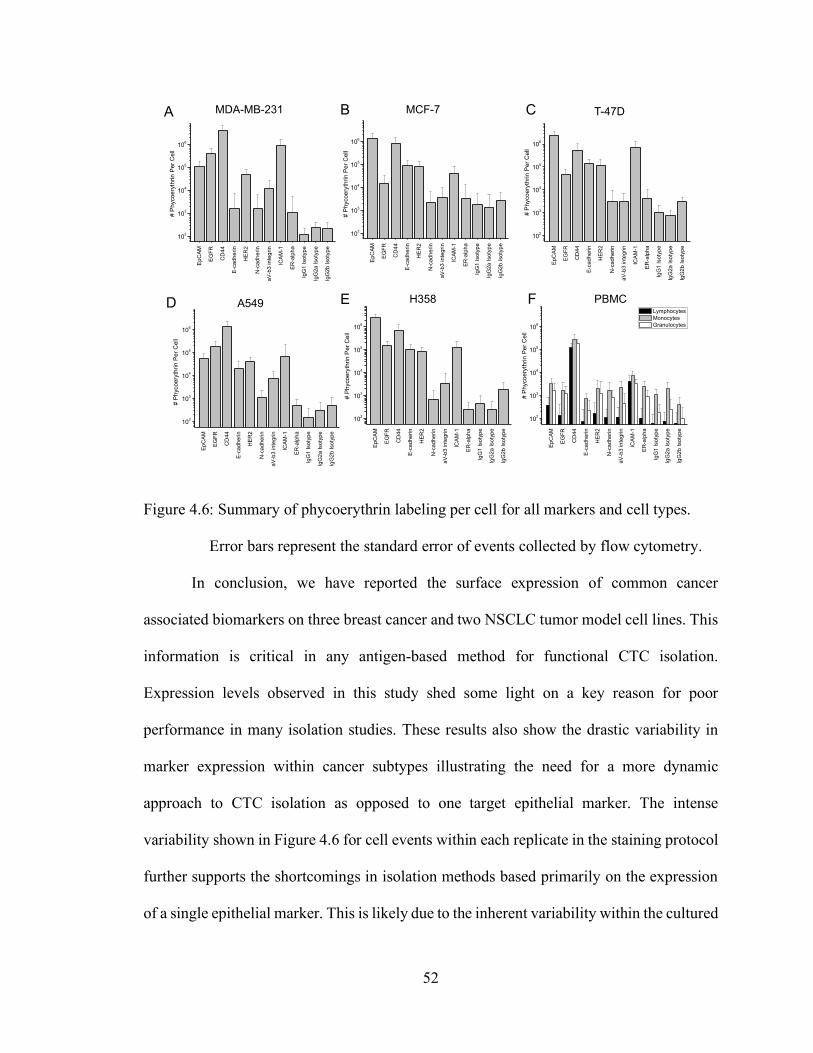
52
Figure 4.6: Summary of phycoerythrin labeling per cell for all markers and cell types.
Error bars represent the standard error of events collected by flow cytometry.
In conclusion, we have reported the surface expression of common cancer
associated biomarkers on three breast cancer and two NSCLC tumor model cell lines. This
information is critical in any antigen-based method for functional CTC isolation.
Expression levels observed in this study shed some light on a key reason for poor
performance in many isolation studies. These results also show the drastic variability in
marker expression within cancer subtypes illustrating the need for a more dynamic
approach to CTC isolation as opposed to one target epithelial marker. The intense
variability shown in Figure 4.6 for cell events within each replicate in the staining protocol
further supports the shortcomings in isolation methods based primarily on the expression
of a single epithelial marker. This is likely due to the inherent variability within the cultured
A549 H358
MDA-MB-231 T-47DMCF-7
PBMC
A
E F
B C
D
EpC
AM
EGFR
CD
44
E-ca
dher
in
HER
2
N-c
adhe
rin
aV-b
3 in
tegr
in
ICAM
-1
ER-a
lpha
IgG
1 Is
otyp
e
IgG
2a Is
otyp
e
IgG
2b Is
otyp
e
102
103
104
105
106
# Ph
ycoe
ryth
rin P
er C
ell
EpC
AM
EGFR
CD
44
E-ca
dher
in
HER
2
N-c
adhe
rin
aV-b
3 in
tegr
in
ICAM
-1
ER-a
lpha
IgG
1 Is
otyp
e
IgG
2a Is
otyp
e
IgG
2b Is
otyp
e
102
103
104
105
106
# Ph
ycoe
ryth
rin P
er C
ell
EpC
AM
EGFR
CD
44
E-ca
dher
in
HER
2
N-c
adhe
rin
aV-b
3 in
tegr
in
ICAM
-1
ER-a
lpha
IgG
1 Is
otyp
e
IgG
2a Is
otyp
e
IgG
2b Is
otyp
e
102
103
104
105
106
# Ph
ycoe
ryth
rin P
er C
ell
EpC
AM
EGFR
CD
44
E-ca
dher
in
HER
2
N-c
adhe
rin
aV-b
3 in
tegr
in
ICAM
-1
ER-a
lpha
IgG
1 Is
otyp
e
IgG
2a Is
otyp
e
IgG
2b Is
otyp
e
102
103
104
105
106
# Ph
ycoe
ryth
rin P
er C
ell
EpC
AM
EGFR
CD
44
E-ca
dher
in
HER
2
N-c
adhe
rin
aV-b
3 in
tegr
in
ICAM
-1
ER-a
lpha
IgG
1 Is
otyp
e
IgG
2a Is
otyp
e
IgG
2b Is
otyp
e
102
103
104
105
106
# Ph
ycoe
ryth
rin P
er C
ell
EpC
AM
EGFR
CD
44
E-ca
dher
in
HER
2
N-c
adhe
rin
aV-b
3 in
tegr
in
ICAM
-1
ER-a
lpha
IgG
1 Is
otyp
e
IgG
2a Is
otyp
e
IgG
2b Is
otyp
e
102
103
104
105
106
# Ph
ycoe
ryth
rin P
er C
ell
Lymphocytes Monocytes Granulocytes

53
cells, as well as the deviations from a mean affinity for each antibody used. Any antibody
based-assay should carefully consider the variation in antibody affinity across suppliers
when designing and interpreting methodologies and collected data. Further, heterogeneity
in marker expression increases even more as some tumor cells undergo the phenotypic
change known as the epithelial to mesenchymal transition (EMT) [72]. These invasive
subsets are among the most dangerous and the most difficult to detect due to the lack of
EpCAM expression. One possible approach to the highly varied surface expression is to
use a mixture of antibodies to target multiple characteristic surface markers. For example,
Yu et al. developed a method to target patient-derived breast cancer CTCs with a cocktail
of EpCAM, EGFR, and HER2 antibodies on an affinity based microchip platform [104].

54
Table 4.2: Summary of student t-test calculations for surface marker data.
Line 1 Line 2 Marker Data Type P-value Line 1 Line 2 Marker Data Type P-valueMDA-MB-231 MCF-7 CD44 Label Density 0.0017 MDA-MB-231 monocyte EpCAM Label Density 3.80E-03MDA-MB-231 T-47D CD44 Label Density 0.0016 MDA-MB-231 monocyte E-cadherin Label Density 8.97E-01MDA-MB-231 H358 CD44 Label Density 0.0016 MDA-MB-231 monocyte EGFR Label Density 7.40E-03MDA-MB-231 MCF-7 N-cadherin Label Density 0.588 A549 monocyte EGFR Label Density 1.81E-05MDA-MB-231 T-47D N-cadherin Label Density 0.8 H358 monocyte EGFR Label Density 1.80E-08MDA-MB-231 H358 N-cadherin Label Density 0.34 MDA-MB-231 monocyte CD44 Label Density 1.80E-03MDA-MB-231 MCF-7 ICAM-1 Label Density 0.002 MCF-7 monocyte CD44 Label Density 9.68E-04MDA-MB-231 T-47D ICAM-1 Label Density 0.0059 T-47D monocyte CD44 Label Density 1.00E-03MDA-MB-231 H358 ICAM-1 Label Density 0.0022 H358 monocyte CD44 Label Density 1.30E-03MDA-MB-231 MCF-7 EpCAM Label Density 5.80E-07 A549 monocyte CD44 Label Density 2.00E-03MDA-MB-231 T-47D EpCAM Label Density 3.57E-05 MDA-MB-231 monocyte ICAM-1 Label Density 2.00E-03MDA-MB-231 H358 EpCAM Label Density 7.27E-08 MCF-7 monocyte ICAM-1 Label Density 3.41E-02MDA-MB-231 MCF-7 E-cadherin Label Density 2.20E-04 T-47D monocyte ICAM-1 Label Density 2.44E-04MDA-MB-231 T-47D E-cadherin Label Density 1.17E-05 H358 monocyte ICAM-1 Label Density 1.05E-05MDA-MB-231 H358 E-cadherin Label Density 3.99E-06 A549 monocyte ICAM-1 Label Density 4.45E-05MDA-MB-231 MCF-7 EGFR Label Density 7.50E-03 MDA-MB-231 monocyte aV-b3 integrin Label Density 2.70E-05MDA-MB-231 T-47D EGFR Label Density 8.40E-03 MCF-7 monocyte aV-b3 integrin Label Density 3.00E-03MDA-MB-231 H358 EGFR Label Density 1.00E-02 T-47D monocyte aV-b3 integrin Label Density 9.76E-04
A549 MCF-7 CD44 Label Density 9.20E-04 H358 monocyte aV-b3 integrin Label Density 3.00E-03A549 T-47D CD44 Label Density 9.70E-04 A549 monocyte aV-b3 integrin Label Density 7.20E-01A549 H358 CD44 Label Density 1.10E-03 MDA-MB-231 monocyte N-cadherin Label Density 2.40E-01A549 MCF-7 EpCAM Label Density 1.07E-04 MCF-7 monocyte N-cadherin Label Density 9.30E-02A549 T-47D EpCAM Label Density 1.60E-04 T-47D monocyte N-cadherin Label Density 2.00E-01A549 H358 EpCAM Label Density 4.27E-05 H358 monocyte N-cadherin Label Density 6.50E-02A549 MCF-7 E-cadherin Label Density 1.23E-05 A549 monocyte N-cadherin Label Density 7.40E-02A549 T-47D E-cadherin Label Density 4.80E-08 MDA-MB-231 A549 EpCAM Label Density 6.40E-03A549 H358 E-cadherin Label Density 3.20E-06 MDA-MB-231 A549 EGFR Label Density 1.40E-02
MDA-MB-231 MCF-7 aV-b3 integrin Label Density 4.15E-05 MDA-MB-231 A549 CD44 Label Density 1.90E-03MDA-MB-231 T-47D aV-b3 integrin Label Density 3.74E-06 MDA-MB-231 A549 E-cadherin Label Density 1.40E-03MDA-MB-231 H358 aV-b3 integrin Label Density 5.60E-05 MDA-MB-231 A549 HER2 Label Density 8.20E-04MDA-MB-231 lymphocyte aV-b3 integrin Label Density 2.30E-04 MDA-MB-231 A549 N-cadherin Label Density 4.48E-01MDA-MB-231 monocyte aV-b3 integrin Label Density 2.70E-05 MDA-MB-231 A549 aV-b3 integrin Label Density 8.80E-02MDA-MB-231 granulocyte aV-b3 integrin Label Density 2.80E-04 MDA-MB-231 A549 ICAM-1 Label Density 2.00E-03MDA-MB-231 isotype ER-alpha Expression 3.80E-02 MDA-MB-231 A549 ER-alpha Label Density 4.30E-02MDA-MB-231 isotype HER2 Expression 4.15E-04 MDA-MB-231 MCF-7 ER-alpha Label Density 1.10E-01
MCF-7 isotype ER-alpha Expression 1.30E-02 MDA-MB-231 T-47D ER-alpha Label Density 5.00E-03MCF-7 isotype HER2 Expression 7.50E-04 MCF-7 T-47D ER-alpha Label Density 1.50E-02T-47D isotype ER-alpha Expression 5.50E-03 MDA-MB-231 MCF-7 HER2 Label Density 7.77E-04T-47D isotype HER2 Expression 2.70E-03 MDA-MB-231 T-47D HER2 Label Density 1.60E-02
lymphocyte isotype CD44 Expression 1.53E-05 MCF-7 T-47D HER2 Label Density 6.80E-03lymphocyte isotype ICAM-1 Expression 2.05E-04 MDA-MB-231 A549 ER-alpha Expression 0.05monocyte isotype CD44 Expression 3.76E-04 MDA-MB-231 H358 ER-alpha Expression 0.047monocyte isotype ICAM-1 Expression 4.82E-04 MCF-7 A549 ER-alpha Expression 0.15
granulocyte isotype CD44 Expression 7.66E-05 MCF-7 H358 ER-alpha Expression 0.016granulocyte isotype ICAM-1 Expression 1.33E-07 T-47D A549 ER-alpha Expression 0.007
T-47D H358 ER-alpha Expression 0.0066

55
CHAPTER 5. COMMERCIALIZATION OF ASL THROUGH THE USE OF FITC FOR PHOTOINITIATION
5.1 Introduction
Eosin Y is among the most common visible light initiators for radical
polymerization in aqueous media [38, 41, 44, 116, 117]. It has been widely used in the
formation of cell laden gel due to its ability to generate radical species with low intensity
visible light while showing minimal cytotoxicity [118]. Visible light photopolymerization
eliminates the possibility of UV mediated damage when dealing with live cells [37]. Eosin
Y is a xanthene derivative photosensitizer that is excited by absorption of light at 530 nm.
Radical generation is achieved through excitation of the eosin molecule where it undergoes
an intersystem crossing to yield a triplet excited state. In the presence of a tertiary amine
coinitiator, commonly triethanol amine (TEA), electron transfer from the amine to the
eosin molecule followed by hydrogen abstraction by eosin yields two neutral radical
species [40]. Of these two, the TEA radical is much more reactive toward the acrylate
functional groups [38, 41] that are commonly used in biologically compatible hydrogel
formation. While the TEA radical initiates chain propagation, a neutral eosin molecule is
regenerated through a disproportionation reaction where once back in the ground state, can
again undergo excitation to form more radicals. The cyclic regeneration of eosin makes it
highly valuable in systems that contain radical quenching species, or limited initiator
present. It has been shown to generate hydrogel polymerization in systems containing
1000-fold greater inhibitor concentration over initiator [119]. Eosin has also commonly
been functionalized to surfaces for generation of thin hydrogel films on cellular surfaces

56
[44], as well as protein conjugation on micro arrays for highly sensitive biodetection of
ultra-low analyte density [66, 120-123]. Figure 5.1 below shows the polymerization
reaction scheme with cyclic regenerating photoinitiators.
Figure 5.1: Reaction schematic of A) radical polymerization and regeneration of
photoinitiator (I = eosin Y or fluorescein), and B) initiator ability to consume
inhibiting species and regenerate.
Our lab has developed a method of surface polymerization that utilizes eosin
functionalized cells for nano thin film generation [33]. This technology has applications in
rare cell isolation [33], immunoprotection [124], and is being studied for mechanical
protection against shear forces in 3D bioprinting. Many cell encapsulation strategies use
aqueous cell suspensions with eosin in solution to form cell laden bulk gels [118], or
microscale coatings [116, 125]. Our lab uses cell membrane proteins as targets to highly
specifically functionalize cellular surfaces with eosin through antibody recognition [33].
When suspended in a monomer solution containing TEA and irradiated, localized
polymerization occurs only near the membrane of initiator labeled cells. This process yields

57
individually encapsulated cells in an ~100 nm thick hydrogel film while retaining high cell
viability [33]. A limitation in this technology is the lack of commercially available eosin
conjugates to common biorecognition molecules. Currently researchers must prepare their
own eosin conjugates to achieve cell surface immobilization [66].
Fluorescein is another molecule that is part of the family of xanthene
photosensitizers [38]. Like eosin, fluorescein can undergo the same photoinitiation
mechanisms with a tertiary amine coinitiator to generate active radicals [38, 41, 119].
Figure 5.2 below shows the structural similarities between eosin and fluorescein.
Figure 5.2: Chemical structures of eosin Y and fluorescein.
While eosin has been extensively studied in radical polymerization [38, 40, 116, 119, 125-
129], fluorescein has generally shown comparative results [119, 130]. While fluorescein
possesses similar abilities of cyclic regeneration for continued radical production, it has
been shown to be less effective at achieving gelation and also has lower sensitivity
requiring a greater presence or surface density than that of eosin [119, 130].
In this study we seek to directly compare the ability of fluorescein and eosin to generate
thin films. Although eosin and fluorescein have been studied simultaneously on polymerization

58
ability [38, 119, 130], the eosin-5-isothiocyantate (EITC) and commercially available fluorescein-
isothiocyante (FITC) have not been evaluated under the cytocompatible conditions of aqueous
media at neutral pH with decreased coinitiator concentration. We first compare film generation of
FITC and EITC on protein printed micro array slides which serve as a model for the cell surface.
Serial dilutions of printed protein afford sensitivity determinations and film thickness analysis
across a range of initiator surface densities. These micro array slides also offer great reproducibility
that is not readily observed on living biological substrates. We then compare these initiators on
living substrates. Epidermal growth factor receptor (EGFR) was targeted on the surface of A549
cells for initiator immobilization and subsequent hydrogel encapsulation. Hydrogel encapsulation
was determined by hypotonically challenging the coated populations. Complete hydrogel coatings
of sufficient thickness provide membrane reinforcement against swelling and lysis in hypotonic
conditions. We show that FITC is capable of generating films similar to that of ETIC on both micro
arrays and living cells. As FITC is >10-fold cheaper than EITC by mass and is widely commercially
conjugated to biorecognition molecules, this work presents an exciting step forward in translating
our technology to a more standardized process with a range of applications.
5.2 Chemical structures of eosin Y and fluorescein.
5.2.1 Micro array printing
Protein printed micro array slides were prepared as described in Chapter 3.5 with a
larger range of biotin-BSA (bBSA) concentrations. A total of 24 spots were printed at two
locations on each slide to be centered in the Whatman Chip Clip well. Two spots of each
of the twelve bBSA solution concentration were printed on each slide. Serial dilutions of
1000, 400, 160, 64, 25.6, 10.2, 4.1, 1.64, 0.66, 0.26, 0.1, and 0 µg bBSA/mL were used.

59
5.2.2 Micro array polymerization
Polymerization on micro array glass slides was done as described in Chapter
3.6, with minor changes in component concentrations as noted here. Monomer
formulations contained 420 mM PEGDA-575, 210 mM triethanol amine (TEA) and
35 mM vinyl pyrrolidinone (VP) in deionized water. Cytocompatible conditions were
achieved through the use of PBS as a solvent, pH adjustment with 1.2 M hydrochloric
acid to 7.3-7.5, and lowering the concentration of TEA by 10-fold to 21 mM. Monomer
solutions were gently bubbled with ultra-pure nitrogen to remove excess oxygen from
solution. Irradiation was done at 20 or 30 mW/cm2 using a collimated LED lamp
(M530L3) for 10 min.
5.2.3 Fluorescent calibration using Cy3
SA-Cy3 conjugates were labeled on to micro array slides identically to SA-
EITC and SA-FITC as described in Chapter 3.8. Micro array scans for fluorescence
were done using an Affymetrix 428 array scanner. Fluorescent intensities were
obtained with excitation from 532 nm laser line and detection with a 570 nm centered
band pass filter. Fluorophore surface density was determined using a Cy3 calibration
slide (Full Moon Biosystems). This calibration slide contained highly accurate Cy3
surface density for 28 values at 2-fold dilution with 12 replicates of each. Using the same
scanning conditions, a calibration curve was generated and used to calculate surface
density of bound SA-Cy3 conjugates.
5.2.4 Surface polymerization of A549 cells
Cells were cultured and harvested as described in Chapter 3.2. Immunolabeling of A549
cells was done using a biotinylated mouse anti-human EGFR primary antibody at a

60
1:100 dilution in blocking buffer of PBS supplemented with 3% fetal bovine serum (FBS).
200 µL of primary antibody were incubated with 1.5 million cells for 40 min on ice. Cells
were then washed 2x with blocking buffer. Cells were then labeled with SA-EITC as
described in Chapter 3.8. Monomer formulations for use with cells contained PEGDA 3400
(synthesized as reported [33]) for increased cytocompatibility over that of PEGDA 575 as
generally higher molecular weight PEGDA monomers show decreased cytotoxicity [131].
PEGDA 3400 was used at 25 wt/v% with 21 mM TEA, 35 mM VP in PBS with final pH
adjusted to 7.3-7.5. Monomer solution was bubbled with humidified ultra-pure nitrogen for
10 min prior to use to remove excess dissolved oxygen. Initiator labeled cells were
polymerized as described in Chapter 3.9. Briefly, cells were suspended in 350 µL of
monomer solution and placed into the well of a Whatman chip clip containing a standard
microscope slide. The chip clip was placed into a polymerization chamber fabricated from
two polystyrene petri dishes. The chamber was purged with nitrogen for 5 mins before, and
for 10 mins during irradiation. The sample was irradiated at 30 mW/cm2 for 10 min. Cells
were then collected and washed 2x in PBS for further analysis.
Cell polymerizations using FITC as a photoinitiator were initially labeled with a
primary antibody as described above. Cells were then labeled with a commercially
available, FITC conjugated, horse anti-mouse secondary antibody (Vector Labs).
Incubation of cells in 200 µL of the FITC secondary antibody at a 1:100 dilution was done
on ice for 40 mins. Cells were then washed in PBS and polymerized as described above for
EITC labeled cells.

61
5.3 Results and Discussion
5.3.1 Spectral Analysis of EITC and FITC
For experimental consistency, one lamp centered at ~530 nm was used for all
polymerization experiments that has previously been shown to be effective with eosin [19,
33, 124, 132]. There are a number of xanthene dye derivatives that have been shown to
absorb light in the visible range. Many of these molecules can also undergo similar
mechanisms of radical generation in the presence of a tertiary amine. The absorbance and
intersystem crossing quantum yield of a molecule is highly dependent on the substitution
of the molecule, which gives rise to a range of fluorescent dyes [38]. This is evident in
comparing the maximum absorbance of eosin (~530 nm) and fluorescein (~495 nm).

62
Figure 5.3: Analysis of photoinitatior absorbance spectral overlap for (a) SA-FITC and
(b) SA-EITC with a Thorlabs collimated LED emitting green light. Lamp
spectra obtained from manufacturer.
Due to the difference in the maximum absorbance wavelength of these two initiators, we
first quantify the spectral overlap of the lap with each dye. Extinction coefficients were
calculated using Beer-Lambert law with absorbance data collected by a UV/Vis
spectrophotometer (Nano Drop 2000). Normalized emission data from the LED and
extinction coefficients are plotted in Figure 5.3, and spectral overlap was quantified using
numerical integration. Extinction coefficients of EITC and FITC agree with literature
values for eosin Y and fluorescein alone indicating that conjugation to biomolecules have
0
0.05
0.1
0.15
0.2
0.25
0.0E+00
5.0E+04
1.0E+05
1.5E+05
400 450 500 550 600
Nor
mal
ized
Lam
p In
tens
ity (a
.u)
Wavelength (nm)
SA-EITC
Green Lamp
0
0.05
0.1
0.15
0.2
0.25
0.0E+00
5.0E+04
1.0E+05
1.5E+05
400 450 500 550 600
Nor
mal
ized
Lam
p In
tens
ity (a
.u)
Wavelength (nm)
SA-FITC
Green Lamp
1.5x10⁵
1.0x10⁵
5.0x10⁴
0
1.5x10⁵
1.0x10⁵
5.0x10⁴
0
extin
ctio
n co
effic
ient
(cm
-1M
-1)
extin
ctio
n co
effic
ient
(cm
-1M
-1) (b)
(a)
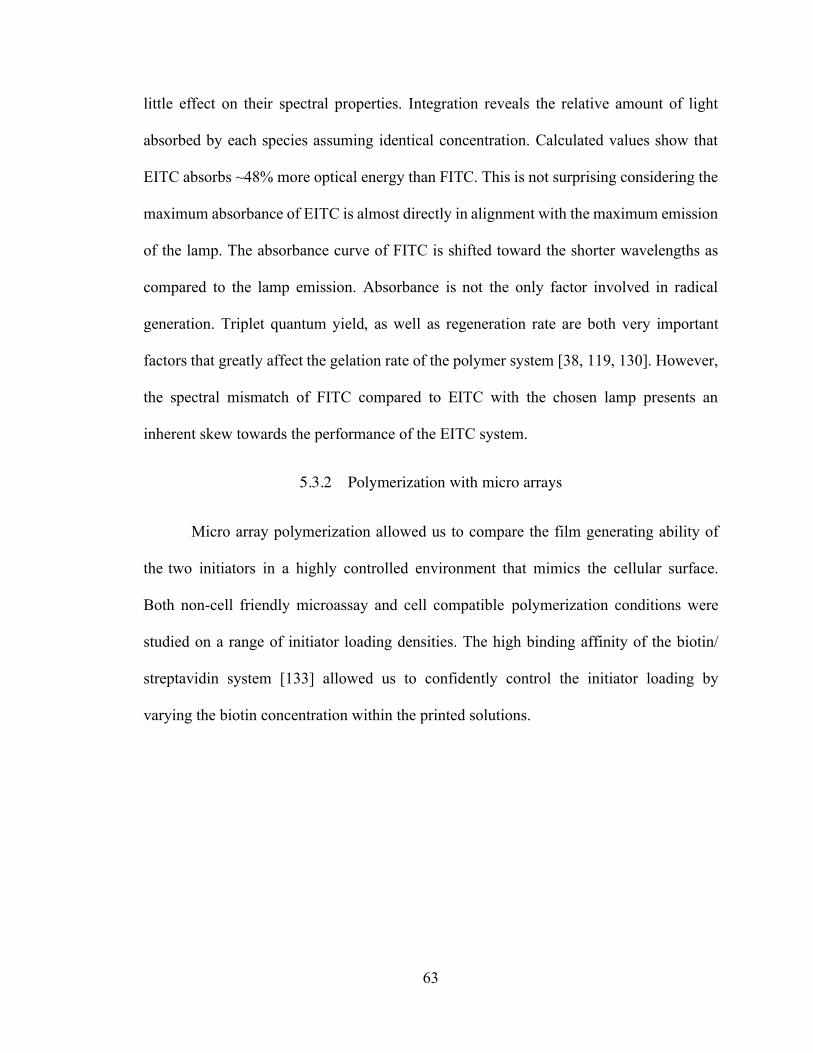
63
little effect on their spectral properties. Integration reveals the relative amount of light
absorbed by each species assuming identical concentration. Calculated values show that
EITC absorbs ~48% more optical energy than FITC. This is not surprising considering the
maximum absorbance of EITC is almost directly in alignment with the maximum emission
of the lamp. The absorbance curve of FITC is shifted toward the shorter wavelengths as
compared to the lamp emission. Absorbance is not the only factor involved in radical
generation. Triplet quantum yield, as well as regeneration rate are both very important
factors that greatly affect the gelation rate of the polymer system [38, 119, 130]. However,
the spectral mismatch of FITC compared to EITC with the chosen lamp presents an
inherent skew towards the performance of the EITC system.
5.3.2 Polymerization with micro arrays
Micro array polymerization allowed us to compare the film generating ability of
the two initiators in a highly controlled environment that mimics the cellular surface.
Both non-cell friendly microassay and cell compatible polymerization conditions were
studied on a range of initiator loading densities. The high binding affinity of the biotin/
streptavidin system [133] allowed us to confidently control the initiator loading by
varying the biotin concentration within the printed solutions.

64
Figure 5.4: Specific polymerization of photoinitiator tagged micro arrays. (A) Grayscale
fluorescence scanner image of SA-EITC bound to biotin-BSA printed micro
arrays. Scan at 50 dB gain with 532 nm excitation and 551/25 nm detection
with bandpass filter. (B) Grayscale fluorescence scanner image of SA-FITC
bound to biotin-BSA printed micro arrays. Scan at 50 dB gain with 532 nm
excitation and 551/25 nm detection with bandpass filter. (C) Bright field
optical microscopy example image of a micro array sample tagged with SA-
FITC after photopolymerization at 30 mW/cm2 for 10 minutes.
Local gelation and varying of specific binding to only bBSA printed areas can be seen in
Figure 5.4. The variation in biotin print concentration is observed for both EITC and FITC
labeling in Figure 5.4a and 5.4b respectively. Figure 5.4c shows local film generation in

65
conditions that are conducive to high cell viability. Although this polymerization system
has been used in rare protein detection with highly sensitive gelation [44], parameters have
been modified to support living cell applications. Solution tonicity, pH, component
concentrations, irradiation time and intensity, all must be considered when using living cell
systems. To account for viability, PBS was used as the monomer solvent, pH was adjusted
to physiological levels (~7.5), and the toxic component of TEA was reduced by 10-fold
from 210 mM to 21 mM.
Thickness of generated film for EITC and FITC under cell friendly conditions
under two different radiation intensities can be seen in Figure 5.5. Film thickness was
recorded by profilometry. The highest film generation of ~145 nm average thickness
occurred with 30 mW/cm2 radiation of SA-EITC functionalized spots at the highest bBSA
densities.

66
Figure 5.5: Comparative analysis of polymer gelation thickness vs. photoinitiator density
for SA-FITC and SA-EITC tagged micro array samples. Analysis was
conducted with cell compatable conditions consisting of 420 mM PEG-
diacrylate, 21 mM triethanol amine, 35 mM vinyl pyrrolidone, in phosphate
buffered media (pH=7.5) with a constant reaction time of 10 minutes.
The EITC labeling density for these spots was ~18,000 molecules/µm2, and yielded film
generation comparable to previously published works with similar conditions [124, 132].
Increased radiation intensity generally showed increased film generation as expected for
both EITC and FITC. Increased radiation likely increases the influx of active radicals for
faster gelation at similar initiator loading, especially at the higher initiator surface densities.
While neither initiator showed any appreciable film generation at the lowest print
concentrations, EITC does show a lower threshold for initial gelation indicating a higher
sensitivity. Lower threshold limits were ~1,200 molecules/µm2 for EITC and ~1,800
molecules/µm2 for FITC.

67
Film generation by FITC initiation was generally lower than EITC for the same
loading conditions. However, FITC was still able to record appreciative polymer formation
even with the discussed disadvantage of spectral mismatch. At high initiator loading and
high intensity, FITC was able to generate films that averaged ~100 nm, which is very
different than previously reported studies for fluorescein in aqueous conditions [38]. These
reports have stated that quantum yield of the triplet state and radical generation is much
lower for fluorescein than that of FITC. However, a large difference in our study is the use
of the 530 nm LED. Other studies have used sources with a very narrow bandwidth such
as laser lines that are either well above 500 nm or near 400 nm [130]. As we have calculated
that FITC absorbs ~48% less light than EITC with our relatively broad bandwidth source,
absorption would decrease drastically with decreased bandwidth. These studies suggest
that a light source that is further aligned with the absorption profile of FITC would
considerably increase absorption and radical generation for initiation of polymerization.
This study also evaluated the film generation in ‘unconstrained’ conditions which
are not conducive to cell viability. Coinitiator concentration was increased 10-fold, pH was
not adjusted, and the solvent was not buffered. Figure 5.6 shows the drastically increased
film generation of the FITC initiated unconstrained system. Sensitivity is increased nearly
2-fold to a threshold of ~1000 molecules/µm2, and film generation rivals that of previously
reported values for EITC initiated systems. This suggest the possibility of the
commercially available FITC bioconjugates for use in sensitive biorecognition assays.

68
Figure 5.6: Comparison of polymer gelation thickness vs. photoinitiator density with cell
compatible and unconstrained formulations and FITC photoinitiation. All
samples were irradiated with 20mW/cm2 of green light (530 nm LED lamp,
ThorLabs) for 10 minutes. Cell compatible = 420 mM PEG-diacrylate, 21 mM
triethanol amine, 35 mM vinyl pyrrolidone, in phosphate buffered media
(pH=7.5). Unconstrained= 420 mM PEG-diacrylate, 210 mM triethanol amine,
35 mM vinyl pyrrolidone in deionized water.
5.3.3 Cell encapsulation using FITC initiated systems
For comparison of EITC and FITC on living cell encapsulation, epidermal growth
factor receptor (EGFR) was targeted on the surface of the non-small cell lung cancer line,
A549. A549 cells have been shown to overexpress EGFR, which serves as a prototypic
model for FITC initiation in a live cell system. Cells were first labeled with mouse
antibodies against human EGFR followed by initiator labeling with either SA-EITC or a
FITC labeled secondary antibody. Initiator labeling was confirmed by green fluorescence

69
using flow cytometric analysis. Polymerization was carried out with cell friendly
conditions and viability was assessed by MTT assay shown in Figure 5.7 (figure caption
on page following figure). Viability following polymerization was maintained for both
initiating systems. While different cell lines may show different susceptibility to toxins,
these data show that FITC, like EITC, is generally compatible for surface polymerization
on living cells. Polymerized cells were then subjected to hypotonic conditions where
uncoated cells are lysed, while cells possessing a complete coating are protected from the
harsh conditions [21, 33]. The FITC initiated system shows very comparable results of
~20% viability following hypotonic challenge.

70

71
Figure 5.7: Polymerization of A549 cells using an eosin or fluorescein photoinitiator
targeted to EGFR and PEGDA3500 as a monomer. (a) Fluoroscence image of
A549 cells coated with red fluorescent hydrogel using an eosin photoinitiator.
(b) Fluoroscence image of A549 cells coated with red fluorescent hydrogel
using a fluorescein photoinitiator. (c) Viability of A549 cells determined using
MTT assay at various stages of polymerization (n=3).
These findings indicate film generation with a commercially obtained FITC
bioconjugate is similar to that of the SA-EITC that is extensively used. Cell viability data
and micro array studies agree with the performance of FITC compared to EITC. Our
results support the use of FITC initiated systems for cellular encapsulation in isolation
[21, 33], immunoprotection [33, 134-136] applications as well as sensitive
polymerization-based amplification [44].
5.4 Conclusion
In this study we directly compared the initiating ability of SA-EITC and SA-FITC
on micro array formats under cytocompatible conditions. We sought to determine the
feasibility of commercially available FITC conjugates for live cell encapsulation as a
standardized alternative to custom SA-EITC conjugates. Although spectral calculations
indicate that FITC absorbs 48% less light than that of EITC for the 530 nm LED used here,
film generation on micro array systems were comparable. FITC systems were able to
generate films of ~100 nm in the constrained cell friendly environments and ~350 nm is
unconstrained conditions. Live cell studies indicated very similar viabilities of polymer
coated cells as well as hypotonically challenged cells with either system. These results

72
support the use of commercially available FITC-conjugates for single cell encapsulation,
thus further standardizing the encapsulation process.

73
CHAPTER 6. SCALING PROCESS TO THERAPEUTIC SCALE FOR ACCURATE CTC DETECTION AND ISOLATION
6.1 Introduction
Cancer is a leading cause of death in the United States and worldwide. With an
estimated over 1.7 million new cases in 2017, and a lifetime probability of diagnosis of
40.8% and 37.5% for men and women respectively, cancer research is among the most
intensely studied diseases [137]. Tools for early diagnosis, prognosis, and effective
treatments in this drastically heterogenous disease are rigorously studied [67, 69, 70, 138].
A subset of cancers and by far the most lethal, are the metastatic diseases. Metastasis occurs
when cells from the primary tumor make their way into the blood stream, travel to a distant
site and exit circulation where they colonize and begin the formation of a secondary tumor
[24, 26, 67, 71]. Metastatic cancers are responsible for >90% of all cancer related deaths
[26, 67]. Multiple mechanisms are thought to be responsible for the presence of circulating
tumor cells (CTCs) including leaky vasculature, and a phenotypic change from more
adhesive cell type to much more invasive and mobile cells called the epithelial to
mesenchymal transition (EMT) [88, 139]. EMT is thought to be a reversible process where
cells lose epithelial nature to enter circulation, but then regain lost characteristics during
colonization at a distant site [139]. Tumor cells in circulation were first observed over 150
years ago [68], and have been widely studied ever since [24, 26, 67, 71]. Recently, the
concentration of CTCs in peripheral blood has been shown to provide important prognostic
information in some cancers [29-31, 140]. Not only does accurate detection of these cells
serve as a prognostic indicator, but these cells present the possibility of an early diagnostic
tool in the form of a ‘fluid biopsy’. These CTCs are believed to appear in blood as many
as 17 years before a primary tumor becomes large enough to detect with typical scans [71].

74
Early diagnosis of cancers, especially the lethal metastatic variety, would allow patients to
undergo treatment years before the current timeline which would greatly increase survival
rates [69, 70]. This diagnostic tool also has the advantage of being minimally invasive as
opposed to invasive and often painful solid tumor biopsies. Accurate detection and
enumeration of CTCs is plagued by the extreme rarity at which they occur (~1 CTC per
million nucleated blood cells), and the vast heterogeneity in characteristic marker
expression between cancers [24], as well as a result of EMT [26]. The rarity at which CTCs
are observed in blood indicate the need for a robust detection method that can process large
cell numbers while maintaining high sensitivity.
The two most common types of viable cell isolation techniques are magnetic
activated cell sorting (MACS) and Fluorescent activated cell sorting (FACS). These two
methods both use antibodies that target antigen expression characteristic of the target cell
population to distinguish them from the rest of a heterogenous sample. MACS uses
antibody functionalized magnetic microbeads to label target cells rendering them
susceptible to magnetic fields. Cell are then passed through a column that is placed within
a strong magnetic field. Magnetically functionalized cells are retained at the wall of the
column while all other cells pass through, followed by removal of the magnetic field and
collection of target cells. FACS surface functionalizes specific cells with fluorochromes.
Flow cytometry is then used to physically separate target cells from the rest of the
population. Using microfluidics to funnel cells into single file, cells are fluorescently
analyzed one-by-one. The sample stream is aerosolized into microdroplets containing
individual cells. Each droplet is electrically charged based on the cell’s fluorescent
characteristics before passing through an electric field where droplets are deflected to

75
separate containers based on charge. While MACS maintains the advantage of high sorting
speeds (up to 1011 cells in ~30 min) [75], the isolation purity is far less than desired, and is
dependent on initial target cell population [78, 79]. FACS is able to achieve very high
purities but is greatly limited by the processing time in large cell numbers due to analysis
of each individual cell.
Currently, the only FDA approved CTC enumeration method for clinical utility is
the CellSearch system [29-31, 140]. CellSearch uses MACS as a pre-enrichment step
followed by cell fixation, permeation and intracellular staining for characteristic epithelial
markers. Stained cells are then analyzed by a Celltracks Analyzer II where positive cells
are determined visually by the user. While magnetic enrichment decreases the overall cell
count to be analyzed microfluidically, processing time may still be a challenge when
scaling batch sizes. The major limitation of the CellSearch system is the lack of viable
isolated cells. Fixation and intracellular staining may provide prognostic information, but
at the cost of translation of the technology. Fixation limits the applications of the
CellSearch system to enumeration only, and provides no possibility of functional cell
analysis or use of isolated cells.
Our lab has developed an isolation strategy that possesses the processing power of
MACS and the isolation purity of FACS using relatively inexpensive materials. Antigen
specific lysis (ASL) uses antibody recognition similar to that of MACS and FACS to very
specifically distinguish target cells within multiple populations. Target cells are surface
functionalized with a visible light photoinitiator, where upon radiation in the presence of
monomer will initiate localized polymerization individually encapsulating target cells in a
protective hydrogel. The entire population is then subject to harsh conditions, such as ionic
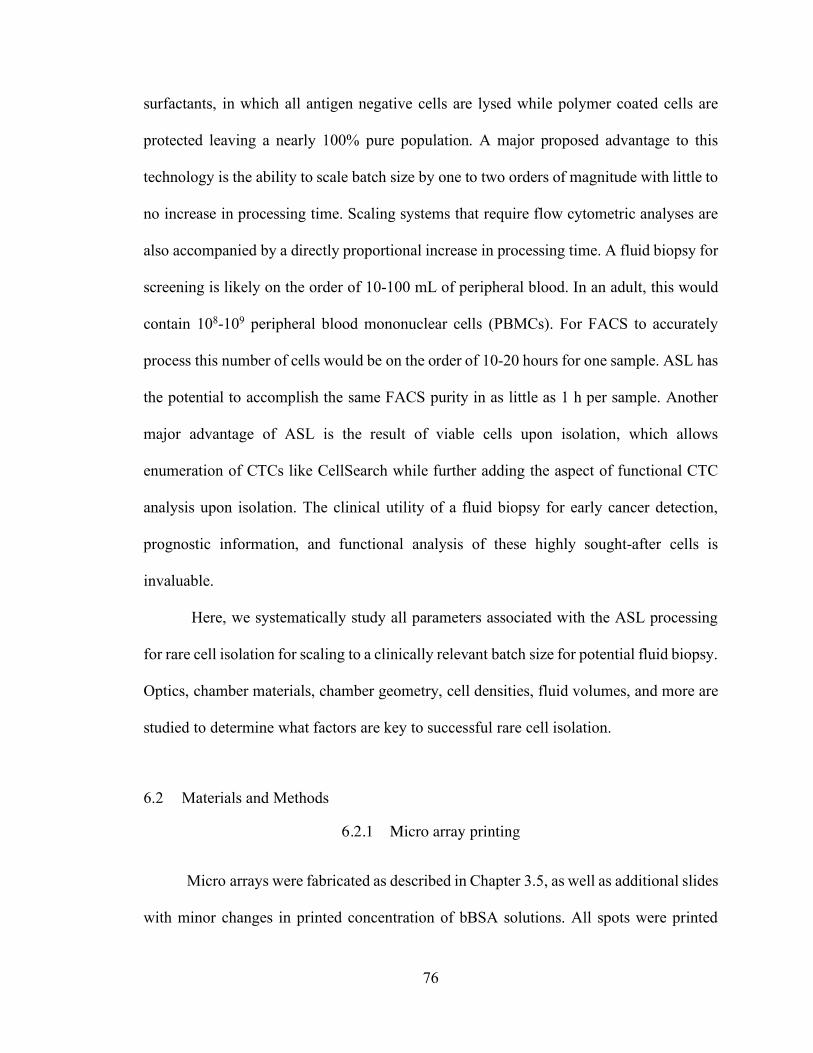
76
surfactants, in which all antigen negative cells are lysed while polymer coated cells are
protected leaving a nearly 100% pure population. A major proposed advantage to this
technology is the ability to scale batch size by one to two orders of magnitude with little to
no increase in processing time. Scaling systems that require flow cytometric analyses are
also accompanied by a directly proportional increase in processing time. A fluid biopsy for
screening is likely on the order of 10-100 mL of peripheral blood. In an adult, this would
contain 108-109 peripheral blood mononuclear cells (PBMCs). For FACS to accurately
process this number of cells would be on the order of 10-20 hours for one sample. ASL has
the potential to accomplish the same FACS purity in as little as 1 h per sample. Another
major advantage of ASL is the result of viable cells upon isolation, which allows
enumeration of CTCs like CellSearch while further adding the aspect of functional CTC
analysis upon isolation. The clinical utility of a fluid biopsy for early cancer detection,
prognostic information, and functional analysis of these highly sought-after cells is
invaluable.
Here, we systematically study all parameters associated with the ASL processing
for rare cell isolation for scaling to a clinically relevant batch size for potential fluid biopsy.
Optics, chamber materials, chamber geometry, cell densities, fluid volumes, and more are
studied to determine what factors are key to successful rare cell isolation.
6.2 Materials and Methods
6.2.1 Micro array printing
Micro arrays were fabricated as described in Chapter 3.5, as well as additional slides
with minor changes in printed concentration of bBSA solutions. All spots were printed

77
with the same concentration of bBSA to ensure identical biotin surface densities for
accurate analysis of other parameters. All array spots were printed with a bBSA
concentration of 160 µg/mL in PBSA for a total protein concentration of 1000 µg/mL.
6.2.2 Radiation intensity with increase monomer volume
Whatman incubation chambers were firmLy held against a standard microscope
slide using binder clips. Clips were positioned such that slides were able to lay flat upon
the radiometer detector without any obstruction of optics. Complete PEGDA 700 monomer
formulation was added to the slide first at 150 µL followed by 100 µL additions. Radiation
intensity was recorded along with the total monomer volume after each addition. All
monomer formulations for intensity measurements and polymerization experiments on
micro arrays used PEGDA 700 as described in Chapter 3.6.
6.2.3 Maximum Target Cell Density
Maximum target cell density was assessed by varying number of total cells
processed with volume processed. Physical parameters such as fluid depth and radiation
incident angle were controlled by changing only chamber surface area to vary volume.
Three glass bottom dishes (Cellvis) of varying diameters (10, 14, 20 mm) with constant
well depth were used. All glass bottom dish diameters were well within the diameter of the
radiation beam. Polymerization using PEGDA 700 on cell surfaces was performed as
described in Chapter 3.9.

78
6.3 Results and Discussion
Here, we sought to quantitatively assess the parameters associated with localized
polymerization on both controlled micro array formats as well on living cells. Initiation of
polymerization through visible light radiation is highly dependent on observed radiation
intensity by the photoinitiators. This has been shown in multiple studies including the
previous chapter and is observed in Figure 5.6. When scaling the process, volume of
monomer solution used, and perhaps more importantly, depth of a monomer within the cell
solution chamber can have a large effect on the radiation which cells further from the
solution surface see. The monomer solution is relatively clear and colorless and therefore
absorption of visible light is minimal, but slight turbidity and light scattering play a role.
Using a radiometer, we monitored the effect of fluid depth on radiation intensity observed.
Figure 6.1 shows the normalized radiation intensity with different monomer volumes
within the polymerization well.

79
Figure 6.1: Normalized observed radiation intensity for increasing volume of monomer
solution. Values are normalized to observed radiation through a standard
microscope slide in the absence of monomer solution.
All values were normalized to the radiation observed in the presence of the glass slide and
absence of monomer solution. As expected, radiation observed by the detector after passing
through the solution slightly decreases in intensity. One interesting observation is the
radiation intensity appears to level off as monomer addition is continued. This may be
explained partially by the irregular geometry of the chamber wall as fluid depth increases,
as well as meniscus effects with chamber wall. With these variables, 100 µL additions may
not directly translate to an increase in fluid depth associated with a perfectly square or
circular wall geometry. Therefore, additional experimentation is warranted using a more
controlled geometry. In light of these findings, we proceeded to determine the effect of the

80
fluid depth on film generation using micro array slides. Figure 6.2 reports thickness
of generated film as determine by profilometry for multiple monomer volumes in the
same size well.
Figure 6.2: Thickness of generated polymer film determined by contact profilometry for
multiple monomer volumes within the same chip well.
From Figure 6.2 it is evident that the volume of solution plays a significant role in the
ability to generate polymer. However, the drastic decrease in film generation correlated to
the difference in observed radiation intensity suggests that there are more factors effecting
the system than fluid depth alone. Figure 6.1 shows less than a 2% difference in observed
radiation intensity from 350 µL to 550 µL of monomer solution, as Figure 6.2 shows an
~4-fold decrease in film generation from 350 µL to 550 µL. Another major factor in radical
polymerization that would depend on solution volume is the presence of oxygen in
solution. Oxygen is known to quench active radical species hindering free radical
polymerization. For this reason, all polymerizations are carried out under an inert nitrogen

81
atmosphere. As described in Chapter 3.9, the system is purged for 5 mins before and for
the duration of irradiation. Purging the system with nitrogen facilitates diffusion of oxygen
out of solution for less radical quenching. Increasing solution volume affects the rate at
which oxygen leaves the system. As concentration is the driving force behind mass
transport, increased fluid depth correlates to increased time before a change in oxygen
concentration is observed at points furthest from the solution/nitrogen interface. Additional
experimentation was done using nitrogen bubbled solutions. Identical processing to that of
data collected for Figure 6.2 was done, with the additional step of gently bubbling nitrogen
through the solution. Although this step introduces additional variables such as evaporation
of solvent which may result in slight changes in component concentration, it greatly
increases the rate at which oxygen is removed from solution. Figure 6.3 shows the
thickness of generated film for the experiment including nitrogen bubbling.

82
Figure 6.3: Thickness of generated polymer film determined by contact profilometry for
multiple monomer volumes within the same chip well after nitrogen bubbling
of the monomer solution. Dashed lines indicate nitrogen bubbled monomer
studies, while solid lines indicate studies without bubbling nitrogen through the
monomer before use.
While there still appears to be a trend in monomer solution depth and with thickness of
generated film, the distinction is less evident. These data support the hypothesis that
oxygen diffusion plays a role in film generation through the increase thickness for all
monomer volumes studied and the increased sensitivity in film generation of 450 µL and
550 µL volumes on the lower biotin printed spots. Additional experimentation of these
conditions may be required to allow statistical analysis for this parameter.

83
Next, we looked to determine the film generation dependence on the variation in
light intensity within the radiated area as well as meniscus effects at the edges of the
solution chamber. Although the collimated light source is theoretically consistent in
radiation intensity in the beams cross sectional area, slight variations are inherent within
the LED system. Additionally, the angle of incidence between light and the solution will
affect the amount of light transmitted across the change in medium. With the micro array
centered within the chip clip well, the solution fluid is relatively flat and therefore the angle
of incident light essentially 0˚, which facilitates a maximum transmittance. In the meniscus
region however, this angle will be significantly greater. In cellular studies, as opposed to
micro array polymerization, target cells occupy the solution well and not just the
center. Figure 6.4 demonstrates how each of these parameters effect film generation.

84
Figure 6.4: Normalized film thickness generated on micro arrays under varying
conditions. Left: Array centered within the chip well and centered within
radiation area. Middle: Array positioned at the edge of the chip well where the
meniscus is most prominent while centered under radiation area. Right: Array
centered within chip well while positioned at the edge of radiation area where
variation in light intensity is most prominent. Top: Normalized film generation
(x and y axes represent printed micro array position analyzed. Conditions
varied in the x direction). Bottom: Schematic of polymerization set up (View
of the x-z plane).
It is evident from Figure 6.4 that the meniscus plays a crucial role in film
generation on micro array polymerization. Light variation across the collimated source is
also a minor factor as is evident from the slight decrease in film generation in spots as
they approach the edge of the beam. It is worth noting that while there is not
quantitative data for the combined effect of lamp variation and the meniscus it is
highly likely that the two

85
parameters would compound to show an even greater deficit in film thickness. Again, this
becomes a more significant issue in cellular polymerizations as a large number of cells
occupy this area.
Figure 6.5: Analysis of total cells processed with total volume processed. Lines draw
estimated distinction between observed bulk gelation and individual cell
encapsulation.
In conjunction with acellular studies, cellular experiments were also conducted. As
maximum target cell density is not likely an issue regarding rare cell isolation, we still
explore this parameter for rigor as exceeding this maximum results in bulk gelation of the
sample in a covalently crosslinked system. As shown in Figure 6.5, we have observed an
upper limit of target cell density to be ~6-8 million cells/mL. At this point small bits of
bulk polymer will form in solution. Exceeding these cell densities resulted in nearly a one

86
continuous crosslinked network of cell laden hydrogel. Minimum target cell density is
among the most important of the parameters as CTCs are on the order of 1 per million
PBMCs. Achieving this level of sensitivity is crucial to providing diagnostic and prognostic
information in a clinical setting.
6.4 Conclusion
Here we systematically study the processing parameters of ASL for scaling to
clinically relevant batch sizes. This system has the potential to provide highly sensitive,
viable cell isolation for the application of CTC detection in a fluid biopsy. As the only FDA
approved method for CTC enumeration does not produce viable cells for functional
analysis, we propose a novel and scalable alternative to viable cell isolation in ASL.
Through the information gained in this study, we can improve the efficacy of the current
batch sizes as well as determine what parameters are of great importance in clinically
relevant batches. Although experimentation is ongoing, we have learned a great deal in
acellular studies. Angle of incident light, and monomer solution depth (with roles of
oxygen diffusion) appear to have great effects on the ability to generate film on micro array
slides. These data suggest that increasing processed volumes by increased solution
chamber surface area as opposed to depth would be beneficial. This would minimize
attenuation of light by scattering within the monomer solution as well as allow for rapid
diffusion of oxygen away from the system. A potential problem is that increased surface
area also increases evaporation rate of monomer solution in volume per time. Additionally,
solution chambers that have a minimized meniscus, maximizing light at a normal incidence
would also maximize the efficiency of the irradiated area.

87
CHAPTER 7. MECHANICAL PROTECTION FOR HIGH RESOLUTION, HIGH THROUGHPUT 3D CELL PRINTING
7.1 Introduction
The shortage of donor organs continues to be critical problem [141]. Efforts have
been made through education programs and expanded donor criteria to increase the number
of donors [142], but the demand continues to rise faster than supply. Every day 20 patients
die waiting on a donor organ (based on OPTN data for 2017). There are currently over
4,000 patients on the waiting list of a heart while less than 3,300 heart transplants were
conducted in the entire year of 2017 (based on OPTN data for 2017). The drastic deficit of
cadaverous and live organ donors to the demand clearly highlights the need for a new
source of viable organs. 3D bioprinting shows great promise in bridging this gap between
supply and demand. 3D bioprinting is the precise deposition of biological or biocompatible
components into constructs to imitate or replicate natural functions. Non-biological 3D
printing has gained great momentum in the past two to three decades. It has been used to
print a range of structures from toys and trinkets, to objects for educational purposes, to
functional prosthetics [57, 58]. 3D printing has proved to be very useful for education in
the medical field [143]. Printed anatomical structures help to visualize the complex
morphologies in ways that 2D representations fail. This can be especially important in
surgical planning where imaging and printing surgical sites of interest or anomalies can
greatly prepare surgeons for medical procedure [46, 47]. In recent years, this technology
has been translated to use with biocompatible materials in printing numerous cellular and
acellular structures for tissue engineering in regenerative medicine [48-54], and 3D organ-
on-a-chip for in vitro drug screening [55, 56]. The world of 3D bioprinting holds an

88
exciting future in a range of biological applications including the printing of whole organs
for transplant.
The keys to successful tissue/organ printing are precise, high throughput deposition
of viable cells. Incorporation of vasculature within large tissue is critical for transport of
nutrients to sustain viability, but requires extremely high-resolution printing. With the
harvesting, propagation, and differentiation of a patient’s own stem cells, tissues can be
printed with the necessary numbers and phenotypes while ensuring that the possibility of
graft vs. host rejection is nearly eliminated [48, 53, 144]. This type of transplant is
essentially an autograft. 3D bioprinting has made great strides in the past 5-10 years, but
there are still many challenges that must be overcome before viable organ printing is
achieved.
Extrusion based bioprinters are a common type of printer that are commercially
available. These printers use pressure or mechanically driven flow to extrude material
through a small nozzle for direct write printing [59]. These types of printers are common
due to their simple design, moderate affordability, and compatibility with a large range of
viscosity bioinks and cell densities [48, 59, 145]. Some of these printers even have the
capability of printing multiple cell types through a multi-head printer design [53, 146, 147].
When printing cellularized scaffolds, these printers commonly use a suspension of cells in
a cytocompatible material, or ‘bioink’ for deposition onto a substrate. Common bioinks
consist of poly-(ethylene glycol) (PEG) acrylates, gelatin, collagen, and alginate [48, 49,
51, 53, 54, 62, 64, 65]. As advances in tissue engineering continue to be made, the choices
of biocompatible materials for potential bioink is increasing.

89
Figure 7.1: (Top) Schematic representation of cell deformation due to mechanical forces
during extrusion printing. As printing resolution increases from left to right
with constant flow rates, fluid velocity increases along with shear stress, τ, and
pressure drop, ∆𝑃. (Bottom) Stress/strain relationship for PEGDA 2000
subjected to uniaxial tension with representation of coated and uncoated cell
response to increasing fluidic shear.
Extrusion based printers carry with them the inherent challenge of shear mediated
cell damage. While tensile, compressional, and shear forces are all mechanical stimuli a
cell can experience during the printing process [64, 148, 149], shear forces have been the

90
main concern in maintaining cell viability and membrane integrity [65, 150, 151]. In fluid
flow through a small pipe, shear forces are created by the radial velocity gradient associated
with laminar flow [152]. These forces are highly dependent on pipe or capillary diameter
as well as flow rate. Figure 7.1 shows a schematic for the effect of shear forces on living
cells. For large tissue/organ printing, the combination of high throughput (high flow rate)
with high resolution (small capillary diameter) presents a critical issue for reduced cell
viability from shear-mediated death. 3D cell printing is commonly performed at resolutions
much greater than that of a single cell (150-300 µm nozzle diameter) and at flow rates that
are typically on the order of 1-10 µL/min. [60-63] With these current printing conditions it
would take on the order of 100 days to print one organ without achieving the necessary
resolution required for small vasculature. In efforts to minimize shear forces experienced
by cells, studies have been done in areas such as altering print heads [64], using low
viscosity bioinks [65] or using shear thinning fluids [63]. These printing techniques have
been able to print with high cell viability, but still with moderate resolution and relatively
low throughput. Advances must continue to be made in order for whole organ printing to
be done on a time scale plausible for transplantation.
In this study, we analyze the protective potential of hydrogel encapsulation against
the mechanical forces of high throughput, high resolution cell printing. Through a novel
encapsulation method developed in our lab, we examine polymers possessing a range of
mechanical properties on their ability to reinforce the cell membrane during extrusion. Rat
cardiac myoblasts (H9C2 cell line) were used as a model for cardiac tissue printing. These
cells were individually encapsulated by surface mediated photo-initiated radical
polymerization [33]. Both uncoated and surface functionalized cells were extruded through

91
50 µm diameter capillary at 4.8 µL/s. Cells were then analyzed for intactness using
scattering parameters in flow cytometry upon extrusion, as well as using two viability
assays. We then sought to decouple the cellular damage caused by rapid pressure changes
and shear associated with high throughput extrusion printing. Each parameter was tested
separately outside the system of extrusion for individual analysis. Mechanical properties
of each polymer were recorded for correlation to protection potential. This work aims
toward providing membrane reinforcement for simultaneous high resolution and high
throughput bioprinting for goals in whole organ printing.
7.2 Materials and Methods
7.2.1 Cell Encapsulation
Five different monomer formulations were evaluated for their protective potential in a high
shear, extrusion environment. All formulations contained equal amounts of the co-initiator
triethanolamine (TEA, Sigma >99%) and co-monomer vinyl pyrrolidinone (VP, Sigma
>99%) at 35 mM each. PEGDAs 700 (Sigma), 1000, 2000, and 3400 were all used at 25%
w/v, and the fifth formulation was 1% w/v of PEGDA 3400 with 3% w/v gelatin
methacryloyl (gelMA; BioBots). The formulation containing gelMA and PEGDA 3400 is
denoted as gelMA/3400. PEGDA 1000, 2000 and 3400 were all synthesized in house as
described in Chapter 3.1. All other procedures including cell culture, viability assays,
extrusion, and analysis are described in Chapter 3.

92
7.3 Results and Discussion
7.3.1 Mechanical Properties
Here, we present an extended application to a novel method of individual cell encapsulation
using surface mediated radical polymerization developed in our lab. Encapsulation in a
protective hydrogel provides mechanical protection of rat cardiac myoblasts for
simultaneous high resolution and high throughput bioprinting. We have shown that
encapsulation in thin hydrogel polymers possessing the right mechanical properties yield
significantly more intact cells over uncoated cells upon exposure to high shear forces
experienced traveling at high speeds through a narrow capillary.
Young’s modulus is a measure of hydrogel stiffness. The Young’s modulus, which is
commonly referred to as the modulus, of the gel is a measure of the deformation (strain) of
the gel required to develop a given stress. Stiffer materials have a higher modulus and
therefore generate a larger stress from the same deformation as softer materials. The
modulus of each gel was calculated by equation (1) below,
𝐸 ≡ ()=
+,-
∆../-. (1)
Where 𝜎 is the stress, or generated force, F, per cross sectional area, A, and 𝜖 is the strain,
or change in sample length, DL, relative to initial length, Lo. Moduli ranged from 9.2 +/-
0.8 kPa for gelMA/3400 to 1269 +/- 103 kPa for PEGDA 1000. Although PEGDA 700 did
not have the highest average modulus (Table 7.1), the means between PEGDA 1000 and
PEGDA 700 were not statistically different, suggesting that the small difference in
molecular weight did not greatly affect the mechanical properties and therefore still
preserving the expected trend between modulus and monomer molecular weight.

93
Table 7.1: All mechanical properties recorded for each polymer assessed. Data reported
as mean ± standard deviation.
Monomer Swelling Ratio Modulus Ultimate Tensile Strength (kPa)
Max Strain (%)
700 3.02 ± 0.03 1.21 x 10³ ± 127 138 ± 36 11 ± 2.7
1000 3.77 ± 0.12 1.26 x 10³ ± 103 128 ± 26 9 ± 1.4
2000 5.41 ± 0.12 502 ± 61 134 ± 23 9 ± 3.6
3400 7.21 ± 0.01 204 ± 20 55.0 ± 7.1 25 ± 0.94
GelMA/3400 15.4 ± 0.89 9.2 ± 0.79 6 x 10⁻⁴ ± 3 x 10⁻⁴ 44 ± 13
The expected trend of increasing modulus with decreasing molecular weight is due to the
formation of a more tightly crosslinked network. As molecular weight decreases, molecular
weight between crosslinks also decreases limiting the mobility of polymer chains within
the gel and therefore increasing the observed stiffness.
Ultimate tensile strength (UTS) and percent elongation at failure (%EL) were calculated
by equations (2) and (3) respectively.
𝑈𝑇𝑆 = +5,. (2)
%𝐸𝐿 = ∆𝐿𝐿8- × 100%. (3)
Where, 𝐹= is the force applied at the point of failure. Swelling ratios were determined as
described by equation (4) below,
𝑆𝑅 = ?@A?B?B
. (4)

94
Where ms is the mass of the swollen gel and md is the mass of the dried polymer. The
calculated swelling ratios of the five formulations ranged from 3.02 +/- 0.03 for PEGDA
700, to 15.41 +/- 0.89 for gelMA/3400. As expected, the swelling ratio decreases as the
molecular weight of the monomer decreases similarly to that of the modulus. This is due
to a decrease in molecular weight between covalent crosslinks within the hydrogel network
limiting the ability of the gel to take on water and swell.
7.3.2 Protective Potential
Cell samples were analyzed by flow cytometry both before and after extrusion
process. Events were gated for intact cells in samples before being extruded through the
capillary. These same gates were used to determine the fraction of cells that remained intact
after the harsh forces of high flow rate extrusion through the capillary. Figure 7.2 is a
representation of how each sample was gated and analyzed.
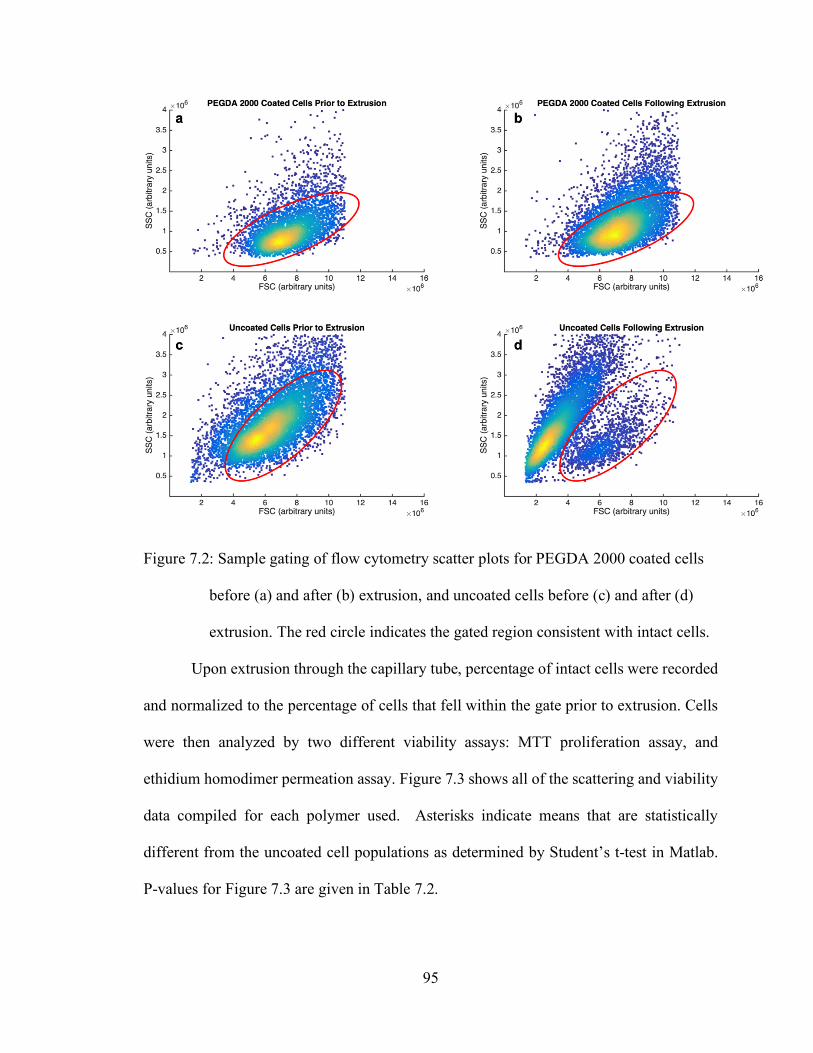
95
Figure 7.2: Sample gating of flow cytometry scatter plots for PEGDA 2000 coated cells
before (a) and after (b) extrusion, and uncoated cells before (c) and after (d)
extrusion. The red circle indicates the gated region consistent with intact cells.
Upon extrusion through the capillary tube, percentage of intact cells were recorded
and normalized to the percentage of cells that fell within the gate prior to extrusion. Cells
were then analyzed by two different viability assays: MTT proliferation assay, and
ethidium homodimer permeation assay. Figure 7.3 shows all of the scattering and viability
data compiled for each polymer used. Asterisks indicate means that are statistically
different from the uncoated cell populations as determined by Student’s t-test in Matlab.
P-values for Figure 7.3 are given in Table 7.2.

96
Figure 7.3: Cell viability for each assay type following extrusion for each polymer
coating. (* indicates statistically different mean than the corresponding
uncoated group.)
Table 7.2: P-values generated using Student’s t-test for samples following extrusion when
compared uncoated cells (Figure 7.3).
P-Values Polymer Type Scattering
Analysis EthD-1 MTT
PEGDA 700 0.005 0.003 0.107 PEGDA 1000 0.039 0.062 0.110 PEGDA 2000 0.027 0.179 0.165 PEGDA 3400 0.462 0.050 0.173 GelMA/3400 0.924 0.980 0.945

97
These viability data were then plotted against the measured mechanical properties of each
polymer to observe trends in protection potential. Figure 7.4 shows each polymer property
plotted against ethidium permeability assay as well as fraction intact as determined by
scattering properties in flow cytometry. MTT assay viability was left out of these figures
for clarity.

98
Figure 7.4: Mechanical properties of each gel plotted against ethidium permeability assay
and scattering properties. (a) swelling ratios, (b) modulus, (c) ultimate tinsel
strength, (d) percent elongation at failure. Polymer legend, scattering data, and
ethidium assay data are vertically in line with one another for a specific
polymer.
From this figure it can be observed that there is a clear trend between percentage of intact
cells by scattering to swelling ratio and modulus. Coatings formed using the higher
modulus gels, PEGDA’s 700, 1000, and 2000, showed a significantly higher protection
potential from lysis due to shear forces than the softer gels of PEGDA 3400 and

99
gelMA/3400 which did not significantly protect cells from lysis. This suggests that cells
coated in the higher modulus gels (>500 kPa) experience less deformation under the same
fluid forces and therefore reduce the number of cells lysed in the process. This same trend
was also observed for the swelling ratio. Polymers with a swelling ratio of <5.5 showed
significant protection when compared to uncoated cells. This data once again reinforces
the hypothesis that the tighter crosslinked gels limit deformation reducing the number of
cells lysed. Although the high variance in the data does not support a definitive conclusion,
this trend may extend to ultimate tensile strength (UTS) as well. The observed UTS’s for
the three polymers that showed significant protection (p <0.05) are not distinguishable
between one another, but all three are significantly higher than PEGDA 3400 and
gelMA/3400, which do not significantly protect from lysis. This again supports that the
mechanical properties of the gel greatly influence the protective potential.
During the simulated printing process cells experience rapid and high changes in
pressure (~16 bar in < 0.1 s). Drastic fluctuations in pressure could potentially change the
solubility limits of gases dissolved within the cell solution, as well as exert compressional
forces on cells which can affect the folding properties and stability of cellular proteins [153,
154] . Gases coming out of solution causing microbubbles have the ability to disrupt the
cell membrane or organelles within the cell hindering or eliminating cellular function
[155]. Changes in specific protein properties or the unfolding of proteins could reduce the
cell’s ability maintain normal functionality. In 3D extrusion printing, the pressure change
in the nozzle is coupled to the shear stress associated with fluid flow and cannot be
independently varied. To de-couple these parameters and look at the effect of pressure drop
in the absence of shear stresses, we used a pressure chamber to subject cells to the high

100
pressures experienced during extrusion without any fluid motion. The pressure chamber
was quickly opened using a ball valve for a sudden decrease back to atmospheric pressure.
This study revealed that pressure changes alone comparable to what cells experienced
during extrusion in our system do not affect cell viability. Figure 7.5 shows cell viability
for cells following high pressure conditions compared to untouched control cells.
Figure 7.5: Cell viability for each assay type following exposure to high pressures (~25
bar) and rapid decompression (< 0.1s) back to atmospheric conditions.
There were no statistical differences in viability for any of the pressures (8-25 bar) or time
lengths (2-10 min) studied. These pressures far exceed those reported in the literature [60,
62]. High viability across all pressures studied supports the hypothesis that cell damage in
extrusion printing is highly shear dependent. This study confirms that large pressure drops
over very short time scales have no effect on cell viability when at high pressure for ~10

101
mins. The notion of shear mediated cell damage is supported in literature for printing
applications [65, 150, 151], but had not been independently studied. Using A DHR-2
Viscometer (TA Instruments) cells were subject to shear forces associated with fluid
motion without pressure driven flow. Cells coated with PEGDA 1000 as well as uncoated
cells were exposed shear forces of ~110 Pa for 10 s, then analyzed in flow cytometry for
viability and scattering properties. Although 110 Pa is a lower shear stress than what is
observed through our extrusion system (~400 Pa), we are still able to induce cell lysis in
the control population. Figure 7.6 below shows the viability of cells after exposure to shear
forces for uncoated and PEGDA 1000 coated cells, and Table 7.3 gives p-values comparing
viability means.
Figure 7.6: Cell viability for each assay type following exposure to shear forces in the
absence of pressure changes. (* indicates statistically different means from the
corresponding uncoated group.)

102
Table 7.3: P-values for viability assays of coated cells compared to uncoated cells after
being exposed to shear forces only (Figure 7.6).
P-Values Polymer Type Scattering
Analysis EthD-1 MTT
PEGDA 1000 0.039 1.52 x 10⁻⁶ 1.46 x 10⁻⁴
With the shear only system, as with the extrusion system, we see the PEGDA 1000
hydrogel coating provides protection from lysis as analyzed by the scattering properties.
The absence of a pressure changes with this system suggest the mechanical properties of
the gel reinforce the cell membrane limiting deformation, as suggested with the extrusion
system. These data, along with the high cell viability of cells exposed to high pressures
further supports the notion of shear forces play the largest role in cell damage upon
extrusion.
The viability of all extruded cells is relatively low for what would be desired when
bioprinting. With the exception of PEGDA 700 which we know from previous studies is
toxic and permeabilizes cells, the viability of coated cells vs. uncoated cells in the extrusion
system (Figure 7.3) are not statistically significant (all p-values > 0.1, Table 7.3). Figure
7.7 shows the viability of all cells after hydrogel coating but before extrusion through the
capillary.

103
Figure 7.7: Viability assessed by EthD-1 and MTT assay following polymerization prior
to extrusion. (* denotes samples that showed a statistically significant drop (p <
0.05) in cell viability following extrusion.)
These coatings are preserving the size and shape of the cell as determined by light
scattering in flow cytometry, but the cells lack full functionality. This may be partially due
to monomer toxicity and may also be partially due to stressing of the cells beyond what is
ideal for functionality without complete lysis of the cell membrane. Of all polymers
assessed, PEGDA 2000 not only shows significant protection over uncoated cells in
scattering analyses, but there is also no significant difference in any of the viability assays
between before and after extrusion. P-values for Figure 7.7 are given in Table 7.4. All other
conditions show a significant change in viability (p < 0.05). PEGDA 2000 preserves the

104
viability of cells that remain living following polymerization when extruded at high shear
stress.
Table 7.4: P-values generated using Student’s t-test for viability before capillary
extrusion (Figure 7.7) to viability following extrusion of each polymer type
and uncoated cells.
P-Values Polymer Type EthD-1 MTT PEGDA 700 0.011 0.322 PEGDA 1000 3.0 x 10⁻⁶ 0.0297 PEGDA 2000 0.147 0.084 PEGDA 3400 0.071 0.007 GelMA/3400 0.020 0.009 Uncoated 3.4 x 10⁻⁵ 1.6 x 10⁻¹¹
This suggests that PEGDA 2000 may serve as the best pairing of mechanical properties of
polymers studied with minimal cytotoxicity. A contrast to the trend in protection potential
of each polymer is the toxicity of the chosen monomer. It is generally understood with
PEGDA monomers of smaller molecular weights have a higher cytotoxicity prior to
crosslinking and gelation, as observed with PEGDA 700 [131]. Although PEGDA 1000
shows significant protection as with PEGDA 700, the molecular weight is low enough to
cause cell damage during polymerization that, when paired with the stress of extrusion, is
counter-productive in preserving cellular function. The molecular weights larger than
PEGDA 2000 show an increase in viability of cells immediately following polymerization
compared to PEGDA 2000 but also show a significant decrease in viability following
extrusion when compared to themselves. Therefore, the production potential of the softer
gels falls short in comparison to the stiff more crosslinked networks.

105
7.3.3 Conclusion
In this study we assessed polymers containing a range of different properties on a
novel method of mechanical protection. Individually encapsulated cells were subject to
high shear forces associated with high throughput, high resolution bioprinting. From these
data we show that the mechanical properties of the different polymer films play a
significant role in the protection of the coated cell. The extremely soft formulation of
gelMA/3400 provided essentially no protection against lysis when compared to uncoated
cells. While the higher modulus gels provide significant protection as analyzed by
scattering analyses, they do not preserve high cell functionality. Protective cellular coatings
of similar mechanical properties to PEGDA 700, 1000 and 2000, with higher
cytocompatibility found in gelMA/3400 could provide mechanical protection that also
preserves the high cellular functionality desired for organ printing

106
CHAPTER 8. CONCLUSIONS AND FUTURE DIRECTIONS
Surface modification on living cells is an exciting field of study with a vast array
of applications. The potential clinical benefit in areas of drug delivery, immunoprotection
and immunocamouflage, to physical protection from chemical and mechanical insults
makes this an intensely studied field. Modifications are accomplished through numerous
pathways such as covalent engraftment, electrostatic interactions, hydrophobic
interactions, and antibody/antigen binding. Here, we explore the utility of a novel
modification strategy that utilizes specific antigen binding for immobilization of a
photoinitiator to subsequently encapsulate target cells in a thin hydrogel film. We explore
applications in rare cell detection/isolation for cancer screening by protection against
chemical lysis, as well as mechanical protection for tissue and organ printing through
membrane reinforcement.
First, in Chapter 4 we establish a metric for cancer associated surface markers for
potential targets in isolation. Isolation purity from a heterogeneous population using
surface markers is largely dependent on relative expression of target markers.
Quantification of antigen surface density relative to PBMCs gives us great insight into
potential new targets, as well as highlights the shortcomings of current isolation strategies.
Evaluation of the expression of commonly targeted markers on cancer cells relative to
PBMCs indicates a lack of distinction, especially in the highly invasive cells lines. This
indicates new and/or multiple markers will be necessary for the required selectivity of
conventional and emerging sorting techniques. This information will greatly help current
and future CTC isolation methods by revealing target markers that have the highest
specificity relative to PBMCs.

107
For the greatest utility in a clinical setting, highly standardized procedures are most
desired. Chapters 5 and 6 explore standardization of isolation through commercially
available reagents and procedural parameters for scaling to relevant batch sizes. Previously,
studies comparing xanthene photosensitizers have shown that eosin Y (EITC, in our study)
greatly out performs fluorescein (FITC, in our study) in radical generation and
polymerization ability. However, these studies were not done under the cytocompatible
conditions required for hydrogel encapsulation. We showed that even though FITC has a
greater spectral mismatch to our LED lamp than ETIC, significant film generation was
achieved on both micro array slides and living cell surfaces. These findings suggest the
plausible use of FITC which is a very common fluorophore and therefore, commercially
sold conjugated to a range of biorecognition molecules. Commercial availability eliminates
the need for a custom SA-EITC conjugate further standardizing our isolation system. We
next sought to determine the key parameters associated with scaling the system to relevant
batch sizes. Optical studies were performed on micro array slides for highly controlled
experiments with quantitative information on film generation. Profilometry data of
polymerizations using various conditions reveal that monomer fluid depth and incidence
angle of radiation have large effects on film generation. This suggests that scaling
processed volume through increased surface area and choosing a solution chamber that
ensures minimizes presence of a meniscus is important in moving forward.
Finally, we look to the application of physical protection from mechanical stimuli
of our protective hydrogel. Organ printing has potential to save thousands of lives every
year by increasing the supply of viable organs for transplant. 3D bioprinting has already
been used to print cells and tissues for in vivo use and is rapidly approaching organ printing.

108
High shear stress accompanies commercial extrusion printers which try to attain both the
required resolution and throughput. Here, we demonstrated that encapsulation in thin
hydrogel coatings has the ability to reinforce the cellular membrane preventing lysis in
high shear fluid flow. Polymers possessing a modulus similar to that of PEGDA 700, 1000,
and 2000, while possessing the same cytocompatibility of gelMA/3400 may possess the
ability to protect cells form lysis while preserving high functionality. Further, we
decoupled the parameters of rapid pressure drop and high shear forces associated with flow
and determined that shear forces of flow are primarily responsible for the hindering of
printed cell viability.
These studies along with previously published works in our lab demonstrate the
versatility, feasibility, and high clinical impact that this technology possess in the field of
cellular surface modifications for isolation, immunoprotection, and mechanical
reinforcement. A future direction of this technology is in the degradation of the polymer
coating. While the gelMA/3400 coating is biodegradable, efforts in a controlled
degradation could have a high impact on clinical translation. Through the incorporation of
photocleavable moieties, or enzymatically cleavable peptide sequences, coating removal
could either be done so on-demand, or tune for give time scales or surrounding
environments. As research has been done in photocleavable and enzymatically cleavable
hydrogels, the unique polymerization process for our technology would allow for
incorporation of such abilities with minimal change in the current system. ASL technology
presents an exciting future with robust yet versatile applications.
Future directions within the application of mechanical protection include the
incorporation of branched polymer systems. As it is known that the shorter PEG chains

109
have higher cytotoxicity and we have shown that polymer modulus plays a key role in
protection from shear forces, incorporation of branched PEG acrylates is a potential
solution. Larger molecular weight branched PEG molecules possess similar bioinert
properties to that of linear PEG, but with a higher functionality for polymerization. Higher
functionality will decrease the molecular weight between crosslinks increasing the
modulus while limiting cytotoxicity associated with low molecular weights. Incorporation
of these branched polymers could be the key to protection from shear lysis while
maintaining high cell functionality.

110
REFERENCES
1. Goosen, M.F., et al., Optimization of microencapsulation parameters: semipermeable microcapsules as a bioartificial pancreas. Biotechnology and bioengineering, 1985. 27(2): p. 146-150.
2. Chick, W.L., A.A. Like, and V. Lauris, Beta cell culture on synthetic capillaries: an artificial endocrine pancreas. Science, 1975. 187(4179): p. 847-849.
3. Lim, F. and A.M. Sun, Microencapsulated islets as bioartificial endocrine pancreas. Science, 1980. 210(4472): p. 908-910.
4. Wang, D., W.M. Toyofuku, and M.D. Scott, The potential utility of methoxypoly (ethylene glycol)-mediated prevention of rhesus blood group antigen RhD recognition in transfusion medicine. Biomaterials, 2012. 33(10): p. 3002-3012.
5. Wang, D., et al., Induction of immunotolerance via mPEG grafting to allogeneic leukocytes. Biomaterials, 2011. 32(35): p. 9494-9503.
6. Lim, F. and R.D. Moss, Microencapsulation of living cells and tissues. Journal of pharmaceutical sciences, 1981. 70(4): p. 351-354.
7. Abbina, S., et al., Surface Engineering for Cell-Based Therapies: Techniques for Manipulating Mammalian Cell Surfaces. ACS Biomaterials Science & Engineering, 2017.
8. Chapanian, R., et al., Therapeutic cells via functional modification: influence of molecular properties of polymer grafts on in vivo circulation, clearance, immunogenicity, and antigen protection. Biomacromolecules, 2013. 14(6): p. 2052-2062.
9. Lee, J., et al., Cytoprotective silica coating of individual mammalian cells through bioinspired silicification. Angewandte Chemie International Edition, 2014. 53(31): p. 8056-8059.
10. Lee, J., et al., Chemical sporulation and germination: cytoprotective nanocoating of individual mammalian cells with a degradable tannic acid–Fe III complex. Nanoscale, 2015. 7(45): p. 18918-18922.
11. Clafshenkel, W.P., et al., The effect of covalently-attached ATRP-synthesized polymers on membrane stability and cytoprotection in human erythrocytes. PloS one, 2016. 11(6): p. e0157641.
12. Fliervoet, L.A. and E. Mastrobattista, Drug delivery with living cells. Advanced drug delivery reviews, 2016. 106: p. 63-72.
13. Anselmo, A.C. and S. Mitragotri, Cell-mediated delivery of nanoparticles: taking advantage of circulatory cells to target nanoparticles. Journal of Controlled Release, 2014. 190: p. 531-541.
14. Chambers, E. and S. Mitragotri, Long circulating nanoparticles via adhesion on red blood cells: mechanism and extended circulation. Experimental biology and medicine, 2007. 232(7): p. 958-966.
15. Anselmo, A.C., et al., Delivering nanoparticles to lungs while avoiding liver and spleen through adsorption on red blood cells. ACS nano, 2013. 7(12): p. 11129-11137.
16. Gribova, V., R. Auzely-Velty, and C. Picart, Polyelectrolyte multilayer assemblies on materials surfaces: from cell adhesion to tissue engineering. Chemistry of Materials, 2011. 24(5): p. 854-869.

111
17. Myler, H., et al., Anti-PEG antibody bioanalysis: a clinical case study with PEG-IFN-λ-1a and PEG-IFN-α2a in naive patients. Bioanalysis, 2015. 7(9): p. 1093-1106.
18. Batrakova, E.V., H.E. Gendelman, and A.V. Kabanov, Cell-mediated drug delivery. Expert opinion on drug delivery, 2011. 8(4): p. 415-433.
19. Wu, P.-J., et al., Hydrogel Patches on Live Cells through Surface-Mediated Polymerization. Langmuir, 2017. 33(27): p. 6778-6784.
20. Restifo, N.P., M.E. Dudley, and S.A. Rosenberg, Adoptive immunotherapy for cancer: harnessing the T cell response. Nature Reviews Immunology, 2012. 12(4): p. 269.
21. Cahall, C.F., et al., A Quantitative Perspective on Surface Marker Selection for the Isolation of Functional Tumor Cells. Breast Cancer: Basic and Clinical Research, 2015. 9(Suppl 1): p. 1.
22. Stevens, M.M. and J.H. George, Exploring and engineering the cell surface interface. Science, 2005. 310(5751): p. 1135-1138.
23. Kalluri, R. and R.A. Weinberg, The basics of epithelial-mesenchymal transition. The Journal of clinical investigation, 2009. 119(6): p. 1420-1428.
24. Hanahan, D. and R.A. Weinberg, Hallmarks of cancer: the next generation. Cell, 2011. 144(5): p. 646-74.
25. Hayes, D.F. and J.B. Smerage, Circulating tumor cells. Progress in molecular biology and translational science, 2009. 95: p. 95-112.
26. Wicha, M.S. and D.F. Hayes, Circulating tumor cells: not all detected cells are bad and not all bad cells are detected. Journal of Clinical Oncology, 2011. 29(12): p. 1508-1511.
27. Gorges, T.M., et al., Circulating tumour cells escape from EpCAM-based detection due to epithelial-to-mesenchymal transition. BMC cancer, 2012. 12(1): p. 178.
28. Bonnomet, A., et al., A dynamic in vivo model of epithelial-to-mesenchymal transitions in circulating tumor cells and metastases of breast cancer. Oncogene, 2012. 31(33): p. 3741.
29. Cristofanilli, M., et al., Circulating tumor cells: a novel prognostic factor for newly diagnosed metastatic breast cancer. Journal of Clinical Oncology, 2005. 23(7): p. 1420-1430.
30. de Bono, J.S., et al., Circulating tumor cells predict survival benefit from treatment in metastatic castration-resistant prostate cancer. Clinical Cancer Research, 2008. 14(19): p. 6302-6309.
31. Cohen, S.J., et al., Relationship of circulating tumor cells to tumor response, progression-free survival, and overall survival in patients with metastatic colorectal cancer. Journal of clinical oncology, 2008. 26(19): p. 3213-3221.
32. Allard, W.J., et al., Tumor cells circulate in the peripheral blood of all major carcinomas but not in healthy subjects or patients with nonmalignant diseases. Clinical Cancer Research, 2004. 10(20): p. 6897-6904.
33. Romero, G., et al., Protective Polymer Coatings for High-Throughput, High-Purity Cellular Isolation. ACS Applied Materials & Interfaces, 2015. 7(32): p. 17598-17602.

112
34. Anderson, S.B., et al., The performance of human mesenchymal stem cellsencapsulated in cell-degradable polymer-peptide hydrogels. Biomaterials, 2011.32(14): p. 3564-3574.
35. Nicodemus, G.D. and S.J. Bryant, Cell encapsulation in biodegradable hydrogelsfor tissue engineering applications. Tissue Engineering Part B: Reviews, 2008.14(2): p. 149-165.
36. Drury, J.L. and D.J. Mooney, Hydrogels for tissue engineering: scaffold designvariables and applications. Biomaterials, 2003. 24(24): p. 4337-4351.
37. Cadet, J., E. Sage, and T. Douki, Ultraviolet radiation-mediated damage tocellular DNA. Mutation Research/Fundamental and Molecular Mechanisms ofMutagenesis, 2005. 571(1): p. 3-17.
38. Encinas, M., et al., Xanthene dyes/amine as photoinitiators of radicalpolymerization: a comparative and photochemical study in aqueous medium.Polymer, 2009. 50(13): p. 2762-2767.
39. Avens, H.J. and C.N. Bowman, Mechanism of cyclic dye regeneration duringeosin-sensitized photoinitiation in the presence of polymerization inhibitors.Journal of Polymer Science Part A: Polymer Chemistry, 2009. 47(22): p. 6083-6094.
40. Kızılel, S., V.H. Pérez-Luna, and F. Teymour, Mathematical model for Surface-Initiated photopolymerization of poly (ethylene glycol) diacrylate.Macromolecular theory and simulations, 2006. 15(9): p. 686-700.
41. Wong, J., et al., A quantitative analysis of peroxy-mediated cyclic regeneration ofeosin under oxygen-rich photopolymerization conditions. Polymer, 2015. 69: p.169-177.
42. Yagci, Y., S. Jockusch, and N.J. Turro, Photoinitiated polymerization: advances,challenges, and opportunities. Macromolecules, 2010. 43(15): p. 6245-6260.
43. Avens, H.J. and C.N. Bowman, Development of fluorescent polymerization-basedsignal amplification for sensitive and non-enzymatic biodetection in antibodymicroarrays. Acta biomaterialia, 2010. 6(1): p. 83-89.
44. Avens, H.J., et al., Sensitive Immunofluorescent Staining of Cells via Generationof Fluorescent Nanoscale Polymer Films in Response to Biorecognition. Journalof Histochemistry & Cytochemistry, 2011. 59(1): p. 76-87.
45. Avens, H.J., T.J. Randle, and C.N. Bowman, Polymerization behavior andpolymer properties of eosin-mediated surface modification reactions. Polymer,2008. 49(22): p. 4762-4768.
46. Mavili, M.E., et al., Use of three-dimensional medical modeling methods forprecise planning of orthognathic surgery. Journal of Craniofacial Surgery, 2007.18(4): p. 740-747.
47. Knox, K., et al., Rapid prototyping to create vascular replicas from CT scan data:making tools to teach, rehearse, and choose treatment strategies. Catheterizationand cardiovascular interventions, 2005. 65(1): p. 47-53.
48. Murphy, S.V. and A. Atala, 3D bioprinting of tissues and organs. Naturebiotechnology, 2014. 32(8): p. 773.
49. Bajaj, P., et al., 3D biofabrication strategies for tissue engineering andregenerative medicine. Annual review of biomedical engineering, 2014. 16: p.247-276.

113
50. Zorlutuna, P., et al., Microfabricated biomaterials for engineering 3D tissues. Advanced materials, 2012. 24(14): p. 1782-1804.
51. Hockaday, L., et al., Rapid 3D printing of anatomically accurate and mechanically heterogeneous aortic valve hydrogel scaffolds. Biofabrication, 2012. 4(3): p. 035005.
52. Mannoor, M.S., et al., 3D printed bionic ears. Nano letters, 2013. 13(6): p. 2634-2639.
53. Park, J.Y., et al., Development of a 3D cell printed structure as an alternative to autologs cartilage for auricular reconstruction. Journal of Biomedical Materials Research Part B: Applied Biomaterials, 2017. 105(5): p. 1016-1028.
54. Gaetani, R., et al., Cardiac tissue engineering using tissue printing technology and human cardiac progenitor cells. Biomaterials, 2012. 33(6): p. 1782-1790.
55. Bhise, N.S., et al., Organ-on-a-chip platforms for studying drug delivery systems. Journal of Controlled Release, 2014. 190: p. 82-93.
56. Wagner, I., et al., A dynamic multi-organ-chip for long-term cultivation and substance testing proven by 3D human liver and skin tissue co-culture. Lab on a Chip, 2013. 13(18): p. 3538-3547.
57. D'Urso, P.S., et al., Custom cranioplasty using stereolithography and acrylic. British Journal of Plastic Surgery, 2000. 53(3): p. 200-204.
58. Singare, S., et al., Individually prefabricated prosthesis for maxilla reconstruction. Journal of Prosthodontics, 2008. 17(2): p. 135-140.
59. Mandrycky, C., et al., 3D bioprinting for engineering complex tissues. Biotechnology advances, 2016. 34(4): p. 422-434.
60. Billiet, T., et al., The 3D printing of gelatin methacrylamide cell-laden tissue-engineered constructs with high cell viability. Biomaterials, 2014. 35(1): p. 49-62.
61. Zhao, Y., et al., Three-dimensional printing of Hela cells for cervical tumor model in vitro. Biofabrication, 2014. 6(3): p. 035001.
62. Chung, J.H., et al., Bio-ink properties and printability for extrusion printing living cells. Biomaterials Science, 2013. 1(7): p. 763-773.
63. Zhu, K., et al., Gold nanocomposite bioink for printing 3D cardiac constructs. Advanced functional materials, 2017. 27(12): p. 1605352.
64. Blaeser, A., et al., Controlling shear stress in 3D bioprinting is a key factor to balance printing resolution and stem cell integrity. Advanced healthcare materials, 2016. 5(3): p. 326-333.
65. Colosi, C., et al., Microfluidic bioprinting of heterogeneous 3D tissue constructs using low-viscosity bioink. Advanced Materials, 2016. 28(4): p. 677-684.
66. Hansen, R.R., H.D. Sikes, and C.N. Bowman, Visual detection of labeled oligonucleotides using visible-light-polymerization-based amplification. Biomacromolecules, 2007. 9(1): p. 355-362.
67. Massagué, J. and A.C. Obenauf, Metastatic colonization by circulating tumour cells. Nature, 2016. 529(7586): p. 298.
68. Ashworth, T., A case of cancer in which cells similar to those in the tumours were seen in the blood after death. Aust Med J, 1869. 14(3): p. 146-149.
69. Smith, R.A., et al., Cancer screening in the United States, 2017: a review of current American Cancer Society guidelines and current issues in cancer screening. CA: a cancer journal for clinicians, 2017. 67(2): p. 100-121.
114
70. Siegel, R., C. DeSantis, and A. Jemal, Colorectal cancer statistics, 2014. CA: a cancer journal for clinicians, 2014. 64(2): p. 104-117.
71. Jones, S., et al., Comparative lesion sequencing provides insights into tumor evolution. Proceedings of the National Academy of Sciences, 2008. 105(11): p. 4283-4288.
72. Kalluri, R. and R.A. Weinberg, The basics of epithelial-mesenchytnal transition (vol 119, pg 1420, 2009). Journal of Clinical Investigation, 2010. 120(5): p. 1786-1786.
73. Aktas, B., et al., Stem cell and epithelial-mesenchymal transition markers are frequently overexpressed in circulating tumor cells of metastatic breast cancer patients. Breast cancer res, 2009. 11(4): p. R46.
74. Bonnomet, A., et al., Epithelial-to-mesenchymal transitions and circulating tumor cells. Journal of mammary gland biology and neoplasia, 2010. 15(2): p. 261-273.
75. Bhagat, A.A.S., et al., Microfluidics for cell separation. Medical & biological engineering & computing, 2010. 48(10): p. 999-1014.
76. Nagrath, S., et al., Isolation of rare circulating tumour cells in cancer patients by microchip technology. Nature, 2007. 450(7173): p. 1235-1239.
77. Choi, S., J.M. Karp, and R. Karnik, Cell sorting by deterministic cell rolling. Lab on a Chip, 2012. 12(8): p. 1427-1430.
78. Miltenyi, S., et al., High gradient magnetic cell separation with MACS. Cytometry: The Journal of the International Society for Analytical Cytology, 1990. 11(2): p. 231-238.
79. Owen, C.S. and N.L. Sykes, Magnetic labeling and cell sorting. Journal of immunological methods, 1984. 73(1): p. 41-48.
80. Königsberg, R., et al., Detection of EpCAM positive and negative circulating tumor cells in metastatic breast cancer patients. Acta oncologica, 2011. 50(5): p. 700-710.
81. Osta, W.A., et al., EpCAM is overexpressed in breast cancer and is a potential target for breast cancer gene therapy. Cancer research, 2004. 64(16): p. 5818-5824.
82. Jain, J., G. Veggiani, and M. Howarth, Cholesterol loading and ultrastable protein interactions determine the level of tumor marker required for optimal isolation of cancer cells. Cancer research, 2013. 73(7): p. 2310-2321.
83. Eccles, S.A., The role of c-erbB-2/HER2/neu in breast cancer progression and metastasis. Journal of mammary gland biology and neoplasia, 2001. 6(4): p. 393-406.
84. Deroo, B.J. and K.S. Korach, Estrogen receptors and human disease. The Journal of clinical investigation, 2006. 116(3): p. 561.
85. Perl, A.-K., et al., A causal role for E-cadherin in the transition from adenoma to carcinoma. Nature, 1998. 392(6672): p. 190-193.
86. Hajra, K.M., X. Ji, and E.R. Fearon, Extinction of E-cadherin expression in breast cancer via a dominant repression pathway acting on proximal promoter elements. Oncogene, 1999. 18(51): p. 7274-7279.
87. Hazan, R.B., et al., Exogenous expression of N-cadherin in breast cancer cells induces cell migration, invasion, and metastasis. The Journal of cell biology, 2000. 148(4): p. 779-790.

115
88. Yilmaz, M. and G. Christofori, EMT, the cytoskeleton, and cancer cell invasion. Cancer and Metastasis Reviews, 2009. 28(1-2): p. 15-33.
89. Afify, A., P. Purnell, and L. Nguyen, Role of CD44s and CD44v6 on human breast cancer cell adhesion, migration, and invasion. Experimental and molecular pathology, 2009. 86(2): p. 95-100.
90. Toole, B.P., Hyaluronan promotes the malignant phenotype. Glycobiology, 2002. 12(3): p. 37R-42R.
91. Jin, H. and J. Varner, Integrins: roles in cancer development and as treatment targets. British Journal of Cancer, 2004. 90(3): p. 561-565.
92. Hood, J.D. and D.A. Cheresh, Role of integrins in cell invasion and migration. Nature Reviews Cancer, 2002. 2(2): p. 91.
93. Beer, A.J., et al., Patterns of {alpha} v {beta} 3 expression in primary and metastatic human breast cancer as shown by 18F-galacto-RGD PET. Journal of Nuclear Medicine, 2008. 49(2): p. 255.
94. O'hanlon, D., et al., Soluble adhesion molecules (E-selectin, ICAM-1 and VCAM-1) in breast carcinoma. European Journal of Cancer, 2002. 38(17): p. 2252-2257.
95. Budinsky, A.C., et al., Decreased expression of ICAM-1 and its induction by tumor necrosis factor on breast-cancer cells in vitro. International journal of cancer, 1997. 71(6): p. 1086-1090.
96. Liu, S., et al., Expression of intercellular adhesion molecule 1 by hepatocellular carcinoma stem cells and circulating tumor cells. Gastroenterology, 2013. 144(5): p. 1031-1041. e10.
97. Bhargava, R., et al., EGFR gene amplification in breast cancer: correlation with epidermal growth factor receptor mRNA and protein expression and HER-2 status and absence of EGFR-activating mutations. Modern pathology, 2005. 18(8): p. 1027-1033.
98. Harris, A.L., et al., Epidermal growth factor receptors in breast cancer: association with early relapse and death, poor response to hormones and interactions with neu. Journal of steroid biochemistry, 1989. 34(1): p. 123-131.
99. Chavez, K.J., S.V. Garimella, and S. Lipkowitz, Triple negative breast cancer cell lines: one tool in the search for better treatment of triple negative breast cancer. Breast disease, 2010. 32(1): p. 35-48.
100. Holliday, D.L. and V. Speirs, Choosing the right cell line for breast cancer research.
101. Maheswaran, S., et al., Detection of mutations in EGFR in circulating lung-cancer cells. New England Journal of Medicine, 2008. 359(4): p. 366-377.
102. Yang, J., et al., Dielectric properties of human leukocyte subpopulations determined by electrorotation as a cell separation criterion. Biophysical journal, 1999. 76(6): p. 3307-3314.
103. Evans, E. and A. Yeung, Apparent viscosity and cortical tension of blood granulocytes determined by micropipet aspiration. Biophysical journal, 1989. 56(1): p. 151.
104. Yu, M., et al., Circulating breast tumor cells exhibit dynamic changes in epithelial and mesenchymal composition. Science, 2013. 339(6119): p. 580-584.

116
105. Lecharpentier, A., et al., Detection of circulating tumour cells with a hybrid (epithelial/mesenchymal) phenotype in patients with metastatic non-small cell lung cancer. British Journal of Cancer, 2011. 105(9): p. 1338-1341.
106. McCabe, A., et al., Automated quantitative analysis (AQUA) of in situ protein expression, antibody concentration, and prognosis. Journal of the National Cancer Institute, 2005. 97(24): p. 1808-1815.
107. Livasy, C.A., et al., Phenotypic evaluation of the basal-like subtype of invasive breast carcinoma. Modern Pathology, 2006. 19(2): p. 264-271.
108. Yang, J. and R.A. Weinberg, Epithelial-mesenchymal transition: at the crossroads of development and tumor metastasis. Developmental cell, 2008. 14(6): p. 818-829.
109. Ali, S. and R.C. Coombes, Estrogen receptor alpha in human breast cancer: occurrence and significance. Journal of mammary gland biology and neoplasia, 2000. 5(3): p. 271-281.
110. Thiery, J.P. and C.T. Lim, Tumor dissemination: an EMT affair. Cancer cell, 2013. 23(3): p. 272-273.
111. Kawata, M., et al., TGF-β-induced epithelial-mesenchymal transition of A549 lung adenocarcinoma cells is enhanced by pro-inflammatory cytokines derived from RAW 264.7 macrophage cells. Journal of biochemistry, 2012. 151(2): p. 205-216.
112. Liu, X., Inflammatory cytokines augments TGF-β1-induced epithelial-mesenchymal transition in A549 cells by up-regulating TβR-I. Cell motility and the cytoskeleton, 2008. 65(12): p. 935-944.
113. Sun, J.-J., et al., Invasion and metastasis of liver cancer: expression of intercellular adhesion molecule 1. Journal of cancer research and clinical oncology, 1999. 125(1): p. 28-34.
114. Sununliganon, L. and W. Singhatanadgit, Highly osteogenic PDL stem cell clones specifically express elevated levels of ICAM1, ITGB1 and TERT. Cytotechnology, 2012. 64(1): p. 53-63.
115. Strakova, Z., et al., Multipotent properties of myofibroblast cells derived from human placenta. Cell and tissue research, 2008. 332(3): p. 479-488.
116. Cruise, G.M., et al., A sensitivity study of the key parameters in the interfacial photopolymerization of poly(ethylene glycol) diacrylate upon porcine islets. Biotechnology and Bioengineering, 1998. 57(6): p. 655-665.
117. Kaastrup, K. and H. Sikes, Investigation of dendrimers functionalized with eosin as macrophotoinitiators for polymerization-based signal amplification reactions. RSC Advances, 2015. 5(20): p. 15652-15659.
118. Bahney, C., et al., Visible light photoinitiation of mesenchymal stem cell-laden bioresponsive hydrogels. Eur Cell Mater, 2011. 22: p. 43-55.
119. Avens, H.J. and C.N. Bowman, Mechanism of Cyclic Dye Regeneration During Eosin-Sensitized Photoinitiation in the Presence of Polymerization Inhibitors. Journal of Polymer Science Part a-Polymer Chemistry, 2009. 47(22): p. 6083-6094.
120. Sikes, H.D., et al., Using polymeric materials to generate an amplified response to molecular recognition events. Nature Materials, 2008. 7(1): p. 52-56.

117
121. Hansen, R.R., et al., Quantitative evaluation of oligonucleotide surface concentrations using polymerization-based amplification. Analytical and Bioanalytical Chemistry, 2008. 392(1-2): p. 167-175.
122. Hansen, R.R., L.M. Johnson, and C.N. Bowman, Visual, base-specific detection of nucleic acid hybridization using polymerization-based amplification. Analytical Biochemistry, 2009. 386(2): p. 285-287.
123. Johnson, L.M., et al., Characterization of the Assaying Methods in Polymerization-Based Amplification of Surface Biomarkers. Australian Journal of Chemistry, 2009. 62(8): p. 877-884.
124. Lilly, J.L., et al., Characterization of molecular transport in ultrathin hydrogel coatings for cellular immunoprotection. Biomacromolecules, 2015. 16(2): p. 541-549.
125. Cruise, G.M., et al., Poly(ethylene glycol) based encapsulation of islets of Langerhans. Cell Transplantation, 1996. 5(5 SUPPL. 2): p. 52-52.
126. Heather J. Avens, T.J.R., Christopher N. Bowman, Polymerization behavior and polymer properties of eosin-mediated surface modification reactions. Polymer, 2008. 49: p. 4762-4768.
127. Kizilel, S., V.H. Perez-Luna, and F. Teymour, Photopolymerization of poly(ethylene glycol) diacrylate on eosin-functionalized surfaces. Langmuir, 2004. 20(20): p. 8652-8658.
128. Sawhney, A.S., C.P. Pathak, and J.A. Hubbell, Interfacial Photopolymerization of Poly(ethylene glycol)-Based Hydrogels Upon Alginate Poly(L-Lysine) Microcapsules for Enhanced Biocompatibility. Biomaterials, 1993. 14(13): p. 1008-1016.
129. Cruise, G.M., D.S. Scharp, and J.A. Hubbell, Characterization of permeability and network structure of interfacially photopolymerized poly(ethylene glycol) diacrylate hydrogels. Biomaterials, 1998. 19(14): p. 1287-1294.
130. Lee, J.K., B.W. Heimer, and H.D. Sikes, Systematic study of fluorescein-functionalized macrophotoinitiators for colorimetric bioassays. Biomacromolecules, 2012. 13(4): p. 1136-1143.
131. Liu, G., et al., Cytotoxicity study of polyethylene glycol derivatives. RSC Advances, 2017. 7(30): p. 18252-18259.
132. Lilly, J.L. and B.J. Berron, The Role of Surface Receptor Density in Surface-Initiated Polymerizations for Cancer Cell Isolation. Langmuir, 2016. 32(22): p. 5681-5689.
133. Piran, U. and W.J. Riordan, Dissociation rate constant of the biotin-streptavidin complex. Journal of immunological methods, 1990. 133(1): p. 141-143.
134. Lilly, J.L. and B.J. Berron, The Role of Surface Receptor Density in Surface-Initiated Polymerizations for Cancer Cell Isolation. Langmuir, 2016. 32(22): p. 5681-9.
135. Lilly, J.L., et al., Characterization of Molecular Transport in Ultrathin Hydrogel Coatings for Cellular Immunoprotection. Biomacromolecules, 2015.
136. Shih, H. and C.-C. Lin, Visible-Light-Mediated Thiol-Ene Hydrogelation Using Eosin-Y as the Only Photoinitiator. Macromolecular Rapid Communications, 2013. 34(3): p. 269-273.

118
137. Siegel, R.L., K.D. Miller, and A. Jemal, Cancer statistics, 2017. CA: a cancer journal for clinicians, 2017. 67(1): p. 7-30.
138. Myers, E.R., et al., Benefits and harms of breast cancer screening: a systematic review. Jama, 2015. 314(15): p. 1615-1634.
139. Singh, A. and J. Settleman, EMT, cancer stem cells and drug resistance: an emerging axis of evil in the war on cancer. Oncogene, 2010. 29(34): p. 4741.
140. Miller, M.C., G.V. Doyle, and L.W. Terstappen, Significance of circulating tumor cells detected by the CellSearch system in patients with metastatic breast colorectal and prostate cancer. Journal of oncology, 2010. 2010.
141. W. R. Kim, J.R.L., J. M. Smith, D. P. Schladt, M. A. Skeans, A. M. Harper, J. L. Wainright, J. J. Snyder, A. K. Israni, B. L. Kasiske., OPTN/SRTR Annual Data Report 2016. American Journal of Transplantation, 2018. 18(S1): p. 1-503.
142. Abouna, G.M. Organ shortage crisis: problems and possible solutions. in Transplantation proceedings. 2008. Elsevier.
143. Rengier, F., et al., 3D printing based on imaging data: review of medical applications. International journal of computer assisted radiology and surgery, 2010. 5(4): p. 335-341.
144. Ozbolat, I.T. and Y. Yu, Bioprinting toward organ fabrication: challenges and future trends. IEEE Transactions on Biomedical Engineering, 2013. 60(3): p. 691-699.
145. KHATIWALA, C., et al., 3D cell bioprinting for regenerative medicine research and therapies. Gene Therapy and Regulation, 2012. 7(01): p. 1230004.
146. Shim, J.-H., et al., Bioprinting of a mechanically enhanced three-dimensional dual cell-laden construct for osteochondral tissue engineering using a multi-head tissue/organ building system. Journal of Micromechanics and Microengineering, 2012. 22(8): p. 085014.
147. Lee, J.-S., et al., 3D printing of composite tissue with complex shape applied to ear regeneration. Biofabrication, 2014. 6(2): p. 024103.
148. Chang, R., J. Nam, and W. Sun, Direct cell writing of 3D microorgan for in vitro pharmacokinetic model. Tissue Engineering Part C: Methods, 2008. 14(2): p. 157-166.
149. Nair, K., et al., Characterization of cell viability during bioprinting processes. Biotechnology Journal: Healthcare Nutrition Technology, 2009. 4(8): p. 1168-1177.
150. Augenstein, D., A. Sinskey, and D. Wang, Effect of shear on the death of two strains of mammalian tissue cells. Biotechnology and bioengineering, 1971. 13(3): p. 409-418.
151. Kong, H.J., M.K. Smith, and D.J. Mooney, Designing alginate hydrogels to maintain viability of immobilized cells. Biomaterials, 2003. 24(22): p. 4023-4029.
152. Welty, J.R., et al., Fundamentals of momentum, heat, and mass transfer. 2009: John Wiley & Sons.
153. Chen, C.R. and G.I. Makhatadze, Molecular determinant of the effects of hydrostatic pressure on protein folding stability. Nature communications, 2017. 8: p. 14561.

119
154. Hillson, N., J.N. Onuchic, and A.E. García, Pressure-induced protein-folding/unfolding kinetics. Proceedings of the National Academy of Sciences, 1999. 96(26): p. 14848-14853.
155. Moonschi, F.H., et al., Mammalian Cell-derived Vesicles for the Isolation of Organelle Specific Transmembrane Proteins to Conduct Single Molecule Studies. The Journal of Biological Chemistry, 2017.

120
CALVIN FRANK CAHALL VITA
EDUCATION
B. S. Chemistry, and Chemical Physics, Centre College Danville, KY 2009-2013
Minor: Physics
EXPERIENCE
University of Kentucky, Lexington, KY Graduate Research Assistant, Aug 2014 – Dec 2018.
Patheon Pharmaceuticals Inc., Cincinnati, OH. Associate Analytical Chemist, Dec 2013 - Mar 2014.
HONORS
Halcomb Fellowship in Engineering and Medecine, University of Kentucky 2016-2017, 2017-2018
Gill Engineering Excellence Fellowship, University of Kentucky 2015-2016.
Graduate Student Academic Year Fellowship, University of Kentucky 2014-2015.
Founders Scholarship, Centre College 2009-2013.
PUBLICATIONS
Cahall, C.F., et al., A Quantitative Perspective on Surface Marker Selection for the Isolation of Functional Tumor Cells. Breast Cancer: Basic and Clinical Research, 2015. 9(Suppl 1): p. 1 Lilly, J.L., Anuhya Gottipati, Calvin F. Cahall, Mohamed Agoub, Brad J. Berron Comparison of eosin and fluorescein conjugates for the photoinitiation of cell-compatible polymer coatings. PloS one, 2018. 13(1): p. e0190880.


