
8/6/2019 SWIFS Controlled Substances Resources Documents v2.1 (02.2009) 76 pages.pdf
http://slidepdf.com/reader/full/swifs-controlled-substances-resources-documents-v21-022009-76-pagespdf 1/76
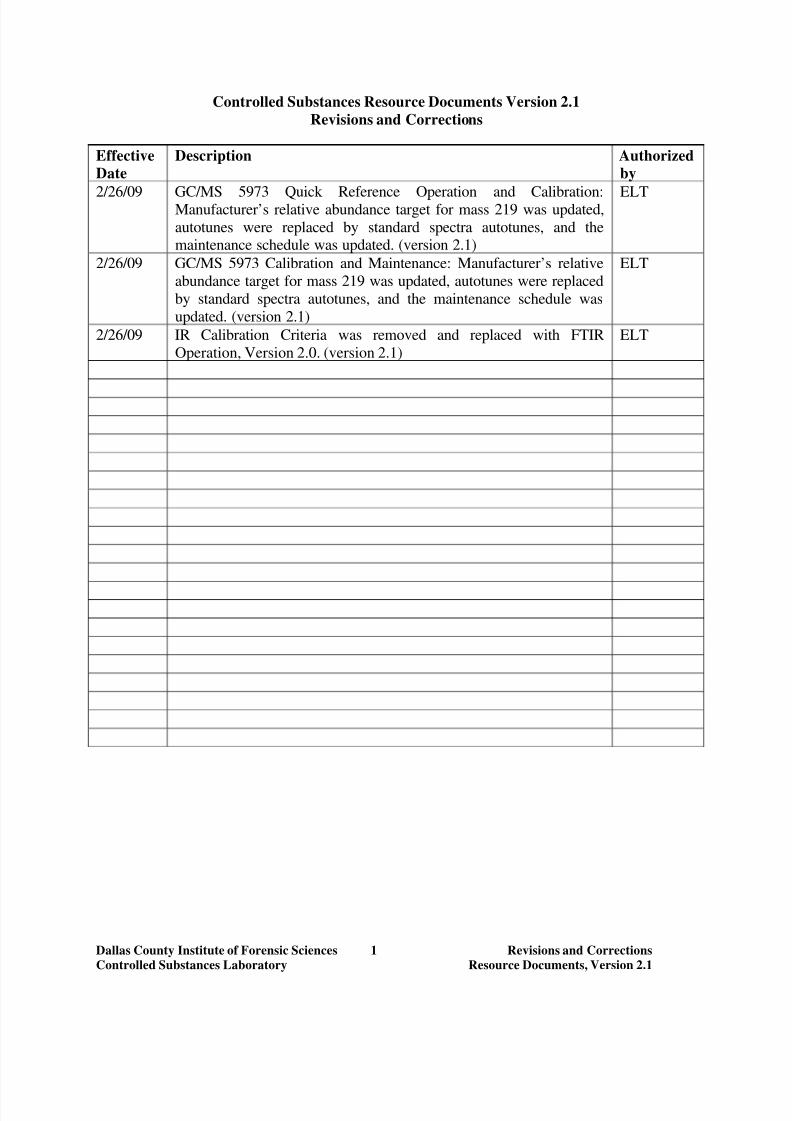
Controlled Substances Resource Documents
Version 2.1
8/6/2019 SWIFS Controlled Substances Resources Documents v2.1 (02.2009) 76 pages.pdf
http://slidepdf.com/reader/full/swifs-controlled-substances-resources-documents-v21-022009-76-pagespdf 2/76

8/6/2019 SWIFS Controlled Substances Resources Documents v2.1 (02.2009) 76 pages.pdf
http://slidepdf.com/reader/full/swifs-controlled-substances-resources-documents-v21-022009-76-pagespdf 3/76
Under development

8/6/2019 SWIFS Controlled Substances Resources Documents v2.1 (02.2009) 76 pages.pdf
http://slidepdf.com/reader/full/swifs-controlled-substances-resources-documents-v21-022009-76-pagespdf 4/76
Texas Controlled Substances and Related Statutes
Click the following link and refer to Sections:
481 Texas Controlled Substances Act482 Simulated Controlled Substances
483 Dangerous Drugs485 Abusable Volatile Chemicals
http://tlo2.tlc.state.tx.us/statutes/hs.toc.htm

8/6/2019 SWIFS Controlled Substances Resources Documents v2.1 (02.2009) 76 pages.pdf
http://slidepdf.com/reader/full/swifs-controlled-substances-resources-documents-v21-022009-76-pagespdf 5/76
GAS CHROMATOGRAPHY AND
GAS CHROMATOGRAPHY/MASS SPECTROMETRY
Gas Chromatography (GC)
Chromatography is a physical method of separation that involves the differential distribution of a
substance between two phases: one phase is a stationary bed of large surface area and the other
phase is a mobile phase, which percolates through the stationary bed. In GC, the mobile phase is
a gas, and in order for a substance to be amenable to GC analysis, it must be capable of being
volatilized in the GC inlet.
The chromatographic separation process occurs as a result of repeated sorption-desorption of a
substance between the stationary and mobile phase as the substance travels along the stationary
bed. Separation of two or more substances occurs when the distribution coefficients between the
mobile and stationary phases are different for the substances. As a substance elutes from the end
of a GC column, it is detected by a flame ionization detector, mass spectrometer, or otheranalytical detector.
In a flame ionization detector, the gas exiting the column is mixed with hydrogen and air and
burned. Ions and electrons form in the flame and decrease resistance in the electrode gap. This
allows current to flow in the detector circuit. Current flow is monitored and charted as a
chromatogram. The amount of current generated is dependent upon the type and number of ions
formed in the flame. Under consistent instrument conditions, a particular substance will burn in
the same manner; therefore, the amount of current generated is proportional to the amount of
substance burned allowing quantitation of the material when compared to known standards. To
improve accuracy and consistency of quantitation, an internal standard is often added to a sample
and the relative response between sample and internal standard is used for quantitation.
GC can also give a very good indication of the identity of a substance; although it does not
usually provide conclusive identification of a substance. Under consistent instrument conditions,
movement of a specific material through a GC column will take a constant period of time. Thus,
the time it takes a substance to travel through a GC column (retention time) is consistent for a
particular substance. Therefore, retention time on the GC column provides a very good
indication of substance identity when compared to a standard material.
Gas Chromatography/Mass Spectrometry (GC/MS)
A mass spectrometer may be the detector for a GC; in this case, the instrumentation is called
GC/MS. Mass spectrometry provides a unique identification of the materials tested; it can also
be used for quantitation. As a substance elutes from the GC and enters the MS, it is bombarded
with an electron beam. The molecule fragments into characteristic ions depending upon the
relative strength of its chemical bonds and chemical structure. Positively charged fragments of
the molecule are directed down the analyzer and impinge upon the detector of the MS.
Dallas County Institute of Forensic Sciences 1 GC/MS Overview
Controlled Substances Laboratory Version 2.0

8/6/2019 SWIFS Controlled Substances Resources Documents v2.1 (02.2009) 76 pages.pdf
http://slidepdf.com/reader/full/swifs-controlled-substances-resources-documents-v21-022009-76-pagespdf 6/76
Dallas County Institute of Forensic Sciences 2 GC/MS Overview
Controlled Substances Laboratory Version 2.0
Plotting the relative abundance of each mass fragment identified by the analyzer then generates a
mass spectrum. A mass spectrum provides a unique identification of the material being tested.
Unknown spectra are identified using in-house library spectra files, commercial computer
libraries, and reference materials containing published mass spectra.
Under consistent instrumental conditions, the mass ions generated are consistent for a particularsubstance allowing qualitative identification, and the abundance of ions generated are
proportional to concentration of the substance within the instrument’s linear range allowing
quantitation.
8/6/2019 SWIFS Controlled Substances Resources Documents v2.1 (02.2009) 76 pages.pdf
http://slidepdf.com/reader/full/swifs-controlled-substances-resources-documents-v21-022009-76-pagespdf 7/76
Directions for Operation of the HP 6890 GC with
G2070AA Chemstation
Users are referred to the appropriate instrument manuals for additional information.
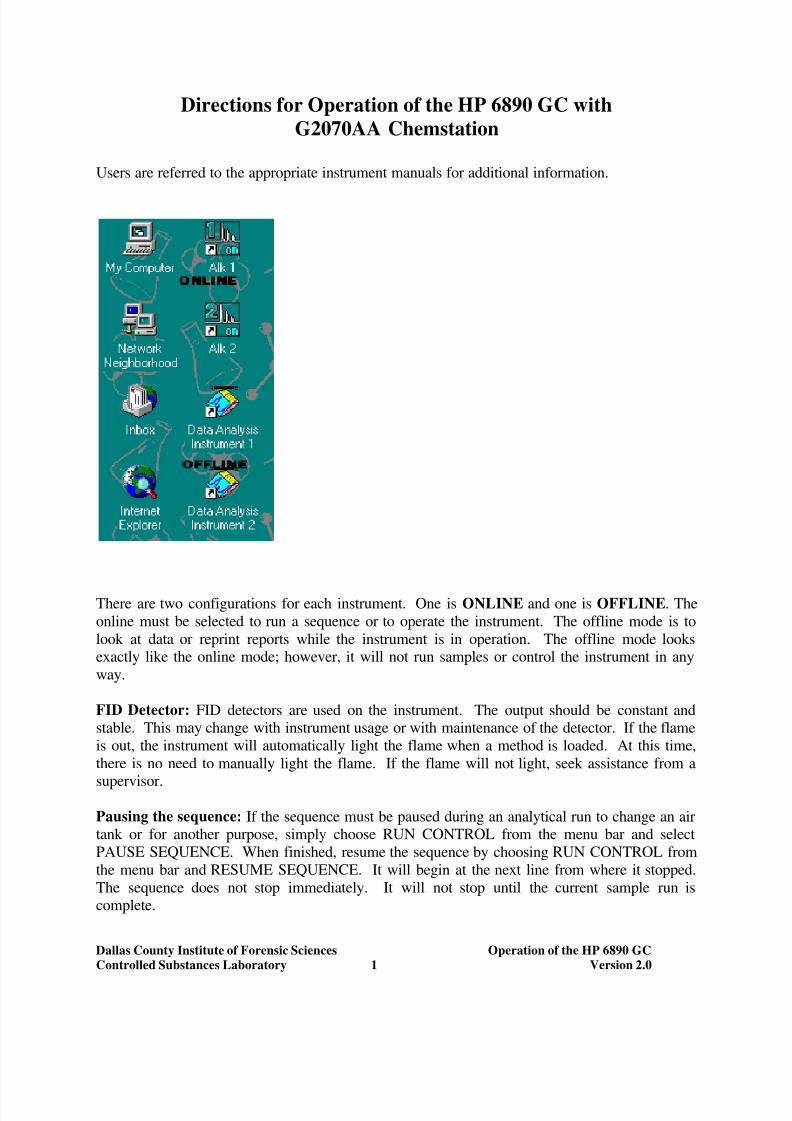
There are two configurations for each instrument. One is ONLINE and one is OFFLINE. The
online must be selected to run a sequence or to operate the instrument. The offline mode is to
look at data or reprint reports while the instrument is in operation. The offline mode looksexactly like the online mode; however, it will not run samples or control the instrument in any
way.
FID Detector: FID detectors are used on the instrument. The output should be constant andstable. This may change with instrument usage or with maintenance of the detector. If the flame
is out, the instrument will automatically light the flame when a method is loaded. At this time,
there is no need to manually light the flame. If the flame will not light, seek assistance from a
supervisor.
Pausing the sequence: If the sequence must be paused during an analytical run to change an airtank or for another purpose, simply choose RUN CONTROL from the menu bar and select
PAUSE SEQUENCE. When finished, resume the sequence by choosing RUN CONTROL from
the menu bar and RESUME SEQUENCE. It will begin at the next line from where it stopped.
The sequence does not stop immediately. It will not stop until the current sample run iscomplete.
Dallas County Institute of Forensic Sciences Operation of the HP 6890 GC
Controlled Substances Laboratory 1 Version 2.0

8/6/2019 SWIFS Controlled Substances Resources Documents v2.1 (02.2009) 76 pages.pdf
http://slidepdf.com/reader/full/swifs-controlled-substances-resources-documents-v21-022009-76-pagespdf 8/76
Partial Sequence: Partial sequence may be used to rerun a sequence or start a sequence in themiddle after stopping. This is not done after pausing it. Partial sequence may also be used in the
offline mode to reprocess certain parts of a sequence in which regeneration of a report or group
of reports is needed. Unless absolutely necessary, do not use the partial sequence when running asample. Once the partial sequence has been started, samples cannot be added to the sequence;
this makes the instrument unusable by other users until the sequence is complete.
Starting a Run:
1. Check the gases. If low, change before starting the analytical run. If the gases run out
during a run or become low during a run see the instructions for pausing a sequence.
2. At this point a sequence must either be created or added to:
A. Adding to a sequence:
1. A single click with the left mouse button on the carousel picture will bring
up the sequence table. Selecting SEQUENCE from the menu bar, and
then selecting SEQUENCE TABLE may also access the sequence table.2. Using the instructions for Sequence Table, add unknown samples.
B. Creating a sequence:
1. Select SEQUENCE from the menu bar and select:
A. SEQUENCE PARAMETERS. Follow instructions for sequence
parameters.
B. SEQUENCE TABLE. Add samples using the instructions for
sequence table.
C. SAVE SEQUENCE AS. Save the sequence in the followingformat: Month (3 letters), day (2 numbers), and letter (a, b, c); for
example: SEP23A2. Go back to sequence table and select Run Sequence button to start the
sequence, or select START located above carousel picture.
The order of these is not important. They all must be done to properly store the data in the properlocations. The sequence will run if not saved; however, if the instrument locks up or the
computer needs to be rebooted for any reason, the sequence will be lost, and sample information
will need to be re-entered. Therefore, save the sequence.
Dallas County Institute of Forensic Sciences Operation of the HP 6890 GC
Controlled Substances Laboratory 2 Version 2.0

8/6/2019 SWIFS Controlled Substances Resources Documents v2.1 (02.2009) 76 pages.pdf
http://slidepdf.com/reader/full/swifs-controlled-substances-resources-documents-v21-022009-76-pagespdf 9/76
Sequence Parameters Screen: This screen can be accessed through the menu bar under
SEQUENCE.
The subdirectory is the name of the data path in which the computer will store the dataaccumulated from the sequence.
Enter the subdirectory information in the following format: month (3 letters), day (2 numbers),
and letter (a, b, c); for example, SEP23A
Currently initials are not entered in the operator box. Everything else in this screen is a default
value and should not be change or updated at this time. When finished simply hit the OK button
to exit.
Dallas County Institute of Forensic Sciences Operation of the HP 6890 GC
Controlled Substances Laboratory 3 Version 2.0

8/6/2019 SWIFS Controlled Substances Resources Documents v2.1 (02.2009) 76 pages.pdf
http://slidepdf.com/reader/full/swifs-controlled-substances-resources-documents-v21-022009-76-pagespdf 10/76
Sequence Table Screen: This screen is where the user enters the sequence to be run and sample
information. This screen may be accessed by a single click of the left mouse button on thecarousel picture or by selecting it under the SEQUENCE item on the menu bar. The critical
information that must be present is the vial location, sample name, method name, inj/vial, and
sample type. All other cells should be left blank. Any numbers in these blank cells could causethe sample to be injected improperly, calculated wrong or any number of other errors.
To select a line move the cursor to the line number cell on the screen. This will produce an
arrow. Click the left mouse button on this arrow and it will select the entire line (darkening theline). Drag the mouse down any number of lines to select the entire group of lines. Once a line
or group of lines has been selected, the user may cut, copy, insert, insert vial range, or append
line.
The Insert button will insert a blank line above or in front of the line that you have selected.
Dallas County Institute of Forensic Sciences Operation of the HP 6890 GC
Controlled Substances Laboratory 4 Version 2.0

8/6/2019 SWIFS Controlled Substances Resources Documents v2.1 (02.2009) 76 pages.pdf
http://slidepdf.com/reader/full/swifs-controlled-substances-resources-documents-v21-022009-76-pagespdf 11/76
The Insert Vial Range button will prompt you to enter information. Type in the appropriateinformation and hit the OK button. DO NOT put any number in the injection volume box.
This will override the method and inject that amount, in microliters, onto the column. If left
blank, it will default to the method for that information. The information that is inputted will beinserted above or in front of the line that has been selected.
The Append Line will put a blank line after the line that has been selected.
The Cut button will cut the selected line. It is stored until another action takes place, i.e.:
another cut or a copy. It may be pasted into another place in the sequence once it has been cut or
simply discarded.
The Copy button will copy the selected line but leave the line in place. It may then be pasted
into another place in the sequence.
The Paste button will paste the selected cut or copied line above or in front of the newly selected
line.
At this point, if the sequence has been saved, select the Run Sequence button to start a run. If the
sequence has not been saved, select the OK button to exit this screen and save the sequence
before returning. If the sequence is already running and samples are added to the sequence thensimply select the OK button after the samples have been added. Then save the sequence (no
need for the save as function).
Dallas County Institute of Forensic Sciences Operation of the HP 6890 GC
Controlled Substances Laboratory 5 Version 2.0

8/6/2019 SWIFS Controlled Substances Resources Documents v2.1 (02.2009) 76 pages.pdf
http://slidepdf.com/reader/full/swifs-controlled-substances-resources-documents-v21-022009-76-pagespdf 12/76
Reports are printed as a sample run is completed using macros written into the method
parameters. If a report must be reprinted or reprocessed, use the following instructions:
Reprinting a report: If the instrument is running a sequence, use the offline mode of the
instrument. From the Data Analysis screen select:
Select File from the menu bar and select Load Signal…1. In the Folders: box, selected the correct data path where the signal is
stored. For example, C:\hpchem\1\data\aug05c.2. In the File name: box, selected the correct data signal to be analyzed, by
clicking on the name with the left mouse button, or retype the filename of
the signal desired to print. Select OK.3. If the “Integrate and print report after load” button is selected, the report
will be automatically generated. If it is not selected, the chromatographcan be manually integrated utilizing the Chemstation software.
This will print out a formatted report. Another way to reprint a report is go into the offline mode
and load the sequence for the report that you want to reprint. Select the partial sequence. At this
point simply mark the line or lines that you want to regenerate and it will print the report in theproper format. This is the preferred way to reprocess a batch or reprocess more than a single
sample.
Dallas County Institute of Forensic Sciences Operation of the HP 6890 GC
Controlled Substances Laboratory 6 Version 2.0

8/6/2019 SWIFS Controlled Substances Resources Documents v2.1 (02.2009) 76 pages.pdf
http://slidepdf.com/reader/full/swifs-controlled-substances-resources-documents-v21-022009-76-pagespdf 13/76
Gas Chromatography
CALIBRATION AND MAINTENANCE
Agilent/HP 6890 Gas Chromatograph Coupled with Flame Ionization Detectors
All chemists are responsible for ensuring the proper operation of gas chromatographs (GC),
running QC samples, evaluating instrument calibration, and providing general housekeeping of
instrumentation as needed.
I. Instrument Calibration:
Calibration of the GC will be evaluated each day that the GC is used. This will be accomplishedby running quality control samples (QC) for routine drugs (methamphetamine, cocaine, heroin,
mdma, etc.) and evaluating QC results as described in the applicable analytical procedure. If the
QC sample is not within the set limits of +/- 5% of the target concentration, additional actionmust be taken to obtain an acceptable QC result such as re-running QC, re-extracting and re-
running QC, making new stock with re-extraction and re-analysis, re-calibrating (run curve),
and/or consulting a supervisor. Additional information may be found in the appropriate
analytical procedure.
Calibration of retention time (RT) will also be evaluated for these drugs and internal standard
each day the GC is used. Retention time is properly calibrated when these drugs fall into theexpected retention time window established by the appropriate GC method. If retention time
falls outside the expected window, the chemist will attempt to determine the cause by reviewingrecent preventive maintenance records or discussing the situation with a supervisor. Based upon
the retention time of known standards, the Calibration Table for the drug and/or internal standard
will be updated, the method saved, and the chromatogram reprocessed as necessary. Asupervisor will be notified if appropriate or if problems persist.
Documentation of instrument calibration is found in the Calibration Curve/Response Factor LogBook and the results of the daily QC are documented on the GC Calibration/QC Log located in
the Drug Laboratory.
II. Instrument Maintenance:
Routine preventive maintenance activities such as changing a gas cylinder, septum, and/or inlet
liner is documented in the GC Maintenance Log located near each instrument. Activities otherthan scheduled preventive maintenance should be approved in advance by a supervisor.
Dallas County Institute of Forensic Sciences GC Maintenance – HP6890
Controlled Substances Laboratory 1 Version 2.0

8/6/2019 SWIFS Controlled Substances Resources Documents v2.1 (02.2009) 76 pages.pdf
http://slidepdf.com/reader/full/swifs-controlled-substances-resources-documents-v21-022009-76-pagespdf 14/76

8/6/2019 SWIFS Controlled Substances Resources Documents v2.1 (02.2009) 76 pages.pdf
http://slidepdf.com/reader/full/swifs-controlled-substances-resources-documents-v21-022009-76-pagespdf 15/76
NOTE: Turn off carrier gas; if the septum nut is removed without turning off the carrier gas, theglass wool plug may be blown out.
Use ultraclean technique at all times when handling the new liner.
1.
Cool the inlet to < 80
o
C to minimize oxidation and prevent burns.2. Turn off the carrier gas on the GC by using the keypad on the front panel of the GC: From
the front panel on the GC, push the FRONT INLET button, scroll down using the ↓ button to
the Total flow line. Turn off the flow by pressing the OFF button. Once maintenance is
complete, turn the flow back on by pressing the ON button.3. Once the inlet is cool and the gas is off, remove the septum nut. Remove and replace the
septum. Reinstall and tighten the septum nut. These are not ultraclean parts but care should
be taken to avoid any unnecessary contamination.4. Remove the nut covering the liner. Remove the old liner and discard.
5. Using ultraclean technique, carefully slide an o-ring over the end of the new liner,
approximately ¼” from the top of the liner, and slide into the inlet. The glasswool plug
should be nearest the bottom of the liner.6. Replace and tighten the nut and turn the inlet temperature and carrier gas flow on.
7. A blank should be run to bake out the new liner before analyzing samples.
Changing the Gold Seal:
Tools needed: appropriate screw driver (Phillips/Torx/etc.), 9/16” wrench, ¼” wrench
Note: The gold seal is located at the bottom of the inlet. It is accessed through the nut in the
oven where the column comes out of the inlet.
Use ultraclean technique at all times when handling the gold seal.
1. Cool the inlet to < 80 oC to minimize oxidation and prevent burns.
2. Turn off the carrier gas flow (follow the procedure listed above for “Changing the Liner andSeptum”).
3. Remove the column from the inlet. (Once the column is removed, the ferrule will need to be
replaced and the column cut.)4. Remove the insulator cup (if present) to reveal the nut housing the gold seal.
5. Remove the nut and discard the used gold seal and washer.
6. Insert the new washer and gold seal into the nut:
a. Insert the washer into the nut; the washer goes between the gold seal and the nut.b. Insert the gold seal into the nut with the grooves visible on top. (These grooves are the
exits for the split gas during split injection and for the purge flow after a splitless injection.)
7. Reinstall the nut containing the gold seal and washer, and tighten.8. Replace the insulator cup over the nut (if present).
9. Replace the ferrule and trim the column as described below.
10. Reinstall the column and check for leaks with a leak detector. (If you turned off the carriergas, turn it back on and let it flow for a few minutes before you check for leaks.)
11. Turn on the inlet temperature.
Dallas County Institute of Forensic Sciences GC Maintenance – HP6890
Controlled Substances Laboratory 3 Version 2.0

8/6/2019 SWIFS Controlled Substances Resources Documents v2.1 (02.2009) 76 pages.pdf
http://slidepdf.com/reader/full/swifs-controlled-substances-resources-documents-v21-022009-76-pagespdf 16/76
12. A blank should be run to bake out the system before analyzing samples.
Trimming the Column and Installing a New Column (Inlet/Detector):
Tools needed: column cutting wafer, ¼ inch wrench
NOTE: Hydrogen and airflow to the detector must be turned off any time the detector end of thecolumn is removed from the FID unit.
Any time a column is removed from the inlet/detector, the ferrule should be replaced and the
column should be trimmed. The inlet end of the column may be cut several inches to removeactive sites and restore separation capacity.
1. Cool the inlet and detector to < 80oC. This will minimize oxidation and prevent burns.
2. Turn off the carrier flow following the procedures in “Changing the Liner and Septum.”
3. Remove the column from the inlet and detector by loosening the column nuts.
4.
Remove the column nut(s) and ferrule(s). The ferrule, which is made of graphite, may bestuck to the nut; remove all ferrule particles.
5. Slide a septum, column nut, and ferrule onto the free ends of the column (tapered end of the
ferrule should point away from the column nut, the flat side toward the nut).
6. Cut two or three inches off the end of the column:a. The column should be cut by scoring one side with a wafer and then snapping the column
at the score.
b. Inspect this cut with a magnifying glass. This cut must be clean and contain no roughedges. If there are rough edges, repeat until a clean cut is achieved or seek guidance.
c. Wipe the end of the column with a Kimwipe and methanol, or hexane.d. Place the column back into the inlet or detector. When installed, the column should
protrude 5 mm (4 mm to 6 mm) beyond the ferrule into the inlet. Use the septum as a guide
for this measurement.e. Tighten the column nut so that the column does not slide with a gentle tug.
7. The detector end of the column should be prepared in the same manner.
8. Insert the column into the detector until it comes to a stop, finger tighten the nut, pull thecolumn back approximately 1 mm or as noted by the manufacturer. Use the septum as a
guide for this measurement. Tighten the column nut.
9. Turn on the carrier gas, and check for leaks with a leak detector.
Conditioning the Column:
If conditioning is not done properly the column may be ruined.1. Allow the carrier gas to flow through the column for approximately one hour with the GC
oven at room temperature.
2. Ramp the oven temperature at 10-15 degrees per minute to the final conditioningtemperature. The final conditioning temperature should be 10 degrees higher than the
maximum oven temperature to be used in the method but should not exceed 10 degrees
below the maximum operating temperature of the column as recommended by themanufacturer.
Dallas County Institute of Forensic Sciences GC Maintenance – HP6890
Controlled Substances Laboratory 4 Version 2.0

8/6/2019 SWIFS Controlled Substances Resources Documents v2.1 (02.2009) 76 pages.pdf
http://slidepdf.com/reader/full/swifs-controlled-substances-resources-documents-v21-022009-76-pagespdf 17/76
Dallas County Institute of Forensic Sciences GC Maintenance – HP6890
Controlled Substances Laboratory 5 Version 2.0
3. Condition the column several hours or overnight.
Cleaning FID Jets or Replacement:
Refer to HP 6890 Series Gas Chromatograph Maintenance and Troubleshooting Manual.
Cleaning the Split Side Arm:
The split vent side arm is the exhaust for split gasses and compounds that are purged off during
an injection. This can become very dirty and without maintenance can cause deleterious results.
1. Cool the injector temperature and turn off the gasses.
2. Remove the liner from the inlet as specified in the “Changing the Liner and Septum” section.
3. Remove the autosampler tray, tower, fan cover, and the top rear instrument cover.4. Remove the split side arm from the inlet to the filter located at the rear of the instrument.
5. Inspect the ends of the side arm to make sure they are not clogged. If they are, use an old
syringe to unclog the ends.6. Using vacuum, pull a solvent such as chloroform through the side arm and into waste.
7. Repeat step 4 using a solvent such as methanol and then air to dry.
8. Using a small brush or Q-tip dipped in chloroform clean out the inlet arm where the side arm
attaches.9. Reconnect the side arm to the inlet and the filter.
10. Replace the covers and autosampler tray and tower.
11. Change the liner, o-ring and septum.12. Turn on the temperatures and gases.
13. Check for leaks.

8/6/2019 SWIFS Controlled Substances Resources Documents v2.1 (02.2009) 76 pages.pdf
http://slidepdf.com/reader/full/swifs-controlled-substances-resources-documents-v21-022009-76-pagespdf 18/76
QUICK REFERENCE
ROUTINE CALIBRATION AND OPERATION
AGILENT AND HP 5973 MASS SELECTIVE DETECTOR
Standard Spectra Autotune:
• For each day the MS is used a Standard Spectra Autotune shall be performed prior to routine
instrument operation and after instrument maintenance:
From the Instrument Control Screen select Instrument, select Perform MS Autotune…,
select Standard Spectra Tune from the Select Tune Type menu (see attached). Tune isautomatically saved in the Stune.u directory. Review the Tune Report and file for future
reference. Criteria for the Standard Spectra Tune are as follows:
1. Low background: less than 150 peaks
2. Low water and air: less than 10%
3.
Correct mass assignments ± 0.2 amu (69, 219, 502)4. Symmetrical, smooth mass peak shapes5. Consistent mass peak widths (0.55 ± 0.1) (Default value of Drug MS is 0.55)
6. Isotope mass assignments should be 1 amu greater than parent peaks
7. Appropriate EM voltage: 1000-2800 electron volts. If the voltage is not within theselimits, review the history of the electron multiplier or consult a supervisor. The EM
voltage will increase over time as the source becomes dirty with use. Cleaning the
source should return the EM voltage to a normal operating level.8. Mass 69 abundance should be 150,000-400,000
9. Typical relative abundance:
- Mass 69 = 100 %
-
Mass 219 = 35-130%- Mass 502 = 2-5 %10. Proper isotope ratios:
- Mass 70/69 = 0.5-1.6 %
- Mass 220/219 = 3.2-6.4 %
- Mass 503/502 = 7.9-12.3 %
Dallas County Institute of Forensic Sciences GC/MS Quick Reference
Controlled Substances Laboratory Version 2.1
1

8/6/2019 SWIFS Controlled Substances Resources Documents v2.1 (02.2009) 76 pages.pdf
http://slidepdf.com/reader/full/swifs-controlled-substances-resources-documents-v21-022009-76-pagespdf 19/76
Dallas County Institute of Forensic Sciences GC/MS Quick Reference
Controlled Substances Laboratory Version 2.1
2
Target percent relative abundances are set for certain other PFTBA masses. The system willcome as close as possible to the values shown:
- Mass 50 ≈ 1 %
- Mass 131 ≈ 55 %
-
Mass 414 ≈ 3.5 %
If the tune meets the criteria listed, the chemist who performed the tune will initial and circle the
initials. All other chemists using the instrument that day will review the tune for acceptance of data and initial.
Autotune:
From the Instrument Control Screen select Instrument, select Perform MS Autotune…,
select Autotune from the Select Tune Type menu (see attached). Tune is automatically savedin the Atune.u directory. Review the Tune Report and file for future reference. Acceptable
criteria for the Autotune are as follows:
1. Low background: less than 150 peaks2. Low water and air: less than 10 %
3. Correct mass assignments ± 0.2 amu (69, 219, 502)
4. Symmetrical, smooth mass peak shapes5. Consistent mass peak widths (0.55 ± 0.1) (Default value of Drug MS is 0.55)
6. Isotope mass assignments should be 1 amu greater than parent peaks
7. Appropriate EM voltage: 1000-2800 electron volts. If the voltage is not within theselimits, review the history of the electron multiplier or consult a supervisor. The EM
voltage will increase over time as the source becomes dirty with use. Cleaning thesource should return the EM voltage to a normal operating level.
8. Mass 69 abundance should be 150,000-400,000
9. It is normal at times to have a base peak of 219 instead of 6910. Relative abundance:
- Mass 69 = 100 %
- Mass 219 = 35-130%
- Mass 502 = ≥ 2 %11. Isotope ratios:
- Mass 70/69 = 0.5-1.6 %
- Mass 220/219 = 3.2-6.4 %- Mass 503502 = 7.9-12.3 %

8/6/2019 SWIFS Controlled Substances Resources Documents v2.1 (02.2009) 76 pages.pdf
http://slidepdf.com/reader/full/swifs-controlled-substances-resources-documents-v21-022009-76-pagespdf 20/76
If the tune meets the criteria listed, the chemist who performed the tune will initial and circle the
initials. All other chemists using the instrument that day will review the tune for acceptance of
data and initial.
Failure of Tune To Meet Acceptable Criteria:
If the daily Standard Spectra Autotune fails, the operating chemist will take note of any error
messages generated by the Chemstation Software, check all sources of leaks for tightness, andinform a supervisor. The supervisor will evaluate instrument operation and attempt to correct
any problem. If the problem is resolved, an Autotune and Standard Spectra Autotune shall be
performed, and applicable technical, maintenance, and repair information documented in the
GC/MS Maintenance Logbook. If the problem cannot be resolved, the instrument will bemarked “out of service” and a supervisor will arrange for instrument repair.
GC/MS Maintenance Schedule:
GC/MS maintenance is documented in the GC/MS Maintenance Logbook located near the
instruments.
Daily/with use Tune (Standard Spectra Autotune)
Change wash vial solventsCheck gases
Weekly Change liner and o-ring
Monthly Change gold seal
Trim column
Back up data and sequences to CD or disc
6 months Check autocal vial
Yearly Replace rough pump oil
As needed Replace septum (minimum-weekly)
Trim columnChange gas tanks
Dallas County Institute of Forensic Sciences GC/MS Quick Reference
Controlled Substances Laboratory Version 2.1
3
Replace column

8/6/2019 SWIFS Controlled Substances Resources Documents v2.1 (02.2009) 76 pages.pdf
http://slidepdf.com/reader/full/swifs-controlled-substances-resources-documents-v21-022009-76-pagespdf 21/76
Dallas County Institute of Forensic Sciences GC/MS Quick Reference
Controlled Substances Laboratory Version 2.1
4
Change filament
Clean sourceClean split side arm
To Set Up and Run a Sequence on the GC/MS System:
• From the MS Top Screen select Sequence, select Edit Sample Log Table…
• Click on blank line in the table. The box labeled as Type should read “Blank” for method blanks and “Sample” for unknown samples.
• Use the tab key or mouse to move to the Vial box and enter the corresponding vial number tothe unknown sample in the autosample tray.
• Move to Method and enter the name of the method to be used for the current sample. (For a
list of methods, hold the “shift” and “?” keys in this field.)
• Supply the Sample Name and any Miscellaneous Information (if any), and the Expected
Barcode.
• Use the Repeat, Cut, Copy, and Paste buttons as appropriate to add samples to the table.
Repeat copies the highlighted line, increments the vial number, places the new lineimmediately after the highlighted one. Copy copies the highlighted line without change.
Use Paste to position the copied line where you wish.
• When finished entering unknown samples into the sample log table, click OK.
• From the MS Top Screen select Sequence, and select Run…. Enter correct data file name(i.e. C:\HPCHEM\1\DATA\ or C:\MSDCHEM\1\DATA\), insure that Full Method is
checked under “Method Sections to Run”, that Inject Anyway is checked under “OnBarcode Mismatch”, and click OK. Select Sequence and Save from the menu task bar.
Enter correct sequence path name and click OK (ie. C:\HPCHEM\1\SEQUENCE\ or
C:\MSDCHEM\1\SEQUENCE\). From the MS Top menu task bar select Sequence and
Print Sequence. Print Full format.
• From the MS Top Screen select Sequence, and select Run…. Start sequence table byclicking on Run Sequence.
To Analyze MS Data:
• To load a data file: From Data Analysis Screen menu task bar, select File, and select Load
Data File. Select a data file name and click OK, or double click the left mouse button on the
data file name. The total ion chromatogram (TIC) for the data file is loaded and displayed in
window [2].
A data file must be loaded to perform any of the following tasks.
• To integrate a chromatogram: From Data Analysis menu task bar, select either
Chromatogram/Integrate or Chromatogram/AutoIntegrate.
• To select a spectrum: Double-click the right mouse button on the time point of interest inthe chromatogram. The mass spectrum appears in window [1].

8/6/2019 SWIFS Controlled Substances Resources Documents v2.1 (02.2009) 76 pages.pdf
http://slidepdf.com/reader/full/swifs-controlled-substances-resources-documents-v21-022009-76-pagespdf 22/76
• To print a spectrum: From Data Analysis task bar menu, select File, and select Print….Choose either Select Window or TIC & Spectrum from one of the options and the correct
window desired.
• To zoom in: Position the pointer at one corner of the area you wish to expand in a
chromatogram or spectrum. Press and hold the left mouse button while dragging the mouseto select the area you wish to expand. Release the mouse button. The selected area expands
to fill the existing window.• To zoom out: Position the pointer anywhere in the zoomed window. Double-click the left
mouse button.
• To average spectra: Position the pointer in the chromatogram at the starting time for the
range you want to average. Press the right mouse button while dragging the mouse to theend of the range you want to average. Release the mouse button. The spectra in the selected
range are averaged and the averaged spectrum is displayed in window [1].
• To subtract two spectra: Select a spectrum (double-click the right mouse button in the
chromatogram). Select the spectrum to be subtracted (double-click the right mouse button inthe chromatogram). Select Subtract from the Spectrum menu. The spectrum selected
second is subtracted from the first spectrum and the resulting spectrum is displayed in
window [1].
To Use Spectral Libraries:
• To search a single spectrum: In Data Analysis, load a data file. The TIC is displayed.Select a spectrum. The selected spectrum appears in a window below the chromatogram.
Initiate the library search by double-clicking the right mouse button in the window
containing the spectrum. When the search is complete, the search results appear on thescreen. The spectrum for the unknown, the reference spectrum you select from the list of
hits, and, if available, the chemical structure of the reference compound is displayed.
• To print library results: Click the Print button to print a copy of the displayed spectra.
Click Done button to clear the library search results from the screen.
References:
• HP5973 MSD/HP6890 Series GC – ‘Quick Reference’
• Calibration and Maintenance procedure in the GC/MS Operation Procedure notebook
Dallas County Institute of Forensic Sciences GC/MS Quick Reference
Controlled Substances Laboratory Version 2.1
5

8/6/2019 SWIFS Controlled Substances Resources Documents v2.1 (02.2009) 76 pages.pdf
http://slidepdf.com/reader/full/swifs-controlled-substances-resources-documents-v21-022009-76-pagespdf 23/76
Dallas County Institute of Forensic Sciences GC/MS Quick Reference
Controlled Substances Laboratory Version 2.1
6
• GC/MSD Chemstation and Instrument Operation Student Manual Vol #1 Course#H4043A

8/6/2019 SWIFS Controlled Substances Resources Documents v2.1 (02.2009) 76 pages.pdf
http://slidepdf.com/reader/full/swifs-controlled-substances-resources-documents-v21-022009-76-pagespdf 24/76
Gas Chromatography/Mass Spectrometry
CALIBRATION AND MAINTENANCE
Agilent/HP 6890 GC with 5973 Series Mass Spectrometer
Tuning the instrument is performed by the use of the autotune program which collects the mass
and abundance for selected isotope fragments of the tuning compound, perfluorobutylamine
(PFTBA). The autotune report can be used to monitor system performance over time and canindicate the need for maintenance.
All chemists are responsible for ensuring the proper operation of the gas chromatograph/massspectrometers (GC/MS) and general housekeeping of the instrumentation as needed.
I. Calibration
A. Standard Spectra Tune
The Standard Spectra Tune ensures standard response over the full mass range. This tuneis recommended to optimize mass spectral library searches. Therefore, calibration of the
GC/MS is performed each day of use by using the Standard Spectra Tune. Tuning should
be performed after instrument maintenance and before operation.
For the 5973 instruments tune as follows:
1. Select the instrument control screen.2. Select the Instrument menu item.
3. Select Perform MS Autotune menu item.4. Select tune to perform – Standard Spectra Tune.
5. Review the tune using criteria listed below.
Acceptable criteria for the Standard Spectra Tune are as follows:
1. Low background: less than 150 peaks
2. Low water and air: less than 10%3. Correct mass assignments ± 0.2 amu (69, 219, 502)
4. Symmetrical, smooth mass peak shapes
5. Consistent mass peak widths (0.55 ± 0.1)6. Isotope mass assignments should be 1 amu greater than parent peaks
7. Appropriate EM voltage 1000-2800 electron volts. If the voltage is not within these
limits, review the history of the electron multiplier or consult a supervisor. The EMvoltage will increase over time as the source becomes dirty with use. Cleaning the
source should return the EM voltage to a normal operating level. (If it does not, the
EM may be going bad.)
8. Mass 69 abundance should be 150,000 - 400,0009. Typical relative abundance:
- Mass 69 = 100 %
Dallas County Institute of Forensic Sciences GC/MS Maintenance – HP6890
Controlled Substances Laboratory 1 Version 2.1

8/6/2019 SWIFS Controlled Substances Resources Documents v2.1 (02.2009) 76 pages.pdf
http://slidepdf.com/reader/full/swifs-controlled-substances-resources-documents-v21-022009-76-pagespdf 25/76
- Mass 219 = 35-130%
- Mass 502 = 2-5 %10. Proper isotope ratios:
- Mass 70/69 = 0.5-1.6 %
- Mass 220/219 = 3.2-6.4 %
-
Mass 503/502 = 7.9-12.3 %
In addition, the standard auto tune sets targets for the percent relative abundances for
certain other PFTBA masses. The system will come as close as possible to the valuesshown:
- Mass 50 ≈ 1 %
- Mass 131 ≈ 55 %- Mass 414 ≈ 3.5 %
- If the tune meets the criteria listed, the chemist who performed the tune will initial andcircle the initials. All other chemists using the instrument that day will review the tune
for acceptance of data and initial.
B. Autotune
Autotune maximizes instrument sensitivity over the mass range, using PFTBA masses
69, 219, and 502. This tune is used in troubleshooting instrument operation. Thestandard spectra tune should be run prior to routine instrument operation.
Acceptable criteria for the Autotune is as follows:
1. Low background: less than 150 peaks2. Low water and air: less than 10%
3. Correct mass assignments ± 0.2 amu (69, 219, 502)
4. Symmetrical, smooth mass peak shapes5. Consistent mass peak widths (0.55 ± 0.1)
6. Isotope mass assignments should be 1 amu greater than parent peaks
7. Appropriate EM voltage: 1000-2800 electron volts. If the voltage is not within these
limits, review the history of the electron multiplier or consult a supervisor. The EMvoltage will increase over time as the source becomes dirty with use. Cleaning the
source should return the EM voltage to a normal operating level.
8. Mass 69 abundance should be 150,000 - 400,0009. It is normal at times to have a base peak of 219 instead of 69
10. Relative abundance:
- Mass 69 = 100 %- Mass 219 = 35-130%
- Mass 502 = ≥ 2 %
11. Isotope ratios:
- Mass 70/69 = 0.5-1.6 %- Mass 220/219 = 3.2-6.4 %
- Mass 503/502 = 7.9-12.3 %
Dallas County Institute of Forensic Sciences GC/MS Maintenance – HP6890
Controlled Substances Laboratory 2 Version 2.1

8/6/2019 SWIFS Controlled Substances Resources Documents v2.1 (02.2009) 76 pages.pdf
http://slidepdf.com/reader/full/swifs-controlled-substances-resources-documents-v21-022009-76-pagespdf 26/76
If the tune meets the criteria listed, the chemist who performed the tune will initial andcircle the initials. All other chemists using the instrument that day will review the tune
for acceptance of data and initial.
C. Quick Tune
Quick Tune provides re-tuning for optimum response and resolution, and for accurate
mass assignment. Only the mass axis, peak widths, and EM voltage are adjusted; thelenses are unaffected. This tune may be used to rapidly check tuning after maintenance.
The Standard Spectra Tune should be run prior to routine instrument operation.
D. Failure of a Tune to Meet Acceptable Criteria:
If the Autotune or Standard Spectra Autotune fails, the operating chemist will take noteof any error messages generated by the Chemstation Software, check all sources of leaks
for tightness, and inform a supervisor. The supervisor will evaluate instrument operationand try to correct the problem. If the problem is corrected, Standard Spectra Autotune
shall be performed, and applicable technical, maintenance, and/or repair informationdocumented in the GC/MS Maintenance Logbook. If the problem cannot be resolved, the
instrument will be marked as “out of service”, and the supervisor will arrange for
instrument repair.
II. Maintenance
GC/MS maintenance is documented in the GC/MS Maintenance Logbook located near
the instruments.
GC/MS Maintenance Schedule
Daily/with use Tune: Standard Spectra Autotune
Change wash vial solvents
Check gases
Weekly Change liner and o-ring
Monthly Change gold sealTrim column
Back up data and sequences to CD or disc
6 months Check autocal vial
Yearly Replace rough pump oil
As needed Replace septum
Trim column
Dallas County Institute of Forensic Sciences GC/MS Maintenance – HP6890
Controlled Substances Laboratory 3 Version 2.1
8/6/2019 SWIFS Controlled Substances Resources Documents v2.1 (02.2009) 76 pages.pdf
http://slidepdf.com/reader/full/swifs-controlled-substances-resources-documents-v21-022009-76-pagespdf 27/76
Change gas tanks
Replace columnChange filament
Clean source
Clean split side arm
Maintenance activities should be consolidated to minimize instrument down time. For example,
if it is time to change the gold seal and cut the column, it may be more prudent to change the
liner and septum at that time or hold off changing the gold seal until the liner and septum arechanged.
The maintenance interval is not a rigid schedule and should be based upon workflow. Unlessthere is an immediate problem, a chromatographic run should continue to completion, and the
maintenance performed at the end of a run. Where duplicate instrumentation exists, only one
instrument at a time should be scheduled for preventive maintenance to avoid multipleinstruments being out of service at the same time.
Ultraclean Technique:
Liners, gold seals, and certain other parts must be handled using ultraclean techniques to avoid
contamination of the part with oils from the skin, plasticizers from plastic laboratory bench-
coats, etc. Do not handle an ultraclean part with your hands; wear cotton gloves or use a freshKimwipe. Lay the ultraclean part on a cloth wrapping or on a clean Kimwipe.
Changing the Wash Vial Solvent:
Discard waste solvent into the hazardous waste. Replace spent solvent in wash vials with freshmethanol, and replace the vials in the appropriate location on the instrument autosampler.
Changing the Liner and Septum:
Tools needed: inlet wrench and tweezers.
NOTE: Turn off carrier gas; if the septum nut is removed without turning off the carrier gas, theglass wool plug may be blown out.
Use ultraclean technique at all times when handling the new liner.
1. Cool the inlet to < 80oC to minimize oxidation and prevent burns.
2. Turn off the carrier gas on the GC by using the keypad on the front panel of the GC: From
the front panel on the GC, push the FRONT INLET button, scroll down using the ↓ button to
the Total Flow line. Turn off the flow by pressing the OFF button. Once maintenance iscomplete, turn the flow back on by pressing the ON button.
3. Once the inlet is cool and the gas is off, remove the septum nut. Remove and replace the
septum. Reinstall and tighten the septum nut. These are not ultraclean parts but care should
be taken to avoid any unnecessary contamination.
Dallas County Institute of Forensic Sciences GC/MS Maintenance – HP6890
Controlled Substances Laboratory 4 Version 2.1

8/6/2019 SWIFS Controlled Substances Resources Documents v2.1 (02.2009) 76 pages.pdf
http://slidepdf.com/reader/full/swifs-controlled-substances-resources-documents-v21-022009-76-pagespdf 28/76
4. Remove the nut covering the liner. Remove the old liner and discard.
5. Using ultraclean technique, carefully slide an o-ring over the end of the new liner,approximately ¼” from the top of the liner, and slide into the inlet. The glasswool plug
should be nearest the bottom of the liner.
6. Replace and tighten the nut and turn the inlet temperature and carrier gas flow on.
7.
A blank should be run to bake out the new liner before analyzing samples.
Changing the Gold Seal:
Tools needed: appropriate screw driver (Phillips/Torx/etc.), 9/16” wrench, ¼” wrench
Note: The gold seal is located at the bottom of the inlet. It is accessed through the nut in theoven where the column comes out of the inlet.
Use ultraclean technique at all times when handling the gold seal.
1.
Cool the inlet to < 80
o
C to minimize oxidation and prevent burns.2. Turn off the carrier gas flow (follow the procedure listed above for “Changing the Liner and
Septum”).3. Remove the column from the inlet. (Once the column is removed, the ferrule will need to be
replaced and the column cut.)
4. Remove the insulator cup (if present) to reveal the nut housing the gold seal.5. Remove the nut and discard the used gold seal and washer.
6. Insert the new washer and gold seal into the nut:
a. Insert the washer into the nut; the washer goes between the gold seal and the nut. b. Insert the gold seal into the nut with the grooves visible on top. (These grooves are the
exits for the split gas during split injection and for the purge flow after a splitless injection.)7. Reinstall the nut containing the gold seal and washer, and tighten.
8. Replace the insulator cup over the nut (if present).
9. Replace the ferrule and trim the column as described below.10. Reinstall the column and check for leaks with a leak detector. (If you turned off the carrier
gas, turn it back on and let it flow for a few minutes before you check for leaks.)
11. Turn on the inlet temperature.
12. A blank should be run to bake out the system before analyzing samples.
Trimming the Column (Inlet):
Tools needed: column cutting wafer, ¼ inch wrench
Any time a column is removed from the inlet, the ferrule should be replaced and the columnshould be trimmed. The inlet end of the column may be cut several inches to remove active sites
and restore separation capacity.
1. Cool the inlet to < 80oC. This will minimize oxidation and prevent burns.
2. Turn off the carrier flow following the procedures in “Changing the Liner and Septum”.
3. Remove the column from the inlet.
Dallas County Institute of Forensic Sciences GC/MS Maintenance – HP6890
Controlled Substances Laboratory 5 Version 2.1

8/6/2019 SWIFS Controlled Substances Resources Documents v2.1 (02.2009) 76 pages.pdf
http://slidepdf.com/reader/full/swifs-controlled-substances-resources-documents-v21-022009-76-pagespdf 29/76
4. Remove the column nut and ferrule. The ferrule, which is made of graphite or
graphite/vespel, may be stuck to the nut; remove all ferrule particles.5. Slide a septum, column nut, and ferrule onto the free end of the column (tapered end of the
ferrule should point away from the column nut, the flat side toward the nut).
6. Cut two or three inches off the end of the column:
a. The column should be cut by scoring one side with a wafer and then snapping the columnat the score.
b. Inspect this cut with a magnifying glass. This cut must be clean and contain no rough
edges. If there are rough edges, repeat until a clean cut is achieved or seek guidance.c. Wipe the end of the column with a Kimwipe and methanol, or hexane.
d. Place the column back into the inlet. When installed, the column should protrude 5 mm
(4 mm to 6 mm) beyond the ferrule into the inlet. Use the septum as a guide for thismeasurement.
e. Tighten the column so that the column does not slide with a gentle tug.
7. Turn on the carrier gas, and check for leaks with a leak detector.
Installing a New Column:
Tools needed: column cutting wafer, ¼ inch wrench, MSD installation tool
1. Cool the injector and vent the detector. After the MS has vented, open the vacuum manifold.
2. Turn off the carrier flow following the procedure in “Changing the Liner and Septum.”3. Loosen the column nuts from the injector and the transfer line from the detector, and remove
the column.
4. Place a nut and ferrule on each end of the column. (The flat side of the ferrule goes towardthe inlet nut and tapered side out, and the tapered end slides into the MS transfer line nut,
with the flat side out.) NOTE: These are different types of ferrules. See supervisor for instruction.
5. Cut about 2-3 inches from the inlet end of the column using techniques described in “Cutting
the Column.”6. Install the new column into the inlet.
7. An “MS” column, which has been developed for use in a mass selective detector has
extremely low column bleed and can be conditioned while in the detector. MS columns can
also be conditioned prior to installation into the GC/MSD interface.8. The column can be installed in the mass spec detector either with an installation tool or
without.
a. Without the tool: Slide the column into the GC/MSD interface until it can be pulledthrough the vacuum manifold, trim 1-2 cm off the end of the column, clean the outside of
the column with methanol or hexane, adjust the column so it protrudes 1-2 mm past the
end of the interface, hand tighten the nut, readjust the column as necessary and tightenthe nut ¼ to ½ turn. (Check tightness after one or two vent cycles.
b. With the tool: Slide the column into column installation tool, trim 1-2 cm off the end of
the column, clean the outside of the column with methanol or hexane, adjust the column
so it protrudes 1-2 mm past the end of the tool, hand tighten the nut, slide the septum totouch the end of the nut, use two wrenches to tighten the nut ¼ turn, remove the column
and nut from the installation tool (total length from the septum to the end of the column is
Dallas County Institute of Forensic Sciences GC/MS Maintenance – HP6890
Controlled Substances Laboratory 6 Version 2.1

8/6/2019 SWIFS Controlled Substances Resources Documents v2.1 (02.2009) 76 pages.pdf
http://slidepdf.com/reader/full/swifs-controlled-substances-resources-documents-v21-022009-76-pagespdf 30/76

8/6/2019 SWIFS Controlled Substances Resources Documents v2.1 (02.2009) 76 pages.pdf
http://slidepdf.com/reader/full/swifs-controlled-substances-resources-documents-v21-022009-76-pagespdf 31/76
Operation of the 5973 Series Mass SpectrometerUtilizing G1701BA and G1701DA, Versions B.01.00 and D00.00
Mass Spectrometer Chemstation Software
Overview
The Chemstation software is a windows based application and usable on Windows
95, 98, NT and 2000. The following instructions are intended as a general guideand do not represent all of the ways that the software may be used. In depth literature ispublished by the manufacturer and should be used as the key reference and
troubleshooting guide. Online help is also available at www.agilent.com. Users may
begin using the Chemstation software by clicking on the Top icon located on the desktop.
There are several ways to move around in the Chemstation software. The primarymethod of movement from one screen to another in the software is through the View
menu item. If in the Top Level, Instrument Control or Data Analysis, the View menu
item will allow the user to move to any of the other screens.
Users are referred to the appropriate instrument manuals for additional information.
Top Level Screen
From the Top Level screen the user has the ability to edit, print, load, and save methods
and sequences. This screen enables the user to begin instrument operation.
Instrument Control Screen
From the instrument control screen the user has the ability to modify instrument
parameters such as injector, inlet, column and oven parameters, mass spec temperatures,and electron multiplier voltages. The user can also load, edit, save and print methodsfrom this screen. This screen enables the user to monitor instrument parameters during a
run. Instrument tuning is also done from this screen.
Data Analysis Screen
From the data analysis screen the user can edit the data analysis portion of a method, edit
and select libraries, review total ion chromatograms, review individual spectra, compareunknown spectra to known libraries, and print reports. Data analysis is also the location
of the quantitation databases used in quantitative methods.
Storage of Data files, Methods and Sequences
The hard drive is partitioned into two drives, drive C:\ and drive D:\. The C:\ drive is thelocation of the Chemstation and the operating system (Windows NT 4.0 or Windows
2000). The D:\ drive is designated for storage of other installed software. For the
operation of the Mass Spectrometer Chemstation there are three key areas of storage.
Dallas County Institute of Forensic Sciences Operation 5973 GC/MS
Controlled Substances Laboratory 1 Version 2.0

8/6/2019 SWIFS Controlled Substances Resources Documents v2.1 (02.2009) 76 pages.pdf
http://slidepdf.com/reader/full/swifs-controlled-substances-resources-documents-v21-022009-76-pagespdf 32/76
Data is stored in C:\hpchem\1\data\ or C:\msdchem\1\data\ . Data consists of data.ms files containing total ion chromatograms and their spectra, pre_post.ini files containing
information on the status of the instrument during the run of the indicated file, and log
files containing information regarding the sequence that was run.
Methods are stored in C:\hpchem\1\methods\ or C:\msdchem\1\methods\ . Methodscontain all of the information required to execute a run. Methods contain the requiredmacros and instrument parameters such as oven ramping, pressure and flow parameters,
injection temperatures and specifications, and instrument temperatures, as well as other
information.
Sequences are stored in C:\hpchem\1\sequence\ or C:\msdchem\1\sequence\ .
Sequences contain the information required to complete a series of injections utilizing the
autosampler tower, tray and barcode reader. The information consists of vial number,sequence line number, sample name, method name, and operator information.
I. Sequences
Loading a sequence or creating a new sequence
From the top level:
1. Select Sequence menu item.
2. Select Load… menu item.3. Select the default.s or a previous sequence
and OK.
This sequence of events will load the selected
sequence in the instrument’s memory. Proceed to
Edit sequence section to edit the sequence or Runninga sequence section to run the loaded sequence.
Edit sequence
Once the desired sequence has been loaded you may want to edit the sequence. From the
top level:
1. Select Sequence menu item.2. Select Edit Sample Log Table… menu item.
The edit screen will appear at this time with the sequence that the user had previouslyloaded. The user may edit, cut, copy, paste, or repeat lines in the sequence. Information
that is required is Type, Vial, Method, and Expected Barcode. Line and Data File will be
completed automatically by the Chemstation software. The user may wish to include aSample Name and/or Miscellaneous Information.
Dallas County Institute of Forensic Sciences Operation 5973 GC/MS
Controlled Substances Laboratory 2 Version 2.0

8/6/2019 SWIFS Controlled Substances Resources Documents v2.1 (02.2009) 76 pages.pdf
http://slidepdf.com/reader/full/swifs-controlled-substances-resources-documents-v21-022009-76-pagespdf 33/76
Line – the line number in the sequence completed by the Chemstation
Type – the type of sample: sample, blank, calibrator, etc.
Data File – unique number for a particular sequence generated by the Chemstation. Thisnumber is only unique for the specific sequence and may be repeated in other sequences.
Method – the method that the user wishes to employ.
Sample Name – the description of the sample.
Repeat – will increment the highlighted line by one number and will copy the highlighted
line for all other information.
Cut – will delete the highlighted line (will hold it in memory for paste function untilanother cut or a copy is executed).
Copy – will copy the highlighted line to be used with the paste function.
Paste – will paste the highlighted line that has been cut or copied and insert it above the
current highlighted line.
Once the editing is complete select OK to exit. If you do not exit out of the edit screen
the sequence will not continue.
Dallas County Institute of Forensic Sciences Operation 5973 GC/MS
Controlled Substances Laboratory 3 Version 2.0

8/6/2019 SWIFS Controlled Substances Resources Documents v2.1 (02.2009) 76 pages.pdf
http://slidepdf.com/reader/full/swifs-controlled-substances-resources-documents-v21-022009-76-pagespdf 34/76
Edit a sequence while it is running
The user may also edit the sequence while a sequence is running to add specimen to the
running sequence. If the sequence is running the menu items will not be available andthe user must select the Edit Samp Log Tbl button from the center screen. At this time
the edit sequence screen will appear.
Saving a sequence
After the user has loaded and edited a sequence, the
sequence must be saved. From the top level:
1. Select the Sequence menu item.
2. Select the Save… menu item.
The default location to save sequences is
C:\hpchem\1\sequence\ or C:\msdchem\1\sequence\. If the location varies from the default location, locate the
default and then save. The format in which to save the
sequence is: month, day, and letter designation (ie:
Jul29A).
Running a sequence
Dallas County Institute of Forensic Sciences Operation 5973 GC/MS
Controlled Substances Laboratory 4 Version 2.0
There are several ways to begin a sequence. The user may select Run…, Load and
Run…, or Position and Run…. The Run… menu item will begin the current sequence.
The Load and Run… sequence menu item will allow the user to load a new sequence

8/6/2019 SWIFS Controlled Substances Resources Documents v2.1 (02.2009) 76 pages.pdf
http://slidepdf.com/reader/full/swifs-controlled-substances-resources-documents-v21-022009-76-pagespdf 35/76
and then run it. The Position and Run…menu item will allow the user to begin thecurrent sequence at a user specified location within the current sequence. To begin a
sequence from the top level:
1. Select the Sequence menu item.
2.
Select the Run…, Load and Run…, or Position and Run… menu item.3. The user will be prompted to enter the data path for the storage of the datacollected during the sequence run. The following screen will appear:
4. Make sure that Full Method and Inject Anyway are selected. The user may
or may not want to select the Overwrite Existing Data Files option.5. Type the correct path for the storage of data. The default path is
C:\hpchem\1\data\ or C:\msdchem\1\data\. The default location is where the
Chemstation looks for data from the data analysis screen. If the user does notstore the data in the default location be aware of the location that was selected.
6. Select Run Sequence button.
If the sequence does not begin at this time, check the above screen and the selections to
make sure that the proper selections have been made. If Load and Run… or Position
and Run… are selected the user will be prompted to load a sequence or select a position
within a sequence before the above screen appears.
Using Keywords
The Chemstation allows the use of keywords within a sequence. These keywords allow
the user to perform certain functions within the sequence such as running a command or
macro, tuning the instrument, or pausing the sequence. The most common keyword usedis Pause. The Pause command will allow the user to pause the sequence after an
injection or series of injections are made, or a method is complete. To use a keyword:
Dallas County Institute of Forensic Sciences Operation 5973 GC/MS
Controlled Substances Laboratory 5 Version 2.0

8/6/2019 SWIFS Controlled Substances Resources Documents v2.1 (02.2009) 76 pages.pdf
http://slidepdf.com/reader/full/swifs-controlled-substances-resources-documents-v21-022009-76-pagespdf 36/76
1. From the Sample Log Table:
2. Select the next
line to be run,copy and paste so
there are twoidentical lines.3. Select the
Keyword command in the
Type box.4. This will prompt
the user to type
the Keyword thatis to be used.
Select the
keyword desiredin the keyword
box.
5. Select OK.
When the current method is complete the keyword command will be executed.
II. Methods
The method in the Chemstation software is the location of all of the instrument
parameters and data analysis parameters that will take place during the execution of a
method in a sequence. Methods should only be created or modified by those withknowledge of the required parameters or experience with instrument parameters.
Creating a new method
To create a new method the user may select menu
items from either the Top Level screen or the
instrument control screen. From either screen:
1. Select the Method menu item.
2. Select the Load… menu item.3. Load the default method or load an
existing method and modify to create
your new method.4. Select the Save… menu item to save the
method with an appropriate name.
Dallas County Institute of Forensic Sciences Operation 5973 GC/MS
Controlled Substances Laboratory 6 Version 2.0

8/6/2019 SWIFS Controlled Substances Resources Documents v2.1 (02.2009) 76 pages.pdf
http://slidepdf.com/reader/full/swifs-controlled-substances-resources-documents-v21-022009-76-pagespdf 37/76
Editing an existing method
If the user needs to edit a method or check the contents of a method the method may be
accessed from the Top Level screen or the instrument control screen. From either
screen:
1.
Select the Method menu item.2. Select the Edit Entire Method… menu item.3. Edit or review the method.
Save the method ONLY if aware of the changes that have been made. DO NOT save the
method if unaware of the changes made.
III. Data Analysis
The user may enter data analysis in several different ways. The user may open it fromthe icon on the desktop, from the Top Level screen during the execution of a sequence,
or from the View menu item from any
screen.
Loading a chromatogram (data file)
Dallas County Institute of Forensic Sciences Operation 5973 GC/MS
Controlled Substances Laboratory 7 Version 2.0
The data file contains the total ion chromatogram and the spectra for the identified
compounds in the chromatogram. To load a chromatogram:1. Select the File menu item.
2. Select the Load Date File… menu item.
3. Select the appropriate data file from the correctdata path and select OK. (The data file will be in
the location that was specified when the sequence
was started. The default location is
C:\hpchem\1\data\ or C:\msdchem\1\data\.)

8/6/2019 SWIFS Controlled Substances Resources Documents v2.1 (02.2009) 76 pages.pdf
http://slidepdf.com/reader/full/swifs-controlled-substances-resources-documents-v21-022009-76-pagespdf 38/76
Reviewing Data
Once the chromatogram has been loaded it will appear in window [2]. It will appear as
the total ion chromatogram (TIC) with peaks representing detector response tocompounds and their retention times. There are many items that the user may want to use
to review data. These include, but are not limited to, integrating, searching for specificions, comparing unknown spectra to known libraries, generating reports, and printingspectra.
The TIC will be normalized on the largest peak. This means that the largest peak will be
completely visible from the top of the peak to the baseline. Large peaks in a TIC maymake smaller peaks not visible when looking at the normalized chromatogram. If the
user wishes to look at the smaller peaks the zoom function may be used. To do this left
click and hold the mouse, drag a box around the area to be analyzed and release. Thiswill zoom in on the area that the box was drawn around.
Generating, comparing and printing spectra
To generate a spectra at a specific TIC retention time double click the right mouse button
at the point of interest. This will generate a mass spectrum of the area that was clicked
on and it will appear below the TIC in window [1].
The method that is loaded will determine what library or libraries have been selected for
use (see searching libraries for instructions on changing). To compare the generatedspectrum with the library that is specified in the method:
1. Double click the right mouse button while the cursor is in window [1].
Dallas County Institute of Forensic Sciences Operation 5973 GC/MS
Controlled Substances Laboratory 8 Version 2.0

8/6/2019 SWIFS Controlled Substances Resources Documents v2.1 (02.2009) 76 pages.pdf
http://slidepdf.com/reader/full/swifs-controlled-substances-resources-documents-v21-022009-76-pagespdf 39/76
2. This will generate a comparative spectrum with the best match being shownfirst. This comparative spectrum is generated in window [24].
The spectrum for the unknown compound is located on top and the spectrum
for the best match is located on the bottom. The library that the best matchspectrum came from is listed in the PBM Search Results box.
3. To print the comparison, select the Print button located in the PBM Search
Results box, or select the File menu item, Print… and Selected Window.Type in the number 24 when prompted.
Dallas County Institute of Forensic Sciences Operation 5973 GC/MS
Controlled Substances Laboratory 9 Version 2.0
The user may also want to print the TIC or the unknown spectrum without using thecomparison method. To do this:
1. Load chromatogram and generate spectrum.
2. Select the File menu item.3. Select the Print… menu item.
4. The user will be prompted to enter the window to
print. Enter the number of the window desired toprint: 1 = spectrum, 2 = TIC.
8/6/2019 SWIFS Controlled Substances Resources Documents v2.1 (02.2009) 76 pages.pdf
http://slidepdf.com/reader/full/swifs-controlled-substances-resources-documents-v21-022009-76-pagespdf 40/76
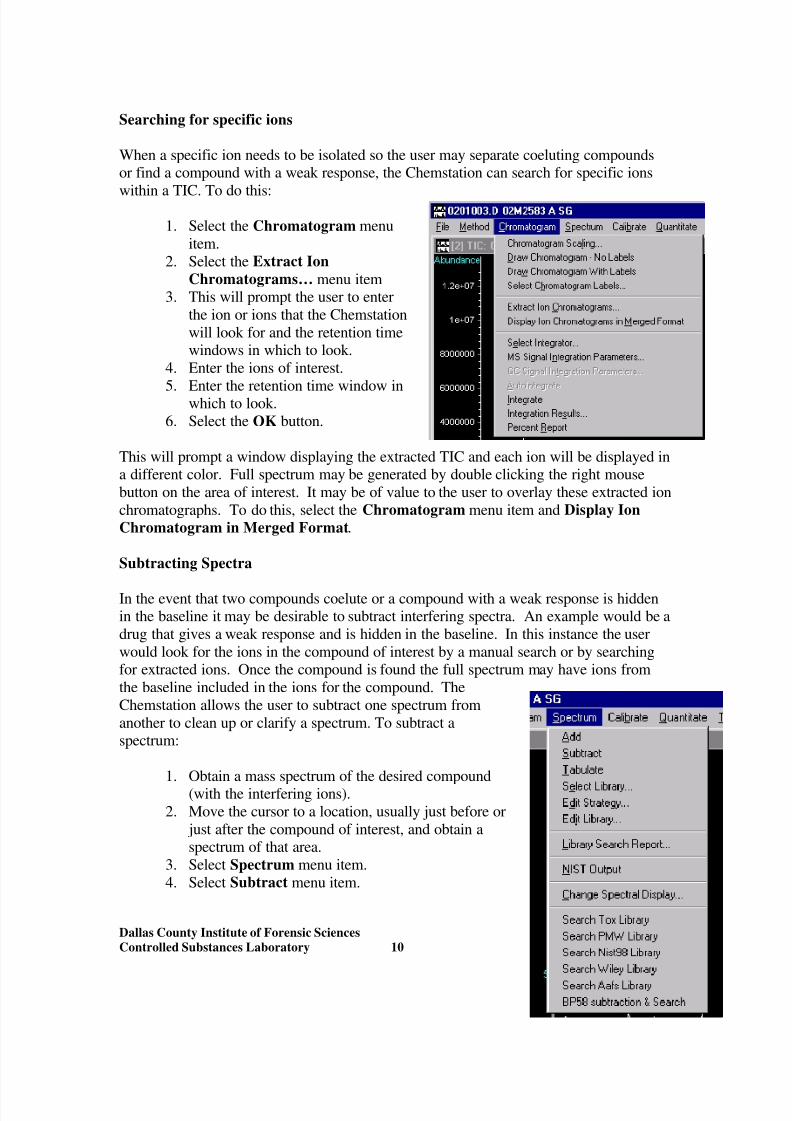
Searching for specific ions
When a specific ion needs to be isolated so the user may separate coeluting compoundsor find a compound with a weak response, the Chemstation can search for specific ions
within a TIC. To do this:
1. Select the Chromatogram menu
item.
2. Select the Extract Ion
Chromatograms… menu item3. This will prompt the user to enter
the ion or ions that the Chemstation
will look for and the retention timewindows in which to look.
4. Enter the ions of interest.
5.
Enter the retention time window inwhich to look.
6. Select the OK button.
This will prompt a window displaying the extracted TIC and each ion will be displayed ina different color. Full spectrum may be generated by double clicking the right mouse
button on the area of interest. It may be of value to the user to overlay these extracted ion
chromatographs. To do this, select the Chromatogram menu item and Display Ion
Chromatogram in Merged Format.
Subtracting Spectra
Dallas County Institute of Forensic Sciences Operation 5973 GC/MS
Controlled Substances Laboratory 10 Version 2.0
In the event that two compounds coelute or a compound with a weak response is hiddenin the baseline it may be desirable to subtract interfering spectra. An example would be a
drug that gives a weak response and is hidden in the baseline. In this instance the user
would look for the ions in the compound of interest by a manual search or by searchingfor extracted ions. Once the compound is found the full spectrum may have ions from
the baseline included in the ions for the compound. The
Chemstation allows the user to subtract one spectrum from
another to clean up or clarify a spectrum. To subtract aspectrum:
1. Obtain a mass spectrum of the desired compound(with the interfering ions).
2. Move the cursor to a location, usually just before or
just after the compound of interest, and obtain aspectrum of that area.
3. Select Spectrum menu item.
4. Select Subtract menu item.
8/6/2019 SWIFS Controlled Substances Resources Documents v2.1 (02.2009) 76 pages.pdf
http://slidepdf.com/reader/full/swifs-controlled-substances-resources-documents-v21-022009-76-pagespdf 41/76
The resulting spectrum will be the difference of the second obtained spectrum removedfrom the first obtained spectrum.
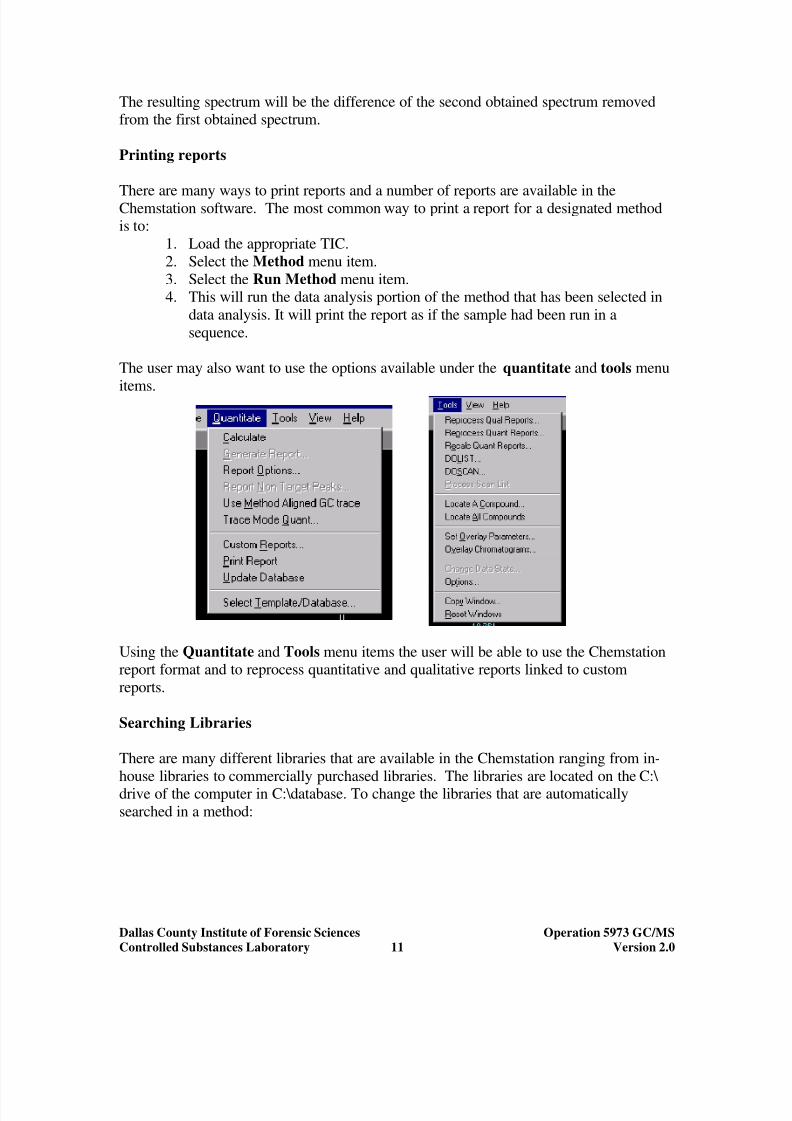
Printing reports
There are many ways to print reports and a number of reports are available in theChemstation software. The most common way to print a report for a designated methodis to:
1. Load the appropriate TIC.
2. Select the Method menu item.
3. Select the Run Method menu item.4. This will run the data analysis portion of the method that has been selected in
data analysis. It will print the report as if the sample had been run in a
sequence.
The user may also want to use the options available under the quantitate and tools menu
items.
Using the Quantitate and Tools menu items the user will be able to use the Chemstationreport format and to reprocess quantitative and qualitative reports linked to custom
reports.
Searching Libraries
There are many different libraries that are available in the Chemstation ranging from in-
house libraries to commercially purchased libraries. The libraries are located on the C:\ drive of the computer in C:\database. To change the libraries that are automatically
searched in a method:
Dallas County Institute of Forensic Sciences Operation 5973 GC/MS
Controlled Substances Laboratory 11 Version 2.0

8/6/2019 SWIFS Controlled Substances Resources Documents v2.1 (02.2009) 76 pages.pdf
http://slidepdf.com/reader/full/swifs-controlled-substances-resources-documents-v21-022009-76-pagespdf 42/76
1. Select the Spectrum menu item.2. Select the Select Library… menu item.
3. This will prompt the user to type in the name of the
library to be used.
This will affect the library that is used when the user iscomparing an unknown spectrum to a library spectrum.
Note: Mass Spectral libraries are used only as a tool in
identifying an unknown. Chemists must consider a variety of
factors before reaching a conclusion.
Addition of New Mass Spectra to Libraries
If a new compound or standard is obtained, it is important to have this compound’s mass
spectra in a spectral library. The spectral library to place the new compound must be
selected, usually it will be dcflab.l. (See instructions above to select the appropriatelibrary.) To add a mass spectrum to a library:
1. Select the Spectrum menu item.
2. Select the Edit Library… menu item.
3. Select the Add New Entry menu item.
4. Enter information into appropriate cells: Name, Mol. Formula, Mol. Weight,
etc.5. Select the Include in search box.
Dallas County Institute of Forensic Sciences Operation 5973 GC/MS
Controlled Substances Laboratory 12 Version 2.0
8/6/2019 SWIFS Controlled Substances Resources Documents v2.1 (02.2009) 76 pages.pdf
http://slidepdf.com/reader/full/swifs-controlled-substances-resources-documents-v21-022009-76-pagespdf 43/76
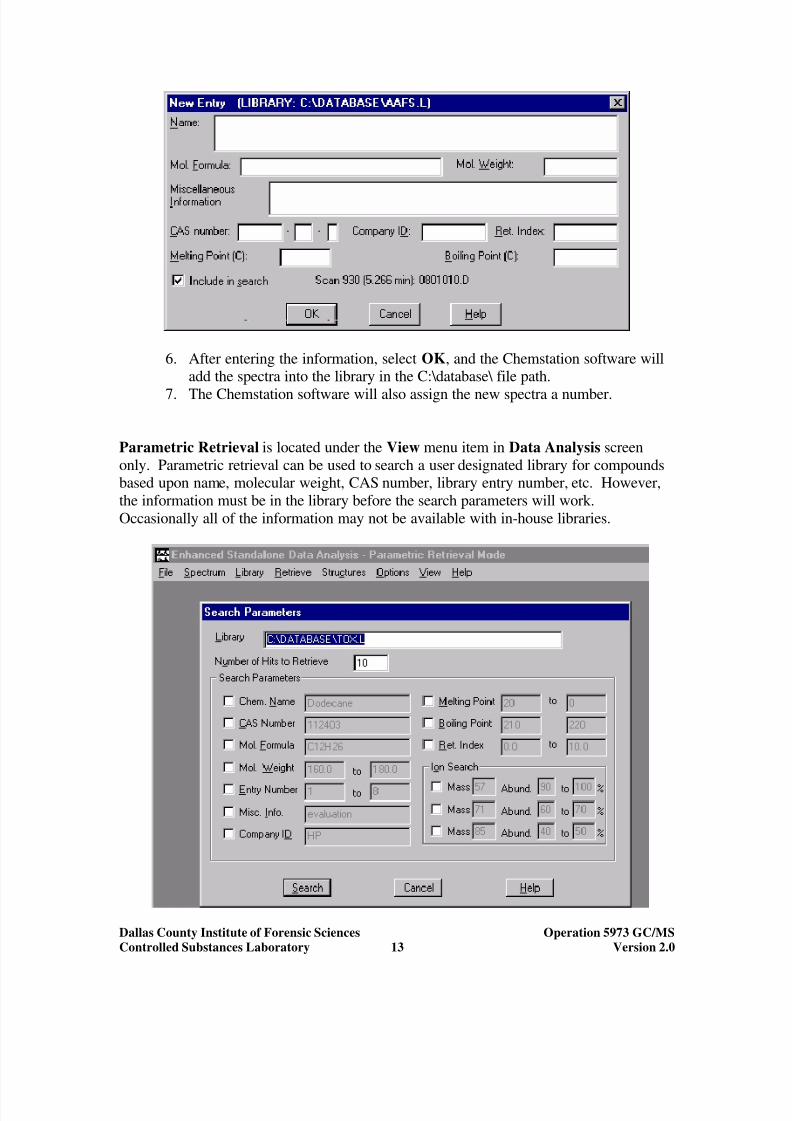
6. After entering the information, select OK, and the Chemstation software willadd the spectra into the library in the C:\database\ file path.
7. The Chemstation software will also assign the new spectra a number.
Parametric Retrieval is located under the View menu item in Data Analysis screen
only. Parametric retrieval can be used to search a user designated library for compoundsbased upon name, molecular weight, CAS number, library entry number, etc. However,
the information must be in the library before the search parameters will work.
Occasionally all of the information may not be available with in-house libraries.
Dallas County Institute of Forensic Sciences Operation 5973 GC/MS
Controlled Substances Laboratory 13 Version 2.0
8/6/2019 SWIFS Controlled Substances Resources Documents v2.1 (02.2009) 76 pages.pdf
http://slidepdf.com/reader/full/swifs-controlled-substances-resources-documents-v21-022009-76-pagespdf 44/76
Dallas County Institute of Forensic Sciences Operation 5973 GC/MS
Controlled Substances Laboratory 14 Version 2.0
uning the 5973
d in the maintenance log and thereference collection found near each instrument.
T
The tuning instructions and parameters are locate
8/6/2019 SWIFS Controlled Substances Resources Documents v2.1 (02.2009) 76 pages.pdf
http://slidepdf.com/reader/full/swifs-controlled-substances-resources-documents-v21-022009-76-pagespdf 45/76
OPERATION OF THE SPECTRUM ONE FTIR
TABLE OF CONTENTS
1. How To Perform an Instrument Validation Check
2. How To Perform a System Suitability Check
3. How To Run a Background Scan
4. How To Run a Polystyrene Scan
5. How To Run a Negative Control
6.
How To Analyze a Sample
7. How To Perform a Library Search
8. How To Perform Routine Maintenance
9. How To Change the Scale of a Spectrum
10. How To Print Reports using a Template
11. How To Add Spectra To a Library
Dallas County Institute of Forensic Sciences FTIR Operation
Controlled Substances Laboratory Version 2.01

8/6/2019 SWIFS Controlled Substances Resources Documents v2.1 (02.2009) 76 pages.pdf
http://slidepdf.com/reader/full/swifs-controlled-substances-resources-documents-v21-022009-76-pagespdf 46/76
OPERATION OF THE SPECTRUM ONE FTIR
Overview
Users may begin using the Spectrum One software by clicking on the Spectrum icon located onthe desktop. There are several ways to move around in the Spectrum One software. The primarymethod of movement from one screen to another in the software is through the various menus
and the toolbar. The toolbar is the strip of icons that appears under the menus in the top of the
Spectrum Window. The tools in the toolbar provide a quick way of executing some of the
commands.
Users are referred to the appropriate instrument manuals for additional information.
Getting Started
1. Check to make sure the UATR with the KRS-5 crystal is in place.
2.
Clean the top of the crystal and the probe using a Kimwipe and acetone.3. Double click the Spectrum icon on the desktop.
4. Login: Login name = druglab. Click OK.
5. A pop-up window will appear, Accessory Ready Check, click on Cancel.
6. Click the Monitor icon on the toolbar, record the current energy in theFTIR QC Logbook.
Dallas County Institute of Forensic Sciences FTIR Operation
Controlled Substances Laboratory Version 2.02

8/6/2019 SWIFS Controlled Substances Resources Documents v2.1 (02.2009) 76 pages.pdf
http://slidepdf.com/reader/full/swifs-controlled-substances-resources-documents-v21-022009-76-pagespdf 47/76
1. Running the Instrument Validation Check: (Monthly)
a. Carefully remove the ATR accessory from the instrument. (Raise the sample
cover to the vertical position, press the release clip, slide the accessory out of the
sample area.b. In the Instrument menu, go to Validate and click on Validate Instrument.
c.
Click OK.d. The report should print off automatically, if not, print it manually. Evaluate,initial, and place the report in the FTIR QC Logbook.
2. Running the System Suitability Check: (before use)
a. Slide the ATR accessory back into the instrument.
b. Clean the top of the crystal and the pressure arm using a Kimwipe and acetone.c. Check the energy of the system by clicking on the Monitor icon. The energy
should be displayed in the window after a few seconds.d. Record this energy in the FTIR Maintenance Logbook.
e. In the Instrument menu, go to Validate and click on System Suitability.
f. Click OK.g. The report should print off automatically, if not, print it manually. Evaluate,
initial, and place the report in the FTIR QC Logbook.
3. Running a Background Scan: (before use)
a. Click on the Instrument icon.
b. Under the Sample tab, name the scan. (Name = background 2-11-09).c. Under the Scan tab, the range start is 4000 cm-1, end is 515 cm-1, the scan type
should be background, the units should be egy, the scan should not be minimized,and the scan number should be set to 32.
d. Under the Instrument tab the resolution should be 4 cm-1.
e. Click Apply. This button will then change to Scan. Click to begin background
scan.
Dallas County Institute of Forensic Sciences FTIR Operation
Controlled Substances Laboratory Version 2.03

8/6/2019 SWIFS Controlled Substances Resources Documents v2.1 (02.2009) 76 pages.pdf
http://slidepdf.com/reader/full/swifs-controlled-substances-resources-documents-v21-022009-76-pagespdf 48/76
f. Print the background spectra, evaluate, initial, and place in the FTIR QCLogbook.
4. Running a Polystyrene Scan: (Monthly)
a. Click on the Instrument icon.
b. Under the Sample tab, name the scan. (Name = polystyrene 2-11-09).c. Under the Scan tab, the range start is 4000 cm-1, end is 515 cm-1, the scan type
should be sample, the units should be %T, the scan should not be minimized, and
the scan number should be set to 32 scans.
d. Under the Instrument tab, the resolution should be 4 cm-1
.e. Under the Beam tab, click on the red disk with holes. Select polystyrene and
click OK.f. Click Apply. This button will then change to Scan. Click to begin polystyrenescan.
g. Integrate (click on Peaks icon) and print the polystyrene spectra. Evaluate it to
determine if acceptable, initial it, and place in the FTIR QC Logbook.
Dallas County Institute of Forensic Sciences FTIR Operation
Controlled Substances Laboratory Version 2.04
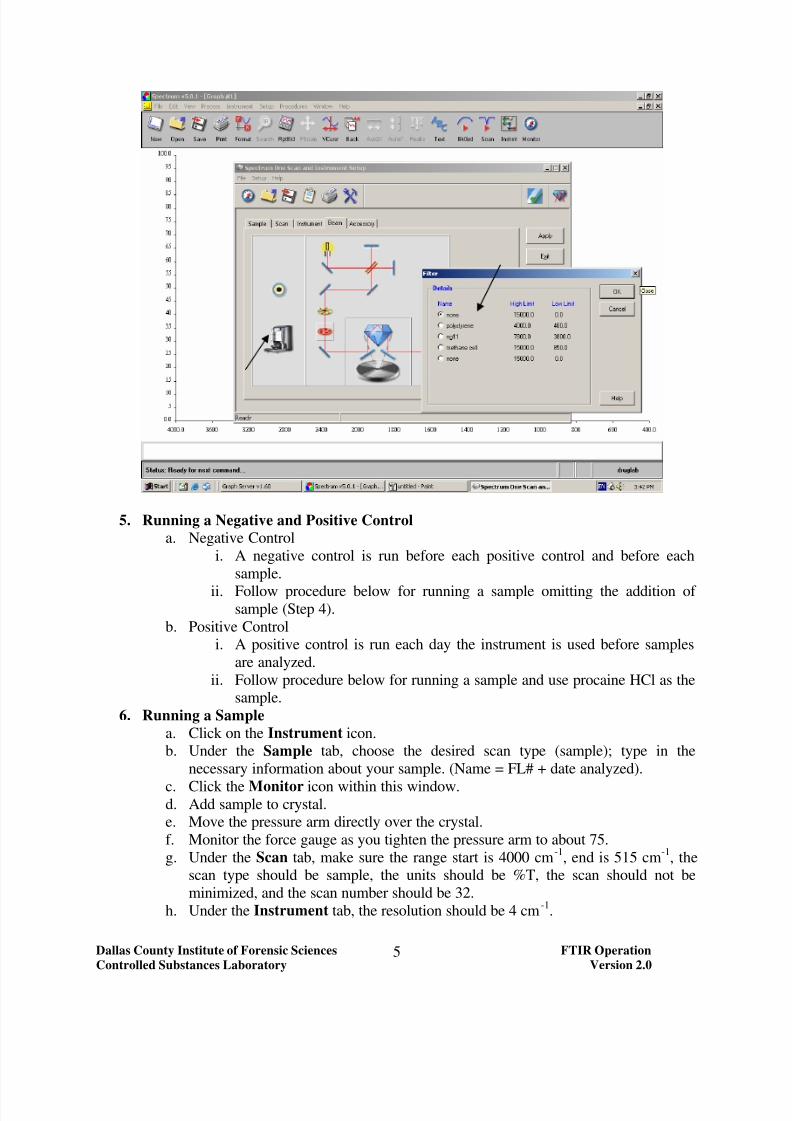
8/6/2019 SWIFS Controlled Substances Resources Documents v2.1 (02.2009) 76 pages.pdf
http://slidepdf.com/reader/full/swifs-controlled-substances-resources-documents-v21-022009-76-pagespdf 49/76
5. Running a Negative and Positive Control
a. Negative Control
i. A negative control is run before each positive control and before each
sample.
ii. Follow procedure below for running a sample omitting the addition of sample (Step 4).
b. Positive Controli. A positive control is run each day the instrument is used before samples
are analyzed.
ii. Follow procedure below for running a sample and use procaine HCl as thesample.
6. Running a Sample
a. Click on the Instrument icon.b. Under the Sample tab, choose the desired scan type (sample); type in the
necessary information about your sample. (Name = FL# + date analyzed).
c. Click the Monitor icon within this window.d. Add sample to crystal.e. Move the pressure arm directly over the crystal.
f. Monitor the force gauge as you tighten the pressure arm to about 75.
g. Under the Scan tab, make sure the range start is 4000 cm-1
, end is 515 cm-1
, thescan type should be sample, the units should be %T, the scan should not be
minimized, and the scan number should be 32.
h. Under the Instrument tab, the resolution should be 4 cm-1
.
Dallas County Institute of Forensic Sciences FTIR Operation
Controlled Substances Laboratory Version 2.05

8/6/2019 SWIFS Controlled Substances Resources Documents v2.1 (02.2009) 76 pages.pdf
http://slidepdf.com/reader/full/swifs-controlled-substances-resources-documents-v21-022009-76-pagespdf 50/76
i. Click on Apply. This button will then change to Scan. Click to begin samplescan.
Dallas County Institute of Forensic Sciences FTIR Operation
Controlled Substances Laboratory Version 2.06

8/6/2019 SWIFS Controlled Substances Resources Documents v2.1 (02.2009) 76 pages.pdf
http://slidepdf.com/reader/full/swifs-controlled-substances-resources-documents-v21-022009-76-pagespdf 51/76
7. Library Search a. IR Search helps you identify an unknown material. It will search through a
library or libraries to find the spectra that best matches your unknown sample. It
can also interpret your unknown spectrum directly by determining from thepattern of peaks (and absence of peaks) which functional groups are likely to be
present.b. Even if your sample is not in the libraries, an interpretation will give youinformation on what functional groups are present in your sample and provide
clues as to what it is.
c. If you know that your sample is one of a range of materials or if you want to
measure how similar your spectrum is to another spectrum, you should use
Compare in the Process menu; this compares your sample spectrum with one
other spectrum or several spectra and reports the degree of similarity between the
spectra.d. There are three types of library search available:
i. Interpretation – An interpretation compares the peaks in your sample
spectrum with the peaks that correspond to 896 Possible Structural Units(PSU’s) or functional groups. A list of PSUs in your sample spectrum is
displayed. You do not need to have a search library to perform an
interpretation.
ii. Euclidean – Compares every point in your sample spectrum with thepoints in spectra in a library search.
iii. Library search – Compares the position of the peaks in your sample
spectrum with the position of peaks in the spectra in a search library.e. Searching the Library
i. Click on the IR search icon in the toolbar.ii. A match will automatically appear on the screen.
Dallas County Institute of Forensic Sciences FTIR Operation
Controlled Substances Laboratory Version 2.07

8/6/2019 SWIFS Controlled Substances Resources Documents v2.1 (02.2009) 76 pages.pdf
http://slidepdf.com/reader/full/swifs-controlled-substances-resources-documents-v21-022009-76-pagespdf 52/76
iii. To find a different match, click on the Euclidean Search Hit List windowand double click on the desired match.
iv. To separate the spectra, click on View, then Overlay/Split, then Split.
Dallas County Institute of Forensic Sciences FTIR Operation
Controlled Substances Laboratory Version 2.08

8/6/2019 SWIFS Controlled Substances Resources Documents v2.1 (02.2009) 76 pages.pdf
http://slidepdf.com/reader/full/swifs-controlled-substances-resources-documents-v21-022009-76-pagespdf 53/76
8. Routine Maintenance
a. FTIR maintenance is documented in the FTIR Maintenance Logbook located near
the instrument. The maintenance interval is not a rigid schedule and should be
based upon workflow. There may be long periods when the instrument is notused. If this is the case, an instrument validation check, system suitability check,
and a polystyrene test should be performed every month at a minimum.b. FTIR Maintenance Schedulei. Daily/with use
1. System Suitability
2. Clean crystal and pressure arm
3. Check energyii. Monthly
1. Polystyrene Standard
2. System Suitability3. Instrument Validation
iii. As needed
1.
Replace dessicantc. Replacing the dessicant:
i. Click on Intrument icon.
ii. Click on the Tools icon, the Adjustments ToolBox will appear.
iii. Click on the Maintenance button.iv. Remove the ATR accessory.
v. Remove the two screws on the top panel using a Phillips screwdriver.
vi. Note the position of the dessicant in its location before replacing it.vii. Reassemble the panel with the screws.
viii. Re-install the ATR accessory.ix. Click on the Changed box under the Dessicant header. Click OK.
Dallas County Institute of Forensic Sciences FTIR Operation
Controlled Substances Laboratory Version 2.09
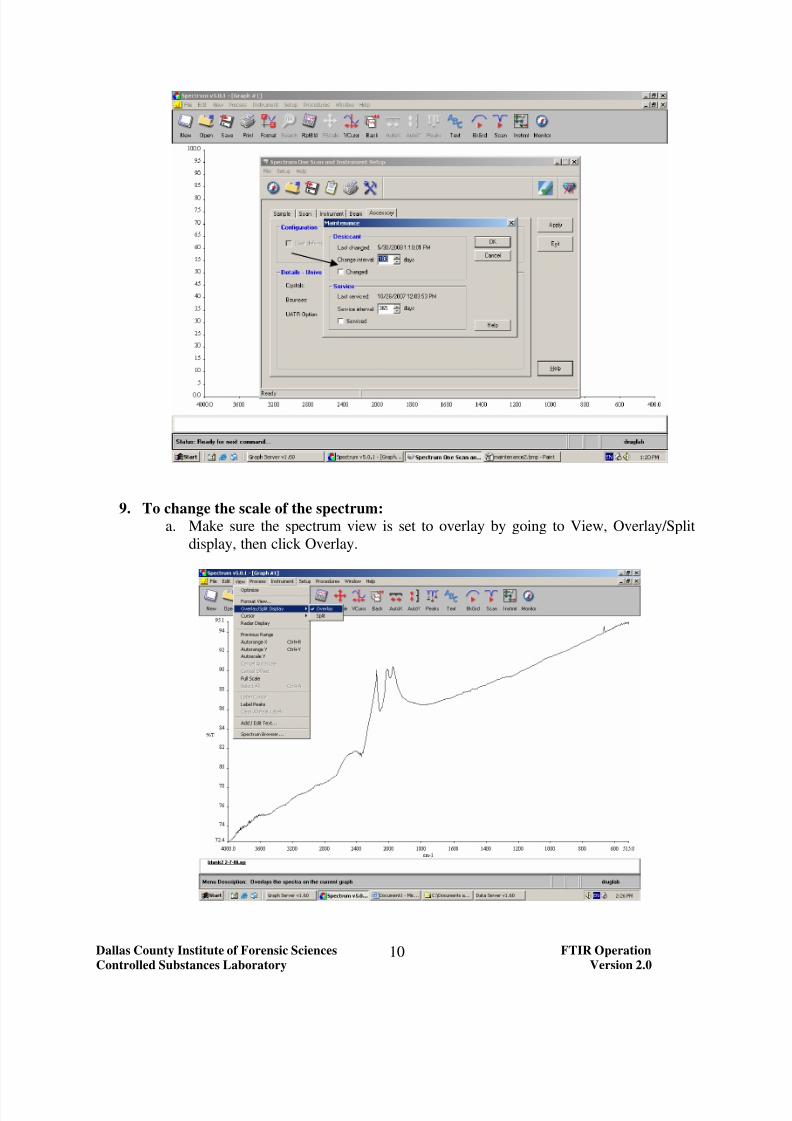
8/6/2019 SWIFS Controlled Substances Resources Documents v2.1 (02.2009) 76 pages.pdf
http://slidepdf.com/reader/full/swifs-controlled-substances-resources-documents-v21-022009-76-pagespdf 54/76
9. To change the scale of the spectrum:
a. Make sure the spectrum view is set to overlay by going to View, Overlay/Split
display, then click Overlay.
Dallas County Institute of Forensic Sciences FTIR Operation
Controlled Substances Laboratory Version 2.010

8/6/2019 SWIFS Controlled Substances Resources Documents v2.1 (02.2009) 76 pages.pdf
http://slidepdf.com/reader/full/swifs-controlled-substances-resources-documents-v21-022009-76-pagespdf 55/76
b. Then go to View and click on Format View. In the Ranges tab, change the scaleof the abscissa and/or ordinate by typing in the desired ranges. Then click OK.
10. Printing Reports Using the Drug Lab Template a. Go to Setup and click on Report Template.
Dallas County Institute of Forensic Sciences FTIR Operation
Controlled Substances Laboratory Version 2.011

8/6/2019 SWIFS Controlled Substances Resources Documents v2.1 (02.2009) 76 pages.pdf
http://slidepdf.com/reader/full/swifs-controlled-substances-resources-documents-v21-022009-76-pagespdf 56/76
b. In the Report Builder Screen, go to File and click on Open Template.
c. Open Template called Drug Lab.
d. Click on Top Graph Holder so the box turns purple.
Dallas County Institute of Forensic Sciences FTIR Operation
Controlled Substances Laboratory Version 2.012
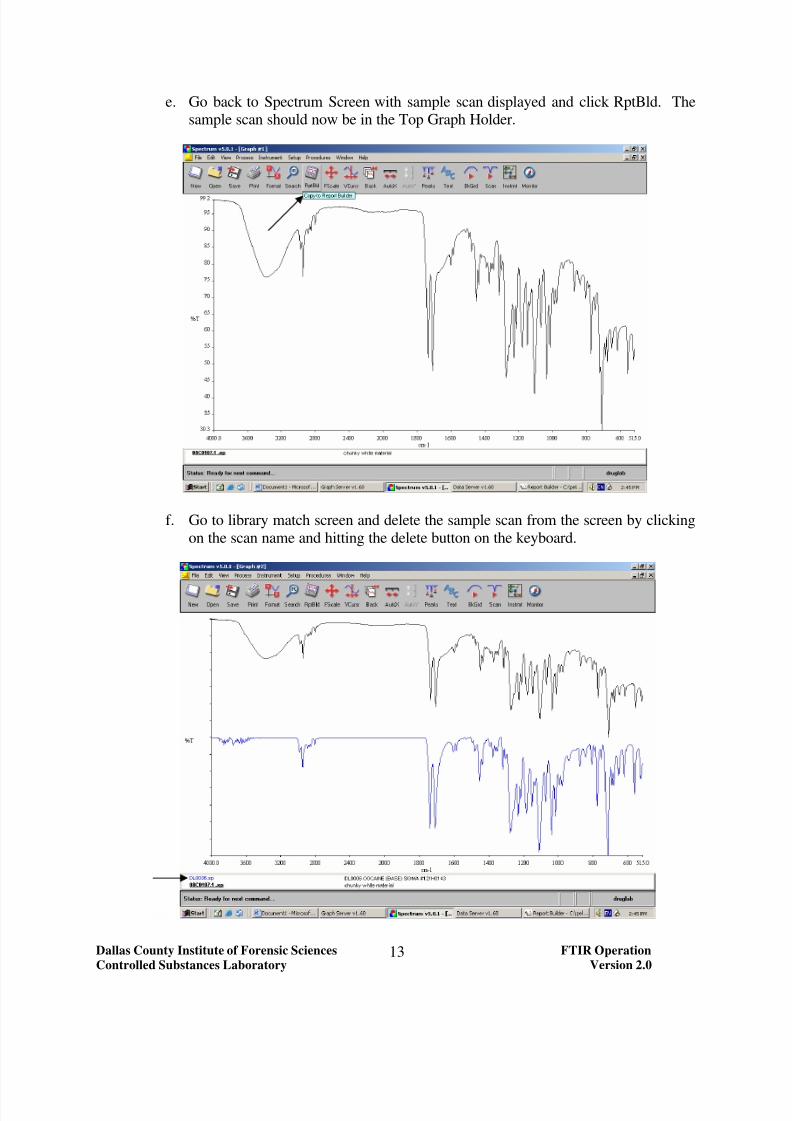
8/6/2019 SWIFS Controlled Substances Resources Documents v2.1 (02.2009) 76 pages.pdf
http://slidepdf.com/reader/full/swifs-controlled-substances-resources-documents-v21-022009-76-pagespdf 57/76
e. Go back to Spectrum Screen with sample scan displayed and click RptBld. Thesample scan should now be in the Top Graph Holder.
f. Go to library match screen and delete the sample scan from the screen by clicking
on the scan name and hitting the delete button on the keyboard.
Dallas County Institute of Forensic Sciences FTIR Operation
Controlled Substances Laboratory Version 2.013

8/6/2019 SWIFS Controlled Substances Resources Documents v2.1 (02.2009) 76 pages.pdf
http://slidepdf.com/reader/full/swifs-controlled-substances-resources-documents-v21-022009-76-pagespdf 58/76
g. On the Report Builder Screen click on the Bottom Graph Holder so the box turnspurple.
h. Go back to the Spectrum Screen with the library match displayed and click RptBld. The library match should now be in the Bottom Graph Holder.
Dallas County Institute of Forensic Sciences FTIR Operation
Controlled Substances Laboratory Version 2.014
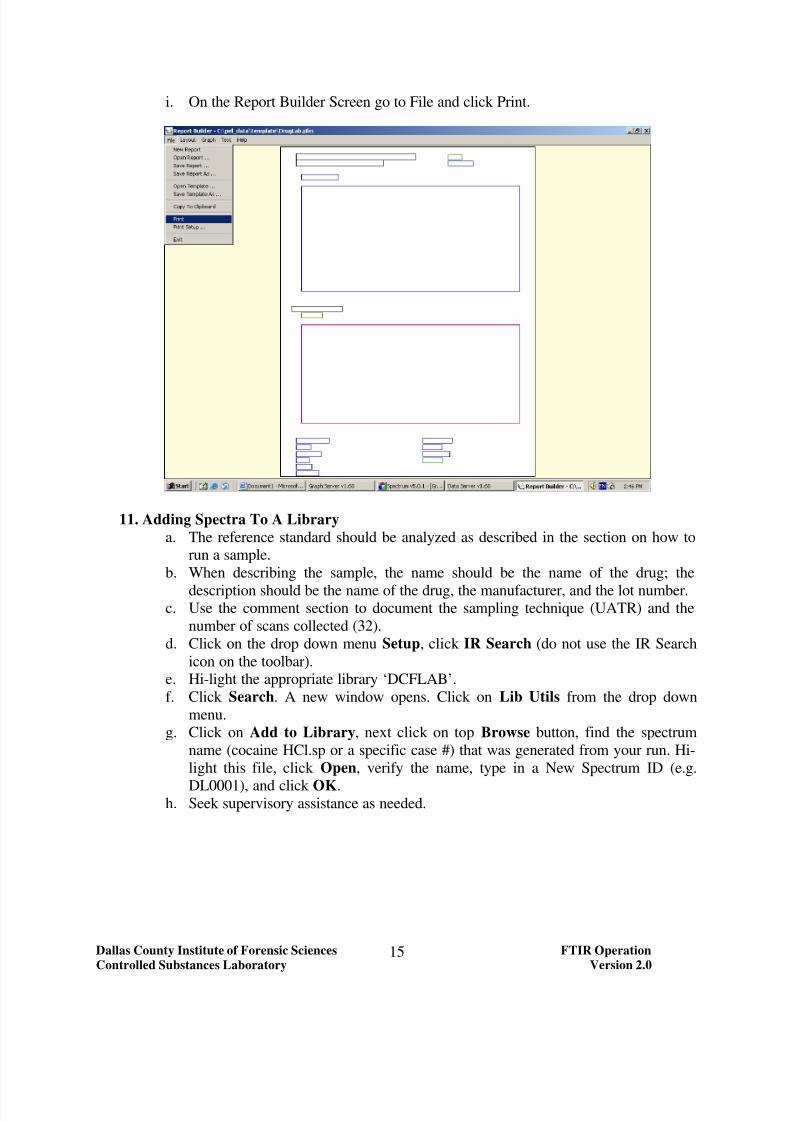
8/6/2019 SWIFS Controlled Substances Resources Documents v2.1 (02.2009) 76 pages.pdf
http://slidepdf.com/reader/full/swifs-controlled-substances-resources-documents-v21-022009-76-pagespdf 59/76
i. On the Report Builder Screen go to File and click Print.
11. Adding Spectra To A Library
a. The reference standard should be analyzed as described in the section on how torun a sample.
b. When describing the sample, the name should be the name of the drug; the
description should be the name of the drug, the manufacturer, and the lot number.c. Use the comment section to document the sampling technique (UATR) and the
number of scans collected (32).
d. Click on the drop down menu Setup, click IR Search (do not use the IR Search
icon on the toolbar).e. Hi-light the appropriate library ‘DCFLAB’.
f. Click Search. A new window opens. Click on Lib Utils from the drop down
menu.g. Click on Add to Library, next click on top Browse button, find the spectrum
name (cocaine HCl.sp or a specific case #) that was generated from your run. Hi-
light this file, click Open, verify the name, type in a New Spectrum ID (e.g.
DL0001), and click OK.h. Seek supervisory assistance as needed.
Dallas County Institute of Forensic Sciences FTIR Operation
Controlled Substances Laboratory Version 2.015

8/6/2019 SWIFS Controlled Substances Resources Documents v2.1 (02.2009) 76 pages.pdf
http://slidepdf.com/reader/full/swifs-controlled-substances-resources-documents-v21-022009-76-pagespdf 60/76
PROCEDURE: ANALYTICAL BALANCE
1) Monthly Calibration
a) At the beginning of each month, analytical balances should be calibrated and theirlinearity checked using certified weights that are located in the Drug Lab.
b)
Using the “Balance Maintenance Log – Calibration Check” logsheet, record the date,actual weight, and the difference in the last decimal place measured.c) This difference must be within +/- 3 counts in the last place measured.
d) If the difference is out of control, then the balance must be evaluated and recalibrated.
i) Ensure that the balance is level and clean.
ii) Refer to the balance manual for calibration procedure or seek supervisory assistance.e) Once the balance is recalibrated, the linearity should be checked using three certified
weights (lower, middle and upper range), and the results recorded on the “Balance
Maintenance Log - Calibration Check”. Also, include the chemist’s initials, the date, thecertified weights used, actual weight measured, and the difference between the last
decimal place measured and the target weight.
2)
Daily Calibration Check a) Each day before the balance is used, the calibration must be checked.
b) On the “Balance Maintenance Log” sheet record whether the balance is level and clean.
c) Also record the difference (in counts) between the measured secondary weight and its
target weight.d) The difference must be within +/- 3 counts in the last place measured.
e) If the difference is out of control, then the balance must be recalibrated.
i) Refer to the balance manual for the calibration procedure or seek supervisoryassistance as needed.
f) Once the balance is recalibrated, the linearity should be checked using three certifiedweights (lower, middle and upper range), and the results recorded on the “Balance
Maintenance Log – Calibration Check” logsheet. Also, include the chemist’s initials, the
date, certified weights used, actual weights measured, and the difference in the lastdecimal place measured.
3) For balances with flashing recalibration messages:
a) If the secondary weight is within +/- 3 counts after recalibration, no further action isnecessary other than recording results in “Balance Maintenance Log”.
4) For balances with automatic recalibration:
a) No additional action is needed other than daily calibration checks.
5) Seek supervisory assistance in any situation in which a balance cannot be calibrated properlyor when balance operation appears unusual.
Dallas County Institute of Forensic Sciences 1 Analytical Balance
Controlled Substances Laboratory Version 2.0

8/6/2019 SWIFS Controlled Substances Resources Documents v2.1 (02.2009) 76 pages.pdf
http://slidepdf.com/reader/full/swifs-controlled-substances-resources-documents-v21-022009-76-pagespdf 61/76
PIPET CALIBRATION
Using Pipette Tracker Software
Using the Pipette Tracker Software
A summary of operation procedures is located at the end of this procedure.
Pipette Tracker keeps information about pipettes in “device” files, which list details for each
pipette. This program also uses separate “methods”, each defining how the calibration should
be done. The method includes details on the number of expected volumes to be calibrated for
the run, the number of samples to be tested for each expected volume, and the frequency of
evaporation blanks. The method also specifies the testing criteria to be used in determining
whether the calibration “passes” or “fails”.
When a device’s interval determines that it is due for a calibration, the device will appear
automatically on the built-in WorkList. A time (reminder) has been specified for each interval,which will place the device on the WorkList before it is due to allow you to plan you your
calibrations. When calibrating, the weights will be automatically collected from the balance and
put into the computer. You simply follow the on-screen steps and the Pipette Tracker performs
all the calculations, providing instant feedback if the device “passes” or “fails” the calibration
and generates a report. This report will be kept by the laboratory Quality Manager.
Logon/Logoff
The program will ask for the user’s password each time the program is started. Each user must
“log on” by entering his or her password in the [Logon] dialog box so that the program can
record it. Once the “log on” has taken place, the program will automatically insert the user’sname into the “operator field on the Calibration Run screen. The user can log off by pulling
down the Password menu and select Logoff . Only certain components of the program will
remain active. The next user may then “log on” by pulling down the Password menu and
selecting Logon.
Run Calibration
There are three ways to get to the Run Calibration screen:
• From the WorkList, you can select a device and pull down Device menu and select Run
Calibration. The currently highlighted device and method will be loaded.
• From the Inventory List, you can select a device and pull down Device menu and select RunCalibration. The currently highlighted device and the most due method (or the closest to
being due) will be loaded.
• From the Device Setup screen, you can click on the Cal button to calibrate that particular
device. The currently edited device and the most due method (or the closest to being due)
will be loaded.
Calibration Run Screen
Dallas County Institute of Forensic Sciences 1 Pipette Calibration
Controlled Substances Laboratory Version 2.0

8/6/2019 SWIFS Controlled Substances Resources Documents v2.1 (02.2009) 76 pages.pdf
http://slidepdf.com/reader/full/swifs-controlled-substances-resources-documents-v21-022009-76-pagespdf 62/76
The top entries and the Environmental factors (Temp., Barom. P., Rel. Hum.) can be edited
before Starting a Run. Once started, you are locked out of these areas. After the last weight is
received, the Environmental factors can be revised again, if necessary. If these are changed after
the last weight is received, the program will also recalculate the calibration results and statistics.
After confirming the correct Input Mode (Balance), shown in the Balance ID field, ensure thatthe device and method are the ones you want before running the calibration. The following
describes some of the components (others found in the manual) of the Run Calibration screen:
• Temp. -- This field contains the liquid’s temperature in degrees Centigrade. This
information can be read from the meter found on the wall behind the balance. As noted
earlier, this can only be edited at the start of a Calibration Run.
• Barom. P. -- This field contains the barometric pressure in mm of mercury ( inner most scale
times 10). This information can be read from the barometer found on the wall behind the
balance. As noted earlier, this can only be edited at the start of a Calibration Run.
• Rel. Hum. -- This field contains the value for the relative humidity, with the units as %.
This information can be read from meter found on the wall behind the balance. As noted
earlier, this can only be edited at the start of a Calibration Run.• Abort Run -- Deletes all current weight, time and volume information for this run.
Environmental factors are not changed. Device selection, operator name and method are not
changed.
• Redo Sample -- This button becomes active once you have entered the Tare weight and the
first calibration sample. Clicking on it cancels the results entered for the most recent sample
only, and resets the Run Line to the previous sample so you can “re-send” the weight from
the balance. Please note the Redo Sample button does not allow you to “re-dispense” the
sample, only to correct an error in entry. If you have a problem with dispensing the sample,
consider using the Void button at the end of the Run (see details below), or abort the
calibration and start again.
• Void Sample -- This button becomes active only at the end of the Calibration Run, andbefore you click on Accept Run. If you experience problems dispensing one or more
samples, you may choose to exclude these from the calculations for the Run, rather than
abort the Run and start over. In effect, the calculations are performed with fewer sample(s).
When the Run is finished, you will be able to move the cursor up and down through the
cumulative weights shown on the Calibration Run “display grid”. Position the cursor over
the sample to be voided, then click on the Void button. The calculated Volume for this
sample will be replaced with the word “VOID”. You are able to “Unvoid” the sample by
positioning your cursor over the voided cumulative weight and clicking on the Void button
again. This reverses all effects of clicking Void.
• Accept Run -- This button only becomes active when the run is complete. Clicking on it
accepts the Calibration Run, stores the results, then inactivates the button and the report will
be automatically printed.
• Done -- Leaves the Calibration Run screen and goes back to the WorkList or Inventory List.
Dallas County Institute of Forensic Sciences 2 Pipette Calibration
Controlled Substances Laboratory Version 2.0

8/6/2019 SWIFS Controlled Substances Resources Documents v2.1 (02.2009) 76 pages.pdf
http://slidepdf.com/reader/full/swifs-controlled-substances-resources-documents-v21-022009-76-pagespdf 63/76
Run Calibration Automatically (Through the Balance)
First, ensure that the balance is calibrated properly by following the ‘QA Procedure for the
Analytical Balance’, then proceed as follows from the Run Calibration screen:
• Making sure that the correct device (pipette) and method are listed, edit the Environment
factors (Temp., Barom. P., Rel. Hum.)• Start the calibration by clicking on “Start Run” button.
• Place your container with liquid on the balance.
• Tare the balance and click on “Tare Wgt”, which sends the weight over to the Calibration
Run Table.
• Important: Tab over to “Sample Wgt”.
• Pipette a volume into the container.
• Once a stable weight has been obtained, press ‘Enter’, which sends the weight over to the
Calibration Run Table.
• Continue until all volumes have been recorded. Using “Abort”, “Void Sample” and “Redo”
as necessary.
• At the completion of the calibration , either click on “Accept Run” or “Abort Run”.
• Print a hard copy of the report, sign and file next to the balance or with the Quality Manager.
• Another device may be chosen by pulling down the device list.
• Once the calibration(s) are completed, click on “Done”.
• Log off by clicking on Password and choosing “LogOff”.
Dallas County Institute of Forensic Sciences 3 Pipette Calibration
Controlled Substances Laboratory Version 2.0

8/6/2019 SWIFS Controlled Substances Resources Documents v2.1 (02.2009) 76 pages.pdf
http://slidepdf.com/reader/full/swifs-controlled-substances-resources-documents-v21-022009-76-pagespdf 64/76
Dallas County Institute of Forensic Sciences 4 Pipette Calibration
Controlled Substances Laboratory Version 2.0
Calibration of PipettersProcedure Summary
There may be three reasons for checking calibration of a pipetter:
• Receiving a new pipetter into the laboratory. See the Quality Manager prior to calibration.
• Regularly scheduled calibration.
• Suspected error in calibration.
A condensed summary follows:
• The computer, printer and balance should be on. If not, allow the balance to warm up for
thirty minutes.
• With the 20 gram weight, check the balance calibration and record weight on the Balance
Calibration Log. See Quality Manager if balance is not in calibration.
• Log on to the computer by pulling down the Password menu and selecting Logon. If you donot have a password, see Quality Manager.
• From the WorkList, select the pipetter that is to be calibrated.
• Pull down the Device menu and select Run Calibration.
• From the meters on the wall, enter the current temperature, barometric pressure and relative
humidity.
• Begin the calibration by clicking on “Start Run” button.
• Place container with enough liquid to cover the bottom on to the balance.
• Tare the balance and click on the “Tare Wgt” button, which sends weight over to the
computer “Calibration Run Table”.
• Important: Tab over to “Sample Wgt” button.
• Pipette a volume into the container.• Once a stable weight has been obtained, press Enter, which sends the weight over to the
computer “Calibration Run Table”.
• Continue until all volumes have been recorded. Using “AbortRun”, “VoidSample” and
“Redo” as necessary.
• At the completion of the calibration, either click on “Accept Run” or “Abort Run”.
• Print a hard copy of the report, sign and file next to the balance or with the Quality Manager.
• Another pipetter may be chosen by pulling down the device list.
• Once the calibration(s) are completed, Click on the “Done” button.
• Log off the computer by pulling do down the Password menu and selecting Logoff .
• If pipetter performance is acceptable, the printed report is filed next to the balance or givento Quality Manager.
• If pipetter performance is not acceptable, immediately remove from service and notify
Quality Manager.

8/6/2019 SWIFS Controlled Substances Resources Documents v2.1 (02.2009) 76 pages.pdf
http://slidepdf.com/reader/full/swifs-controlled-substances-resources-documents-v21-022009-76-pagespdf 65/76
DISPENSETTE CHECK
1) At the beginning of each week, solution dispensettes will be checked for volume accuracy.
Materials needed for this check include volumetric flasks and the dispensette containing the
solution to be dispensed. Dispense the solution into the flask and note the volume in theflask. The bottom of the meniscus should be at the line of the volumetric flask.
Solution Dispensette Vol. Volumetric Flask
MeCl2 w/IS 10 ml 10 mlBuCl w/IS 5 ml 5 ml
EtOH w/IS 2 ml 2 ml
2) Using the Weekly Dispensette Volume Check log sheet, record the date, the initials of the
chemist performing the check, the solution and volume dispensed, and the size volumetric
flask used. Document whether or not the volume dispensed equales the volume of the flask.
a. If the volume dispensed meets the volume of the flask, the dispensette may be used.b. If the volume dispensed does not meet the volume of the flask, advise a supervisor
and remove the dispensette from service or inspect, clean, or adjust it as needed.
i. The procedure for readjusting the dispensette can be found in the Calibrationsection of the Dispensette Operating Manual.
ii. If adjustments are required, document these in the Comments section of the
Weekly Dispensette Volume Check log.3) If dispensing the solution from the dispensette becomes difficult, the dispensette may require
cleaning.
a. Follow the cleaning procedure found in the Dispensette Operating Manual.
4) If an air bubble forms in the dispensette filling valve, unscrew the dispensette from the bottle,
remove the filling tube and insert a glass pipette to remove any liquid around the valve. If this does not remove the air bubble, the dispensette may need a more thorough cleaning.
5) Do not interchange dispensettes between different solutions.a. If it is necessary to change the type of solution in the dispensette, clean the
dispensette thoroughly and document any changes on the logsheet.
Dallas County Institute of Forensic Sciences 1 Dispensette Check
Controlled Substances Laboratory Version 2.0
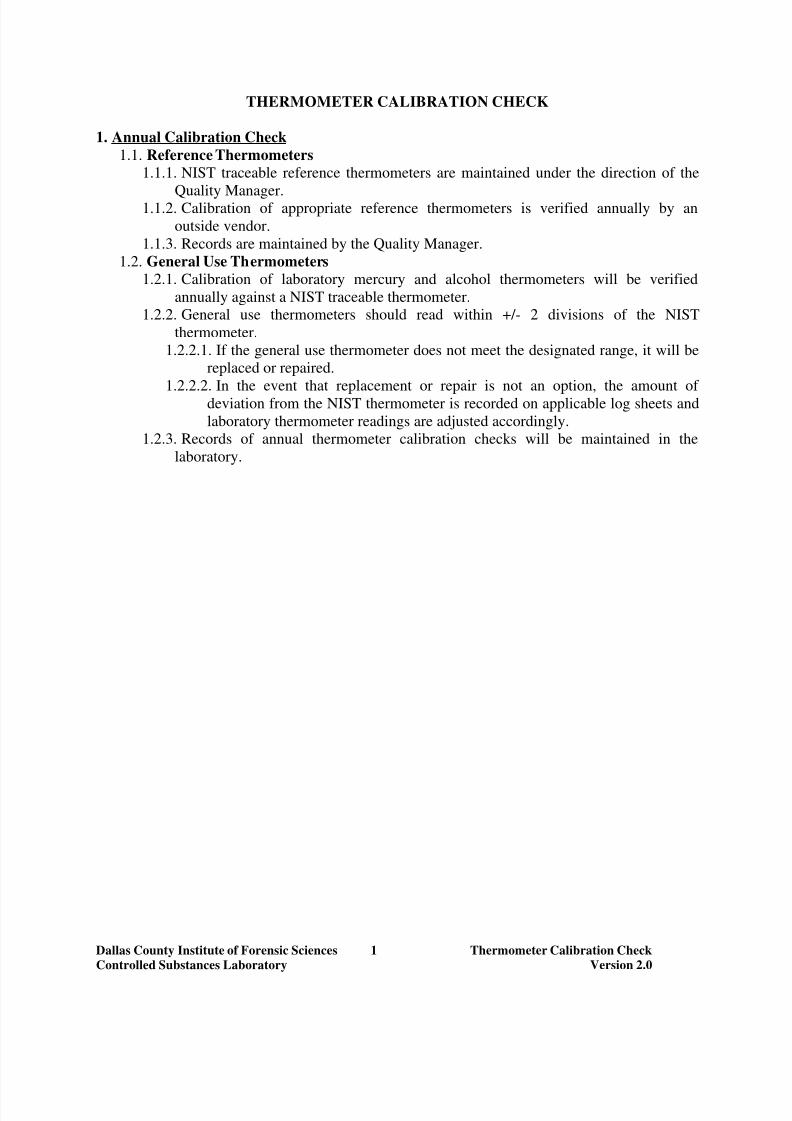
8/6/2019 SWIFS Controlled Substances Resources Documents v2.1 (02.2009) 76 pages.pdf
http://slidepdf.com/reader/full/swifs-controlled-substances-resources-documents-v21-022009-76-pagespdf 66/76
THERMOMETER CALIBRATION CHECK
1. Annual Calibration Check
1.1. Reference Thermometers
1.1.1. NIST traceable reference thermometers are maintained under the direction of the
Quality Manager.1.1.2. Calibration of appropriate reference thermometers is verified annually by an
outside vendor.
1.1.3. Records are maintained by the Quality Manager.
1.2. General Use Thermometers
1.2.1. Calibration of laboratory mercury and alcohol thermometers will be verified
annually against a NIST traceable thermometer.
1.2.2. General use thermometers should read within +/- 2 divisions of the NIST
thermometer.
1.2.2.1. If the general use thermometer does not meet the designated range, it will be
replaced or repaired.
1.2.2.2. In the event that replacement or repair is not an option, the amount of deviation from the NIST thermometer is recorded on applicable log sheets and
laboratory thermometer readings are adjusted accordingly.
1.2.3. Records of annual thermometer calibration checks will be maintained in the
laboratory.
Dallas County Institute of Forensic Sciences 1 Thermometer Calibration Check
Controlled Substances Laboratory Version 2.0

8/6/2019 SWIFS Controlled Substances Resources Documents v2.1 (02.2009) 76 pages.pdf
http://slidepdf.com/reader/full/swifs-controlled-substances-resources-documents-v21-022009-76-pagespdf 67/76
DRUG CASE REVIEW GUIDANCE
1. Administrative and technical review will be performed by the analyst and the reviewer prior
to release of a case report.1.1. The primary responsibility for ensuring the technical and administrative correctness and
completeness of the case file lies with the analyst of record.1.2. Case review by someone other than the analyst of record does not shift the responsibilityfor the scientific findings from the analyst to the reviewer.
2. The purpose of case review is
2.1. To ensure that the conclusions of the analyst are reasonable and within the constraints of
scientific knowledge2.2. To ensure that the conclusions detailed in the final report accurately and fairly represent
the content in the case file
2.3. To ensure that a the case file contains adequate information so that another competentanalyst can independently evaluate and interpret the data
2.4. To ensure that proper laboratory procedures were followed
2.5. To ensure that the report is editorially correct and free from typographical errors3. Types of review
3.1. Administrative review
3.1.1. A procedure to check for consistency with laboratory policy and for editorial
correctness.3.2. Technical review
3.2.1. Review of notes, data, and other documents which form the basis for a scientific
conclusion.4. Technical and administrative review require an extensive and careful review of the case file
and final report including but not limited to the following4.1. Does each page of the case file have a case number and analyst signature or initials?
4.2. Are all entries in the case file clear and legible?
4.3. Are corrections handled properly (single strike through with initial)? There should be nowrite-overs.
4.4. Transmittal sheet and chemist report
4.4.1. Are the following items consistent on the final report4.4.1.1.Case name
4.4.1.2.IFS case number
4.4.1.3.Agency number: service number, tag number, etc.
4.4.1.4.Agency name4.4.1.5.Date received
4.4.1.6.Received by
4.4.1.7.Delivered by4.4.1.8.Item received (transmittal sheet)/evidence submitted (final report)
4.4.2. Is all suspected drug evidence which is listed as an exhibit on the transmittal sheet
accounted for on the final report?4.4.3. Are heavy non-drug items which are listed on the transmittal sheet accounted for
on the final report?
4.4.4. Is the internal evidence transfer complete from Evidence Registration to theanalyst?
Dallas County Institute of Forensic Sciences 1 Drug Case Review Guidance
Controlled Substances Laboratory Version 2.0

8/6/2019 SWIFS Controlled Substances Resources Documents v2.1 (02.2009) 76 pages.pdf
http://slidepdf.com/reader/full/swifs-controlled-substances-resources-documents-v21-022009-76-pagespdf 68/76
8/6/2019 SWIFS Controlled Substances Resources Documents v2.1 (02.2009) 76 pages.pdf
http://slidepdf.com/reader/full/swifs-controlled-substances-resources-documents-v21-022009-76-pagespdf 69/76
METHOD VALIDATION GUIDANCE
Validation and verification of new testing methods is summarized in the Quality Manual. The
Supervisor and/or Section Chief will design a specific testing protocol to validate the accuracy of a new method or to verify the accuracy of a method transferred from one instrument to another.
I. Transfer of a Method to New Instrumentation
First, proper calibration and operation of new instrumentation is verified and documented
using the applicable instrument calibration process. Secondly, analytical results are
compared between the new and old instrumentation.
Where possible, side by side operation of old and new instrumentation is compared using
the same samples or extracts. Standards, internal standards, and quality control samplesshould meet their respective criteria described in the analytical procedure. Test
specimens should also be run and should meet acceptability criteria established for
quality control samples or similar proficiency test results. Replicate analytical runsshould be made on a single day and also compared between multiple days; criteria should
meet those established for standards, internal standards, and quality controls; test
specimens should meet acceptability criteria established for quality control samples or
similar proficiency test results. As applicable, analysts are trained in operation of newinstrumentation.
II. Development of a New Analytical Method
A supervisor outlines proposed steps for a new analytical method based upon literature,other established procedures, or knowledge and experience of the materials to be
analyzed. The target sensitivity and linear range is established based upon expected
sample conditions and instrument performance. Standard curves are run to assess theapplicability of the proposed analytical technique in comparison to the targeted analytical
needs.
Once it is determined that sensitivity and range are appropriate, the method is evaluated
for interference from expected matrices or co-occurring substances. The assay is
evaluated for stability by repeating analysis of single prepared samples and duplicate
preparation of samples both within day and between day. Variability of standards,internal standards, quality control samples, and specimens are evaluated with respect to
literature values and/or similar established procedures. Criteria for acceptable standard
curves, internal standards, and/or quality control samples are established. A formalprocedure is written, applicable analysts are trained, and results are reviewed for stability
within analyst. Method results may also be evaluated against external standards or
specimen results from reference laboratories; criteria for acceptability will be similar tothat established for quality control samples.
Dallas County Institute of Forensic Sciences Method Validation Guidance
Controlled Substances Laboratory 1 Version 2.0

8/6/2019 SWIFS Controlled Substances Resources Documents v2.1 (02.2009) 76 pages.pdf
http://slidepdf.com/reader/full/swifs-controlled-substances-resources-documents-v21-022009-76-pagespdf 70/76
WORKSHEET OF POSSIBLE VALIDATION STEPS
Submitting Unit:
Validation Title:
Prepared by/Date:
1. Type of validation (check applicable box):
Equipment
Modification of an existing protocol
New protocolOther:
2. Is this an original or revised validation plan?
Original
Revised3. Describe the purpose or goal of the validation including the model and serial number of
any new equipment:
4. Attach a copy of the written procedure: current (if applicable) and new.
5. The method is
QuantitativeSemi-quantitative
Qualitative
6. Attach a validation plan with proposed timetable and list staff participating in thevalidation. The plan should lay out a course of action to assess the following, as
applicable, which will be included in the final validation report:a. Method validation is the process of testing an analytical method, technique, or
instrument to determine its suitability for meeting its intended purpose and to
document its reliability under expected conditions of use. Generally the validation
process is expected toi. Evaluate whether a new testing method meets identified analytical needs
and current scientific practices;
ii. Compare the new test method’s performance with existing laboratory
methodology;iii. Describe the conditions under which a testing method will produce valid
results;
iv. Predict possible sources of error;v. Determine limitations of a testing method; and
vi. Establish baseline characteristics of the testing method (linearity,
accuracy, etc.) which serve as benchmarks to evaluate future method
Dallas County Institute of Forensic Sciences Method Validation Guidance
Controlled Substances Laboratory 2 Version 2.0
8/6/2019 SWIFS Controlled Substances Resources Documents v2.1 (02.2009) 76 pages.pdf
http://slidepdf.com/reader/full/swifs-controlled-substances-resources-documents-v21-022009-76-pagespdf 71/76
Method Validation Variables:
1. Evaluate whether a new testing method meets identified analytical needs and current
scientific practices.
2. Compare the new test method’s performance with existing laboratory methodology.
3. Describe the conditions under which a testing method will produce valid results.
4. Predict possible sources of error.
5. Determine limitations of a testing method.
6. Establish baseline characteristics of the testing method which will serve as benchmarks to
evaluate future method performance. These characteristics may include:
a. linearity/linear range:
b. accuracy/precision: Accuracy is the ability to quantitate the true value of a control,
standard, or sample. Precision is the closeness of agreement between many quantitations.
Both accuracy and precision will be calculated using known controls and/or standards atseveral concentrations. The relative standard deviation and/or coefficient of variation
will be used to determine precision and accuracy.
c. specificity/selectivity: The selectivity of a method is the extent to which the method
can determine a particular analyte of interest accurately in the presence of othercomponents that may be expected to be present in the sample matrix. This parameter will
be evaluated using actual samples and comparing the results to known methodologies.
d. ruggedness/robustness: Ruggedness is the degree of reproducibility of the results
obtained under a variety of conditions. These would include different analysts, reagents,extraction days, etc. These parameters are similar to precision and accuracy and will be
evaluated using the results obtained from repeat analysis from several analysts.
Robustness is the capacity of a method to remain unaffected by small deliberatevariations in the method parameters. These changes/variations will be selected based on
possible deviations from the analytical procedure such as extraction time, dry down time,
solvent volume, changes in LC buffers, etc.
e. repeatability/reproducibility: Repeatability is the ability of the method to accurately
repeat a quantitation or identification under the same conditions (same analyst, same day,
same instrument, same reagents, etc.). Reproducibility is the ability of the method toaccurately repeat a quantitation or identification under different conditions (different
analyst, different day, different instrument, different reagents, etc.). Each will beevaluated and reported as a relative standard deviation and/or coefficient of variation.
Dallas County Institute of Forensic Sciences Method Validation Guidance
Controlled Substances Laboratory 3 Version 2.0

8/6/2019 SWIFS Controlled Substances Resources Documents v2.1 (02.2009) 76 pages.pdf
http://slidepdf.com/reader/full/swifs-controlled-substances-resources-documents-v21-022009-76-pagespdf 72/76
Dallas County Institute of Forensic Sciences Method Validation Guidance
Controlled Substances Laboratory 4 Version 2.0
f. recovery efficiency: The recovery efficiency of a method is calculated by comparing
the detector response to a known amount of analyte added to the sample matrix to that of
a pure standard of the same quantity (concentration). This parameter will be evaluatedfor both compounds and expressed as a percentage recovery.
g. limit of detection/quantitation: The limit of detection is the lowest concentration of ananalyte in a sample that can be detected, though not necessarily quantitated. The limit of
quantitation is the lowest concentration of an analyte that can be determined with
acceptable precision and accuracy or is the amount equal to the lowest point on the
calibration curve that can be determined with acceptable precision and accuracy.
h. carryover: Carryover will be evaluated using high control samples followed by blank
analysis. The high control samples will begin at the high calibration curve point andmove upward through concentrations that would far exceed those expected in casework.
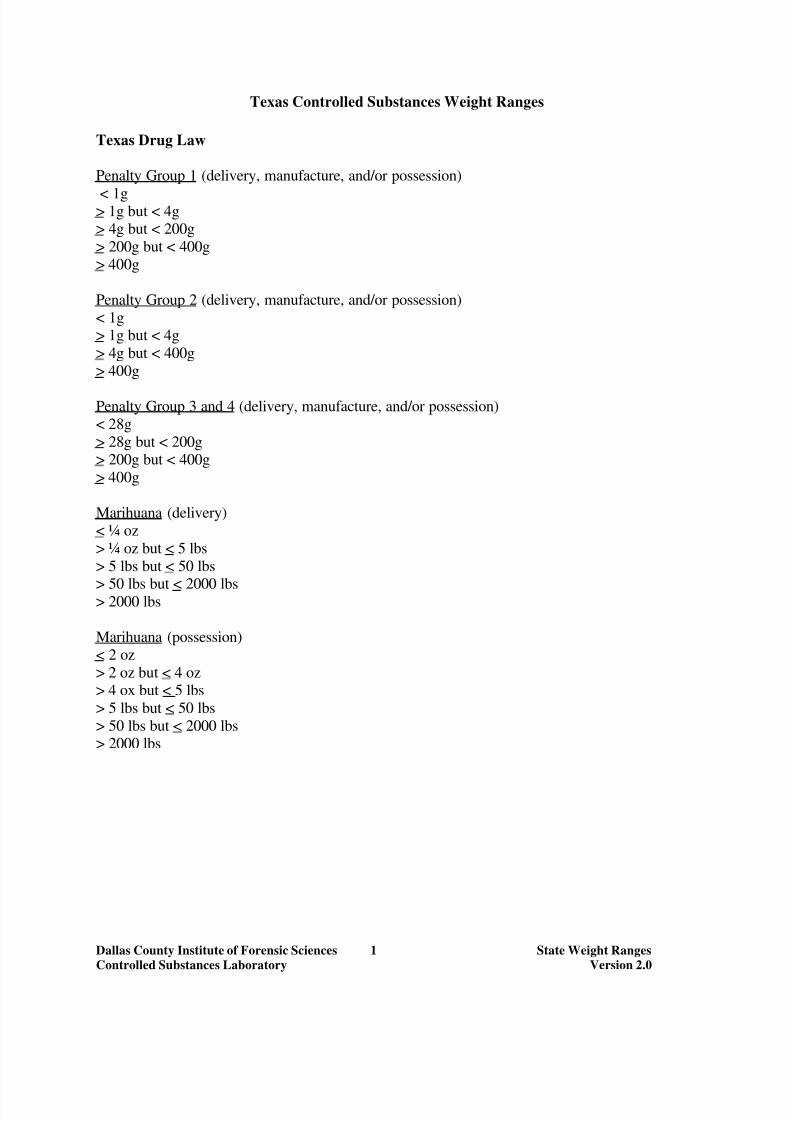
8/6/2019 SWIFS Controlled Substances Resources Documents v2.1 (02.2009) 76 pages.pdf
http://slidepdf.com/reader/full/swifs-controlled-substances-resources-documents-v21-022009-76-pagespdf 73/76
Texas Controlled Substances Weight Ranges
Texas Drug Law
Penalty Group 1 (delivery, manufacture, and/or possession)
< 1g> 1g but < 4g> 4g but < 200g
> 200g but < 400g
> 400g
Penalty Group 2 (delivery, manufacture, and/or possession)
< 1g> 1g but < 4g
> 4g but < 400g
> 400g
Penalty Group 3 and 4 (delivery, manufacture, and/or possession)
< 28g
> 28g but < 200g> 200g but < 400g
> 400g
Marihuana (delivery)
< ¼ oz
> ¼ oz but < 5 lbs
> 5 lbs but < 50 lbs
> 50 lbs but < 2000 lbs> 2000 lbs
Marihuana (possession)
< 2 oz
> 2 oz but < 4 oz> 4 ox but < 5 lbs
> 5 lbs but < 50 lbs
> 50 lbs but < 2000 lbs> 2000 lbs
Dallas County Institute of Forensic Sciences 1 State Weight Ranges
Controlled Substances Laboratory Version 2.0

8/6/2019 SWIFS Controlled Substances Resources Documents v2.1 (02.2009) 76 pages.pdf
http://slidepdf.com/reader/full/swifs-controlled-substances-resources-documents-v21-022009-76-pagespdf 74/76
Federal Controlled Substances Weight Ranges
Marihuana Heroin
< 250 g <5g> 250 g but <1 kg >5 g but < 10 g
> 1 kg but <2.5 kg >10 g but < 20 g> 2.5 kg but <5 kg >20 g but < 40 g> 5 kg but <10 kg >40 g but < 60 g
> 10 kg but <20 kg >60 g but < 80 g
> 20 kg but <40 kg >80 g but < 100 g
> 40 kg but <60 kg >100 g but < 400 g> 60 kg but <80 kg >400 g but < 700 g
> 80 kg but <100 kg >700 g but < 1 kg
> 100 kg but <400 kg >1 kg but < 3 kg> 400 kg but <700 kg >3 kg but < 10 kg
> 700 kg but <1000 kg >10 kg but < 30 kg
> 1000 kg but <3000 kg > 30 kg> 3000 kg but <10,000 kg
> 10,000 kg but <30,000 kg
> 30,000 kg
Cocaine Cocaine base
< 25 g < 250 mg
> 25 g but <50 g > 250 mg but <500 mg
> 50 g but <100 g > 500 mg but <1 g> 100 g but <200 g > 1 g but <2 g
> 200 g but <300 g > 2 g but <3 g
> 300 g but <400 g > 3 g but <4 g> 400 g but <500 g > 4 g but <5 g
> 500 g but <2 kg > 5 g but <20 g
> 2 kg but <3.5 kg > 20 g but <35 g
> 3.5 kg but < 5 kg > 35 g but <50 g> 5 kg but <15 kg > 50 g but <150 g
> 15 kg but <50 kg > 150 g but <500 g
> 50 kg but <150 kg > 500 g but <1.5 kg> 150 kg > 1.5 kg

8/6/2019 SWIFS Controlled Substances Resources Documents v2.1 (02.2009) 76 pages.pdf
http://slidepdf.com/reader/full/swifs-controlled-substances-resources-documents-v21-022009-76-pagespdf 75/76
Methamphetamine Ice
< 2.5 g <250 mg
> 2.5 g but <5 g >250 mg but < 500 mg
> 5 g but <10 g >500 mg but < 1 g> 10 g but <20 g >1 g but < 2 g
> 20 g but <30 g >2 g but < 3 g> 30 g but <40 g >3 g but < 4 g> 40 g but <50g >4 g but < 5 g
> 50 g but <200 g >5 g but < 20 g
> 200 g but <350 g >20 g but < 35 g
> 350 g but <500 g >35 g but < 50 g> 500 g but <1.5 kg >50 g but < 150 g
> 1.5 kg but <5 kg >150 g but < 500 g
> 5 kg but <15 kg >500 g but < 1.5 kg> 15 kg > 1.5 kg
PCP
< 5 g
> 5 g but <10 g
> 10 g but <20 g> 20 g but <40 g
> 40 g but <60 g> 60 g but <80 g
> 80 g but <100 g
> 100 g but <400 g> 400 g but <700 g
> 700 g but < 1 kg
> 1 kg but <3 kg> 3 kg but <10 kg
> 10 kg but <30 kg
> 30 kg

8/6/2019 SWIFS Controlled Substances Resources Documents v2.1 (02.2009) 76 pages.pdf
http://slidepdf.com/reader/full/swifs-controlled-substances-resources-documents-v21-022009-76-pagespdf 76/76
Drug Evidence Disposal Facility Information
Sharps Environmental Services, Inc.P.O. Box 245
900 Lasalle Parkway
Carthage, TX 75633
903-693-2525903-693-3709 fax
Contact: Judy Lawhorn
Call two weeks prior to arrange disposal date and time. Certified peace officer or DEA licenses
must accompany IFS staff.


