
Track Click to change
Race Date Click to change
TimeformUS Power Picks
Based on recent performance and Morning
Line Odds
Track Diagram & Race Condi9ons
Click arrow to expand
Program Number
Horse Name Click to see
Past Performances
TimeformUS Checkmarks Based on recent
performance and Morning Line Odds
Spotlight Speed Figure
Each horse’s most relevant, recent Speed
Figure. Color-‐coded for surface:
Dirt | Turf | Synth
Expand for more
Pace Projector -‐ displays the posi9on we project the horses to be in at the opening quarter-‐mile of a sprint, or the opening half-‐mile of a route. Updates aKer scratches announced.
If an “excep9onal” pace scenario is expected it will be noted here
Morning Line Odds
Tab 1 – The Preview Page
Race Click to change

Take and save notes, view your old
notes
Running Lines
See next page for details
Horse Record Click on Record for Detailed Career
Record
Print & Single Scroll version
Running Lines See Next Page
My Picks Tool Lets you classify horses while you handicap: helping you construct bets
Recent Workouts Click arrow to expand for
LifeJme Workouts
Key Ra9ngs Box with Trainer Ra9ngs Displays TimeformUS Trainer RaJngs (on a 0-‐100 scale) for a variety of condiJons. Also shows raw stats for the past year and if the trainer or jockey is “hot” or “cold” recently
Equipment, Medica9on & Weight
Race Condi9ons Click to Expand
Tab 2 – The Past Performances
Pace Projector Pop-‐Out
Race Informa9on Click for more
informaJon on each horse
More Ra9ngs Click for more specific
trainer raJngs
Pedigree Ra9ng Specific to Surface
and Distance
Breeding
Informa9on With Sire’s Current
Stud Fee
Running Style & Early/Late Ra9ngs
Live Odds & Minutes to Post
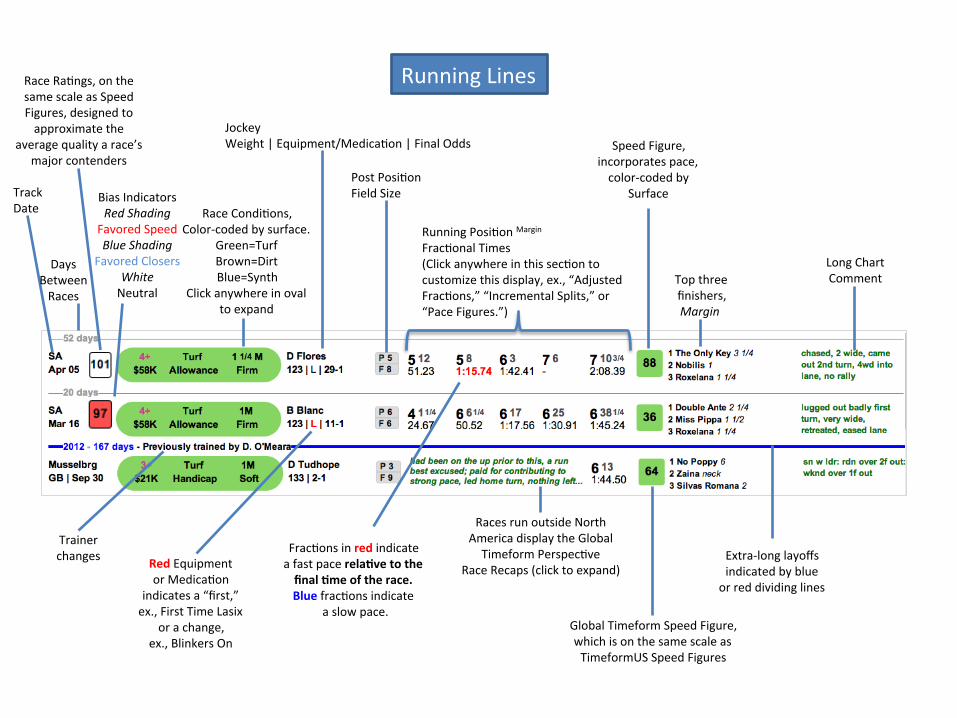
Track Date
Days Between Races
Race Ra9ngs, on the same scale as Speed Figures, designed to approximate the
average quality a race’s major contenders
Race Condi9ons, Color-‐coded by surface.
Green=Turf Brown=Dirt Blue=Synth
Click anywhere in oval to expand
Jockey Weight | Equipment/Medica9on | Final Odds
Post Posi9on Field Size
Running Posi9on Margin Frac9onal Times (Click anywhere in this sec9on to customize this display, ex., “Adjusted Frac9ons,” “Incremental Splits,” or “Pace Figures.”)
Speed Figure, incorporates pace, color-‐coded by
Surface
Top three finishers, Margin
Extra-‐long layoffs indicated by blue or red dividing lines
Long Chart Comment
Races run outside North America display the Global Timeform Perspec9ve
Race Recaps (click to expand)
Trainer changes Frac9ons in red indicate
a fast pace rela&ve to the final &me of the race. Blue frac9ons indicate
a slow pace.
Red Equipment or Medica9on
indicates a “first,” ex., First Time Lasix
or a change, ex., Blinkers On
Global Timeform Speed Figure, which is on the same scale as TimeformUS Speed Figures
Running Lines
Bias Indicators Red Shading Favored Speed Blue Shading
Favored Closers White Neutral

![Finale 2005 - [CAVALGADA] · PDF fileroberto carlos arr. manoel ferreira & & & & & & & & & & & & & &?????](https://cdn.vdocuments.net/doc/165x107/5a72754e7f8b9a9d538d9075/finale-2005-cavalgadawww2secultcegovbrrecursospublicwebbancopdf.jpg)


