Didacticiel - Etudes de cas R.R.
03/03/2006 Page 1 sur 15
Subject
One of the main advantages of decision trees is the possibility, for the users, to interactively
build the prediction model. In this tutorial, we show how, using SIPINA1 and ORANGE, we
build and manually modify a decision tree; especially we select the split attribute and
pruning the tree.
SIPINA is one of my old projects. It was very useful but it had some limitations, which have
been rectified in TANAGRA: it was intended only for supervised learning; we cannot define
and save the sequences of treatments in a diagram. Nevertheless, I use still this version for
my courses, in particular for its functionalities in the interactive construction of decision
trees.
SIPINA uses a graphical representation of the tree; ORANGE uses a standard treeview
components. We will see that they propose very similar functionalities and provide the same
results.
Dataset
We use the IRIS_TREE.TXT dataset (UCI IRVINE). There are 150 examples, 4 descriptors; the
class attribute has 3 values.
We use 75 examples for the learning set, 75 examples for the test set. A new column specifies
the membership of each example.
1 http://eric.univ-lyon2.fr/~ricco/sipina.html, research version

Didacticiel - Etudes de cas R.R.
03/03/2006 Page 2 sur 15
Decision Tree exploration with SIPINA
It is not necessary to define a diagram with SIPINA. We must simply click on several menus
by respecting an order that we point out here.
SIPINA
When we start SIPINA, we obtain the following main window with several panels: the data
grid, the selected attributes, the selected learning method, the learning and test set
subdivision.
Data importation
SIPINA can handle various file formats. We use the text file format in this tutorial2 (TAB
separator). We click on the FILE / OPEN menu, a dialog box appears; we choose the right
file format (TXT).
In the next box, we must select the following information: (1) column separator is TAB; (2)
the first row of the dataset contains the name of attributes.
2 Decimal separator is « . »

Didacticiel - Etudes de cas R.R.
03/03/2006 Page 3 sur 15
The dataset is downloaded and showed in the main data grid. The type of each attribute is
defined by the first value of each column (the second row in the file). If this value is numeric,
the type of the attribute will be continuous; if it is alphabetic, the type will be discrete.
Selecting the train and the test set
In order to define the learning set, we click on the ANALYSIS / SELECT ACTIVE
EXAMPLES menu, we select the RULE SELECTION option.
We have to build the rule that allows defining the learning set: (1) we select the STATUS
attribute; (2) we select the rule proposition; (3) we select the value of STATUS. We confirm
with the VALIDATE button (!). We can count the covered examples (COUNT EXAMPLES

Didacticiel - Etudes de cas R.R.
03/03/2006 Page 4 sur 15
COVERED contextual menu), we have select 75 observations, and the remaining belongs to
the test set.
Selecting target and input attributes
We click on ANALYSIS / DEFINE CLASS ATTRIBUTE. We use “drag an drop” in order to
select the TARGET (class attribute) and the INPUT attributes. Of course, we do not use the
STATUS attribute.

Didacticiel - Etudes de cas R.R.
03/03/2006 Page 5 sur 15
Selecting the learning method
We click on the INDUCTION METHOD / STANDARD ALGORITHM menu. A dialog box
appears. We set the C4.5 algorithm [A – Induction Graph tab]; we can modify the default
parameters of the method [B].
We obtain on the left of the main window a summary of our parameters.
Automatic analysis
In order to build the decision tree with the C4.5 algorithm, we click on the ANALYSIS /
LEARNING menu.
Didacticiel - Etudes de cas R.R.
03/03/2006 Page 6 sur 15
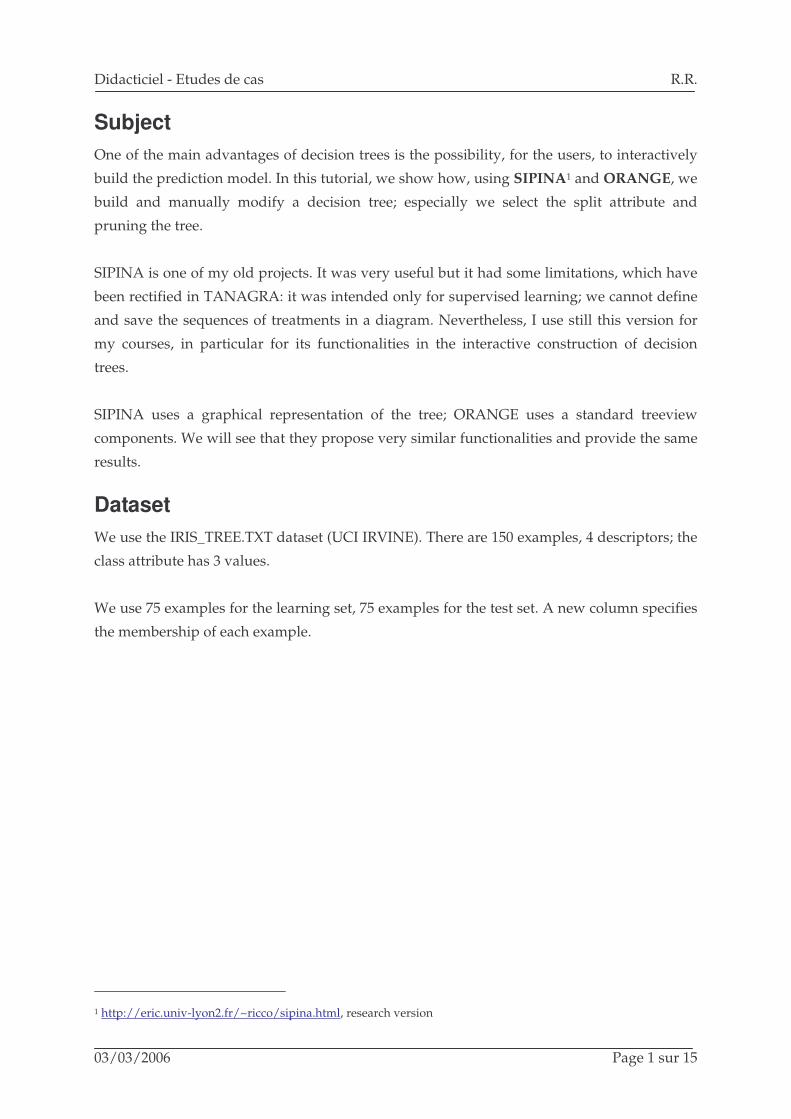
The tree is very simple, 3 rules enable to determine the type of IRIS from its characteristics, it
seems that only variable PET_LENGTH is really relevant.
To evaluate the accuracy of this tree on the test set, we click on the ANALYSIS / TEST menu
and select the INACTIVE EXAMPLES OF DATABASE option. The confusion matrix is
computed; the test error rate is 5.33%.
Interactive analysis
Only the PET_LENGTH seems relevant. One can wonder what would be the relevance of the
other variables that could take part in the construction of the tree. We want to interactively

Didacticiel - Etudes de cas R.R.
03/03/2006 Page 7 sur 15
build the tree and studying the relevance of each candidate attributes when we want to split
a node.
We display the tree by clicking the WINDOW / DECISION GRAPH menu. Initially, we must
prune the tree starting from its root. The operation is simple: we select the first node; with
the contextual menu we click on CUT.
In the next step, we display the segmentations candidates by clicking on SPLIT NODE in the
contextual menu. A new window appears with all possible splits on the selected node.
We see that PET_WIDTH and PET_LENGTH have the same “goodness of split” (Gain ratio)
and the same correlation (Tschuprow’s t). In the last column, we observe if the split is
accepted (green) or not (red).
So, in this dataset, SIPINA selects the PET_LENGTH attribute to splitting the first node, but
the PET_WIDTH has the same relevance.

Didacticiel - Etudes de cas R.R.
03/03/2006 Page 8 sur 15
When we select the PET_WIDTH attribute, we see the cut point used (0.8) if we split the
node with this attribute.
In order to split the node with PET_WIDTH, we double-click the GOODNESS OF SPLIT
value in the grid.
If we split the next node with PET_LENGTH, we obtain the following tree.
We can compute again the accuracy of this tree on the test set (ANALYSIS / TEST).

Didacticiel - Etudes de cas R.R.
03/03/2006 Page 9 sur 15
INTERACTIVE TREE BUILDER of ORANGE
When we start ORANGE, we have the following interface.
Tool palettesComponents :Data Mining tools
<< Workspace
Data importation
We use the same dataset (IRIS_TREE.TXT). We set the DATA component in the workspace

Didacticiel - Etudes de cas R.R.
03/03/2006 Page 10 sur 15
Selecting the train set
We want to subdivide the dataset into train and test set. We use the SELECT DATA
component (DATA tab). The utilization of this component is similar to SIPINA.
Interactive analysis
The train set is now selected (75 examples). We set the INTERACTIVE TREE BUILDER
component (CLASSIFY tab) in the diagram. We must specify the nature of the connection
when we connect SELECT DATA to this new component.

Didacticiel - Etudes de cas R.R.
03/03/2006 Page 11 sur 15
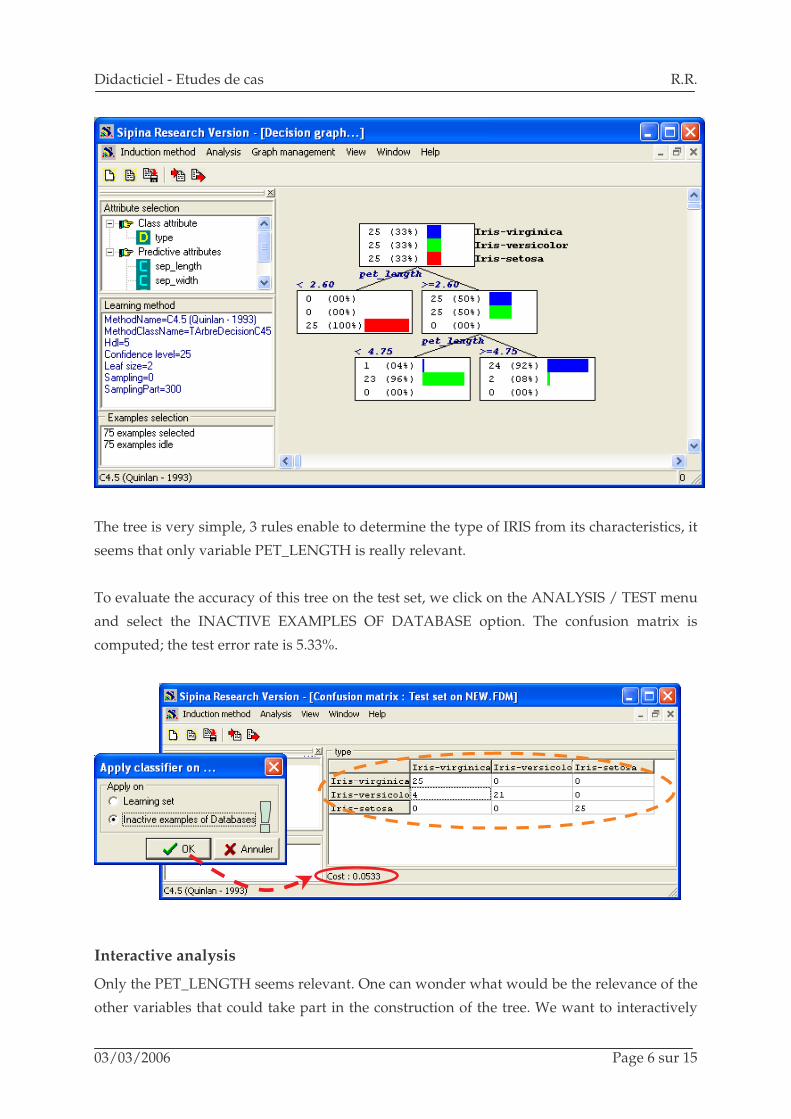
We click on the OPEN menu. The interactive tree builder tool appears.
We can now interactively build the tree. The CUT option enables to prune a node; the SPLIT
option enables to split a node. Let us note that we can modify the cut point in ORANGE. By
default, it proposes the average of the attribute as the cut point.
In our case, we reproduce the tree that was built with SIPINA; we thus obtain the following
result.
Didacticiel - Etudes de cas R.R.
03/03/2006 Page 12 sur 15
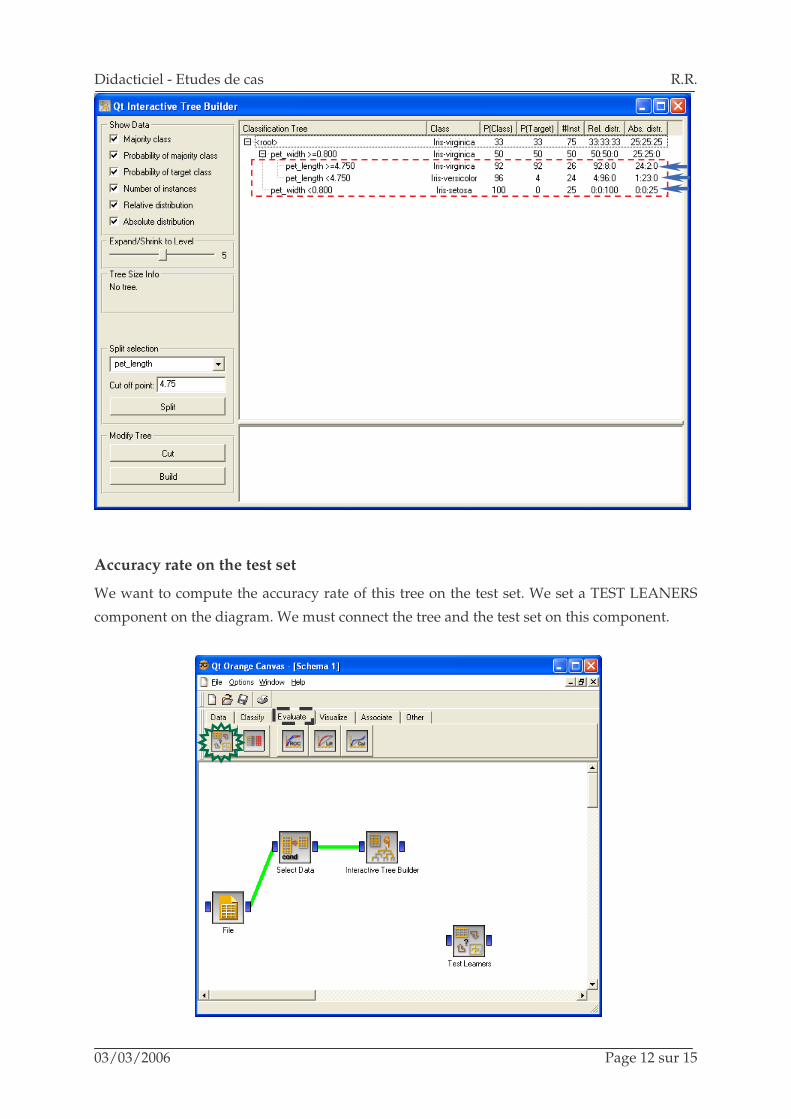
Accuracy rate on the test set
We want to compute the accuracy rate of this tree on the test set. We set a TEST LEANERS
component on the diagram. We must connect the tree and the test set on this component.

Didacticiel - Etudes de cas R.R.
03/03/2006 Page 13 sur 15
In the first step, we want to connect the tree. A dialog box appears, it enables us to specify
the right nature of the connection i.e. a LEARNER connection.
X
In the second step, we want to connect the test set to the TEST LEANERS component. We
add a new SELECT DATA component in the diagram, we use this filtering rule: STATUS =
TEST.
Then, we connect SELECT DATA to TEST LEANERS; we must use the SEPARATE TEST SET
connection. We obtain the following diagram.

Didacticiel - Etudes de cas R.R.
03/03/2006 Page 14 sur 15
X
We click on the OPEN menu; we set the TEST option to TEST ON TEST DATA. We find the
same results as with SIPINA. This is not surprising, we built identical trees.

Didacticiel - Etudes de cas R.R.
03/03/2006 Page 15 sur 15
Conclusion
ORANGE and SIPINA are powerful tools for interactive tree construction.
Of course, some functionality miss compared to commercial packages (sorting attributes
according the goodness of split for ORANGE, modifying the cut point for SIPINA, merging
values for discrete attributes, etc.). But, in the majority of the situations, these tools enable to
obtain very satisfactory results.
Another important information, these tools are free.


