
Ten steps to better data quality: the sequential structure of
ANACONDA Dr. Lene Mikkelsen
2 October, 2017 Recife Brazil
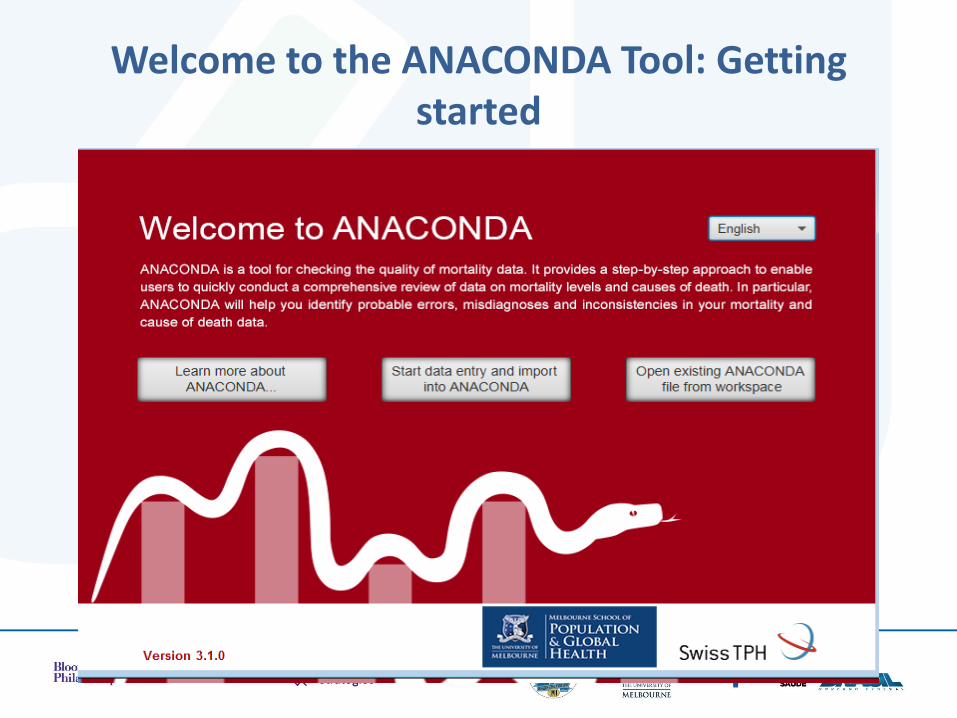
Welcome to the ANACONDA Tool: Getting started
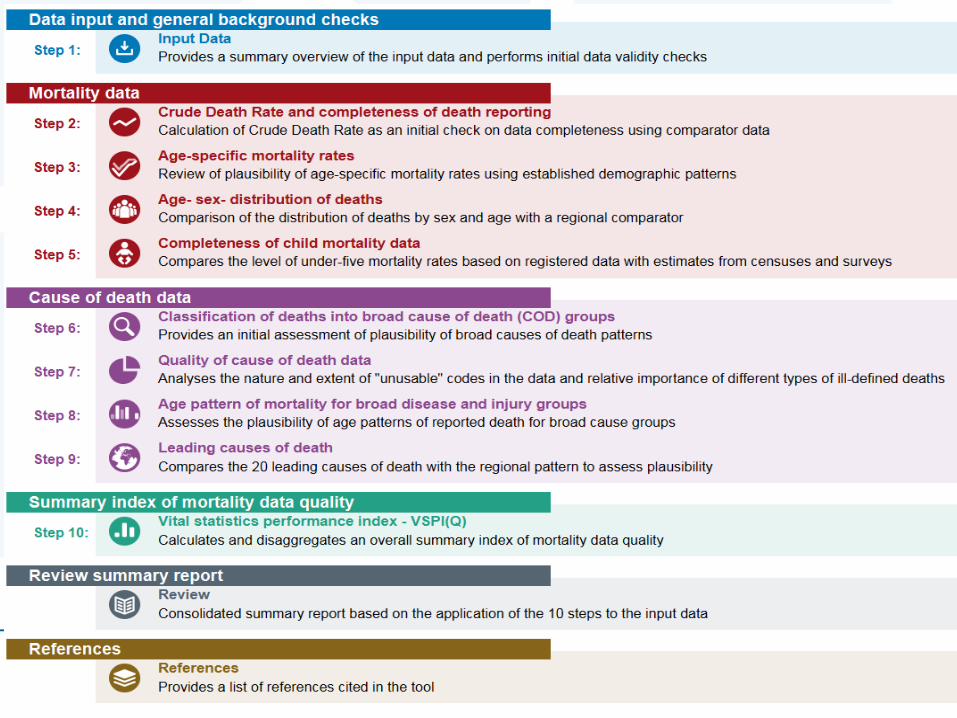
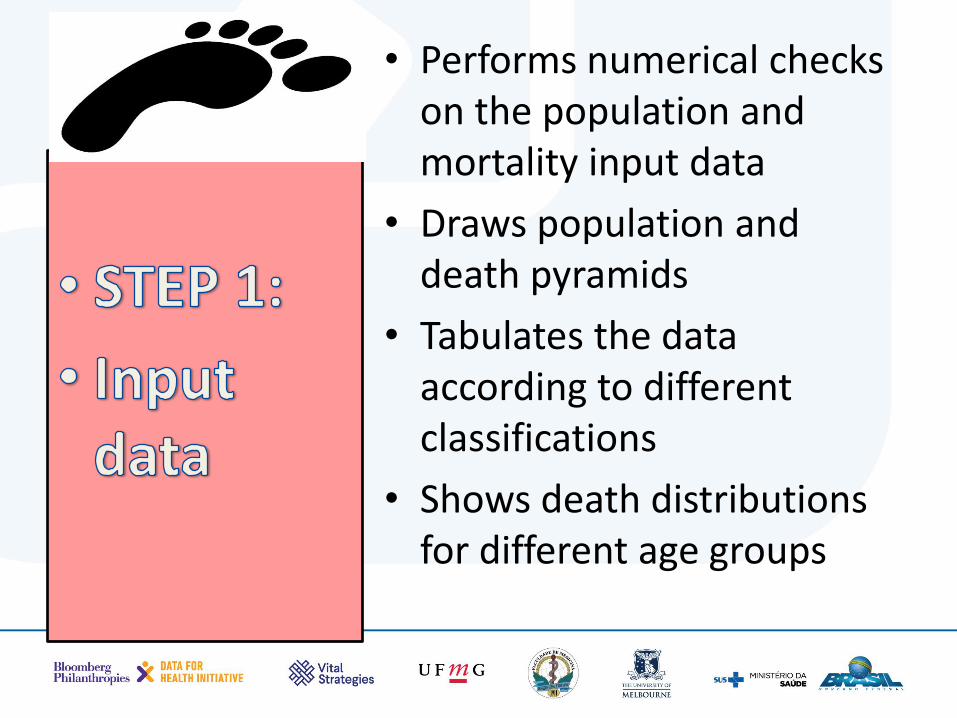
• Performs numerical checks on the population and mortality input data
• Draws population and death pyramids
• Tabulates the data according to different classifications
• Shows death distributions for different age groups
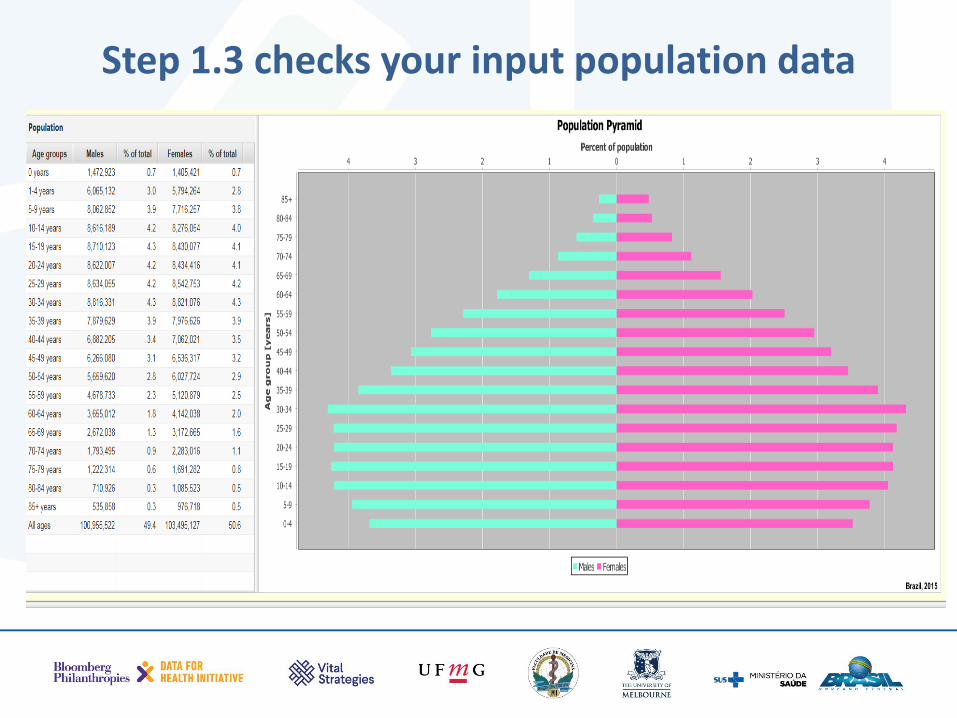
Step 1.3 checks your input population data
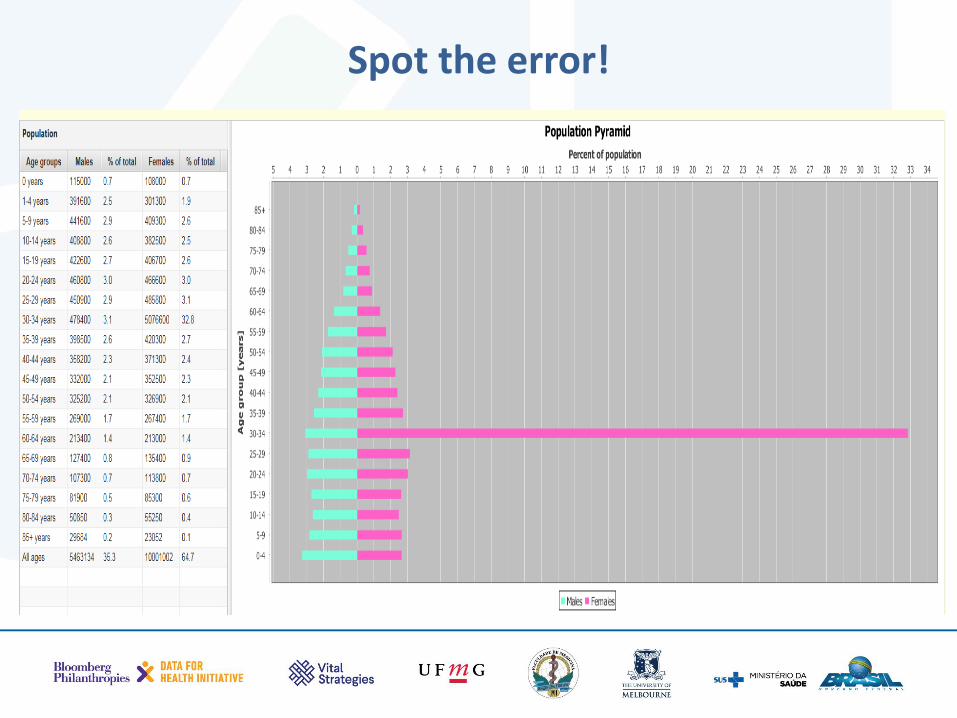
Spot the error!
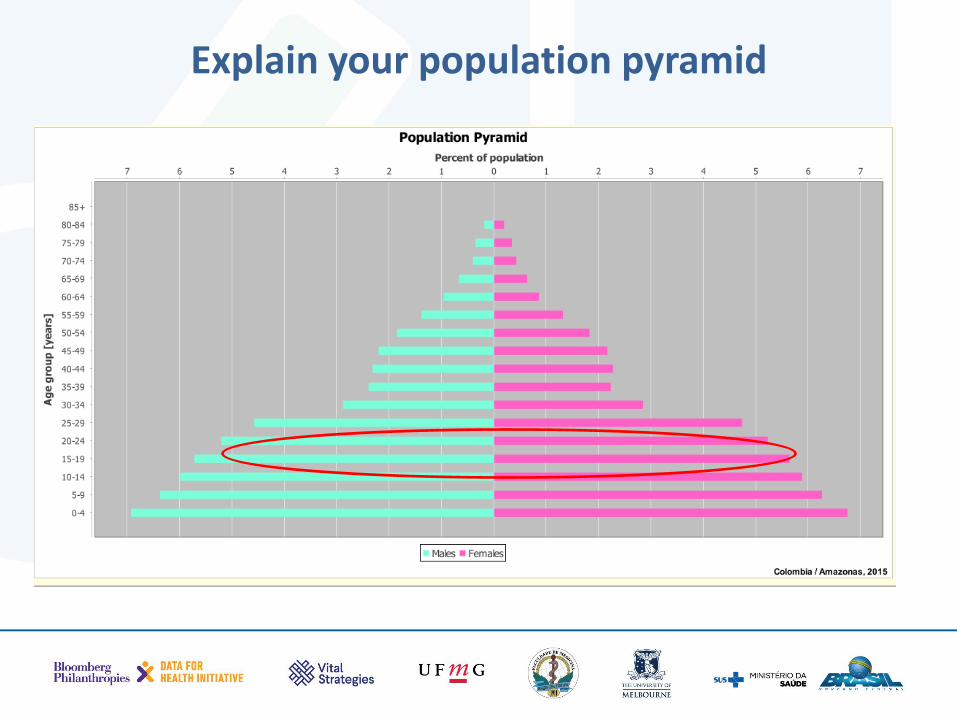
Explain your population pyramid
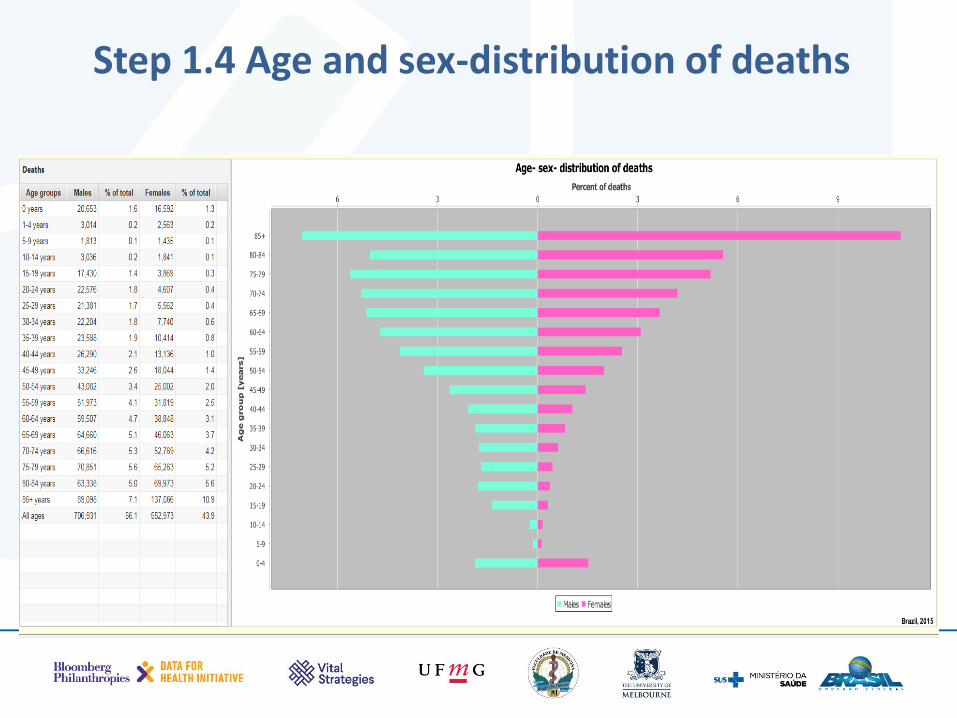
Step 1.4 Age and sex-distribution of deaths
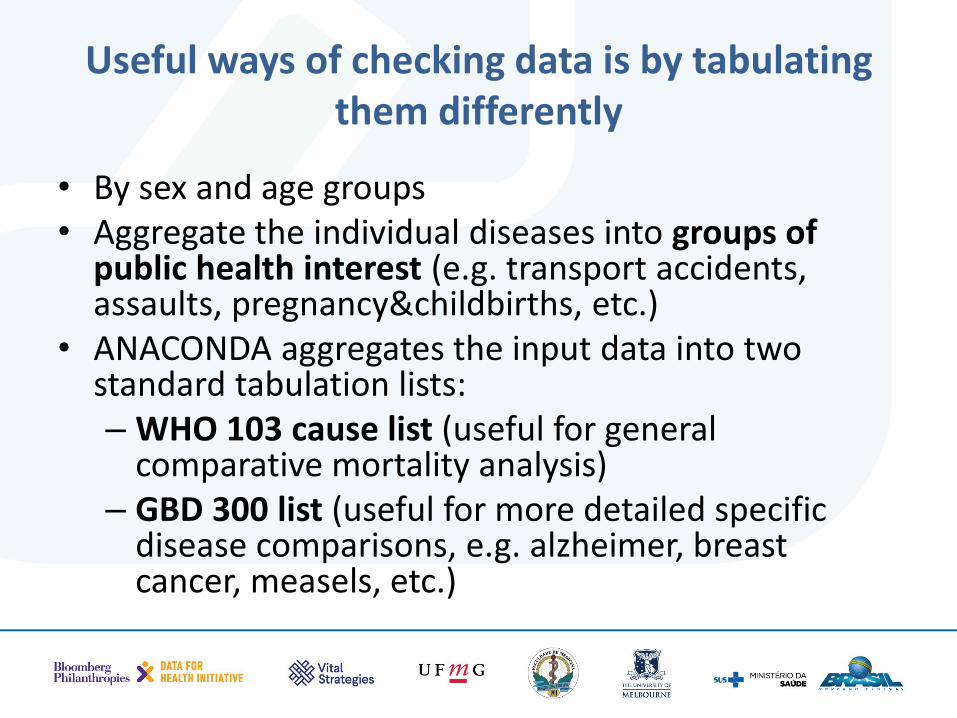
Useful ways of checking data is by tabulating them differently
• By sex and age groups • Aggregate the individual diseases into groups of
public health interest (e.g. transport accidents, assaults, pregnancy&childbirths, etc.)
• ANACONDA aggregates the input data into two standard tabulation lists: – WHO 103 cause list (useful for general
comparative mortality analysis) – GBD 300 list (useful for more detailed specific
disease comparisons, e.g. alzheimer, breast cancer, measels, etc.)
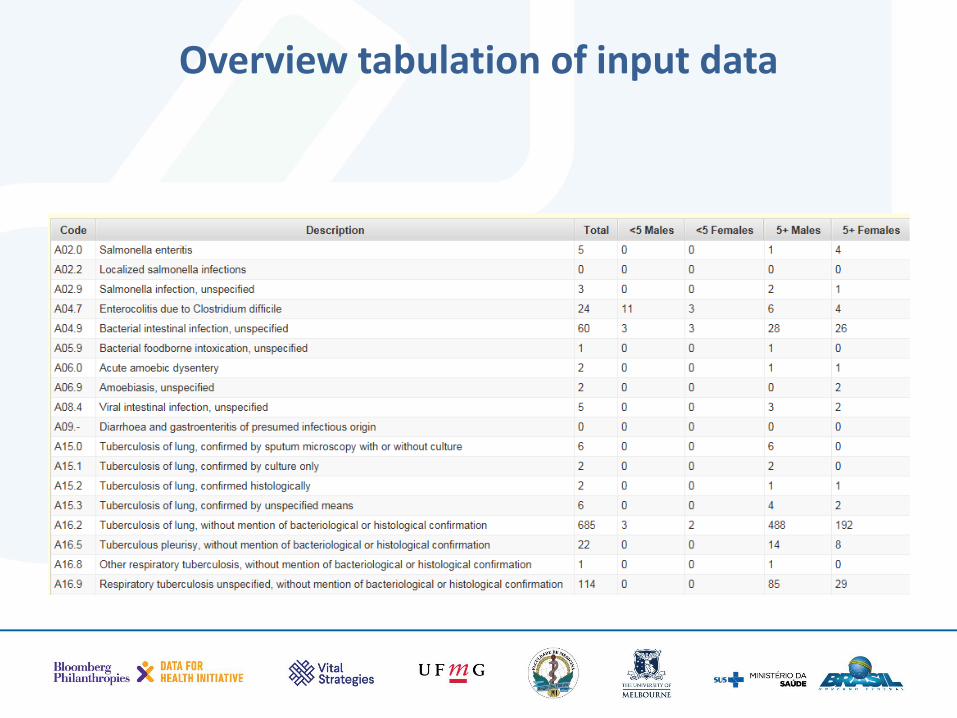
Overview tabulation of input data
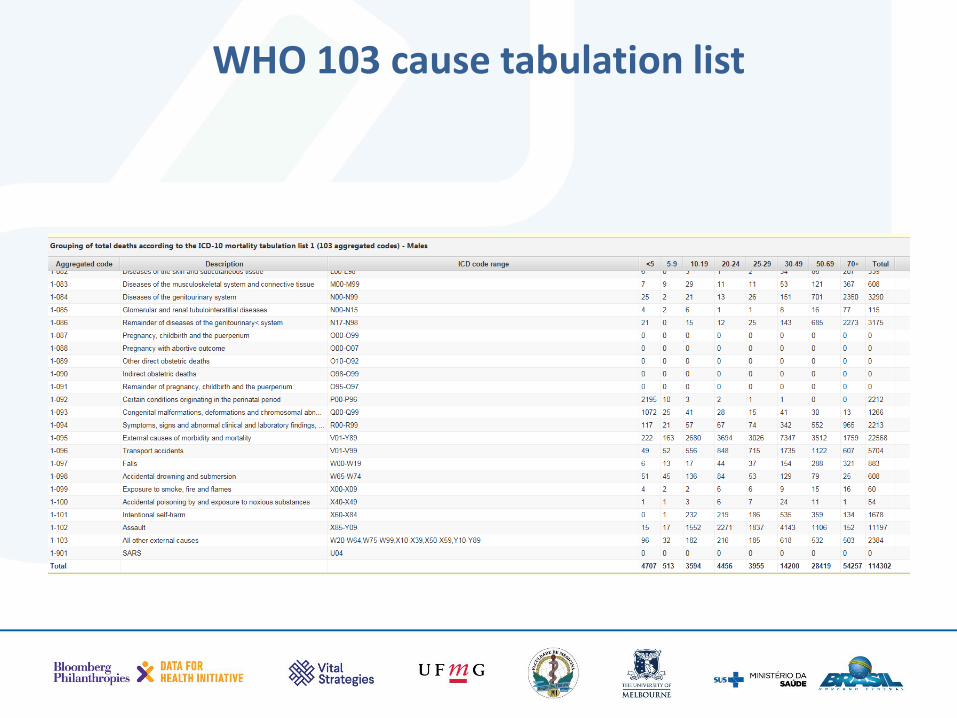
WHO 103 cause tabulation list
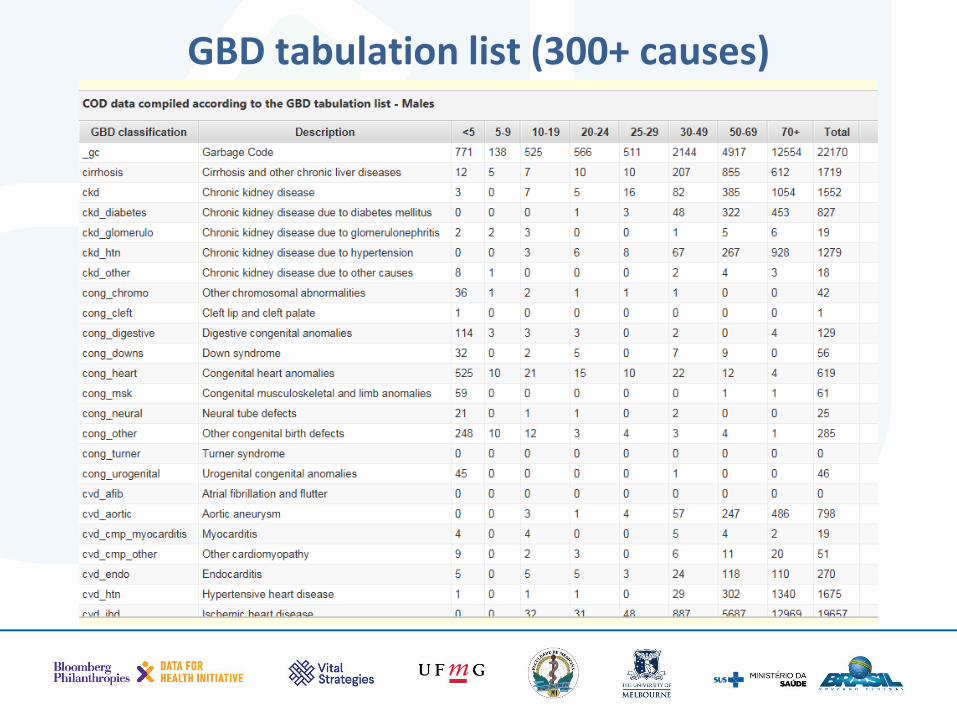
GBD tabulation list (300+ causes)
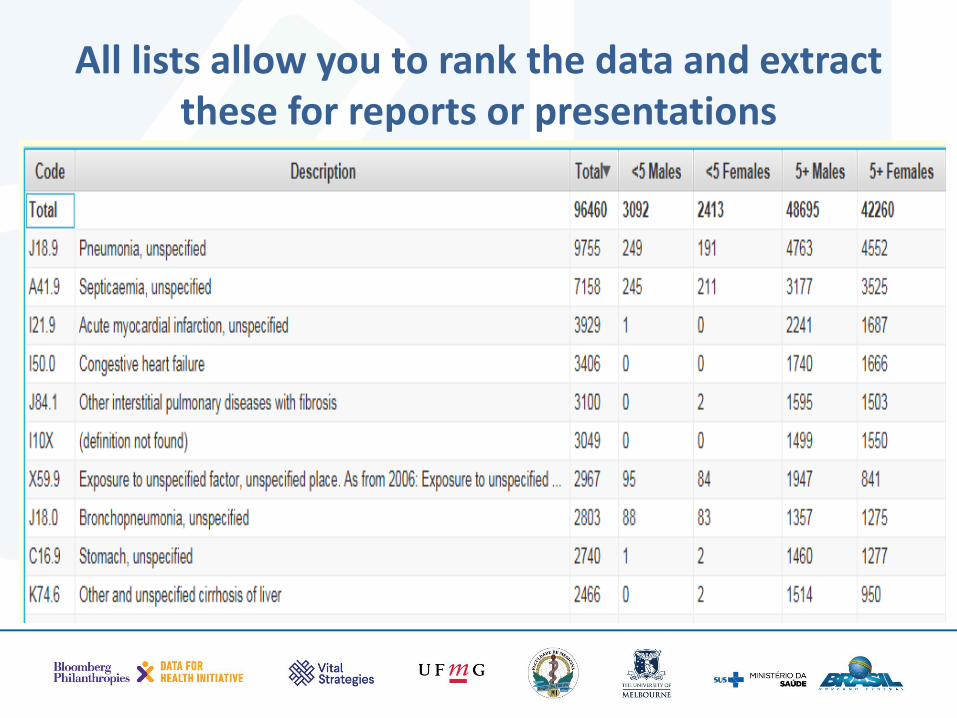
All lists allow you to rank the data and extract these for reports or presentations
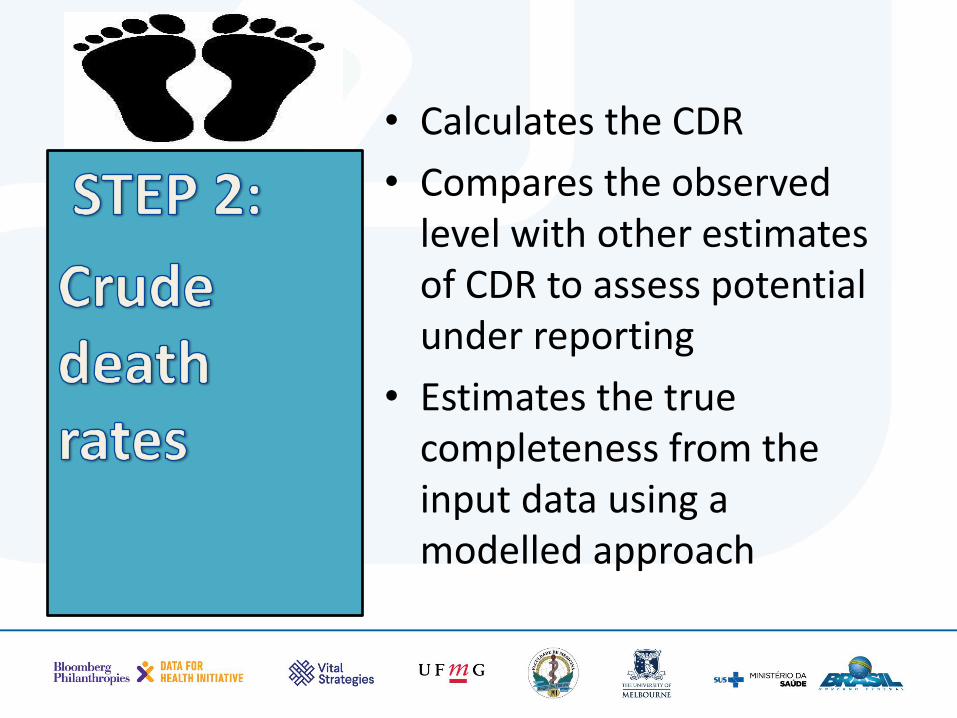
• Calculates the CDR
• Compares the observed level with other estimates of CDR to assess potential under reporting
• Estimates the true completeness from the input data using a modelled approach
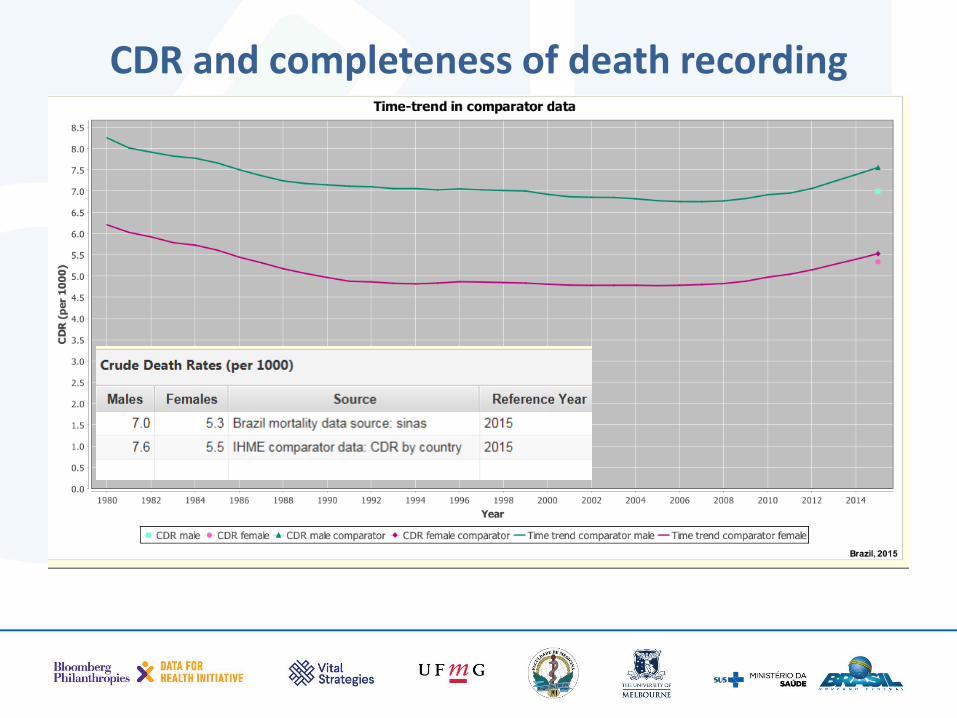
CDR and completeness of death recording
Interpreting the CDR
• Knowing the population age structure will help you interpret whether a low CDR is true or indicative of under-registration of deaths
• Which type of populations have high CDR?
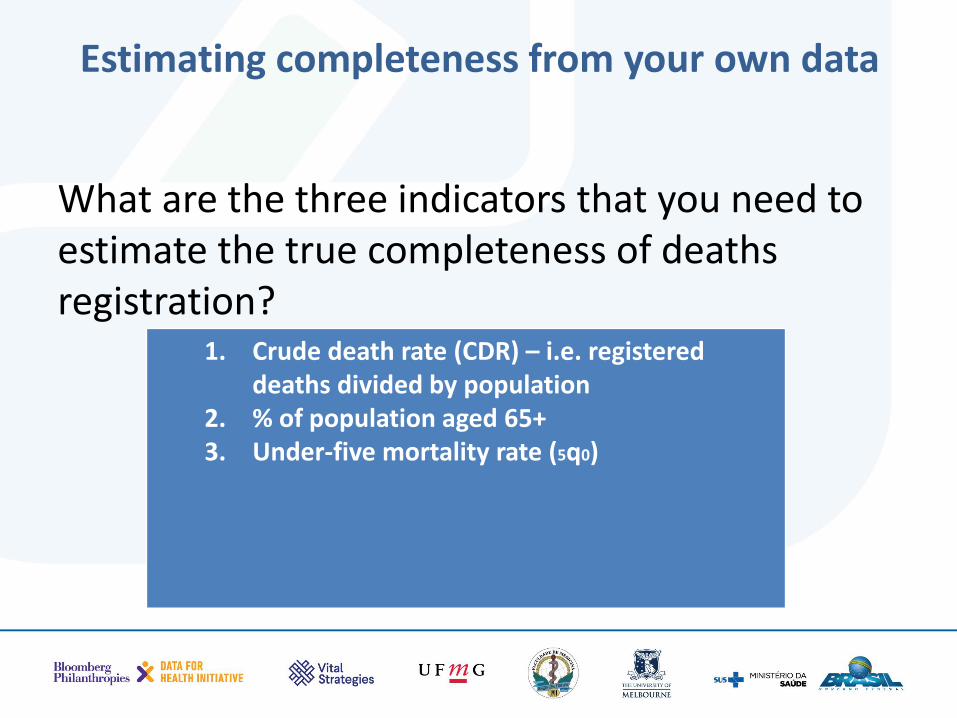
Estimating completeness from your own data
What are the three indicators that you need to estimate the true completeness of deaths registration?
1. Crude death rate (CDR) – i.e. registered deaths divided by population
2. % of population aged 65+ 3. Under-five mortality rate (5q0)
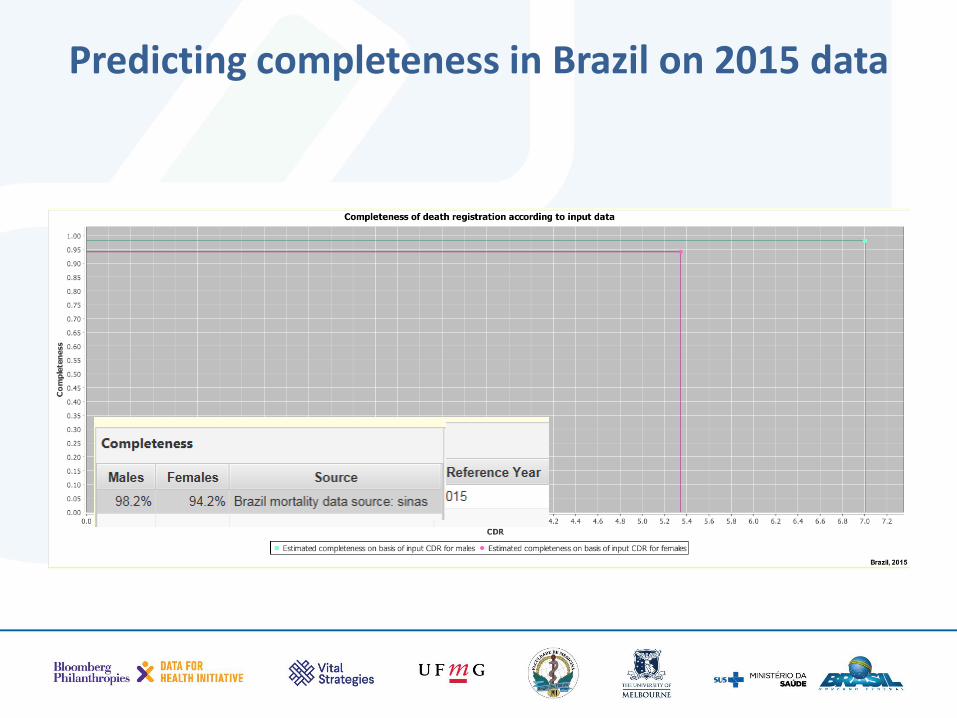
Predicting completeness in Brazil on 2015 data
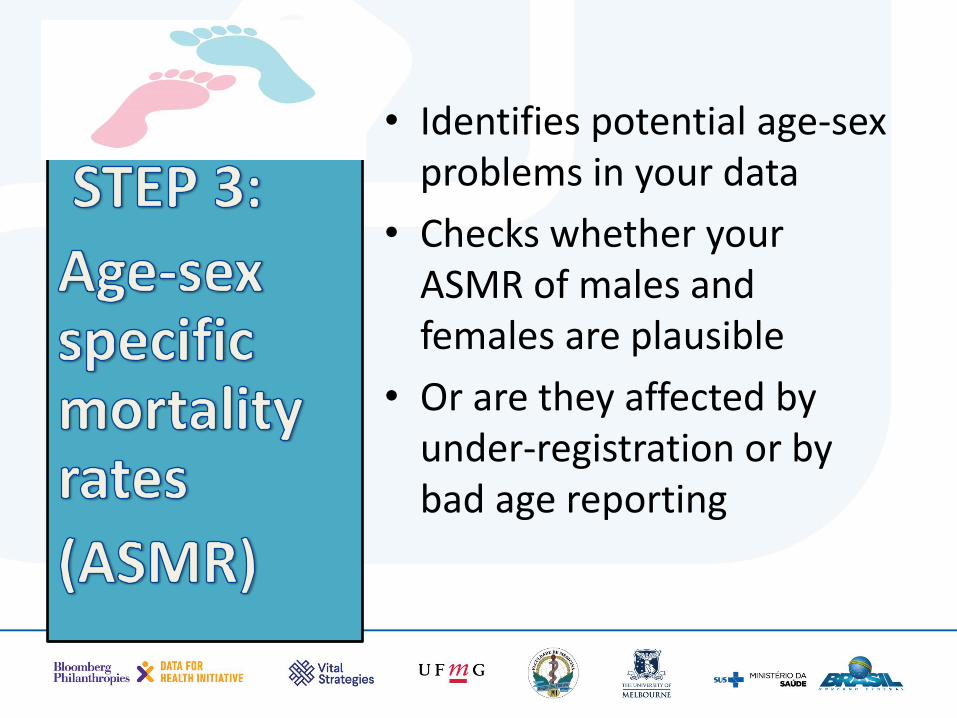
• Identifies potential age-sex problems in your data
• Checks whether your ASMR of males and females are plausible
• Or are they affected by under-registration or by bad age reporting
Standard age-sex patterns
• AGE:
– At what ages do we expect to have the highest mortality rates?
– At what ages are the ASMR the lowest?
– From what age do the rates rise EXPONENTIALLY?
• SEX:
– Which sex has the highest mortality rates?
– Any exception to this?
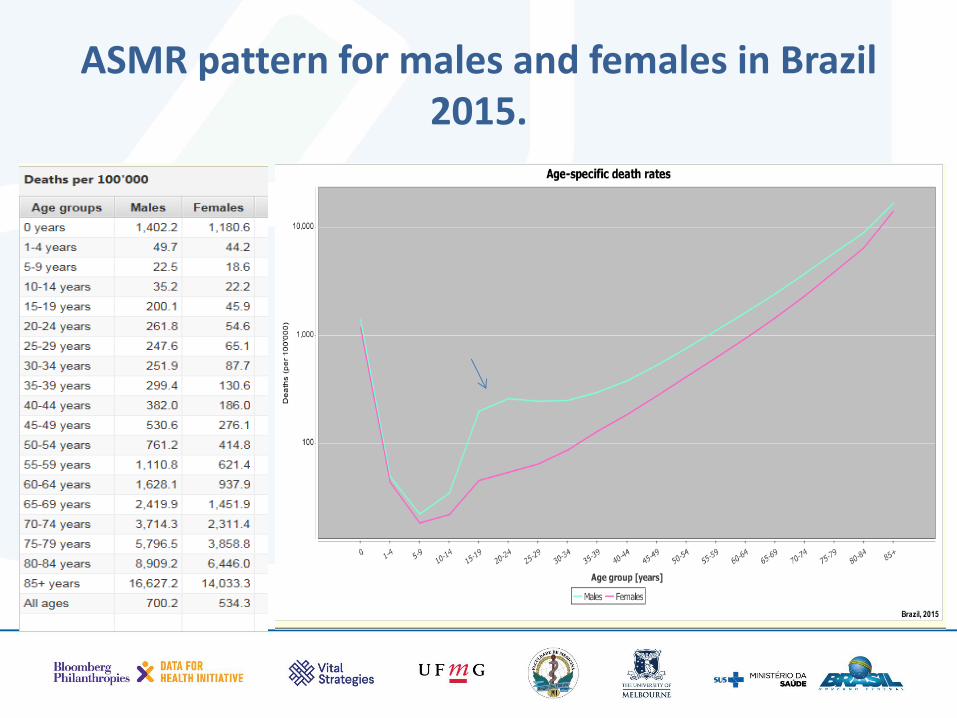
ASMR pattern for males and females in Brazil 2015.
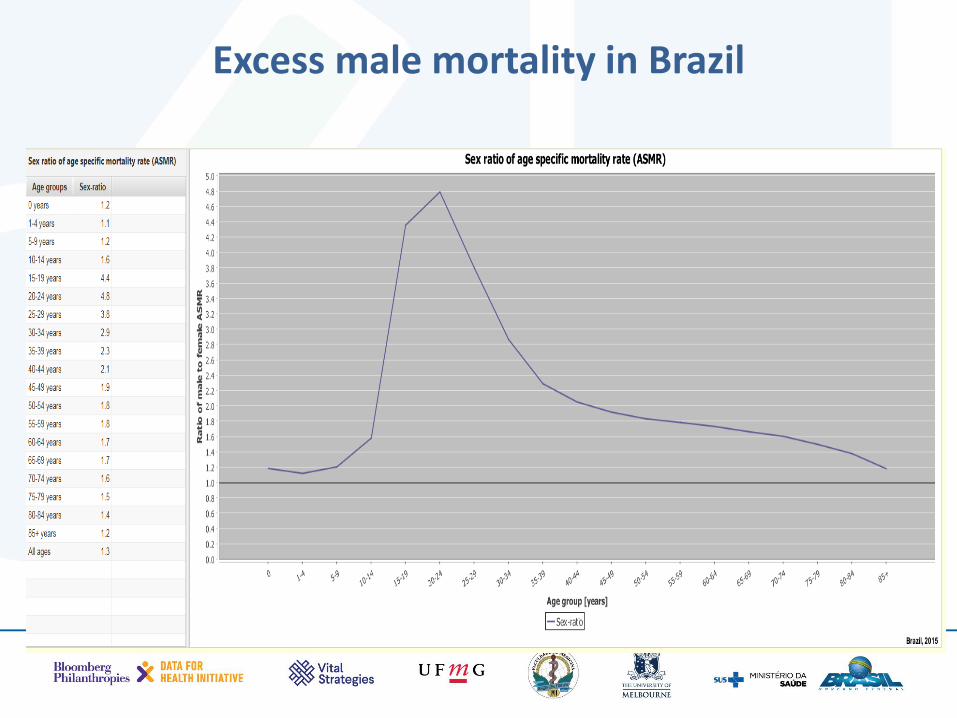
Excess male mortality in Brazil
• Looks at the number of deaths and checks how the reported male and female deaths are distributed by age
• Do these patterns look plausible or are there signs of misreporting?
• Compares your data to a regional comparator
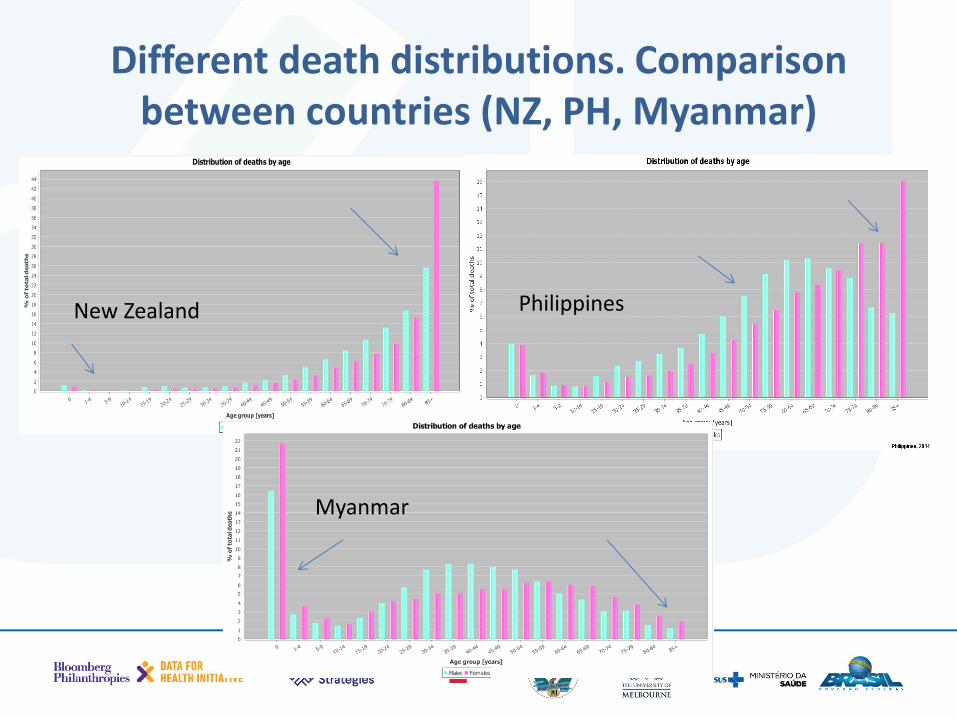
Different death distributions. Comparison between countries (NZ, PH, Myanmar)
New Zealand Philippines
Myanmar
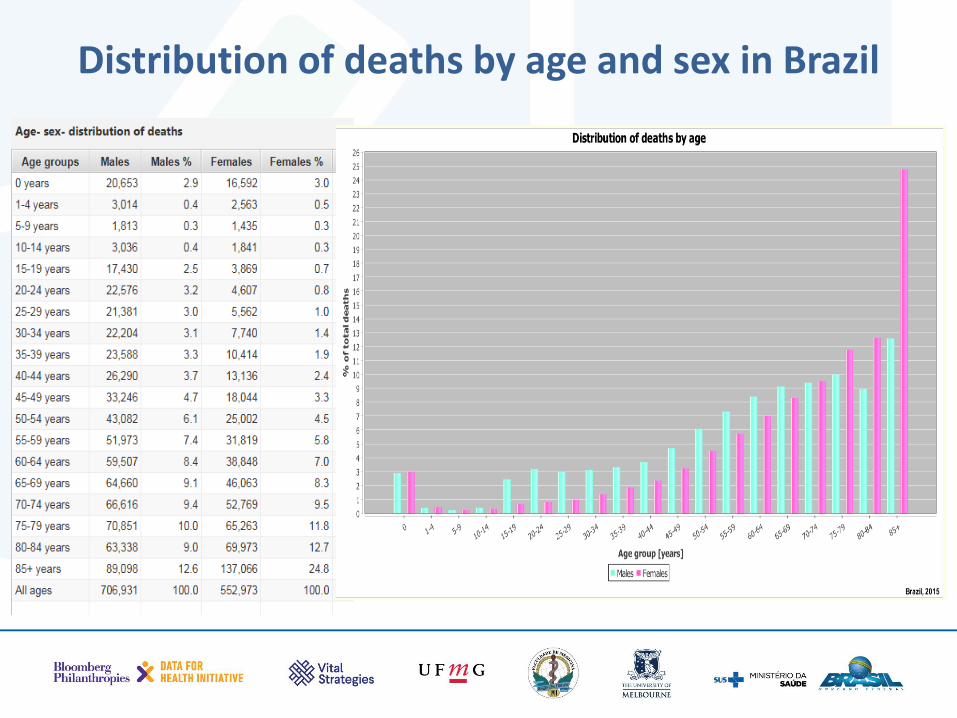
Distribution of deaths by age and sex in Brazil
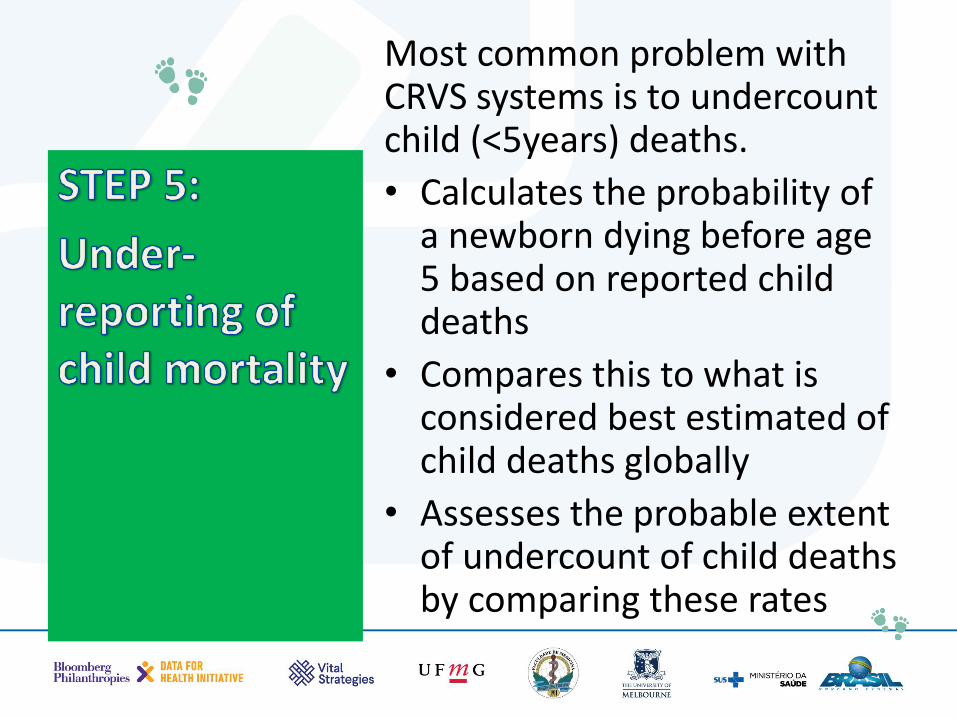
Most common problem with CRVS systems is to undercount child (<5years) deaths.
• Calculates the probability of a newborn dying before age 5 based on reported child deaths
• Compares this to what is considered best estimated of child deaths globally
• Assesses the probable extent of undercount of child deaths by comparing these rates
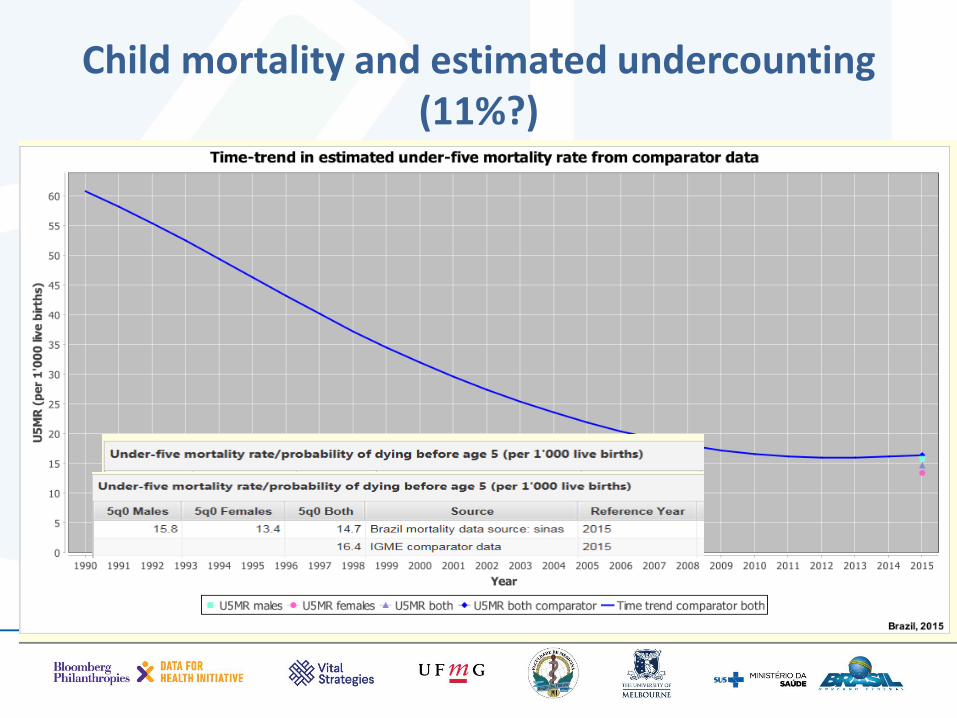
Child mortality and estimated undercounting (11%?)
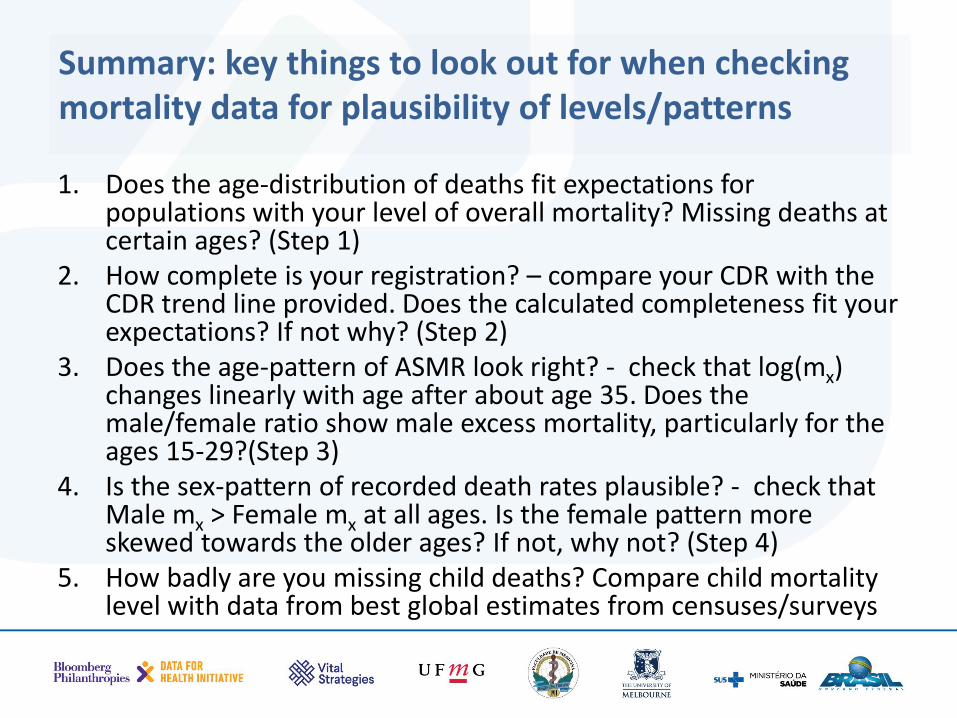
Summary: key things to look out for when checking mortality data for plausibility of levels/patterns
1. Does the age-distribution of deaths fit expectations for populations with your level of overall mortality? Missing deaths at certain ages? (Step 1)
2. How complete is your registration? – compare your CDR with the CDR trend line provided. Does the calculated completeness fit your expectations? If not why? (Step 2)
3. Does the age-pattern of ASMR look right? - check that log(mx) changes linearly with age after about age 35. Does the male/female ratio show male excess mortality, particularly for the ages 15-29?(Step 3)
4. Is the sex-pattern of recorded death rates plausible? - check that Male mx > Female mx at all ages. Is the female pattern more skewed towards the older ages? If not, why not? (Step 4)
5. How badly are you missing child deaths? Compare child mortality level with data from best global estimates from censuses/surveys

Time for a mini break?
• Tabulates the data by three broad cause groups (to check whether we are under/over-counting broad disease types or injuries?)
• Checks the reliability of this distribution
• Looks at the ratio between these as a measure of epidemiological transition (does this ratio accord with what you think/know about health status in the population??)
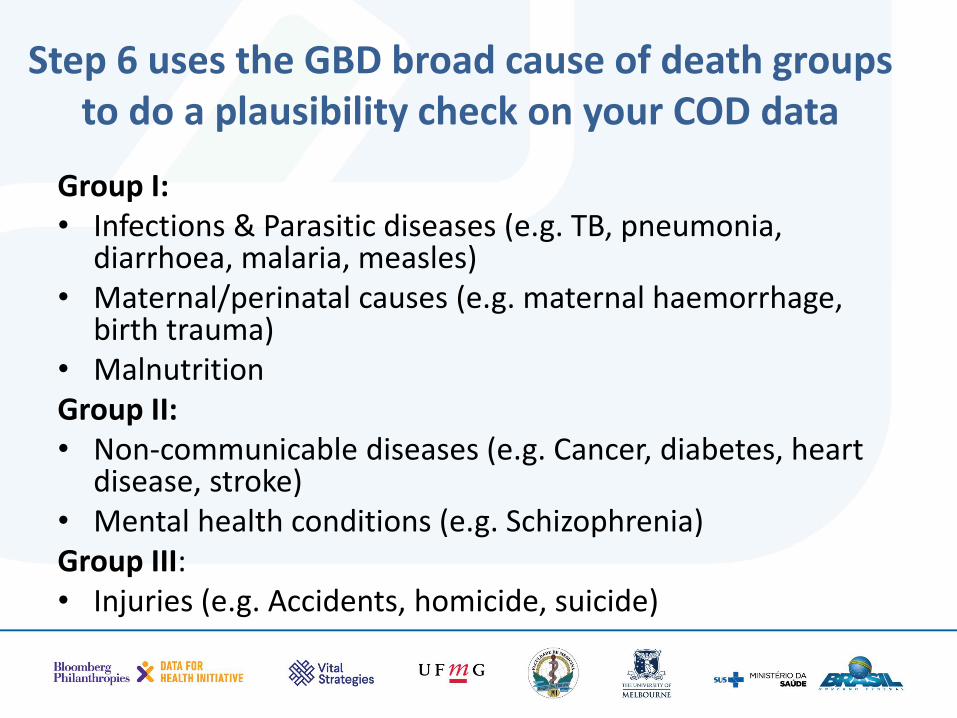
Step 6 uses the GBD broad cause of death groups to do a plausibility check on your COD data
Group I: • Infections & Parasitic diseases (e.g. TB, pneumonia,
diarrhoea, malaria, measles) • Maternal/perinatal causes (e.g. maternal haemorrhage,
birth trauma) • Malnutrition Group II: • Non-communicable diseases (e.g. Cancer, diabetes, heart
disease, stroke) • Mental health conditions (e.g. Schizophrenia) Group III: • Injuries (e.g. Accidents, homicide, suicide)
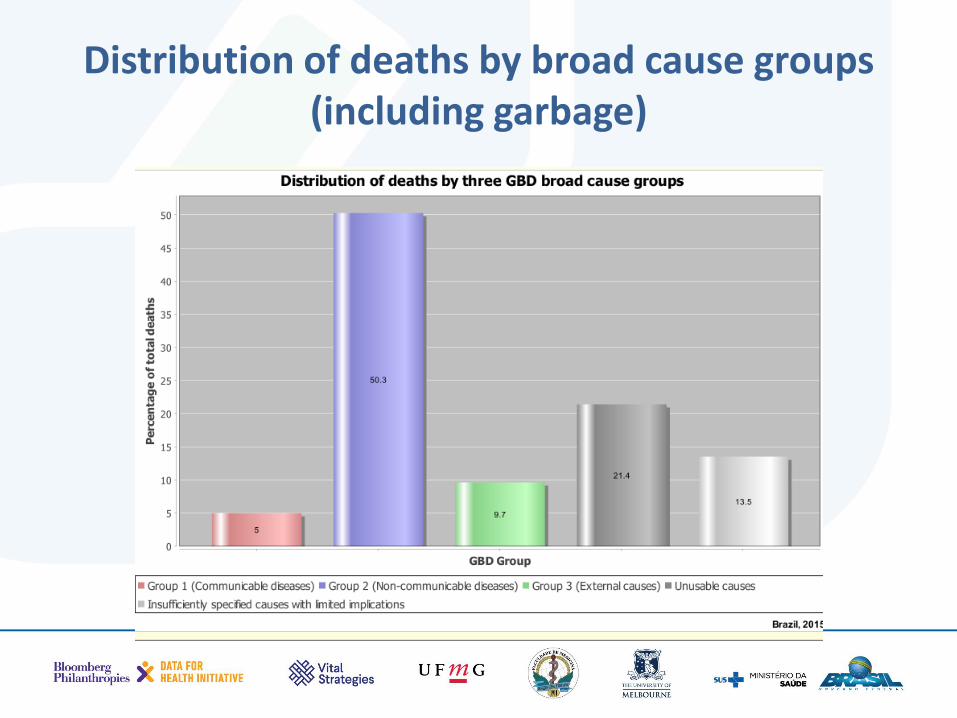
Distribution of deaths by broad cause groups (including garbage)
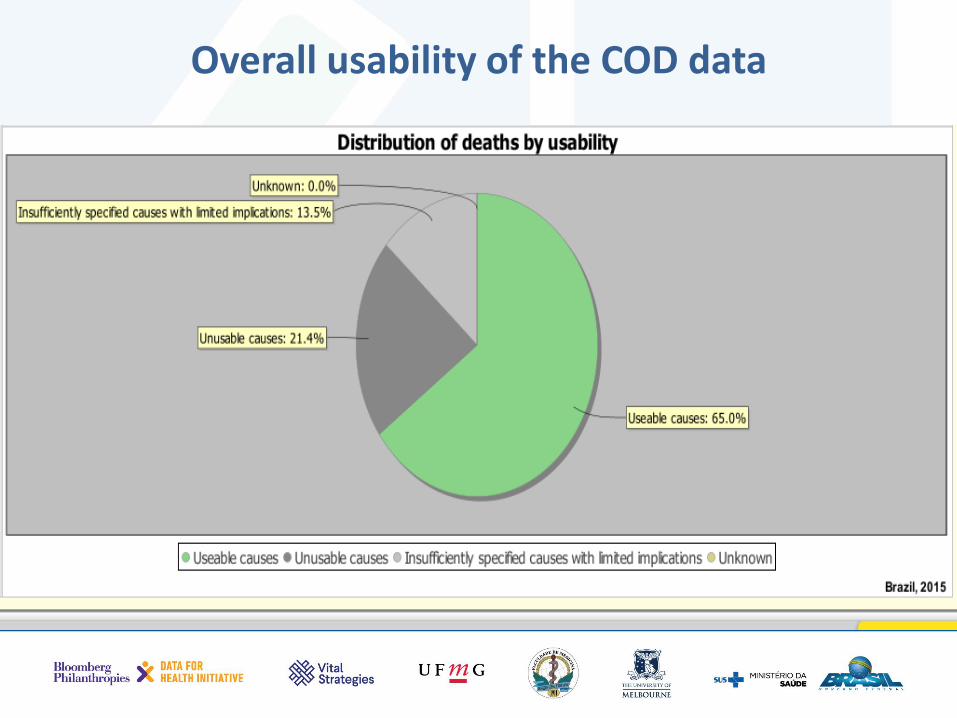
Overall usability of the COD data
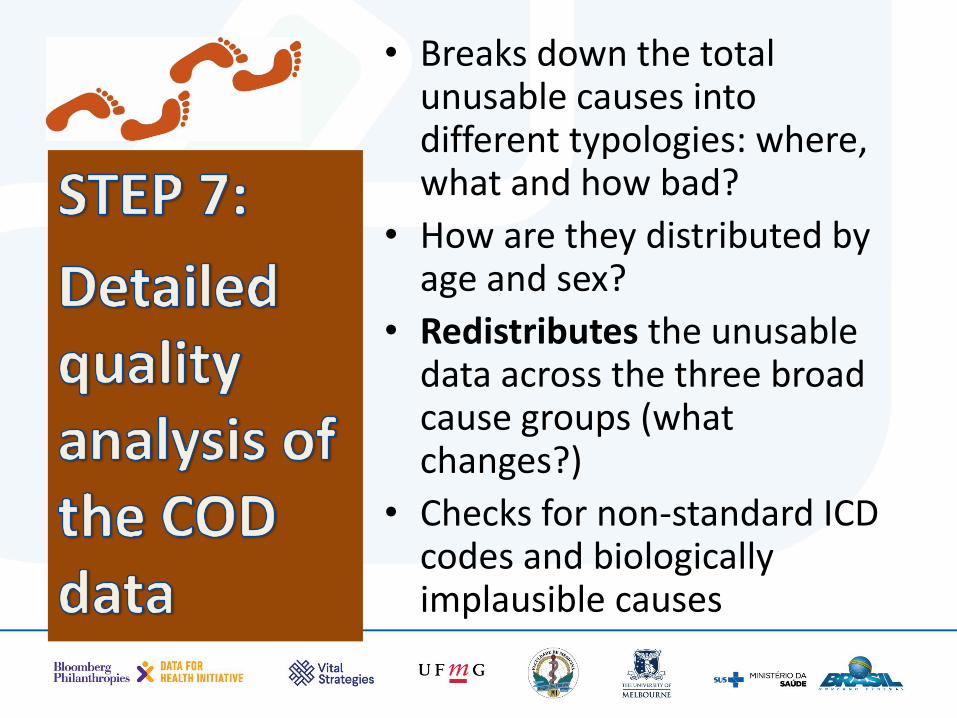
• Breaks down the total unusable causes into different typologies: where, what and how bad?
• How are they distributed by age and sex?
• Redistributes the unusable data across the three broad cause groups (what changes?)
• Checks for non-standard ICD codes and biologically implausible causes
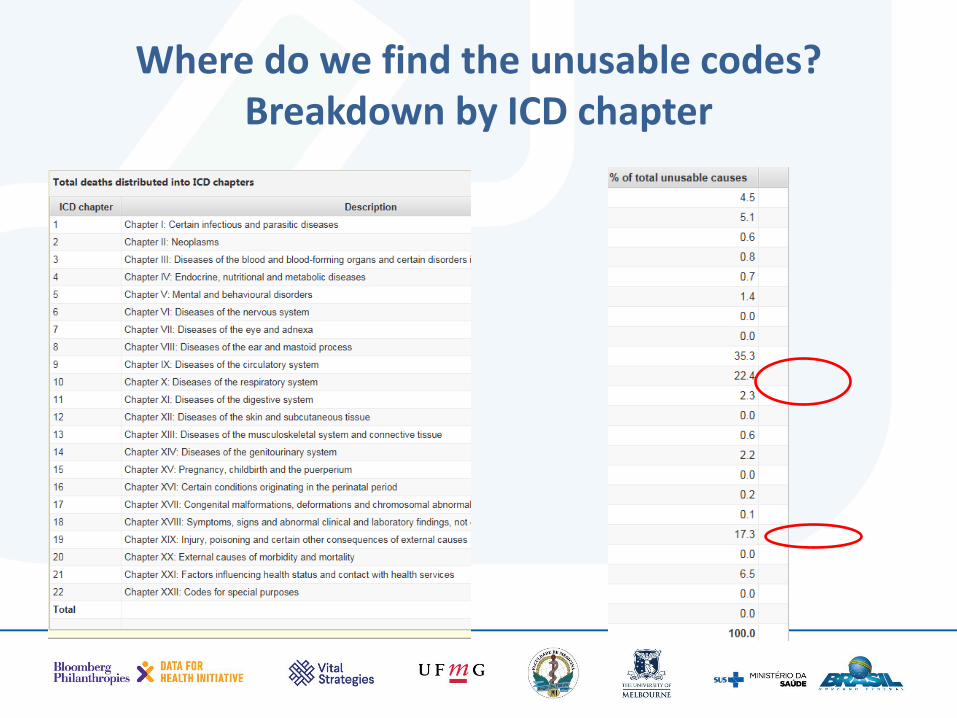
Where do we find the unusable codes? Breakdown by ICD chapter
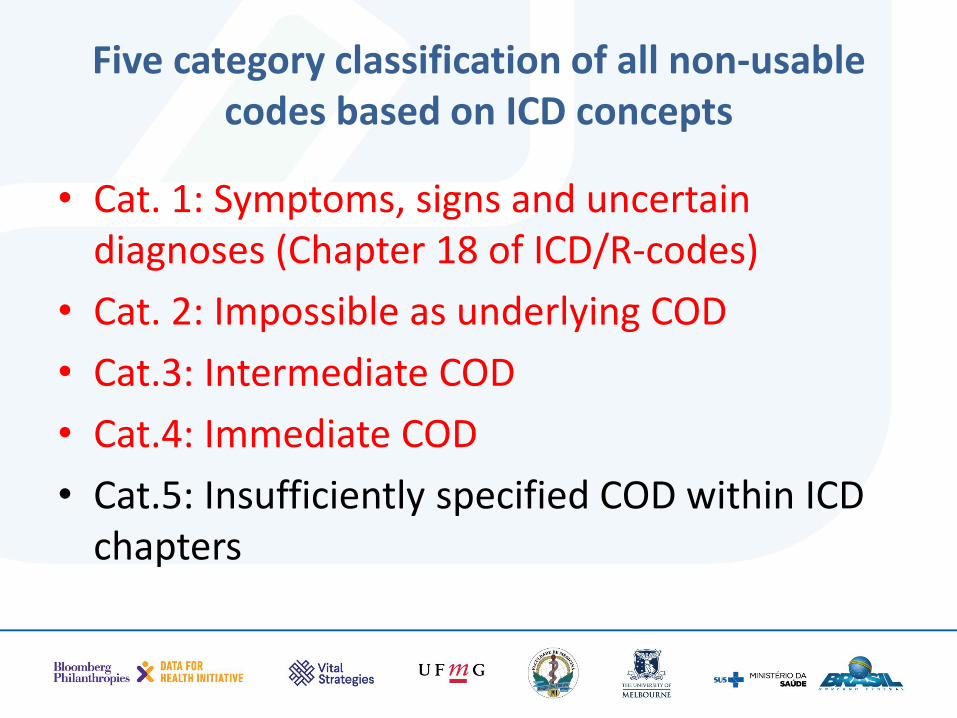
Five category classification of all non-usable codes based on ICD concepts
• Cat. 1: Symptoms, signs and uncertain diagnoses (Chapter 18 of ICD/R-codes)
• Cat. 2: Impossible as underlying COD
• Cat.3: Intermediate COD
• Cat.4: Immediate COD
• Cat.5: Insufficiently specified COD within ICD chapters
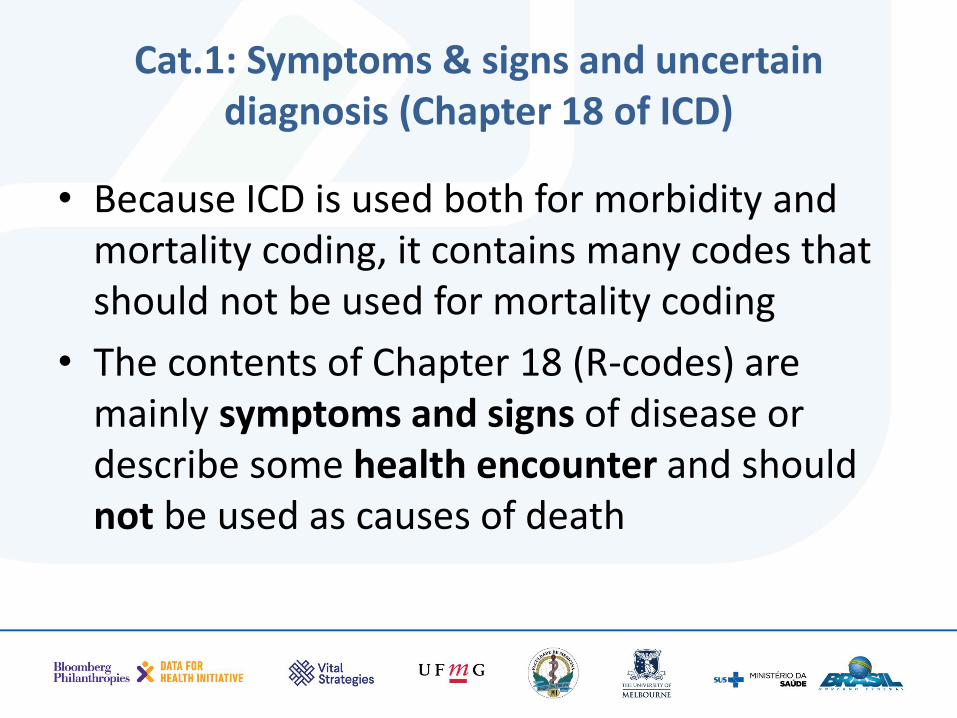
Cat.1: Symptoms & signs and uncertain diagnosis (Chapter 18 of ICD)
• Because ICD is used both for morbidity and mortality coding, it contains many codes that should not be used for mortality coding
• The contents of Chapter 18 (R-codes) are mainly symptoms and signs of disease or describe some health encounter and should not be used as causes of death
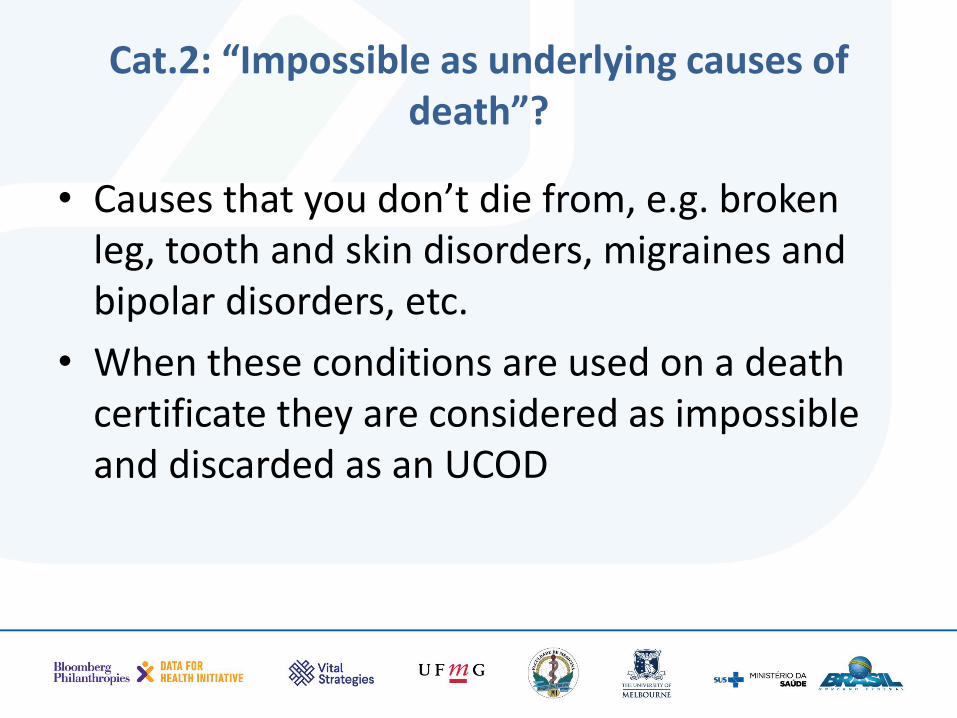
Cat.2: “Impossible as underlying causes of death”?
• Causes that you don’t die from, e.g. broken leg, tooth and skin disorders, migraines and bipolar disorders, etc.
• When these conditions are used on a death certificate they are considered as impossible and discarded as an UCOD
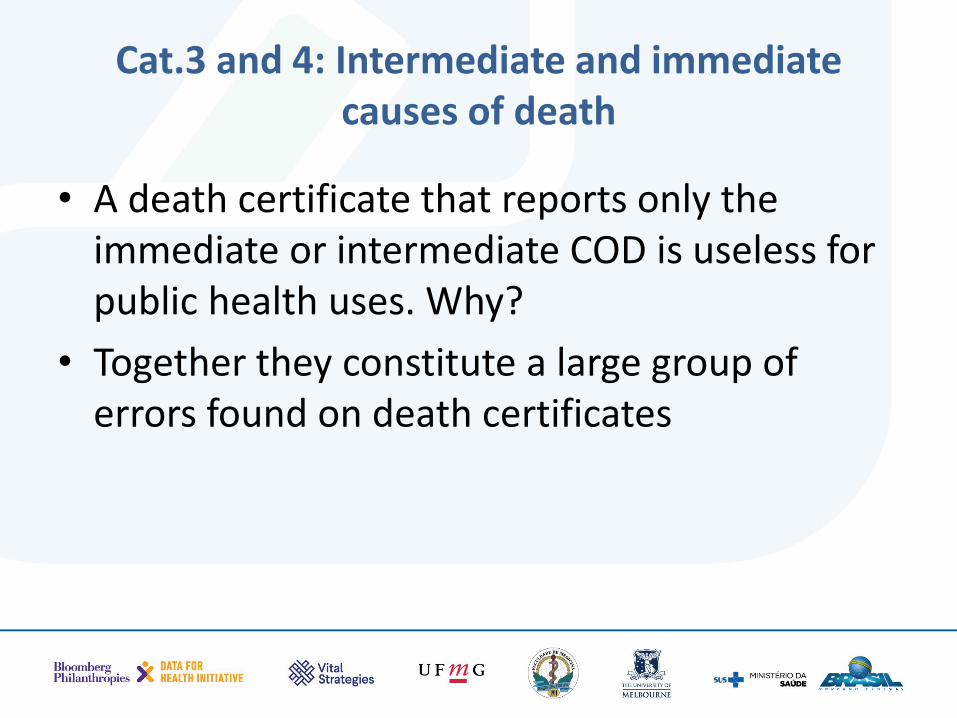
Cat.3 and 4: Intermediate and immediate causes of death
• A death certificate that reports only the immediate or intermediate COD is useless for public health uses. Why?
• Together they constitute a large group of errors found on death certificates
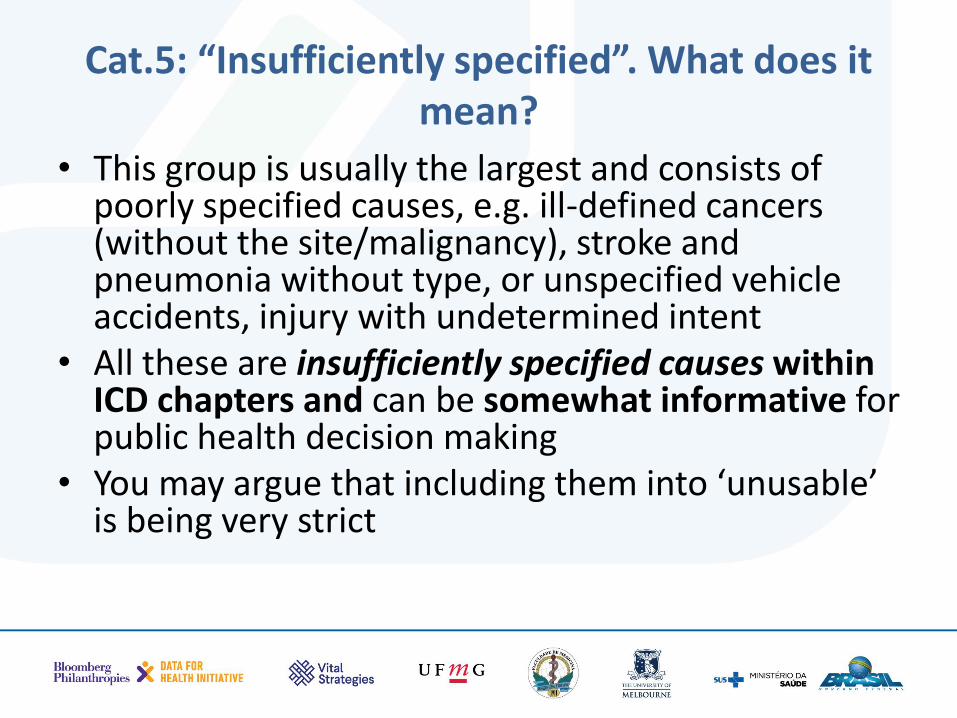
Cat.5: “Insufficiently specified”. What does it mean?
• This group is usually the largest and consists of poorly specified causes, e.g. ill-defined cancers (without the site/malignancy), stroke and pneumonia without type, or unspecified vehicle accidents, injury with undetermined intent
• All these are insufficiently specified causes within ICD chapters and can be somewhat informative for public health decision making
• You may argue that including them into ‘unusable’ is being very strict
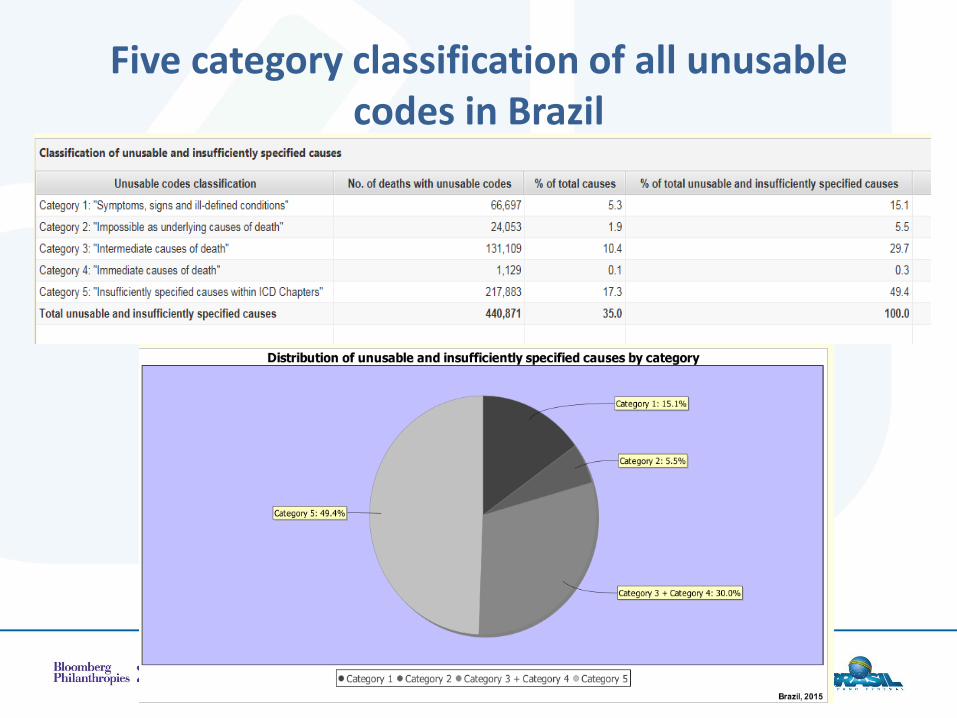
Five category classification of all unusable codes in Brazil
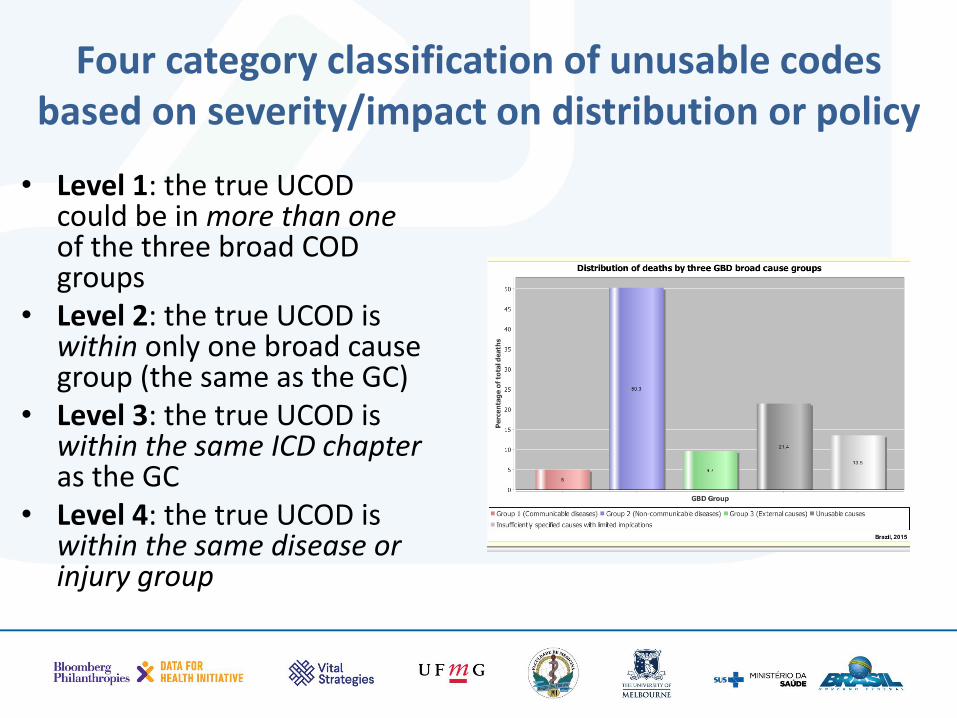
Four category classification of unusable codes based on severity/impact on distribution or policy
• Level 1: the true UCOD could be in more than one of the three broad COD groups
• Level 2: the true UCOD is within only one broad cause group (the same as the GC)
• Level 3: the true UCOD is within the same ICD chapter as the GC
• Level 4: the true UCOD is within the same disease or injury group
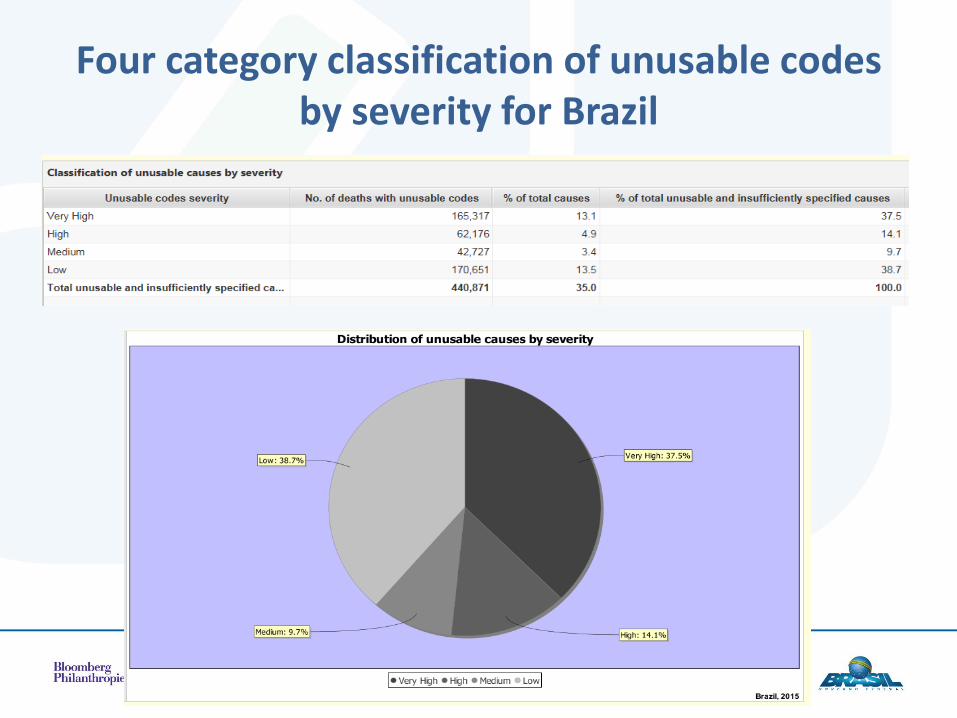
Four category classification of unusable codes by severity for Brazil
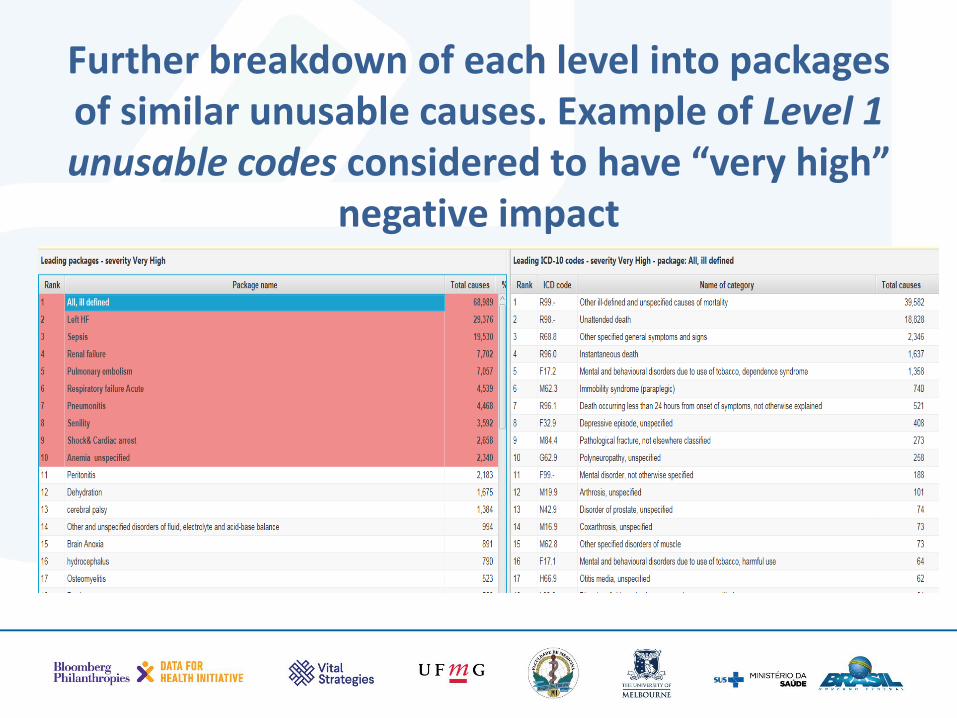
Further breakdown of each level into packages of similar unusable causes. Example of Level 1 unusable codes considered to have “very high”
negative impact
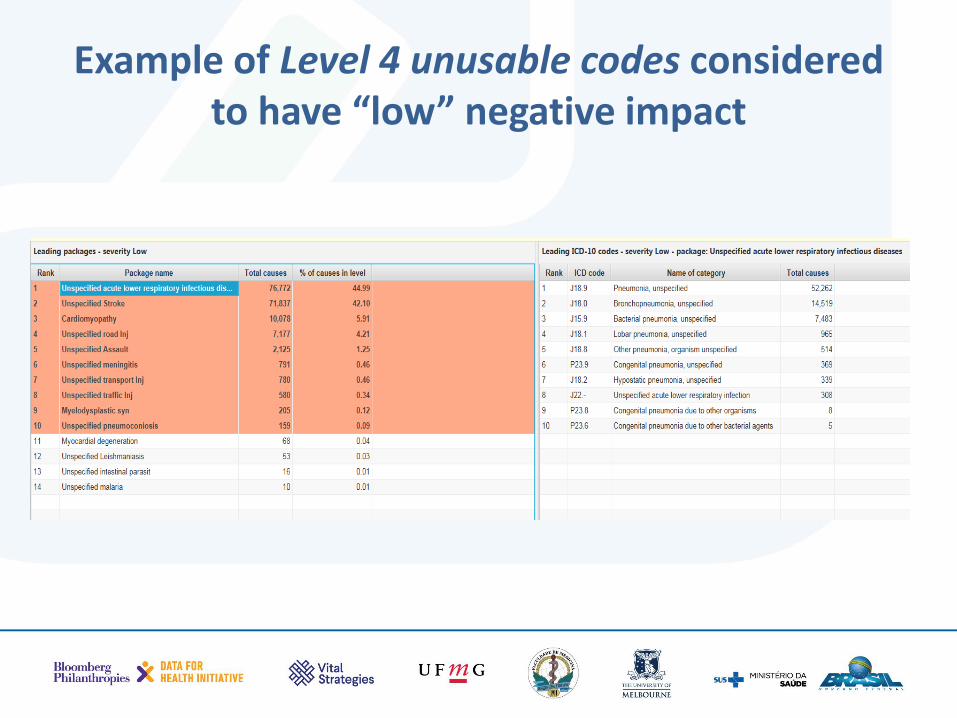
Example of Level 4 unusable codes considered to have “low” negative impact
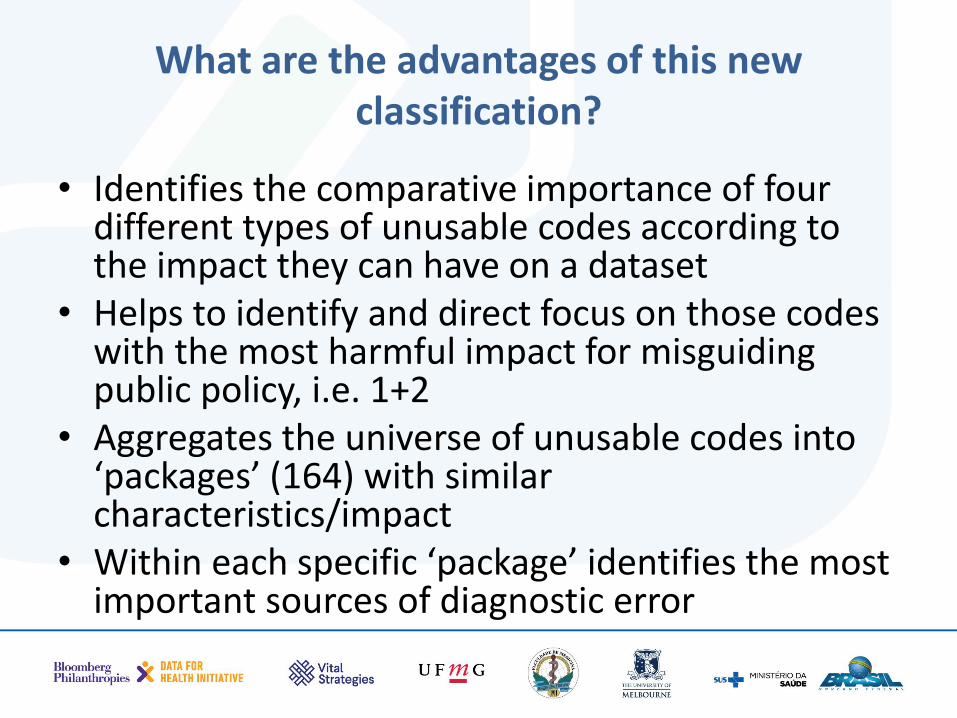
What are the advantages of this new classification?
• Identifies the comparative importance of four different types of unusable codes according to the impact they can have on a dataset
• Helps to identify and direct focus on those codes with the most harmful impact for misguiding public policy, i.e. 1+2
• Aggregates the universe of unusable codes into ‘packages’ (164) with similar characteristics/impact
• Within each specific ‘package’ identifies the most important sources of diagnostic error
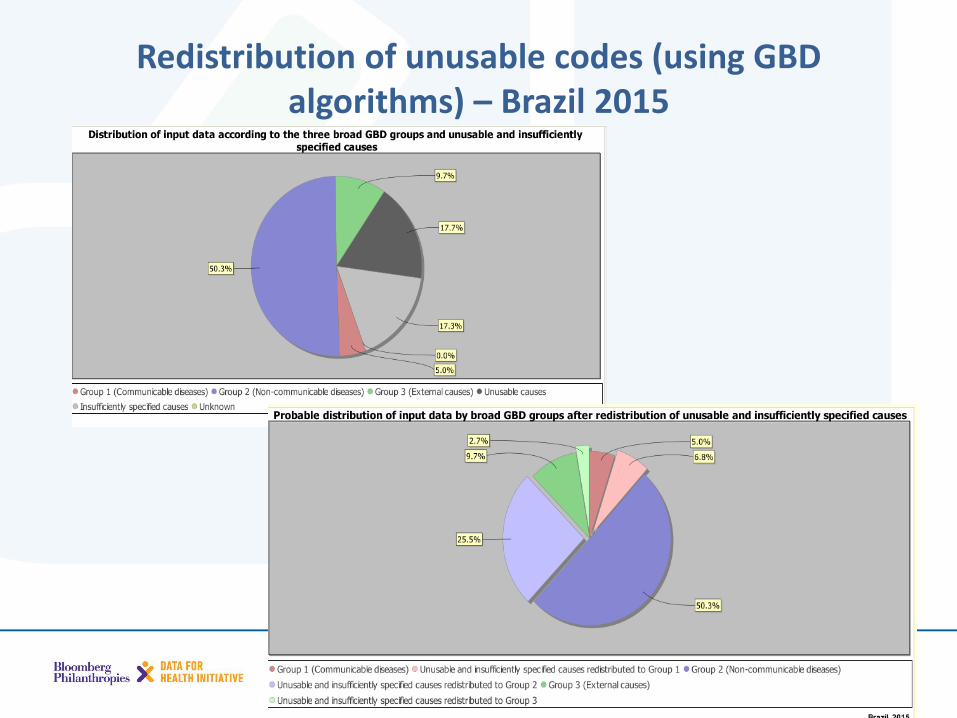
Redistribution of unusable codes (using GBD algorithms) – Brazil 2015
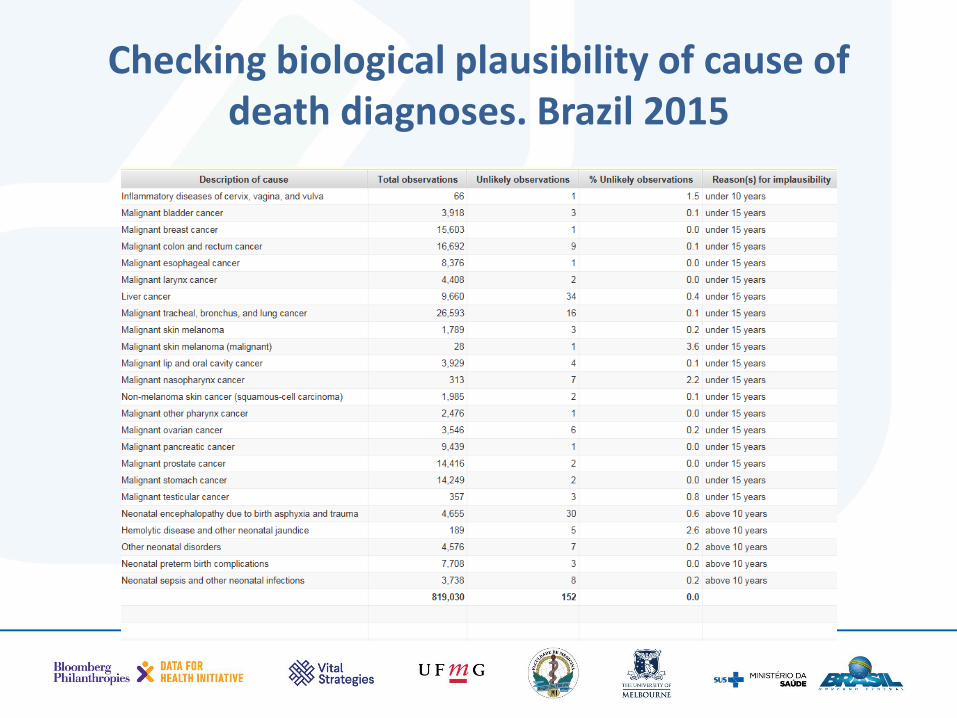
Checking biological plausibility of cause of death diagnoses. Brazil 2015
• Based on decades of observations we know that all diseases and injuries generally follow a well established age pattern
• This step checks whether the age pattern looks plausible for the three broad disease groups
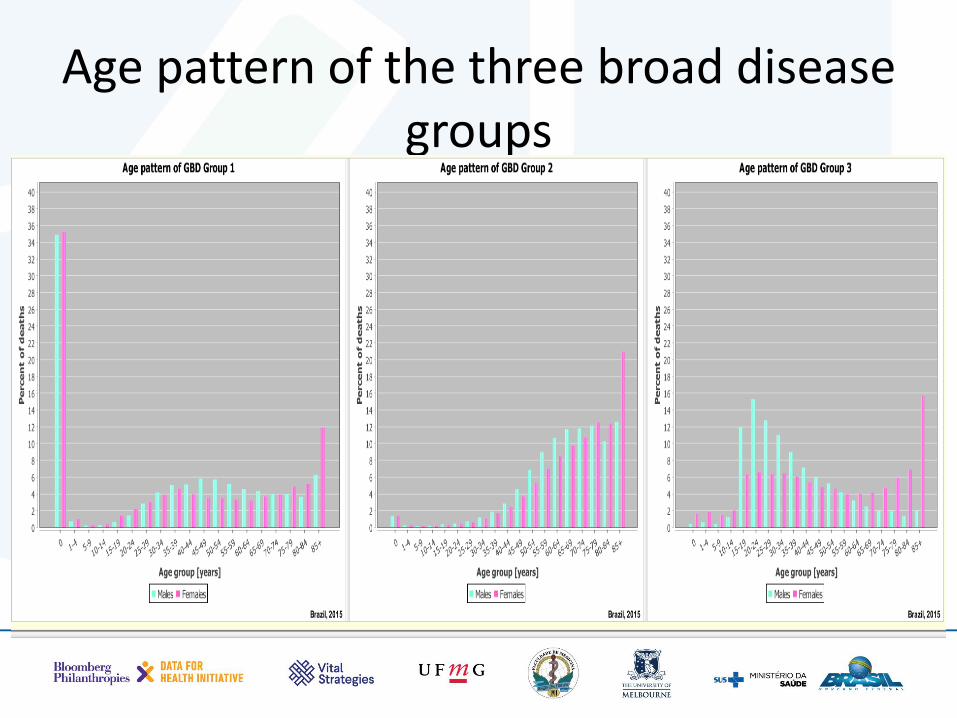
Age pattern of the three broad disease groups
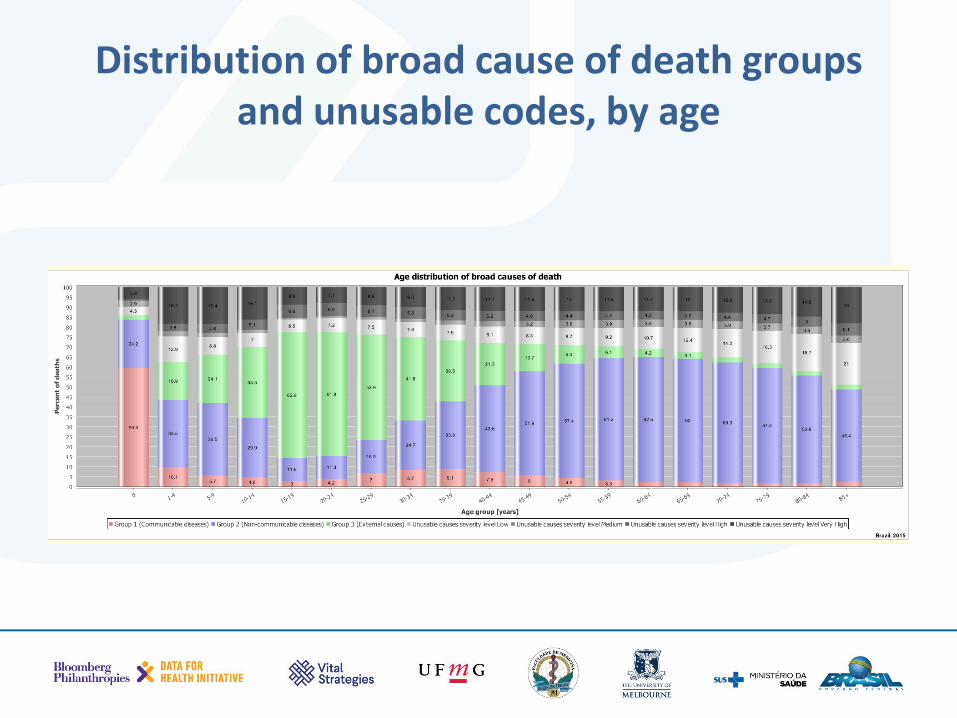
Distribution of broad cause of death groups and unusable codes, by age
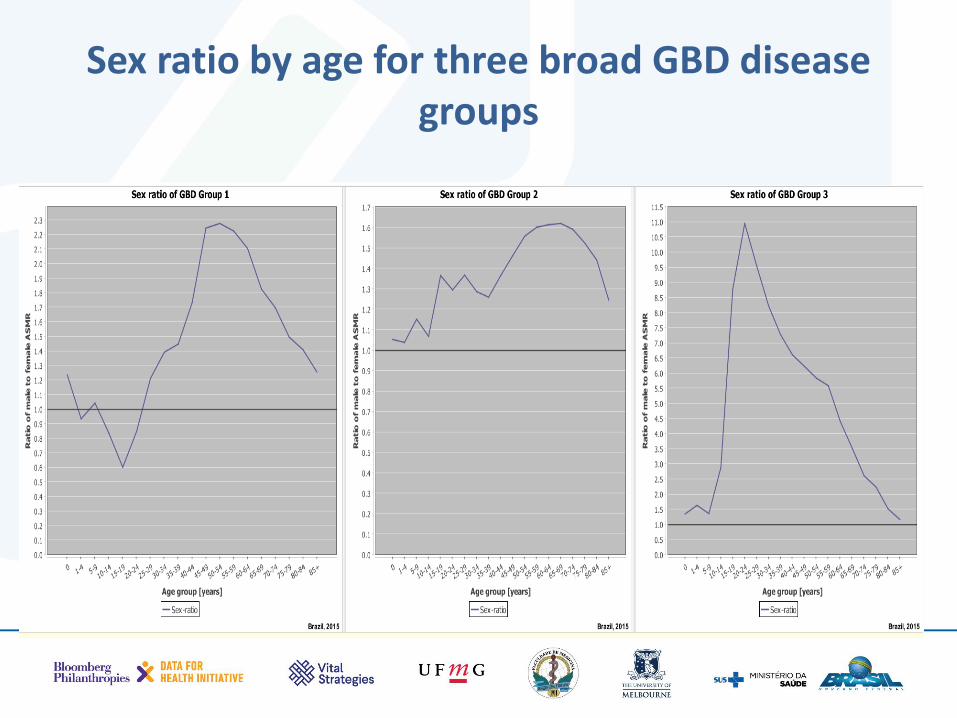
Sex ratio by age for three broad GBD disease groups
• Policy makers are generally interested in the top 10 or 20 leading causes of death
• This step identifies and ranks the 20 leading causes of death according to your data
• Assesses their reliability/usability
• Compares differences between men and women.
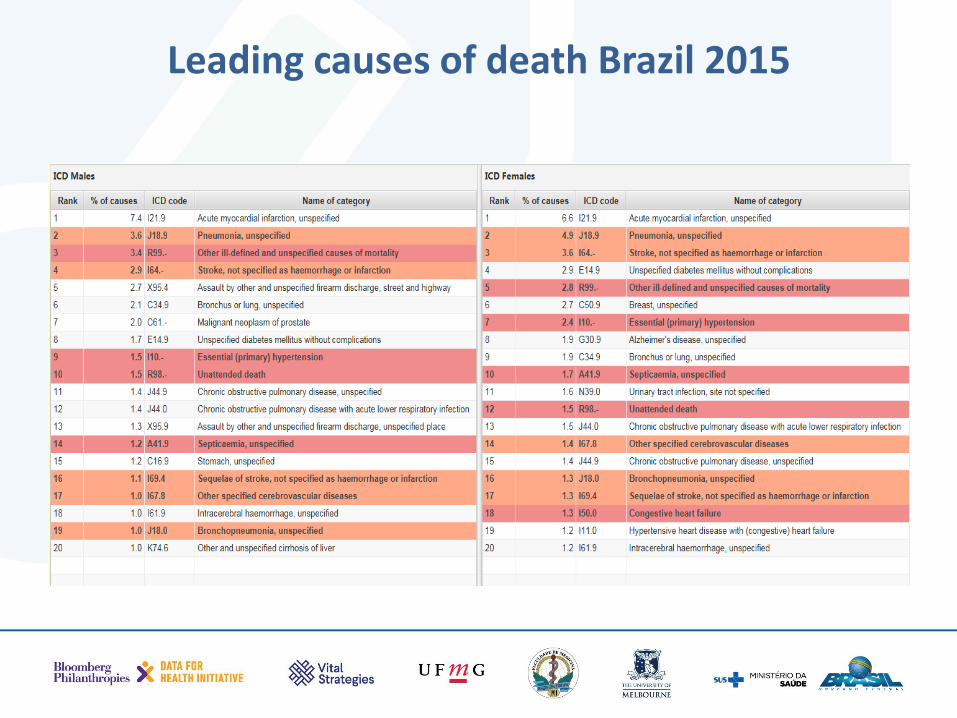
Leading causes of death Brazil 2015
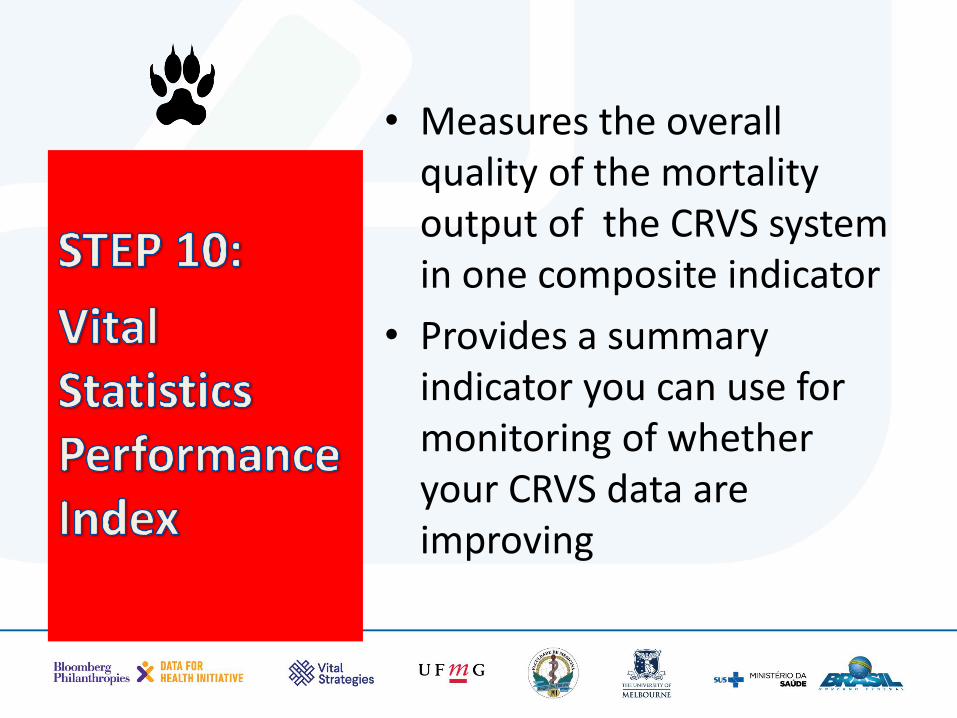
• Measures the overall quality of the mortality output of the CRVS system in one composite indicator
• Provides a summary indicator you can use for monitoring of whether your CRVS data are improving
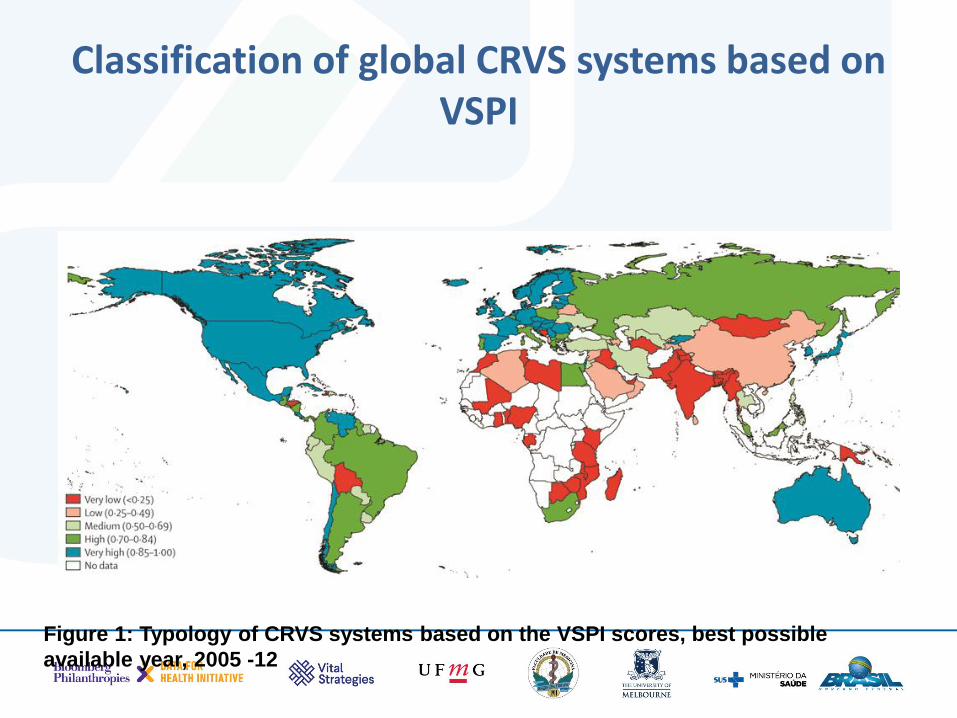
Classification of global CRVS systems based on VSPI
Figure 1: Typology of CRVS systems based on the VSPI scores, best possible
available year, 2005 -12
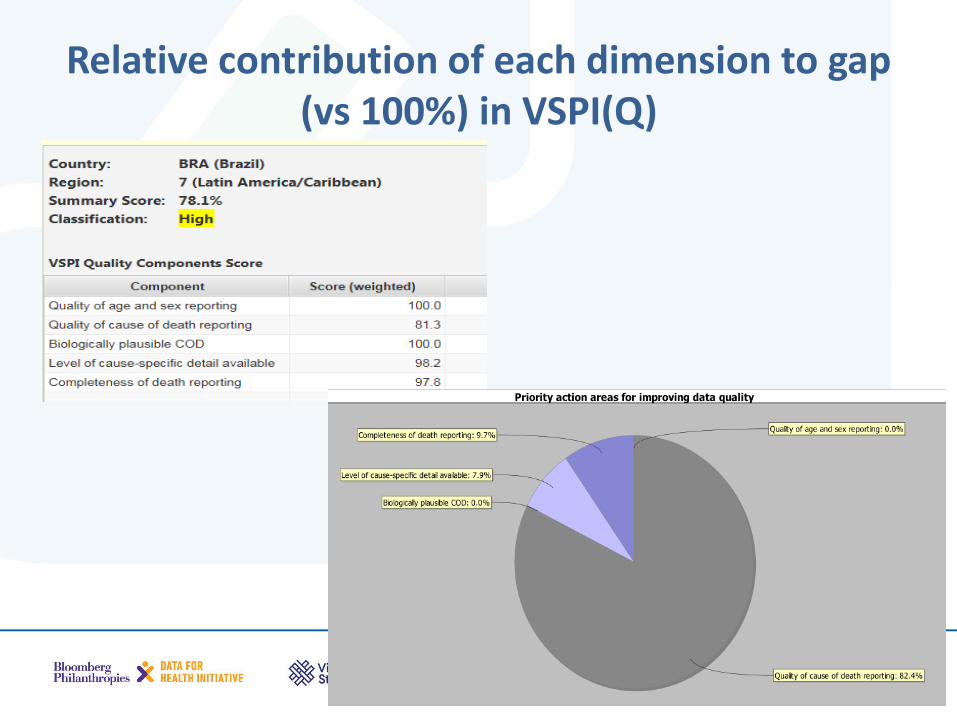
Relative contribution of each dimension to gap (vs 100%) in VSPI(Q)
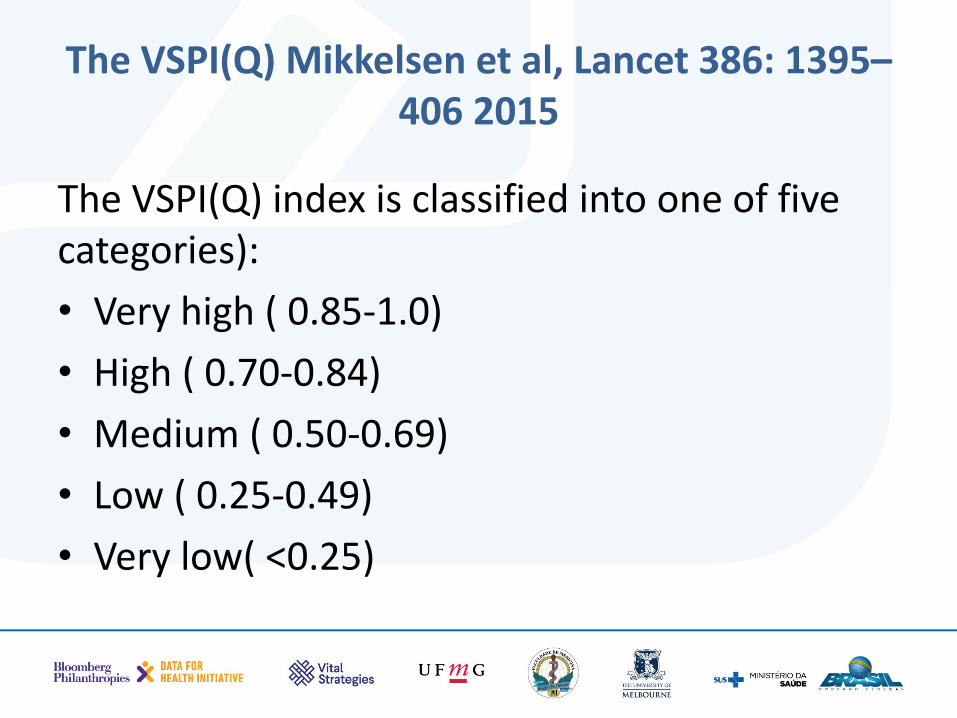
The VSPI(Q) Mikkelsen et al, Lancet 386: 1395–406 2015
The VSPI(Q) index is classified into one of five categories):
• Very high ( 0.85-1.0)
• High ( 0.70-0.84)
• Medium ( 0.50-0.69)
• Low ( 0.25-0.49)
• Very low( <0.25)