
THE ACCURACY OF TECHNICAL ANALYSIS
IN PREDICTING STOCK PRICE
SKRIPSI
Presented in partial fulfillment of the requirements for
The Bachelor’s Degree in Accounting
By:
Andre Yosua Federik Korengkeng
008201500071
FACULTY OF BUSINESS
ACCOUNTING STUDY PROGRAM
PRESIDENT UNIVERSITY
CIKARANG, BEKASI
2019

i

ii
ACKNOWLEDGEMENT
First, i put my highest gratitude to Jesus Christ for His grace, guidance,
and strength so i can finish my thesis with the title “The Accuracy of
Technical Analysis in Predicting Stock Price”. The author also would like
to thank everybody who has supported, contributed, and guided me until
the thesis can be finished. The thank is to:
a. My parents in Samarinda and my family as whole. I would like to
thank for the support, love, and encourage.
b. Mrs. Andi Ina Yustina as the head of accounting study program who
always encourage me and other friends in finishing the thesis.
c. Mr Josep Ginting as my thesis advisor who give me guidance and
encourage to finishing my thesis.
d. All accounting and faculty of business’s staff or lecturer who teach me
since beginning of the semester and helping me in doing thesis.
e. Putu Chantika Putri Dhammayanti who give her love and support for
me in doing my thesis
f. Nico, Michelle Devita, Novia Amanda, and all friends under thesis
advisor Mr Josep Ginting who support me
g. All my friends in President University especially my friend from
accounting major who support me in finishing thesis.
h. PT Mirae Asset Sekuritas who provides me data for researcher by free
access for public who want to use their application (HOTS).

iii
TABLE OF CONTENTS

iv
TABLE OF CONTENTS
DECLARATION OF ORIGINALITY .................................................................... i
ACKNOWLEDGEMENT ...................................................................................... ii
PANEL OF EXAMINER APPROVAL ................................................................ iii
TABLE OF CONTENTS ....................................................................................... iv
LIST OF TABLES ............................................................................................... viii
LIST OF FIGURES ............................................................................................... xv
ABSTRACT ......................................................................................................... xvi
INTISARI ............................................................................................................ xvii
CHAPTER I INTRODUCTION .............................................................. 1 I.1 Research Background ............................................. 1
I.2 Research Problem ................................................... 3
I.3 Research Objective ................................................. 3
I.4 Research Limitation ................................................ 4
I.5 Research Benefit ..................................................... 4
CHAPTER II THEORITICAL FRAMWORK ...................................... 6 II.1 Technical Indicator ................................................. 6
II.1.1 Moving Average........................................... 6
II.1.1.1 Simple Moving Average .................. 7
II.1.1.2 Weighted Moving Average .............. 7
II.1.1.3 Exponential Moving Average .......... 8
II.1.2 Bollinger Band ............................................. 9
II.1.3 MACD ........................................................ 10
II.1.4 OBV (On Balance Volume) ....................... 11
II.1.5 Positive Volume Index ............................... 12
II.1.6 Negative Volume Index ............................. 13
II.1.7 Relative Strength Index .............................. 13
II.1.8 Relative Momentum Index ......................... 14
II.1.9 Relative Volatility Index ............................ 15
II.1.10 Stochastic Oscillator................................... 16
II.1.11 William %R ................................................ 17

v
II.1.12 ROC (Rate of Change) ............................... 17
II.1.13 ADX (Average Directional Index) ............. 18
II.2 Dow Theory .......................................................... 19
II.3 Random Walk Theory .......................................... 20
II.4 Efficient Market Hypothesis ................................. 21
CHAPTER III RESEACRCH METHODOLOGY ................................ 24 III.1 Data Collection and Processing ............................ 24
III.2 Variable and Measurement .................................. 26
III.3 Research Model .................................................... 28
CHAPTER IV RESULT ............................................................................ 29 IV.1 Data Analysis Result .......................................................... 29
IV.1.1 PT Adhi Karya Tbk (ADHI) ................................. 29
IV.1.2 PT Adaro Energy Tbk (ADRO) ........................... 31
IV.1.3 PT AKR Corporation Tbk (AKRA) ..................... 33
IV.1.4 PT Aneka Tambang (PERSERO) Tbk (ANTM) .. 34
IV.1.5 PT Astra International Tbk (ASII) ....................... 36
IV.1.6 PT Bank Central Asia Tbk (BBCA) ..................... 37
IV.1.7 PT Bank Negara Indonesia (PERSERO) Tbk (BBNI) .................................................................. 39
IV.1.8 PT Bank Rakyat Indonesia (PERSERO) Tbk (BBRI) .................................................................. 41
IV.1.9 PT Bank Tabungan Negara (PERSERO) Tbk (BBTN) ................................................................. 42
IV.1.10 PT Bank Jawa Barat dan Banten Tbk (BJBR) ...... 43
IV.1.11 PT Sentul City Tbk (BKSL) ................................. 45
IV.1.12 PT Bank Mandiri (PERSERO) Tbk (BMRI) ........ 46
IV.1.13 PT Barito Pasific Tbk (BRPT) .............................. 48
IV.1.14 PT Bumi Serpong Damai Tbk (BSDE) ................. 49
IV.1.15 PT Elnusa Tbk (ELSA) ......................................... 51
IV.1.16 PT XL Axiata Tbk (EXCL) .................................. 52
IV.1.17 PT Gudang Garam Tbk (GGRM) ......................... 54

vi
IV.1.18 PT H.M Sampoerna Tbk (HMSP) ........................ 55
IV.1.19 PT Indofood CBP Sukses Makmur Tbk (ICBP) ... 57
IV.1.20 PT Vale Indonesia Tbk (INCO) ............................ 58
IV.1.21 PT Indofood Sukses Makmur Tbk (INDF) ........... 60
IV.1.22 PT Indika Energy Tbk (INDY) ............................. 61
IV.1.23 PT Indah Kiat Pulp & Paper Tbk (INKP) ............. 63
IV.1.24 PT Indocement Tunggal Prakasa Tbk (INTP) ...... 64
IV.1.25 PT Indo Tambangraya Mega Tbk (ITMG) ........... 65
IV.1.26 PT Jasa Marga Tbk (JSMR) .................................. 67
IV.1.27 PT Kalbe Farma Tbk (KLBF) ............................... 68
IV.1.28 PT Lippo Karawaci Tbk (LPKR) .......................... 70
IV.1.29 PT Matahari Departement Store Tbk (LPPF) ....... 71
IV.1.30 PT Medco Energi Internasional Tbk (MEDC)...... 73
IV.1.31 PT Media Nusantara Citra Tbk (MNCN) ............. 74
IV.1.32 PT Perusahaan Gas Negara (PERSERO) Tbk (PGAS) ................................................................. 75
IV.1.33 PT Tambang Batu Bara Bukit Asam (PERSERO) Tbk (PTBA) ......................................................... 77
IV.1.34 PT Perusahaan Pembangunan (PERSERO) Tbk (PTPP) .................................................................. 78
IV.1.35 PT Surya Citra Media Tbk (SCMA) ..................... 80
IV.1.36 PT Semen Indonesia (PERSERO) Tbk (SMGR) .. 81
IV.1.37 PT Sri Rejeki Isman Tbk (SRIL) .......................... 83
IV.1.38 PT Sawit Sumbermas Sarana Tbk (SSMS) ........... 84
IV.1.39 PT Telekomunikasi Indonesia (PERSERO) Tbk (TLKM) ................................................................ 86
IV.1.40 PT Chandra Asri Petrochemical Tbk (TPIA)........ 87
IV.1.41 PT United Tractor Tbk (UNTR) ........................... 89
IV.1.42 PT Unilever Indonesia Tbk (UNVR) .................... 90
IV.1.43 PT Wijaya Karya (PERSERO) Tbk (WIKA) ....... 92
IV.1.44 PT Waskita Beton Precast Tbk (WSBP) ............... 93
IV.1.45 PT Waskita Karya (WSKT) .................................. 94
IV.2 Emperical Test ........................................................... 95

vii
IV.2 Result Summary ......................................................... 96
CHAPTER V CONCLUSION, LIMITATIONS AND RECOMMENDATIONS ............................................................. 98 V.1 Conclusion ......................................................................... 98
V.2 Limitation ........................................................................... 99
V.3 Recommendation................................................................ 99
Appendix ...................................................................................................... 101 References ...................................................................................................... 148

viii
LIST OF TABLES
Table 2.1. Calculation of WMA 5 days
Table 2.2. Calculation of EMA
Table 3.1 The company used as sample
Table 4.1a. Result R2 of ADHI stock price
Table 4.1b. Result ANOVA of ADHI stock price
Table 4.1c. P-value of technical indicators on ADHI stock
Table 4.2a. Result R2 of ADRO stock price
Table 4.2b. Result ANOVA of ADRO stock price
Table 4.2c. p-value of technical indicators on ADRO stock
Table 4.3a. Calculation value R for AKRA
Table 4.3b. Result ANOVA of AKRA stock price
Table 4.3c. P-value of technical indicators on AKRA stock price
Table 4.4a. Calculation value R for ANTM
Table 4.4b. Result ANOVA of ANTM stock price
Table 4.4c. P-value of technical indicators on ANTM stock price
Table 4.5a. Calculation value R for ASII
Table 4.5b. Result ANOVA of ASII stock price
Table 4.5c. p-value of ASII stock price
Table 4.6a. Calculation value R for BBCA
Table 4.6b. Result ANOVA of BBCA stock price
Table 4.6c. p-value of BBCA stock price

ix
Table 4.7a. Calculation value R for BBNI
Table 4.7b. Result ANOVA of BBNI stock price
Table 4.7c. p-value of BBNI stock price
Table 4.8a. Calculation value R for BBRI
Table 4.8b. Result ANOVA of BBRI stock price
Table 4.8c. p-value of BBRI stock price
Table 4.9a. Calculation value R for BBTN
Table 4.9b. Result ANOVA of BBTN stock price
Table 4.9c. p-value of BBTN stock price
Table 4.10a. Calculation value R for BJBR
Table 4.10b. Result ANOVA of BJBR stock price
Table 4.10c. p-value of BJBR stock price
Table 4.11a. Calculation value R for BKSL
Table 4.11b. Result ANOVA of BKSL stock
Table 4.11c p-value of BKSL stock price
Table 4.12a. Calculation value R for BMRI
Table 4.12b. Result ANOVA of BMRI stock price
Table 4.12c. p-value of BMRI stock price
Table 4.13a. Calculation value R for BRPT
Table 4.13b. Result ANOVA of BRPT stock price
Table 4.13c. p-value of BRPT stock price
Table 4.14a. Calculation value R for BSDE

x
Table 4.14b. Result ANOVA of BSDE stock price
Table 4.14c p-value of BSDE stock price
Table 4.15a. Calculation value R for ELSA
Table 4.15b. Result ANOVA of ELSA stock price
Table 4.15c. p-value of ELSA stock price
Table 4.16a. Calculation value R for EXCL
Table 4.16b Result ANOVA of EXCL stock price
Table 4.16c p-value of EXCL stock price
Table 4.17a Calculation value R for GGRM
Table 4.17b. Result ANOVA of GGRM stock price
Table 4.17c. p-value of GGRM stock price
Table 4.18a. Calculation value R for HMSP
Table 4.18b. Result ANOVA of HMSP stock price
Table 4.18c. p-value of HMSP stock price
Table 4.19a. Calculation R, R Square, Adjusted R Square for ICBP
Table 4.19b. Result ANOVA of ICBP stock price
Table 4.19c. p-value of ICBP stock price
Table 4.20a. Calculation R, R Square, Adjusted R Square for INCO
Table 4.20b. Result ANOVA of INCO stock price
Table 4.20c. p-value of INCO stock price
Table 4.21a. Calculation R, R Square, Adjusted R Square for INDF
Table 4.21b. Result ANOVA of INDF stock price

xi
Table 4.21c. p-value of INDF stock price
Table 4.22a. Calculation R, R Square, Adjusted R Square for INDY
Table 4.22b. Result ANOVA of INDY stock price
Table 4.22c. p-value of INDY stock price
Table 4.23a. Calculation R, R Square, Adjusted R Square for INKP
Table 4.23b. Result ANOVA of INKP stock price
Table 4.23c. p-value of INKP stock price
Table 4.24a. Calculation R, R Square, Adjusted R Square for INTP
Table 4.24b. Result ANOVA of INTP stock price
Table 4.24c. p-value of INTP stock price
Table 4.25a. Calculation R, R Square, Adjusted R Square for ITMG
Table 4.25b. Result ANOVA of ITMG stock price
Table 4.25c. p-value of ITMG stock price
Table 4.26a. Calculation R, R Square, Adjusted R Square for JSMR
Table 4.26b. Result ANOVA of JSMR stock price
Table 4.26c. p-value of JSMR stock price
Table 4.27a. Calculation R, R Square, Adjusted R Square for KLBF
Table 4.27b. Result ANOVA of KLBF stock price
Table 4.27c. p-value of KLBF stock price
Table 4.28a. Calculation R, R Square, Adjusted R Square for LPKR
Table 4.28b. Result ANOVA of LPKR stock price
Table 4.28c. p-value of LPKR stock price

xii
Table 4.29a. Calculation R, R Square, Adjusted R Square for LPPF
Table 4.29b. Result ANOVA of LPPF stock price
Table 4.29c. p-value of LPPF stock price
Table 4.30a. Calculation R, R Square, Adjusted R Square for MEDC
Table 4.30b. Result ANOVA of KLBF stock price
Table 4.30c. p-value of MEDC stock price
Table 4.31a. Calculation R, R Square, Adjusted R Square for MNCN
Table 4.31b. Result ANOVA of MNCN stock price
Table 4.31c. p-value of MNCN stock price
Table 4.32a. Calculation R, R Square, Adjusted R Square for PGAS
Table 4.32b. Result ANOVA of PGAS stock price
Table 4.32c. p-value of PGAS stock price
Table 4.33a. Calculation R, R Square, Adjusted R Square for PTBA
Table 4.33b. Result ANOVA of PTBA stock price
Table 4.33c. p-value of PTBA stock price
Table 4.34a. Calculation R, R Square, Adjusted R Square for PTPP
Table 4.34b. Result ANOVA of PTPP stock price
Table 4.34c. p-value of PTPP stock price
Table 4.35a. Calculation R, R Square, Adjusted R Square for SCMA
Table 4.35b. Result ANOVA of SCMA stock price
Table 4.35c. p-value of SCMA stock price
Table 4.36a. Calculation R, R Square, Adjusted R Square for SMGR

xiii
Table 4.36b. Result ANOVA of SMGR stock price
Table 4.36c. p-value of SMGR stock price
Table 4.37a. Calculation R, R Square, Adjusted R Square for SRIL
Table 4.37b. Result ANOVA of SRIL stock price
Table 4.37c. p-value of SRIL stock price
Table 4.38a. Calculation R, R Square, Adjusted R Square for SSMS
Table 4.38b. Result ANOVA of SSMS stock price
Table 4.38c p-value of SSMS stock price
Table 4.39a. Calculation R, R Square, Adjusted R Square for TLKM
Table 4.39b. Result ANOVA of TLKM stock price
Table 4.39c. p-value of TLKM stock price
Table 4.40a. Calculation R, R Square, Adjusted R Square for TPIA
Table 4.40b. Result ANOVA of TPIA stock price
Table 4.40c. p-value of TPIA stock price
Table 4.41a. Calculation R, R Square, Adjusted R Square for UNTR
Table 4.41b. Result ANOVA of UNTR stock price
Table 4.41c. p-value of UNTR stock price
Table 4.42a. Calculation R, R Square, Adjusted R Square for UNVR
Table 4.42b. Result ANOVA of UNVR stock price
Table 4.42c. p-value of UNVR stock price
Table 4.43a. Calculation R, R Square, Adjusted R Square for WIKA
Table 4.43b. Result ANOVA of PTBA stock price

xiv
Table 4.43c. p-value of WIKA stock price
Table 4.45a. Calculation R, R Square, Adjusted R Square for WSKT
Table 4.45b. Result ANOVA of PTBA stock price
Table 4.45c. p-value of WSKT stock price

xv
LIST OF FIGURES
Figure 2.1 Bollinger band of PT Adhi Karya TBK
Figure 2.2 Chart Moving Average Convergence Divergence for BBCA (PT Bank
Central Asia TBK). The red line is the MACD line and the dot purple
line is the signal line
Figure 2.3 Chart Relative Strength Index for WSKT (PT Waskita Karya TBK).
The blue line is the RSI line and the dot purple line is the signal line.
Figure 2.4 Chart of the stochastic oscillator of PT Waskita Karya Tbk
Figure 2.5 Chart ADX (Average Directional Index). The red line is the ADX line,
the blue line is the negative directional index, and the purple line is the
positive directional index.

xvi
ABSTRACT
Technical analysis has been used publicly by market participant to analyze the
stock price to forecast the stock price in near future. It was done by equity
researcher and the result of technical analysis is the prediction of the stock price
for next day with the recommendation from equity researcher (buy, hold, sell).
The issue is the result of technical analysis which is foresight of stock price for
tomorrow can be wrong and leads to take wrong recommendation. This paper
tests the technical analysis in predicting the stock price and companies in LQ45
become as sample. The result shows the technical analysis can be used in
predicting the stock price. However, the researcher give recommendation to not
fully used technical analysis itself. The researcher recommends to do fundamental
analysis in order to consider fundamental aspect such as macroeconomy, industry
overview, company’s performance, etc.
Keywords: Technical Analysis, Stock Price, Predicting Stock Price, Market
Capitalization

xvii
INTISARI
Analisis teknikal sudah dipakai oleh para pihak yang berhubungan dengan pasar
modal untuk memprediksi harga saham di masa depan. Analisis teknikal
dilakukan oleh analis ekuitas perusahaan sekuritas dan hasil dari analisis adalah
pandangan tentang harga saham hari selanjutnya beserta rekomendasi (beli, tahan,
jual). Permasalahan dari riset ini adalah analis teknikal bisa menghasilkan hasil
pandangan yang salah sehingga bisa membuat rekomendasi saham salah. Riset ini
dilakukan untuk menguji apakah analisis teknikal bisa dipakai dalam memprediksi
harga saham dan indeks LQ 45 adalah sampel untuk riset ini. Kesimpulan dari
riset ini adalah analisis teknikal bisa dipakai untuk memprediksi harga saham.
Akan tetapi, penulis menyarankan untuk tidak hanya menggunakan analisis
teknikal dalam mengambil keputusan investasi. Penulis menyarankan untuk
melakukan analisis fundamental juga untuk melihat berbagai aspek seperti
makroekonomi, pandangan terhadap industri, kinerja perusahaan, dan aspek yang
berkaitan dengan investasi lainnya.
Kata Kunci: Analisis Teknikal, Harga Saham, Prediksi Harga Saham,
Kapitalisasi Pasar

Page | 1
CHAPTER I
INTRODUCTION
I.1 RESEARCH BACKGROUND
Market participant and researchers always find the way to predict
the future stock price in order to use it in maximizing the gain. There are
two ways are commonly used in security market which are the
fundamental analysis and technical analysis. The technical analysis has an
assumption that price pattern will recur and the assumption of fundamental
analysis is the price will move to its intrinsic value.
The technical analysis has assumption that the historical price has
pattern that will recur in the future and it does not consider the
fundamental aspect such as macroeconomic, industry overview, and
condition of company. The oldest theory for technical analysis is Dow
Theory which was from Charles Dow published in 1922. Dow Theory
stated that the stock price has three movement stock price and market
discount everything that will be explained in chapter two. There are many
indicators in the technical analysis such as moving average, relative
strength index, MACD (Moving Average Convergence Divergence) and
other indicators. According to Metastock (2009), the technical analysis has
some categories which are trend, volatility, momentum, cycle, market
strength, and support and resistance.

Page | 2
Fundamental analysis is another analysis to predict the price. This
method valuates the fair value of the company and assume that the stock
price will tend to its fair value. The fundamental analysis considers the
company’s condition, macroeconomy, industry overview, etc. The issue of
the fundamental analysis is every analyst has different view in calculating
the fair value of the company because every analyst has different
assumption used on the calculation of fair value. It leads to different result
for every analyst.
Both analysis, especially the technical analysis, are used for
predicting the stock movement in the future and it mainly is done by the
equity analyst in broker firm. The result of analysis is published to the
public by media and equity analyst gives the recommendation what
investor should do to respond the future stock movement. However, the
result of analysis can be wrong. If the result of the analysis fails to predict
the stock price, the recommendation given leads to the false decision taken
by investor who follow the recommendation.
This research focuses on the technical analysis because technical
analysis can show same chart of technical indicators. Fundamental
analysis can have different result due to different perspective of equity
analyst.
There are previous researches related to technical analysis.
According to Irwin and Park (2007), many academics consider the

Page | 3
technical analysis as pseudoscience meaning it is mistakenly practice
based on the scientific result. There is random walk theory by Eugene
Fama (1965) that stated the stock price cannot be predicted because the
price moves randomly. However, there is previous research about the
accuracy of technical analysis done on Macedonian Stock Market. It was
done by Zoran Ivanovski, Nadica Ivanovska, and Zoran Narasanov on
2017. The result shows that the technical analysis can be used to predict
the stock price movement. Therefore, this research does the test of
accuracy of technical analysis in predicting the stock price on Indonesian
stock market to look the accuracy of prediction from technical analysis.
I.2 RESEARCH PROBLEM
The research problem is the accuracy of technical analysis in
predicting the stock price. The technical analysis can be wrong resulting to
the wrong investment action to market participation and investor and
trader can have loss on their value of asset. The technical analysis also is
considered by many scientists as pseudoscience (Park, 2007) meaning it is
mistakenly practice according the scientific result.
I.3 RESEARCH OBJECTIVE
This research has objectives to be completed:
1. To examine the technical analysis in predicting the stock price in
every public company on this research.

Page | 4
2. To find out which technical indicator in every public company that
is able to predict stock price movement.
I.4 RESEARCH LIMITATION
One of method in technical analysis which is pattern recognition
such as Double top, Double bottom, Head & Shoulder Top, etc. However,
this research uses technical indicator such as Moving Average, Bollinger
Band, Relative Strength Index, and another indicator that will be
mentioned in chapter 3. Researcher uses the technical indicators because
the technical indicators provide the number that will be used for statistical
analysis. Another reason is the technical indicator is easy to interpret of
sell signal and buy signal or overbought and oversold. Technical analysis
is not used to predict the stock price as value but technical analysis is used
to predict the movement. It is because the technical analysis has
assumption that the price pattern will be exist.
This research focus on Indonesian stock market and use the public
listed companies that become as member of LQ45 period of August 2018
– January 2019 as samples. The reason is LQ45 is the most liquid index in
Indonesia.
I.5 RESEARCH BENEFIT
This research gives the contribution to knowledge related to financial and
the stock market. It will be beneficial to:
1. Capital market researcher

Page | 5
This research may become an evidence about the accuracy of
technical analysis in predicting the stock price on Indonesian stock
market.
2. Practitioners in the capital market
This research can give new references about the accuracy of
technical analysis on Indonesia stock exchange.
3. Public user
The public user on this context means it is for students who are
interested in the capital market, the new researcher who wants to
continue this topic, the candidate of new investor, and society as
general. This can be the new reference for the public to know the
technical analysis.

Page | 6
CHAPTER II
THEORETICAL FRAMEWORK
II.1 TECHNICAL INDICATOR
II.1.1 Moving Average
Moving average basically has same method calculation for
calculating the mean (For simple moving average). Moving means
that the variable used for calculation are always moved. In other
words, if the moving average is calculated for tomorrow, the
starting date for calculation are moved forward or the next date.
There are three methods used in the calculation of moving
average. There are simple moving average (SMA), weighted
moving average (WMA), and exponential moving average (EMA).
They have same interpretation on the sell signal and buy
signal. Sell signal appears when the stock price is below than the
moving average and vice versa. For time period used, the short
period can catch the signal but there will be whipsaw (false signal)
and to minimize the whipsaw, it uses longer period for moving
average. On this research, MA5 is used in the research because the
MA5 has responsive signal.

Page | 7
II.1.1.1 Simple Moving Average (SMA)
The simple moving average has calculation by
simply add all closing price on period chosen (For example
5 days). It means there is the total of five days of closing
price) and divided by time period used for calculation. It
has the same result by using mean calculation.
SMA = 𝑅𝑢𝑚 𝑜𝑜 𝐶𝑐𝑜𝑑𝑖𝑛𝐴 𝑃𝐴𝑖𝑐𝐴 𝑜𝑜 𝑛𝑢𝑚𝑏𝐴𝐴 𝑜𝑜 𝑑𝐴𝑑𝑑𝑁𝑢𝑚𝑏𝐴𝐴 𝑜𝑜 𝑑𝐴𝑑𝑑 𝑜𝑏𝑑𝐴𝐴𝐴𝐴𝑡𝑖𝑜𝑛
II.1.1.2 Weighted Moving Average (WMA)
The problem for using the simple moving average is
there is the delay of the signal. In order to overcome the
delay, the calculation use weighted moving average
The formula for calculating the weighted moving average
is:
WMA =
(𝑃𝐴𝑖𝑐𝐴 1 𝑥 𝑑𝐴𝑖𝐴ℎ𝑡 1)+(𝑃𝐴𝑖𝑐𝐴 2 𝑥 𝑑𝐴𝑖𝐴ℎ𝑡 2)+(𝑃𝐴𝑖𝑐𝐴 𝑛 𝑥 𝑑𝐴𝑖𝐴ℎ𝑡 𝑛)𝑇𝑜𝑡𝐴𝑐 𝑑𝐴𝑖𝐴ℎ𝑡 𝑢𝑑𝐴𝑑 𝑜𝑛 𝑜𝑏𝑑𝐴𝐴𝐴𝐴𝑡𝑖𝑜𝑛
Day Weight Price Weighted Price
1 1 25 25
2 2 26 52
3 3 28 84

Page | 8
Here is the illustration to the calculation by using the WMA for 5
days.
WMA = 40615
= 27.067
II.1.1.3 Exponential Moving Average (EMA)
Martin Pring (2014) stated that “Exponential
moving average is a shortcut to obtaining a form of
weighted MA”. The calculation requires exponent. The
different time period used is made exponent is different. As
the starting point of exponential moving average’s
calculation, it is needed to calculate the simple moving
average and the result of simple moving average become
the starting point of EMA. To calculate exponent, the
formula is on the below:
Exponent = 2Time period+1
For illustration, there is a table below to show how
calculate the EMA.
4 4 25 100
5 5 29 145
Total 15 133 406
Table 2.1 Calculation of WMA 5 days.

Page | 9
Date Price EMA previous week
Difference Exponent Exponent x Difference
EMA
1 99
8 100 99 1 0.1 +0.1 99.1
15 103 99.10 3.9 0.1 +0.39 99.49
22 102 99.49 2.51 0.1 +0.25 99.74
29 99 99.64 (0.64) 0.1 -0.06 99.68
II.1.2 Bollinger Bands
Bollinger band is one of the technical indicators for volatility.
Bollinger band found by John Bollinger in 1980. It has similarity
with envelope because, on the graph, there are the upper band and
lower band. Bollinger band is calculated using standard deviation.
Using two standard deviations, it ensures that 95% price will fall
between two trading bands (J. Murphy, 1999). If both bands are
wider, the volatility of stock price is higher. In another side, the
Lower Band Middle Band
Table 2.2 Calculation of EMA
Figure 2.1 Bollinger band of PT Adhi Karya TBK
Upper Band

Page | 10
bands are narrow, it shows that the volatility of the stock price is
lower. John Bollinger recommend for the time period for using in
the calculation which is MA-20
For calculating the Bollinger band, there are formulas to plot the
graph,
Middle Band: Moving Average of n-period
Upper Band: Middle band + 2 * n period standard deviation
Lower Band: Middle band + 2 * n period standard deviation
II.1.3 MACD (Moving Average Convergence Divergence).
MACD (Moving Average Convergence Divergence) is a
leading indicator (indicator which to read the momentum of
overbought and oversold) founded by Gerald Apple. It uses two
exponential moving average for calculation and subtracting the
longer period of moving average and shorten the period of moving
average. Generally, the combination for EMA is EMA-26 and
Figure 2.2 Chart Moving Average Convergence Divergence for BBCA (PT Bank Central Asia TBK). The purple line is the MACD line and the orange line is the signal line

Page | 11
EMA 12. There is a signal line by using EMA-9 (9 days). If the
EMA for the signal is faster than EMA-9, it will produce a
responsive signal but it will produce whipsaw.
To identify the buy and sell signal, the interpretation is as follow:
a. If MACD line resulting from subtracting the EMA-26 and
EMA-12 is higher than the signal line, it is buy signal.
b. In another side, if MACD line less that signal line, it is sell
signal.
II.1.4 OBV (On Balance Volume)
OBV (On Balance Volume) is founded by Woods and
Vignolia on 1940. They called it volume cumulative. On 1960, Joe
Granville introduces to the public about the OBV by publishing the
book with the title "New Strategy of Daily Stock Market Timing
for Maximum Profits".
For calculation, the OBV can be calculated by formula as
follow:
If the today closing price is higher than the previous closing price,
OBV = OBVt-1 +Volume
If the today closing price is equal than the previous closing price,
OBV = OBVt-1

Page | 12
If the today closing price is lower than the previous closing price,
OBV = OBVt-1
OBV can influence the price change. It usually used by the
investor to buy the one stock in order to increase the stock price.
Due to increasing the stock price, it will attract the public to buy
that. So, the result is the price and OBV go ahead. So, it means that
the OBV is on the rising trend if it reaches to the new peak and
OBV are on the falling if the successive price is lower than
previous stock price.
II.1.5 Positive Volume Index
Positive Volume Index (PVI) can be calculated if the today
volume of security is higher than the yesterday volume of the
security. If the today volume of security is equal or less than the
yesterday volume of security, the PVI is equal to previous PVI.
Formula:
According to Metastock (2009), rising price is relating to
rising volume, the PVI will generally trend upward.
If today volume is higher than yesterday volume,
PVI = (PVI t-1 + (C – Ct-1))/C t-1
PVIt-1: Yesterday PVI
C: Today Closing Price
Ct-1: Yesterday Closing Price

Page | 13
II.1.6 Negative Volume Index
Negative volume index is another side of the positive
volume index on the calculation. On PVI, PVI changes due to the
increase between the today volume of security and the previous
volume of the security. On negative volume index, it changes when
the today volume of security is lower than the previous volume of
the security.
Falling price is related to the falling volume, the NVI
usually show the trend downward. It means that if the NVI has
higher value, the stock price will fall.
II.1.7 Relative Strength Index (RSI)
RSI (Relative Strength Index) was developed by Wells
Wilder. It developed to become a momentum indicator to show
whether the security is overbought and oversold.
If today volume is lower than yesterday volume,
NVI = (NVI t-1 + (C – Ct-1))/C t-1
NVIt-1: Yesterday NVI
C: Today Closing Price
Ct-1: Yesterday Closing Price
RSI = 100 - 100𝑅𝑅
RS = 𝐴𝐴𝐴𝐴𝐴𝐴𝐴 𝑜𝑜 𝑛 𝑑𝐴𝑑𝑑 𝑢𝑢 𝑐𝑐𝑜𝑑𝐴
𝐴𝐴𝐴𝐴𝐴𝐴𝐴 𝑜𝑜 𝑛 𝑑𝐴𝑑𝑑 𝑑𝑜𝑑𝑛 𝑐𝑐𝑜𝑑𝐴

Page | 14
To do the interpretation of RSI, there are the upper level
and lower level. For default, the upper level is 70 and the lower
level 30. However, there are user who use the upper level is 80 and
lower level 20. If the RSI above upper level means overbought. If
the RSI is at bottom lower level means oversold. So, if the RSI
increasing, it indicates that the price is higher resulting from the
overbought. There will be the turning point or reversal if it reaches
above the upper level of RSI. It will turn down. If the RSI is going
down, it indicates the price of security turn down. But at some
point, if reaches at bottom of the lower level, there will be the
possibility to go high (Pring, 2014).
II.1.8 Relative Momentum Index (RMI)
RMI (Relative Momentum Index) was developed due to
insensitivity RSI and frustrated with its inconsistent oscillation
Figure 2.3: Chart Relative Strength Index for WSKT (PT Waskita Karya TBK). The blue line is the RSI line and the dot purple line is the signal line.

Page | 15
between overbought and oversold level. RMI was developed by
Roger Altman by added momentum component to RSI. The chart
of RMI is identical with the relative strength index's chart.
The interpretation of RMI has some similarity to RSI. For
oversold and overbought, the upper level used is 70-90 and lower
level used is 10-30. If the RMI above the overbought, there will be
in question turning point or the price probably goes down and so
the RMI down below oversold do.
If the RMI is above the overbought, there will be the
indication of reversal resulting the stock price will fall and If the
RMI is below than oversold, there will be the indication for rising
the stock price.
II.1.9 Relative Volatility Index
The Relative Volatility Index (RVI) was developed by
Donald Dorsey and originally introduced on Technical Analysis of
Stock and Commodities (TASC) magazine. The revision is covered
in the September 1995. The calculation has similarity to the RSI
(Relative Strength Index) but RVI uses the standard deviation of
datil stock price instead of price changes.
The rule for buy and sell signal according to Metastock (2009) are:
a. Act to buy signal when RVI > 50
b. Act to sell signal when RVI < 50

Page | 16
II.1.10 Stochastic Oscillator
George Lane is the inventor of the theory behind the
stochastic oscillator both stochastic fast and stochastic slow. There
are two line plotted which are %K and %D line.
%K = 100 [(C – LnC) / (Hn – Ln)]
%D = 100 x (Ha / La)
Calculation %D using total numerators on %K
Calculation %D uses total numerators on %K formula more than
1 period and total denominators on %K's formula more than 1
C: Closing Price
LnC: Lowest Closing Price on five days period
Ln: Lowest Low for five trading period
Hn: Highest high for five trading period
Ha: the n-period sum of (C – Ln )
La: the n-period sum of ( Hn – Ln )
Figure 2.4 Chart of the stochastic oscillator of PT Bank Central Asia Tbk

Page | 17
period. It is used for make slowed stochastic version in order to
get a more accurate signal.
The buy and sell signal have similarity to RSI (Relative
Strength Index). The level above 80 is for overbought and the level
below 20 is for oversold. If the stock price indicates the overbought
or oversold, there is possibility of reversal resulting the price will
turn re
II.1.11 William %R
William %R has similarity to stochastic for the calculation
and the analysis. It uses level 80/20. The difference is level of
above 80 is oversold and level of below 20 is overbought. It is
upside down with the other indicator such as stochastic, RSI
(Relative Strength Index), and RMI (Relative Momentum Index).
So, if the William %R has higher reading, it means the oversold or
the price goes down. On another side, if the William %R has lower
reading, it means overbought or the price goes up. But, the reversal
after on the overbought and oversold is exist on the William %R.
II.1.12 ROC (Rate of Change)
ROC (Rate of Changes) is the simplest way to measure the
momentum. ROC can be calculated by current price divided price
on the past (10 weeks ago, 52 weeks ago, etc). If the ROC is rising
(100 for percentage scaling and 0 using the plus and minus

Page | 18
scaling), it is interpreted as a bullish factor and if the ROC is
falling, it interpreted as a bearish factor. It simply has a positive
correlation between the price of security and ROC. It is because if
the current price higher than the previous price, the ROC is high
and so the current price is lower than the previous price.
II.1.13 ADX (Average Directional Index)
ADX (Average Directional Index) was developed by J.
Welles Wilder in 1978. It is trend strength indicator. To calculate
the ADX, it is needed to know the directional movement (+DM
and -DM).
UpMove = Today High – Yesterday High
DownMove = Yesterday Low – Today Low
If UpMove > DownMove or UpMove > 0, then +DM = UpMove
If DownMove > UpMove or DownMove > 0, then -DM =
DownMove
Figure 2.5: Chart ADX (Average Directional Index). The Black line is the ADX line, the red line is the negative directional index, and the green line is the positive directional index.

Page | 19
After selecting the time period (Normally 14 days), then calculate
+DI and -DI,
+DI = 100 times EMA of +DM divided by Average True Range
(High – Low)
-DI = 100 times EMA of -DM divided by Average True Range
(High – Low)
Then ADX calculated by using formula,
ADX = 100 times EMA of absolute value of (+DI - -DI) divided
by (+DI + -DI)
The ADX is not showing the trend direction but is about the
intensity of move from a directional point of view. Low reading in
the ADX indicates a lack of directional movement (Pring, 2014).
II.2 Dow Theory
Dow theory was introduced by Charles H Dow and publish
on the book "The Stock Barometer" created by W.D Hamilton in
1922. The theory state there are three movements which are the
primary movement, secondary movement, and minor movement.
Primary movement is movement covering at least four years that
has two movements which are bullish (upward price movement)
and bearish (downward price movement) and the prediction is
made on

Page | 20
this movement. Secondary movement is the decline movement on
the bullish trend and inclines movement on the bearish trend
(Pring, 2014) and prior period time is two weeks up to month or
more. Minor movement is covering day to day (Hamilton, 1922)
Dow theory also tells about the market discount everything.
It means that all the judgement and consideration on the trading
process is reflected on the stock price.
II.3 Random Walk Theory
The theory random walk theory starts with the premise of
"efficient" market. According to the Eugene Fama (1965), the
meaning of efficient is "a market where there is the large number
of rational, profit-maximizers actively competing, with each trying
to predict future market values of individual securities, and when
important current information is almost freely available to all
participant". So, if the market is efficient, the actual price has
reflected current important information that has happened. Due to
there is the difference in interpreting information from each
analyst, the intrinsic value will have the different value with other
fundamental analyst resulting disagreement each market
participant. New information that could be related to the company
can result in changes in intrinsic value and will adjust

Page | 21
"instantaneously". But, the vagueness around the new information
can lead result in adjustment
instantaneously to intrinsic value and there are two implications.
First actual price will initially over adjust to changes in intrinsic
value as often as they will under adjust or the lag of adjustment of
actual price to new intrinsic value will be independent. The theory
of random walk implies that past history cannot use to predict
future price. But practically, it does not fit the facts exactly as long
as there is information that can sufficient to price changes.
The random walk theory is supported by researchers such
as Cootner, Fama, Kendall, and Moore. However, the chartist did
not agree about the result and consider the test is not adequate. The
problem is the simple linear relationship is not too complex to test
the complicated pattern.
II.4 Efficient Market Hypothesis
After the Random Walk Theory was introduced in 1965,
Eugene Fama introduced new research which is efficient market
hypothesis. It assumes that information can be used to predicting
the security price due to price is fully reflected information. There
are three forms of information reflect on the security price which
are weak form, semi-strong form, and strong form. But before
explaining the three form, there are market conditions for efficient

Page | 22
market which are (i) there is no cost of transaction in trading
securities, (ii) all information is available to all market participants,
and (iii) all agree on the implications of current information for the
current price and distributions of the future prices of each security
(Fama, 1970)
Weak form means that the information set is historical price
or return. There is evidence by Eugene Fama that there is positive
dependence in day-to-day price changes and return in common
stock and it indicates that weak form of the efficient market
hypothesis is supported. Another evidence was done by Alexander
(1961) which explained did a test on daily price data from 1897
until 1959. The result is Alexander's result denied the
independence assumption of random walk (Eugene Fama,1970).
Researcher such as Fama - Blume has the same support that they
compare the profitability by this filter on individual stock of Dow-
Jones Industrial Average.
Semi-strong tells about the price will adjust to all public
information available such as financial statement, corporate action,
the news about company, etc. Fama, Fisher, Jensen, and Roll
(1969) show their research that the announcement of stock spilt
that effect to payment dividend is on average fully reflected the
price of the stock split at the time of the split. Another research was
done by Ball and Brown (1969), Waud, and Scholes (1969) to

Page | 23
examine the public announcement toward the stock return and they
support the semi-strong.
Strong form is information set from all information that
gets from the insider or monopolistic information. It is supported
by research from Niederhoffer and Osborne that find the specialist
on the major of security exchange has monopolistic access to
information on unexecute limit orders and used it for generating
trading profit (Fama, 1970)

Page | 24
CHAPTER III
RESEARCH METHODOLOGY
III.1 Data Collection and Processing
Collecting process started at the beginning of August 2018. The
time period for data used is 31/07/2015 - 31/07/ 2018 to look bigger
picture of technical indicators for each sample. The sample are companies
in LQ45. The consideration of taking companies on LQ45 as sample is the
LQ45 contains the most liquid companies and according to Indonesia
Stock Exchange, the LQ45 has 70% of the market capitalization in
Indonesia. There are 45 companies in the LQ45 but for this research
purpose, researcher use forty-four companies due to one of the companies
(PT Waskita Beton Precast) does not have data from July 31st 2015. The
samples used in the research are:
No Code Company 1 ADHI Adhi Karya (Persero) Tbk 2 ADRO Adaro Energy Tbk 3 AKRA AKR Corporation Tbk 4 ANTM Aneka Tambang Tbk 5 ASII Astra International Tbk 6 BBCA Bank Central Asia 7 BBNI Bank Negara Indonesia (Persero) Tbk 8 BBRI Bank Rakyat Indonesia (Persero) Tbk 9 BBTN Bank Tabungan Negara (Persero) Tbk
10 BJBR BPD Jawa Barat dan Banten Tbk 11 BKSL Sentul City Tbk 12 BMRI Bank Mandiri (Persero) Tbk 13 BRPT Barito Pasific 14 BSDE Bumi Serpong Damai Tbk

Page | 25
15 ELSA Elnusa Tbk 16 EXCL XL Axiata Tbk 17 GGRM Gudang Garam Tbk 18 HMSP HM Sampoerna Tbk 19 ICBP Indofood CBP Sukses Makmur Tbk 20 INCO Vale Indonesia Tbk 21 INDF Indofood Sukses Makmur Tbk 22 INDY Indika Energy Tbk 23 INKP Indah Kiat Pulp & Paper Tbk 24 INTP Indocement Tunggal Prakarsa Tbk 25 ITMG Indo Tambangraya Megah Tbk 26 JSMR Jasa Marga (Persero) Tbk 27 KLBF Kalbe Farma Tbk 28 LPKR Lippo Karawaci Tbk 29 LPPF Matahari Department Store Tbk 30 MEDC Medeo Energi Internasional Tbk 31 MNCN Media Nusantara Citra Tbk 32 PGAS Perusahaan Gas Negara (Persero) Tbk 33 PTBA Tambang Batubara Bukit Asam (Persero) Tbk 34 PTPP PP (Persero) Tbk 35 SCMA Surya Citra Media Tbk 36 SMGR Semen Indonesia (Persero) Tbk 37 SRIL Sri Rejeki Isman Tbk 38 SSMS Sawit Sumbermas Sarana Tbk 39 TLKM Telekomunikasi Indonesia (Persero) Tbk 40 TPIA Chandra Asri Pertochemical Tbk 41 UNTR United Tractors Tbk 42 UNVR Unilever Indonesia 43 WIKA Wijaya Karya (Persero) 44 WSKT Waskita Karya (Persero) Tbk
The secondary data that are collected are historical price and
number of technical indicators. Technical indicators are shown in the form
of graphic but on this research, it is required to use on the form of the
number for using statistical analysis. The source of technical indicators
and historical price are from the application named HOTS owned by PT
Table 3.1 The companies used as samples

Page | 26
Mirae Asset Sekuritas Indonesia. The researcher has access to the
application because PT Mirae Asset Sekuritas Indonesia give free access
(cannot be used to do trading activity) publicly. Technical indicators used
are the Simple Moving Average (SMA), Weighted Moving Average
(WMA), Exponential Moving Average (EMA), Moving Average
Convergence Divergence (MACD), Bollinger Band, Negative Volume
Index (NVI), Positive Volume Index (PVI), Relative Strength Index (RSI),
Relative Momentum Index (RMI), Relative Volatility Index (RVI),
Stochastic Fast, Stochastic Slow, Average Directional Index (ADX),
William %R, Rate of Change (ROC), and On-Balance Volume (OBV).
III.2 Variable and Measurement
The dependent variable is the next day of each company stock
price in order to look at the significance of technical analysis toward the
stock price of company at next day. Independent variable is the today
technical indicators used on the research that has been mentioned previous
part. Technical indicators used on the model represent the categories of
technical indicator which are the trend, volatility, momentum, cycle,
market strength, and support and resistance.
After data is completed, it is tested using multiple regression
applying SPSS 25. Regression analysis is the method to analyze the model
to look at the significance of the model predicting the outcome. Researcher
runs the regression analysis on each of the samples in order to look at the

Page | 27
capability of technical analysis that is represented by technical indicators
to predict the next day of stock price on every sample. The researcher set
95% of confidence level for this research.
Regression analysis showed the significance of the model toward
outcome based on the R square and F-value. If the R square near to 1.0, it
indicates the outcome is significantly explained by independent variables.
In order word that the model can be used to predict the outcome.
According to Andy Field (2009), F-value measure how much the model
has improved the prediction of the outcome compared to the level of
inaccuracy of the model. The calculation of F -value is:
F = 𝑀𝐴𝐴𝑛 𝑅𝑞𝑢𝐴𝐴𝐴 𝑜𝑜𝐴 𝑇ℎ𝐴 𝑀𝑜𝑑𝐴𝑐 (𝑀𝑅𝑚)
𝑅𝐴𝑑𝑖𝑑𝑢𝐴𝑐 𝑀𝐴𝐴𝑛 𝑅𝑞𝑢𝐴𝐴𝐴 (𝑀𝑅𝐴)
The good model is shown by F-value is greater than 1 (means that
the Means Square for the model is large than the Residual Means Square.
If the model is significant to explain the outcome, it does not mean
all predictors can be used to predict. The researcher has to look at the
significance of the individual predictor (independent variable) toward the
outcome by comparing the p-value of each predictor to its alpha level. If
the p-value of each predictor more than α level, it is not significant to use
for prediction. SPSS 25 shows the p-value of individual predictor by
showing the Sig. (Significant level).

Page | 28
III.3 Research Model
As the researcher explains the previous part, the researcher run the
regression analysis on every sample. Researcher uses the same model
when running the regression analysis on every sample.
y=β0+β1.x1+β2.x2+β3.x3+β4.x4+β5.x5+β6.x6+β7.x7+β8.x8+β9.x9+β10.
x10+β11.x11+β12.x12+β13.x13+β14.x14+β15.x15+β16.e16+e
y : Stock price of each company on next day
x1 : Bollinger Band
x2 : ADX (Average Directional Index)
x3 : SMA (Simple Moving Average)
x4 : WMA (Weighted Moving Average)
x5 : EMA (Exponential Moving Average)
x6 : MACD (Moving Average Convergence Divergence)
x7 : NVI (Negative Volume Index)
x8 : OBV (On-Balance Volume)
x9 : PVI (Positive Volume Index)
x10 : RMI (Relative Momentum Index)
x11 : ROC (Rate of Changes)
x12 : RSI (Relative Strength Index)
x13 : RVI (Relative Volatility Index)
x14 : Stochastic Fast
x15 : Stochastic Slow
x16 : William %R
β0 : Constant
β1-B16 : Beta of each independent variable
e : error

Page | 29
CHAPTER IV
RESULT
IV.1 DATA ANALYSIS RESULT
IV.1.1 PT ADHI KARYA TBK (ADHI)
PT Adhi Karya Tbk is one of companies in LQ45 index. It
provides construction, engineering, and property development
services. The major ownership of this company is the Indonesian
Government.
By running the statistical analysis using SPSS, The result
shows that the R2 is significance to explain the dependent variable
(the next day of ADHI’s stock price). It shows also that the model
used is fit.
R R Square Adjusted R Square
.986a .972 .971
Another measurement to look at the significance to the
outcome is F-Value. F-value of the ADHI stock price shows on
Table 4.1b. The F-value shows that the model has significance to
the outcome (dependent variable).
Sum of Squares
df Mean Square
F Sig.
Table 4.1a. Result R2 of ADHI stock price

Page | 30
Regression 66366563.354 16 4147910.210 1519.658 .000b
Residual 1929757.851 707 2729.502 Total 68296321.204 723
P-value (Sig.) shows the significance of each independent
variable (Technical analysis) toward the dependent variable.
Independent variable that has significance if the p-value is less than
5% (α). It shows that the independent variable that has significance
to the outcome is NVI (Negative Volume Index, Positive Volume
Index, Stochastic Fast, and Stochastic Slow. It indicates that the
technical analysis could be used to predict the ADHI stock price
with those four technical indicators. The p-value table of technical
indicators is on Table 3.1c
Variable Sig. NVI .000 PVI .000 STOCHASTICFAST .000 STOCHASTICSLOW .038 EMA .102 ADX .123 OBV .138 RMI .154 MACD .227 SMA .228 RVI .286 BOLLINGERBAND .388 ROC .514 WMA .529 RSI .852 Table 4.1c. P-value of technical indicators on ADHI stock
Table 4.1b. Result ANOVA of ADHI stock price

Page | 31
The result shows that the model has significance
statistically to predict the stock price movement according to its R
square and F value. All predictor (independent variables) are not
significant to predict the outcome by looking the p-value of each
predictor. Based on 95% Confidence Level, Predictors
(independent variables) has significance are Negative Volume
Index (NVI), Positive Volume Index (PVI), Stochastic Fast,
Stochastic Slow.
IV.1.2 PT ADARO ENERGY TBK (ADRO)
PT Adaro Energy is coal mining company. It is one of
component of the LQ45 for period August 2018 - January 2019.
The statistical analysis result shows that the R square has
significance to explain 99.5% of the dependent variable. It shows
on the Table 4.2a.
R R Square Adjusted R Square
.997a 0.995 0.995
Other result shows that the model has significant to the
outcome (dependent variable) by looking at the F-value. The F-
value shows on the ANOVA Table Table 4.2b
Sum of Squares
df Mean Square F Sig.
Regression 245901653.505 15 16393443.567 8847.298 .000b
Residual 1311876.057 708 1852.932 Total 247213529.562 723
Table 4.2a. Result R2 of ADRO stock price

Page | 32
In order to look at the significance of each predictor
(independent variable) toward the outcome, the researcher look at
the p-value of each predictor. If the p-value shows that it more than
α (5%), so the predictor does not significant to the outcome to use
for prediction. Table of the p-value of independent variable shows
on Table 4.2c.
Variable Sig. WMA 0.000 SMA 0.000 STOCHASTICSLOW 0.000 STOCHASTICFAST 0.000 RSI 0.000 PVI 0.001 ROC 0.002 RMI 0.030 NVI 0.170 MACD 0.221 BOLLINGERBAND 0.273 ADX 0.366 OBV 0.406 WILLIAM 0.453 RVI 0.656
The result shows that the model has significance
statistically to predict the stock price movement according to its R
square and F value. In order to look detail about the individual
predictor that has significance to the next day of the ADRO stock
price is by looking at the p-value of each individual independent
variable. Independent variables significant are Weighted Moving
Average (WMA), Simple Moving Average (SMA), Stochastic
Table 4.2b. Result ANOVA of ADRO stock price
Table 4.2c. p-value of technical indicators on ADRO stock

Page | 33
Slow, Stochastic Fast, Relative Strength Index (RSI), Positive
Volume Index (PVI), Rate of Change (ROC), and Relative
Momentum Index (RMI).
IV.1.3 PT AKR CORPORINDO TBK (AKRA)
PT AKR Corporindo Tbk distributes chemical products
such as caustic soda, Polyvinyl Chloride (PVC) resin, sorbitol,
soda ash, and sodium sulfate (Bloomberg,2018).
The result shows that the model has significance to the
outcome (dependent variable). It is based on R square shows near
1. Also, it based on the F-value that shows the model can be used
to predict the outcome (dependent variable).
A
f
ter looking the model that significant to the outcome (dependent
variable) and it is looking like the whole model, the researcher
looks for every individual of the predictor on the model by looking
at the p-value. Predictor that significant is the p-value is less than α
(5%).
R R Square
Adjusted R Square
.982a .964 .963
Sum of Squares
df Mean Square F Sig.
Regression 395901893.446 16 24743868.340 1171.539 .000b
Residual 14932423.785 707 21120.826
Total 410834317.231 723
Table 4.3a. Calculation value R for AKRA
Table 4.3b. Result ANOVA of AKRA stock price

Page | 34
Variable Sig. NVI 0.000 PVI 0.000 STOCHASTICFAST 0.000 STOCHASTICSLOW 0.009 EMA 0.011 SMA 0.021 BOLLINGERBAND 0.047 OBV 0.055 RMI 0.159 WILLIAM 0.221 RVI 0.261 WMA 0.394 ADX 0.468 ROC 0.551 MACD 0.716 RSI 0.846
The result shows that the model has significance
statistically to predict the stock price movement according to its R
square and F value. The individual independent variables
significant to the outcome (dependent variable) are Negative
Volume Index (NVI), Positive Volume Index (PVI), Stochastic
Fast, Exponential Moving Average (EMA), Simple Moving
Average (SMA), and Bollinger Band.
IV.1.4 PT ANEKA TAMBANG (PERSERO) TBK (ANTM)
Aneka Tambang Tbk. Are mining company that engages in
the exploration, processing, and marketing the mining material
(nickel, gold, silver).
The result shows that the model is significant to the
dependent variable based on R square near than 1 and F-value
Table 4.3c. P-value of technical indicators on AKRA stock price

Page | 35
shows that the model can be used to predict. F-value shows on
ANOVA table.
R R Square Adjusted R Square
.994a 0.989 0.989
Sum of Squares
df Mean Square
F Sig.
Regression 24269796.974 15 1617986.465 4194.439 .000b
Residual 273107.877 708 385.746 Total 24542904.851 723
To look significance of each independent variable, the
researcher uses p-value. If the p-value of independent variable less
than α (5%), the independent variable is significant.
Variable Sig. SMA 0.000 WMA 0.000 STOCHASTICFAST 0.000 STOCHASTICSLOW 0.000 ADX 0.013 NVI 0.028 OBV 0.039 RMI 0.137 PVI 0.259 ROC 0.314 WILLIAM 0.598 RVI 0.625 RSI 0.776 BOLLINGERBAND 0.829 MACD 0.942
The result shows that the model has significance
statistically to predict the stock price movement according to its R
Table 4.4a. Calculation value R for ANTM
Table 4.4b. Result ANOVA of ANTM stock price
Table 4.4c. P-value of technical indicators on ANTM stock price

Page | 36
square and F value. However, not all independent variable use to
prediction due to insignificant to the outcome. The independent
variables significant are Simple Moving Average (SMA),
Weighted Moving Average (WMA), Stochastic Fast, Stochastic
Slow, Average Directional Index (ADX), Negative Volume Index
(NVI), and On Balance Volume (OBV).
IV.1.5 PT ASTRA INTERNATIONAL TBK (ASII)
PT Astra International operate their business mainly as
automotive production and having many subsidiaries allow ASII to
operates many industries such as mining, plantation, and financial
services.
The result shows that the model is significant to the
outcome (dependent variable) according to R square that near to 1
and the F-value.
R R Square Adjusted R Square
0.987a 0.974 0.973
Sum of Squares
df Mean Square F Sig.
Regression 573452745.431 16 35840796.589 1625.913 .000b Residual 15584750.253 707 22043.494 Total 589037495.684 723
R square and F-value is for the whole model. We look at
the significance of independent variable toward dependent variable
by looking at the p-value.
Table 4.5a. Calculation value R for ASII
Table 4.5b. Result ANOVA of ASII stock price

Page | 37
Variable Sig. SMA 0.000 NVI 0.000 STOCHASTICFAST 0.000 WMA 0.001 OBV 0.001 PVI 0.001 STOCHASTICSLOW 0.001 RSI 0.01 MACD 0.113 WILLIAM 0.141 RMI 0.166 ROC 0.214 RVI 0.438 ADX 0.552 BOLLINGERBAND 0.598 (Constant) 0.699 EMA 0.699
The result shows that the model has significance
statistically to predict the stock price movement according to its R
square and F value.. The independent variables significant to the
outcome for predicting the stock price are Simple Moving Average
(SMA), Negative Volume Index (NVI), Stochastic Fast, Weighted
Moving Average (WMA), On Balance Volume (OBV), Positive
Volume Index (PVI), Stochastic Slow, and Relative Strength Index
(RSI).
IV.1.6 PT BANK CENTRAL ASIA TBK (BBCA)
BBCA (PT Bank Central Asia TBK) is one of the largest
banks in Indonesia. Like another bank, the bank has financial
services such as management of pension fund, leasing, and
consumer financing services.
Table 4.5c. p-value of ASII stock price

Page | 38
The result shows that the model is significantly based on the R
square that shows near 1 and the F-value.
R R Square Adjusted R Square
.998a 0.996 0.995
Sum of Squares df Mean Square F Sig.
Regression 10082427471.914 14 720173390.851 11412.057 .000b Residual 44742410.683 709 63106.362 Total 10127169882.597 723
R square and F-value just show the significance of the
whole model to the outcome (dependent variable). P-value (Sig.)
shows the significance to each independent variable to the
dependent variable. It shows in Table 4.6c.
Variable Sig. ADX 0.000 SMA 0.000 NVI 0.000 OBV 0.000 PVI 0.000 STOCHASTICFAST 0.000 WILLIAM 0.038 STOCHASTICSLOW 0.090 ROC 0.103 RMI 0.170 BOLLINGERBAND 0.232 MACD 0.284 RSI 0.318 RVI 0.521
The conclusion is that the technical analysis can be sued to
predict the BBCA stock price because the result shows the model
has significant to the outcome and can be used to predicting the
next day BBCA stock price (dependent variable). The predictor
Table 4.6a. Calculation value R for BBCA
Table 4.6c. p-value of BBCA stock price
Table 4.6b. Result ANOVA of BBCA stock price

Page | 39
that individually significant to outcome are Average Directional
Index (ADX), Simple Moving Average (SMA), Negative Volume
Index (NVI), On Balance Volume (OBV), Positive Volume Index
(PVI), Stochastic Fast, and William %R.
IV.1.7 PT BANK NEGARA INDONESIA (PERSERO) TBK (BBNI)
BBNI (Bank Negara Indonesia) is one of the banks owned
by Indonesia government that operate to serve commercial and
consumer banking services.
The result shows that the model is significant to the
outcome (dependent variable) according to the R square near to 1
and F-value.
R R Square Adjusted R Square
0.996a 0.992 0.992
Sum of Squares
df Mean Square F Sig.
Regression
1702252178.937
15 113483478.596
6031.373
.000b
Residual 13321394.819 708 18815.529 Total 1715573573.75
7 723
R square and F-value just show the result as the whole
model. We need to know the significance of each independent
variable by looking at each p-value of the independent variable.
Variable Sig. SMA 0.000
Table 4.7a. Calculation value R for BBNI
Table 4.7b. Result ANOVA of BBNI stock price

Page | 40
WMA 0.000 STOCHASTICFAST 0.000 STOCHASTICSLOW 0.000 BOLLINGERBAND 0.018 PVI 0.034 NVI 0.045 MACD 0.048 ROC 0.137 RSI 0.272 OBV 0.276 ADX 0.314 RMI 0.606 RVI 0.622 WILLIAM 0.808
The result shows that the model has significance
statistically to predict the stock price movement according to its R
square and F value. Not all the technical analysis can be used to
predict. The technical analysis that can be used is Simple Moving
Average (SMA), Weighted Moving Average (WMA), Stochastic
Fast, Stochastic Slow, Bollinger Band, Positive Volume Index
(PVI), Negative Volume Index (NVI), and Moving Average
Convergence Divergence (MACD).
IV.1.8 PT BANK RAKYAT INDONESIA (PERSERO) TBK (BBRI)
BBRI (Bank Rakyat Indonesia) is one of the banks owned
by Indonesia government that operate to serve commercial and
consumer banking services.
The R square shows that the model is significant to the
outcome. The model can explain the outcome significantly. The F-
value show the same interpretation.
Table 4.7c. p-value of BBNI stock price

Page | 41
R R Square Adjusted R Square
.995a 0.990 0.990
Sum of Squares
df Mean Square F Sig.
Regression 208916717.824 15 13927781.188 4766.457 .000b
Residual 2068804.655 708 2922.040 Total 210985522.479 723
The independent variables that have significance to predict
the outcome are on the p-value table in Table 4.8c.
Model Sig. SMA 0.000 EMA 0.000 STOCHASTICFAST 0.000 BOLLINGERBAND 0.007 PVI 0.011 STOCHASTICSLOW 0.011 NVI 0.075 RMI 0.106 RVI 0.471 OBV 0.543 ADX 0.564 RSI 0.614 ROC 0.747 WILLIAM 0.751 MACD 0.832
The result shows that the model has significance
statistically to predict the stock price movement according to its R
square and F value. The predictor has significance to prediction are
Simple Moving Average (SMA), Exponential Moving Average
Table 4.8a. Calculation value R for BBRI
Table 4.8c. p-value of BBRI stock price
Table 4.8b. Result ANOVA of BBRI stock price

Page | 42
(EMA), Stochastic Fast, Bollinger Band, Positive Volume Index
(PVI), and Stochastic Slow.
IV.1.9 PT BANK TABUNGAN NEGARA (PERSERO) TBK (BBTN)
BBTN (Bank Tabungan Negara TBK) is one of the banks
that chosen to be component of LQ45. Like another bank, BBTN
provides financial service to its customer.
The model is significantly explained to outcome according
to the R square and the model can be used to prediction based on
the F-value.
R R Square Adjusted R Square
.997a 0.995 0.995
Sum of Squares
df Mean Square F Sig.
Regression 453643579.179 15 30242905.279 9350.249 .000b Residual 2289989.986 708 3234.449 Total 455933569.164 723
Researcher looks further about the individual predictor that
has significance to the prediction. It shows in Table 4.9c.
Model Sig. SMA 0.000 WMA 0.000 STOCHASTICFAST 0.000 STOCHASTICSLOW 0.000 RMI 0.002 RSI 0.022 RVI 0.166
Table 4.9a. Calculation value R for BBTN
Table 4.9b. Result ANOVA of BBTN stock price

Page | 43
BOLLINGERBAND 0.230 MACD 0.246 ADX 0.251 WILLIAM 0.252 NVI 0.357 OBV 0.616 ROC 0.852 PVI 0.896
The result shows that the model has significance
statistically to predict the stock price movement according to its R
square and F value. The significant predictors are Simple Moving
Average (SMA), Weighted Moving Average (WMA), Stochastic
Fast, Stochastic Slow, Relative Momentum Index (RMI), and
Relative Strength Index (RSI).
IV.1.10 PT BANK JAWA BARAT DAN BANTEN TBK (BJBR)
BJBR (Bank Jawa Barat and Banten) is a commercial bank
like other banks in Indonesia. Before the name of Bank Jawa
Barat and Banten, the first name before the independence of
Indonesia is De EeWrste Nederlandsche-Indische Spaarkas en
Hyphoteekbank (DENIS) in 1915.
The R square shows that the dependent variable can be
explained significantly by the independent variable and the model
can be used to predict the outcome according to its F-value.
R R Square Adjusted R Square
.995a 0.990 0.990
Table 4.9c. p-value of BBTN stock price

Page | 44
Sum of Squares
df Mean Square F Sig.
Regression 337788428.071 15 22519228.538 4775.775 .000b
Residual 3338434.740 708 4715.303 Total 341126862.811 723
R square and F-value is about the significance of one
model. We have to look at the predictor that has significant to
outcome in prediction by looking at the p-value (Sig.).
Variable Sig. SMA 0.000 WMA 0.000 NVI 0.000 PVI 0.000 ROC 0.000 STOCHASTICFAST 0.000 STOCHASTICSLOW 0.001 OBV 0.014 RSI 0.017 MACD 0.061 ADX 0.508 RVI 0.754 BOLLINGERBAND 0.948 RMI 0.955 WILLIAM 0.981
The result shows that the model has significance
statistically to predict the stock price movement according to its R
square and F value. The predictors that have significance to the
prediction are Simple Moving Average (SMA), Weighted Moving
Average (WMA), Negative Volume Index (NVI), Positive
Volume Index (PVI), Rate of Changes (ROC), Stochastic Fast,
Table 4.10a. Calculation value R for BJBR
Table 4.10c. p-value of BJBR stock price
Table 4.10b. Result ANOVA of BJBR stock price

Page | 45
Stochastic Slow, On Balance Volume (OBV), and Relative
Strength Index (RSI).
IV.1.11 PT SENTUL CITY TBK (BKSL)
BKSL (PT Sentul City) is real estate company located in
Sentul (Bogor region). BKSL is the new component of LQ45 for
period August 2018 – January 2019.
The model shows its significance to predict the outcome
based on its R square and the F-value. It shows on table R square
and ANOVA.
The model shows the significance but we need to look the
individual predictor of the BKSL stock price on the model. We
look at the significance of predictor to use for prediction by
looking at the p-value.
Variable Sig. SMA 0.000
R R Square Adjusted R Square
.995a 0.990 0.989
Sum of Squares
df Mean Square
F Sig.
Regression 1161391.428 15 77426.095 4520.865 .000b Residual 12125.484 708 17.126 Total 1173516.912 723
Table 4.11a. Calculation value R for BKSL
Table 4.11b. Result ANOVA of BKSL stock

Page | 46
WMA 0.000 STOCHASTICFAST 0.000 STOCHASTICSLOW 0.000 ADX 0.016 PVI 0.055 OBV 0.109 RSI 0.217 BOLLINGERBAND 0.258 RMI 0.278 NVI 0.291 ROC 0.501 WILLIAM 0.667 RVI 0.895 MACD 0.910
The result shows that the model has significance
statistically to predict the stock price movement according to its R
square and F value. However, the individual predictors that can be
used to predict are Simple Moving Average (SMA), Weighted
Moving Average (WMA), Stochastic Fast, Stochastic Slow,
Average Directional Index (ADX).
IV.1.12 PT BANK MANDIRI (PERSERO) TBK (BMRI)
BMRI (Bank Mandiri Persero) is one of the biggest
commercial banks in Indonesia. It provides financial service to the
customer like other banks in Indonesia.
The model shows that the model significantly explains the
dependent variable based on the R square and the model can be
used to prediction based on the F-value.
Table 4.11c p-value of BKSL stock price

Page | 47
R R Square Adjusted R Square
.995a 0.990 0.990
Sum of Squares df Mean Square F Sig. Regression 1005844951.421 15 67056330.095 4730.172 .000b Residual 10036818.330 708 14176.297 Total 1015881769.751 723
The model can be used to predict the outcome but we have
to look at the independent variable that has significance to predict
the outcome by using the p-value.
Variable Sig. EMA 0.000 STOCHASTICFAST 0.000 PVI 0.001 NVI 0.003 SMA 0.021 STOCHASTICSLOW 0.023 BOLLINGERBAND 0.102 RMI 0.150 OBV 0.183 MACD 0.291 RSI 0.377 ADX 0.426 WILLIAM 0.691 ROC 0.821 RVI 0.987
The result shows that the model has significance
statistically to predict the stock price movement according to its R
square and F value. However not all the variable has significance to
predict the price. The significant dependent variables are
Exponential Moving Average (EMA), Stochastic Fast, Positive
Table 4.12a. Calculation value R for BMRI
Table 4.12c. p-value of BMRI stock price
Table 4.12b. Result ANOVA of BMRI stock price

Page | 48
Volume Index (PVI), Negative Volume Index (NVI), Simple
Moving Average (SMA), and Stochastic Slow.
IV.1.13 PT BARITO PASIFIC TBK (BRPT)
BRPT (PT Barito Pasific) is an energy company that
provides petrochemical and geothermal energy.
The result shows that the model significantly explains the
dependent variable based on the R square. The model can be used
to predict the outcome based on the F-value. R square is shown in
Table 4.13a. and F-value is shown on the ANOVA table in Table
4.13b.
R R Square Adjusted R Square
.999a 0.998 0.998
Sum of Squares
df Mean Square F Sig.
Regression 569393245.465 14 40670946.105 23030.027 .000b Residual 1252091.463 709 1765.996 Total 570645336.928 723
The model can be used to a prediction of the outcome but it
is for the whole model. The individual predictor (dependent
variable) that has significance to prediction is that has the p-value
less than 5% (Confidence level 95%).
Variable Sig.
Table 4.13a. Calculation value R for BRPT
Table 4.13b. Result ANOVA of BRPT stock price

Page | 49
BOLLINGERBAND 0.000 WMA 0.000 OBV 0.000 STOCHASTICFAST 0.000 STOCHASTICSLOW 0.000 WILLIAM 0.000 MACD 0.009 NVI 0.047 RMI 0.064 RSI 0.286 ROC 0.375 RVI 0.504 ADX 0.519 PVI 0.799
The result shows that the model has significance
statistically to predict the stock price movement according to its R
square and F value. The technical indicator that can be used to
predict are Bollinger Band, Weighted Moving Average (WMA),
On-Balance Volume (OBV), Stochastic Fast, Stochastic Slow,
William %R, Moving Average Convergence Divergence
(MACD), and Negative Volume Index (NVI). These technical
indicators are chosen that can be used to prediction because the p-
value (Sig.) is less than 5%.
IV.1.14 PT BUMI SERPONG DAMAI TBK (BSDE)
BSDE (PT Bumi Serpong Damai) is one of the real estate
company in Indonesia. BSDE provides housing infrastructure,
public facility, golf, and etc.
Table 4.13c. p-value of BRPT stock price

Page | 50
The result shows that the model can explain significantly
the dependent variable (outcome) based on its R square. The
model is significant for predicting the outcome based on F-value.
R R Square Adjusted R Square
.975a 0.950 0.949
Sum of Squares
df Mean Square
F Sig.
Regression 21076102.977 16 1317256.436 840.134 .000b Residual 1108514.530 707 1567.913 Total 22184617.507 723
If the model is significant to predict the outcome, there are
some independent variables that can be used to predict because of
its significance to outcome based on every variable's p-value.
Variable Sig. SMA 0.000 STOCHASTICFAST 0.000 STOCHASTICSLOW 0.000 WMA 0.005 EMA 0.016 PVI 0.132 OBV 0.148 NVI 0.226 ADX 0.297 RVI 0.308 MACD 0.311 RSI 0.317 RMI 0.369 BOLLINGERBAND 0.426 WILLIAM 0.837 ROC 0.920
Table 4.14a. Calculation value R for BSDE
Table 4.14c p-value of BSDE stock price
Table 4.14b. Result ANOVA of BSDE stock price

Page | 51
The result shows that the model has significance
statistically to predict the stock price movement according to its R
square and F value. But not all the technical indicators can be used
because insignificant of the independent variable. The significant
technical indicators are Simple Moving Average (SMA),
Stochastic Fast, Stochastic Slow, Weighted Moving Average
(WMA), and Exponential Moving Average (EMA).
IV.1.15 PT ELNUSA TBK (ELSA)
ELSA (PT Elnusa TBK) is an oil services company
providing geophysical data, drilling, and oilfield services. ELSA
also provide information technology service to the oil company
and other industry.
The result shows that R square is near one. It means that the
model can explain the dependent variable significantly. The F-
value show also that the model can be used to the prediction of the
outcome.
R R Square Adjusted R Square
.990a 0.979 0.979
Sum of Squares
df Mean Square
F Sig.
Regression 5866555.012 16 366659.688 2088.508 .000b Residual 124121.334 707 175.561 Total 5990676.347 723
Table 4.15a. Calculation value R for ELSA
Table 4.15b. Result ANOVA of ELSA stock price

Page | 52
We need to know the predictors (technical indicators) that
significance to predict the outcome based on its individual
predictor’s p-value because the model can be used to predict the
outcome but we have to look every significance of the variable in
the model.
Variable Sig. SMA 0.000 WMA 0.000 STOCHASTICFAST 0.000 NVI 0.003 OBV 0.019 PVI 0.024 STOCHASTICSLOW 0.092 EMA 0.154 MACD 0.188 RVI 0.191 WILLIAM 0.339 ROC 0.498 RMI 0.768 BOLLINGERBAND 0.792 RSI 0.809 ADX 0.969
The result shows that the model has significance
statistically to predict the stock price movement according to its R
square and F value. The technical indicators which significant
(Confidence Level 95%) to the outcome are Simple Moving
Average (SMA), Weighted Moving Average (WMA), Stochastic
Fast, Negative Volume Index (NVI), On Balance Volume (OBV),
and Positive Volume Index (PVI).
IV.1.16 PT XL AXIATA TBK (EXCL)
Table 4.15c. p-value of ELSA stock price

Page | 53
EXCL (PT XL Axiata TBK) is on of private
telecommunication company in Indonesia. EXCL provides mobile
telecommunication service in Indonesia.
The result shows the model can explain significantly
dependent variable based on its R square and the model can be
used to predict based on its F-value.
R R Square Adjusted R Square
.985a 0.970 0.970
Sum of Squares
df Mean Square F Sig.
Regression 192131553.402 16 12008222.088 1448.607 .000b Residual 5860673.294 707 8289.495 Total 197992226.696 723
Next is about the significance of each independent variables
(technical indicators) toward outcome (next day of the stock price
of EXCL). The significance is based on the p-value (Sig.).
Variable Sig. SMA 0.000 WMA 0.000 STOCHASTICFAST 0.000 STOCHASTICSLOW 0.001 RMI 0.002 RSI 0.004 NVI 0.114 PVI 0.124 WILLIAM 0.161 ROC 0.278 OBV 0.436
Table 4.16a. Calculation value R for EXCL
Table 4.16b Result ANOVA of EXCL stock price

Page | 54
BOLLINGERBAND 0.446 RVI 0.686 EMA 0.790 ADX 0.849 MACD 0.945
The result shows that the model has significance
statistically to predict the stock price movement according to its R
square and F value. The significant technical indicators are Simple
Moving Average (SMA), Weighted Moving Average (WMA),
Stochastic Fast, Stochastic Slow, Relative Momentum Index
(RMI), and Relative Strength Index (RSI).
IV.1.17 PT GUDANG GARAM TBK (GGRM)
GGRM (PT Gudang Garam TBK) is company product
cigarettes in Indonesia. GGRM also has a subsidiary in paper-
related activities.
The result shows the model is significant to explain the
outcome and can be used to predict the outcome (next day of the
stock price of GGRM).
R R Square Adjusted R Square
.991a 0.982 0.982
Sum of Squares df Mean Square F Sig.
Regression 72670060765.906 15 4844670717.727 2579.165 .000b Residual 1329898262.927 708 1878387.377
Table 4.16c p-value of EXCL stock price
Table 4.17a Calculation value R for GGRM

Page | 55
Total 73999959028.833 723
The model is significant to the outcome but we need to look
at each independent variable's (technical indicators) significance
to the outcome. It is based on the p-value (Sig.).
Variable Sig. EMA 0.000 PVI 0.000 STOCHASTICFAST 0.000 STOCHASTICSLOW 0.001 NVI 0.002 WILLIAM 0.030 BOLLINGERBAND 0.031 RMI 0.038 RSI 0.079 ADX 0.104 SMA 0.147 RVI 0.154 ROC 0.180 MACD 0.248 OBV 0.932
The result shows that the model has significance
statistically to predict the stock price movement according to its R
square and F value. But not all the technical indicators
(independent variables) can be used to predict the outcome.
Technical indicators that have significance to outcome are
Exponential Moving Average (EMA), Positive Volume Index
(PVI), Stochastic Fast, Stochastic Slow, Negative Volume Index
(NVI), William %R, Bollinger Band, and Relative Momentum
Index (RMI).
IV.1.18 PT H.M. SAMPOERNA TBK (HMSP)
Table 4.17c. p-value of GGRM stock price
Table 4.17b. Result ANOVA of GGRM stock price

Page | 56
HMSP (PT Handaya Mandala Sampoerna) is company
producing cigarette like GGRM.
The result shows the model is significant to explain the
dependent variable (next day of the stock price of HMSP) and can
be used to predict the outcome based on the R square and F-value.
R R Square Adjusted R Square
.977a 0.954 0.953
Sum of Squares
df Mean Square
F Sig.
Regression 99752365.460 16 6234522.841 919.549 .000b Residual 4793442.842 707 6779.976 Total 104545808.302 723
Next part is the significance of the technical indicators
(predictors) to the outcome. It is based on the p-value (Sig.).
Variable Sig. SMA 0.000 WMA 0.000 STOCHASTICFAST 0.000 STOCHASTICSLOW 0.000 RVI 0.001 MACD 0.008 PVI 0.013 BOLLINGERBAND 0.018 NVI 0.079 ROC 0.079 RMI 0.186 OBV 0.220 ADX 0.326 WILLIAM 0.373 RSI 0.535 EMA 0.809
Table 4.18a. Calculation value R for HMSP
Table 4.18b. Result ANOVA of HMSP stock price

Page | 57
The result shows that the model has significance
statistically to predict the stock price movement according to its R
square and F value. The predictors that has significance to
outcome are Simple Moving Average (SMA), Weighted Moving
Average (WMA), Stochastic Fast, Stochastic Slow, Relative
Volatility Index (RVI), Moving Average Convergence Divergence
(MACD), Positive Volume Index (PVI), and Bollinger Band.
IV.1.19 PT INDOFOOD CBP SUKSES MAKMUR TBK (ICBP)
ICBP (PT Indofood CBP Sukses Makmur TBK) is a food
product manufacturer and ICBP has raw material production for
their food product.
The result shows the model is significant to explain the
outcome and can be used to the prediction of outcome (next day
of the stock price of the ICBP).
R R Square Adjusted R Square
.989a 0.978 0.978
Sum of Squares
df Mean Square F Sig.
Regression 622398518.761 16 38899907.423 1972.238 .000b Residual 13944681.342 707 19723.736 Total 636343200.104 723
Table 4.18c. p-value of HMSP stock price
Table 4.19a. Calculation R, R Square, Adjusted R Square for ICBP
Table 4.19b. Result ANOVA of ICBP stock price

Page | 58
Next part is the significance of the technical indicators
(predictors) toward next day of the stock price of HMSP. It is
based on the p-value (Sig.)
Variable Sig. NVI 0.000 PVI 0.000 STOCHASTICFAST 0.000 MACD 0.016 ADX 0.022 OBV 0.032 STOCHASTICSLOW 0.045 EMA 0.142 RVI 0.154 RMI 0.170 SMA 0.203 RSI 0.285 WILLIAM 0.293 BOLLINGERBAND 0.452 WMA 0.607 ROC 0.625
The result shows that the model has significance
statistically to predict the stock price movement according to its R
square and F value. The technical indicators that are significant
predictor are Negative Volume Index (NVI), Positive Volume
Index (PVI), Stochastic Fast, Moving Average Convergence
Divergence (MACD), Average Directional Index (ADX), On
Balance Volume (OBV), and Stochastic Slow.
IV.1.20 PT VALE INDONESIA TBK (INCO)
INCO (PT Vale Indonesia) is mining company produce
nickel in matte and operated in Sokoako in Sulawesi (Bloomberg).
Table 4.19c. p-value of ICBP stock price

Page | 59
The result shows that the model is significant to explain the
outcome based on the R square and F-value.
R R Square Adjusted R Square
.993a 0.986 0.986
Sum of Squares df Mean Square F Sig.
Regression 384902913.298 15 25660194.220 3281.022 .000b Residual 5537122.165 708 7820.794 Total 390440035.463 723
The next part is to look at the significance of each predictor
toward the result. It is based on each p-value of the predictor.
Variable Sig. SMA 0.000 WMA 0.000 STOCHASTICFAST 0.000 STOCHASTICSLOW 0.000 RSI 0.098 NVI 0.260 ADX 0.269 PVI 0.282 BOLLINGERBAND 0.346 WILLIAM 0.373 OBV 0.667 MACD 0.751 RVI 0.798 RMI 0.940 ROC 0.941
The result shows that the model has significance
statistically to predict the stock price movement according to its R
square and F value. It is based on the significance of the model
Table 4.20c. p-value of INCO stock price
Table 4.20a. Calculation R, R Square, Adjusted R Square for INCO
Table 4.20b. Result ANOVA of INCO stock price

Page | 60
toward to outcome. The significant predictors are Simple Moving
Average (SMA), Weighted Moving Average (WMA), Stochastic
Fast, and Stochastic Slow.
IV.1.21 PT INDOFOOD SUKSES MAKMUR TBK (INDF)
INDF (PT Indofood Sukses Makmur TBK) is a
manufacturing company that produces instant noodle, baby food,
flour.
The result shows the model is significant to the outcome
and can be used to predict the outcome.
R R Square Adjusted R Square
.991a 0.982 0.982
Sum of Squares
df Mean Square F Sig.
Regression 800136429.275 15 53342428.618 2608.952 .000b Residual 14475714.648 708 20445.925 Total 814612143.923 723
Next part is the significance of the technical indicators
(predictors). It is based on the p-value (Sig.). If the p-value shows
less than 5% (Confidence level 95%), it means that predictor is
significant for prediction.
Variable Sig. SMA 0.000 EMA 0.000 NVI 0.000
Table 4.21a. Calculation R, R Square, Adjusted R Square for INDF
Table 4.21b. Result ANOVA of INDF stock price

Page | 61
PVI 0.000 STOCHASTICFAST 0.001 STOCHASTICSLOW 0.020 (Constant) 0.022 BOLLINGERBAND 0.041 RMI 0.442 ADX 0.451 RVI 0.512 RSI 0.563 OBV 0.574 WILLIAM 0.726 ROC 0.987 MACD 0.999
The result shows that the model has significance
statistically to predict the stock price movement according to its R
square and F value. The significant predictors are Simple Moving
Average (SMA), Exponential Moving Average (EMA), Negative
Volume Index (NVI), Positive Volume Index (PVI), Stochastic
Fast, Stochastic Slow, and Bollinger Band.
IV.1.22 PT INDIKA ENERGY TBK (INDY)
INDY (PT Indika Energy TBK) is an energy company that
provide energy services, energy resources, and infrastructure.
The result shows that the model is significant to
explain the outcome based on its R square and can be used
to predict the outcome based on F-value.
R R Square Adjusted R Square
.991a 0.982 0.982
Table 4.21c. p-value of INDF stock price
Table 4.22a. Calculation R, R Square, Adjusted R Square for INDY

Page | 62
Sum of Squares
df Mean Square F Sig.
Regression 800136429.275 15 53342428.618 2608.952 .000b Residual 14475714.648 708 20445.925 Total 814612143.923 723
The next part is the significance of the predictor toward the
result. It is based on the p-value (Sig.).
Variable Sig. SMA 0.000 EMA 0.000 NVI 0.000 PVI 0.000 STOCHASTICFAST 0.001 STOCHASTICSLOW 0.020 BOLLINGERBAND 0.041 RMI 0.442 ADX 0.451 RVI 0.512 RSI 0.563 OBV 0.574 WILLIAM 0.726 ROC 0.987 MACD 0.999
The result shows that the model has significance
statistically to predict the stock price movement according to its R
square and F value. The technical indicators that have significance
to prediction are Simple Moving Average (SMA), Exponential
Moving Average (EMA), Negative Volume Index (NVI), Positive
Volume Index (PVI), Stochastic Fast, Stochastic Slow, and
Bollinger Band.
IV.1.23 PT INDAH KIAT PULP & PAPER TBK (INKP)
Table 4.22c. p-value of INDY stock price
Table 4.22b. Result ANOVA of INDY stock price

Page | 63
INKP (PT Indah Kiat Pulp & Paper TBK) is a
manufacturing company producing pulp and paper located in
Tangerang and Serang.
The result shows the model is significant to explain the
dependent variable based on R square. The F-value shows us that
the model can be used as the prediction.
R R Square Adjusted R Square
.999a 0.998 0.998
Sum of Squares df Mean Square F Sig.
Regression 17546691178.776 15 1169779411.918 22131.993 .000b
Residual 37421112.937 708 52854.679 Total 17584112291.713 723
The next part is the significance of predictor on the INKP
toward the outcome. The significant predictor can be used as the
predictor to predict the stock price of INKP.
Variable Sig. SMA 0.000 WMA 0.000 STOCHASTICFAST 0.001 STOCHASTICSLOW 0.002 NVI 0.010 BOLLINGERBAND 0.012 PVI 0.068 ROC 0.110 WILLIAM 0.150 ADX 0.213 RSI 0.223 MACD 0.261
Table 4.23a. Calculation R, R Square, Adjusted R Square for INKP
Table 4.23b. Result ANOVA of INKP stock price

Page | 64
RMI 0.498 RVI 0.703 OBV 0.721
The result shows that the model has significance
statistically to predict the stock price movement according to its R
square and F value. The technical indicators that have significance
to prediction are Simple Moving Average (SMA), Weighted
Moving Average (WMA), Stochastic Fast, Stochastic Slow,
Negative Volume Index (NVI), Bollinger band.
IV.1.24 PT INDOCEMENT TUNGGAL PRAKARSA TBK (INTP)
INTP (PT Indocement Tunggal Prakarsa TBK) is one of
two cement company in LQ45 beside SMGR.
The result shows the model is significance to the outcome
and can be used to predict the outcome. It is based on the R
square and F-value.
R R Square Adjusted R Square
.973a 0.947 0.946
Sum of Squares df Mean Square F Sig.
Regression 3113267520.005 16 194579220.000 796.128 .000b Residual 172795649.885 707 244406.860 Total 3286063169.890 723
Table 4.23c. p-value of INKP stock price
Table 4.24a. Calculation R, R Square, Adjusted R Square for INTP
Table 4.24b. Result ANOVA of INTP stock price

Page | 65
The result shows that not all the technical indicators are
significant to be used as the predictor. It is based on the p-value of
each technical indicator.
Variable Sig. SMA 0.000 MACD 0.001 NVI 0.001 STOCHASTICFAST 0.001 WMA 0.003 PVI 0.004 STOCHASTICSLOW 0.011 OBV 0.015 EMA 0.028 RVI 0.111 ADX 0.154 WILLIAM 0.224 RSI 0.360 BOLLINGERBAND 0.431 RMI 0.775 ROC 0.910
The result shows that the model has significance
statistically to predict the stock price movement according to its R
square and F value. The technical indicators that have significance
to prediction are Simple Moving Average (SMA), Moving
Average Convergence Divergence (MACD), Negative Volume
Index (NVI), Stochastic Fast, Weighted Moving Average, Positive
Volume Index, Stochastic Slow, On-Balance Volume (OBV), and
Exponential Moving Average (EMA).
IV.1.25 PT INDO TAMBANGRAYA MEGAH TBK (ITMG)
ITMG (PT Indo Tambangraya Megah TBK) is ming
company that operate exploration the coal, provide energy, and
electricity support.
Table 4.24c. p-value of INTP stock price

Page | 66
The result shows the model is significance to the outcome
and can be used to predict the outcome. It is based on the R
square and F-value.
R R Square Adjusted R Square
.997a 0.995 0.995
Sum of Squares df Mean Square F Sig.
Regression 36899722797.127 15 2459981519.808 8725.347 .000b
Residual 199610036.713 708 281935.080 Total 37099332833.840 723
The result shows that not all the technical indicators are
significant to be used as a predictor. It is based on the p-value of
each technical indicator.
Variable Sig. BOLLINGERBAND 0.000 SMA 0.000 EMA 0.000 MACD 0.000 STOCHASTICFAST 0.000 RVI 0.015 RMI 0.046 WILLIAM 0.080 PVI 0.138 ADX 0.254 NVI 0.476 RSI 0.500 STOCHASTICSLOW 0.786 ROC 0.863 OBV 0.945 Table 4.25c. p-value of ITMG stock price
Table 4.25a. Calculation R, R Square, Adjusted R Square for ITMG
Table 4.25b. Result ANOVA of ITMG stock price

Page | 67
The result shows that the model has significance
statistically to predict the stock price movement according to its R
square and F value. The technical indicators that have significance
to prediction are Bollinger Band, Simple Moving Average (SMA),
Exponential Moving Average (EMA), Moving Average
Convergence Divergence (MACD), Stochastic Fast, Relative
Volatility Index (RVI), and Relative Momentum Index (RMI).
IV.1.26 PT JASA MARGA TBK (JSMR)
JSMR (PT Jasa Marga TBK) is a state-owned enterprise
that has the responsibility to construct, build, and operate the toll
road and its facilities.
The result shows the model is significance to the outcome
and can be used to predict the outcome. It is based on the R square
and F-value.
R R Square Adjusted R Square
.986a 0.973 0.972
Sum of Squares
df Mean Square F Sig.
Regression 269551907.469 16 16846994.217 1564.501 .000b Residual 7613176.612 707 10768.284 Total 277165084.081 723
Table 4.26a. Calculation R, R Square, Adjusted R Square for JSMR
Table 4.26b. Result ANOVA of JSMR stock price

Page | 68
The result shows that not all the technical indicators are
significant to be used as the predictor. It is based on the p-value of
each technical indicator.
Variable Sig. STOCHASTICFAST 0.000 SMA 0.005 RMI 0.006 RSI 0.068 WMA 0.080 EMA 0.102 RVI 0.171 ADX 0.225 STOCHASTICSLOW 0.236 OBV 0.296 ROC 0.337 PVI 0.406 BOLLINGERBAND 0.752 NVI 0.888 MACD 0.941 WILLIAM 0.621
The result shows that the model has significance
statistically to predict the stock price movement according to its R
square and F value. The technical indicators that have significance
to prediction are Stochastic Fast, Simple Moving Average (SMA),
and Relative Momentum Index (RMI).
IV.1.27 PT KALBE FARMA TBK (KLBF)
KLBF (PT Kalbe Farma TBK) is pharmacy company in
Indonesia and the member of LQ45 Index for August 2018 –
January 2019.
Table 4.26c. p-value of JSMR stock price

Page | 69
The result shows the model is significance to the outcome
and can be used to predict the outcome. It is based on the R
square and F-value.
R R Square Adjusted R Square
.978a 0.956 0.955
Sum of Squares
df Mean Square
F Sig.
Regression 15581749.235 16 973859.327 965.421 .000b Residual 713179.874 707 1008.741 Total 16294929.109 723
The result shows that not all the technical indicators are
significant to be used as the predictor. It is based on the p-value of
each technical indicator.
Variable Sig. SMA 0.000 WMA 0.000 STOCHASTICFAST 0.000 RVI 0.001 STOCHASTICSLOW 0.001 BOLLINGERBAND 0.003 PVI 0.015 NVI 0.022 OBV 0.086 ADX 0.097 MACD 0.111 ROC 0.132 EMA 0.170 WILLIAM 0.303 RSI 0.497 RMI 0.588
Table 4.27c. p-value of KLBF stock price
Table 4.27a. Calculation R, R Square, Adjusted R Square for KLBF
Table 4.27b. Result ANOVA of KLBF stock price

Page | 70
The result shows that the model has significance
statistically to predict the stock price movement according to its R
square and F value. The technical indicators that have significance
to prediction are simple moving average, Weighted Moving
Average (WMA), Stochastic Fast, Relative Volatility Index (RVI),
Stochastic Slow, Bollinger Band, Positive Volume Index (PVI),
and Negative Volume Index (NVI).
IV.1.28 PT LIPPO KARAWACI TBK (LPKR)
LPKR (PT Lippo Karawaci TBK) is real estate company
located in Karawaci, Tangerang. It provides houses, land, etc.
The result shows the model is significance to the outcome
and can be used to predict the outcome. It is based on the R
square and F-value.
R R Square Adjusted R Square
.997a 0.995 0.995
Sum of Squares
df Mean Square
F Sig.
Regression 47847937.053 15 3189862.470 8746.610 .000b Residual 258205.492 708 364.697 Total 48106142.546 723
The result shows that not all the technical indicators are
significant to be used as the predictor. It is based on the p-value of
each technical indicator.
Table 4.28a. Calculation R, R Square, Adjusted R Square for LPKR
Table 4.28b. Result ANOVA of LPKR stock price

Page | 71
Variable Sig. SMA 0.000 WMA 0.000 NVI 0.000 STOCHASTICFAST 0.000 STOCHASTICSLOW 0.000 OBV 0.026 PVI 0.047 ADX 0.157 MACD 0.187 RMI 0.502 ROC 0.533 RVI 0.635 BOLLINGERBAND 0.670 RSI 0.733 WILLIAM 0.976
The result shows that the model has significance
statistically to predict the stock price movement according to its R
square and F value. The technical indicators that have significance
to prediction are Simple Moving Average (SMA), Weighted
Moving Average (WMA), Negative Volume Index (NVI),
Stochastic Fast, Stochastic Slow, On Balance Volume (OBV), and
Positive Volume Index (PVI).
IV.1.29 PT MATAHARI DEPARTMENT STORE TBK (LPPF)
LPFF (PT Matahari Department Store) is a retail company
that most of the product is clothes and most Indonesian people
know the store of Matahari Department Store.
The result shows the model is significance to the outcome
and can be used to predict the outcome. It is based on the R
square and F-value.
Table 4.28c. p-value of LPKR stock price

Page | 72
R R Square Adjusted R Square
.993a 0.987 0.986
Sum of Squares df Mean Square F Sig.
Regression 9078783274.660 15 605252218.311 3517.366 .000b Residual 121829404.898 708 172075.431 Total 9200612679.558 723
The result shows that not all the technical indicators are
significant to be used as the predictor. It is based on the p-value of
each technical indicator.
Variable Sig. WMA 0.000 STOCHASTICFAST 0.000 STOCHASTICSLOW 0.000 RMI 0.001 RSI 0.004 SMA 0.009 MACD 0.102 OBV 0.238 WILLIAM 0.349 RVI 0.365 NVI 0.622 BOLLINGERBAND 0.645 PVI 0.678 ROC 0.695 ADX 0.914
The result shows that the model has significance
statistically to predict the stock price movement according to its R
square and F value. The technical indicators that have
significance to prediction are Weighted Moving Average (WMA),
Table 4.29c. p-value of LPPF stock price
Table 4.29a. Calculation R, R Square, Adjusted R Square for LPPF
Table 4.29b. Result ANOVA of LPPF stock price

Page | 73
Stochastic Fast, Stochastic Slow, Relative Momentum Index
(RMI), Relative Strength Index (RSI), and Simple Moving
Average (SMA).
IV.1.30 PT MEDCO ENERGI INTERNASIONAL TBK (MEDC)
MEDC (PT Medco Energi International TBK) is an energy
company that product gas and oil, operate a power plant in Batam,
and develop bio-fuel.
The result shows the model is significance to the outcome
and can be used to predict the outcome. It is based on the R
square and F-value.
R R Square Adjusted R Square
.997a 0.995 0.995
Sum of Squares
df Mean Square
F Sig.
Regression 88173162.419 15 5878210.828 8763.063 .000b Residual 474922.193 708 670.794 Total 88648084.612 723
The result shows that not all the technical indicators are
significant to be used as the predictor. It is based on the p-value of
each technical indicator.
Variable Sig. SMA 0.000 WMA 0.000 STOCHASTICFAST 0.000 STOCHASTICSLOW 0.000
Table 4.30a. Calculation R, R Square, Adjusted R Square for MEDC
Table 4.30b. Result ANOVA of KLBF stock price

Page | 74
RSI 0.001 RMI 0.002 RVI 0.012 OBV 0.035 WILLIAM 0.095 BOLLINGERBAND 0.234 MACD 0.254 ROC 0.306 NVI 0.365 PVI 0.465 ADX 0.913
The result shows that the model has significance
statistically to predict the stock price movement according to its R
square and F value. The technical indicators that have significance
to prediction are Simple Moving Average (SMA), Weighted
Moving Average (WMA), Stochastic Fast, Stochastic Slow,
Relative Strength Index (RSI), Relative Momentum Index (RMI),
Relative Volatility Index (RVI), and On Balance Volume (OBV).
IV.1.31 PT MEDIA NUSANTARA CITRA TBK (MNCN)
MNCN (PT Media Nusantara Citra TBK) is media
company that has TV Station, newspaper, radio station, talent
management.
The result shows that the model is fit and can be used to
predict the outcome based on the R square and F-value.
R R Square Adjusted R Square
.987a 0.974 0.974 Table 4.31a. Calculation R, R Square, Adjusted R Square for MNCN
Table 4.30c. p-value of MEDC stock price

Page | 75
Sum of Squares
df Mean Square
F Sig.
Regression 72756195.270 16 4547262.204 1669.657 .000b
Residual 1925493.543 707 2723.470
Total 74681688.812 723
The result shows the significant individual predictor on the
model based on p-value. Not all the individual predictor is
significant on the model with confidence level of 95%.
Variable Sig. STOCHASTICFAST 0.000 EMA 0.001 NVI 0.023 STOCHASTICSLOW 0.030 MACD 0.056 BOLLINGERBAND 0.061 PVI 0.064 SMA 0.071 RMI 0.113 ADX 0.188 OBV 0.254 ROC 0.404 WILLIAM 0.411 RSI 0.602 RVI 0.890 WMA 0.987
The result shows that the model has significance
statistically to predict the stock price movement according to its R
square and F value. The technical indicators that have significance
to prediction are Stochastic Fast, Exponential Moving Average
(EMA), Negative Volume Index (NVI), and Stochastic Slow.
IV.1.32 PT PERUSAHAAN GAS NEGARA (PERSERO) TBK
(PGAS)
Table 4.31c. p-value of MNCN stock price
Table 4.31b. Result ANOVA of MNCN stock price

Page | 76
PGAS (PT Perusahaan Gas Negara TBK) is a company that
distributes the gas for industry, commercial, and household user.
The result shows the model is fit and can be used to predict
the outcome based on its R square and F-value.
R R Square Adjusted R Square
.985a 0.970 0.969
Sum of Squares
df Mean Square
F Sig.
1 Regression
135357632.376
16 8459852.024
1426.521
.000b
Residual 4192798.425 707 5930.408 Total 139550430.80
1 723
The result shows the significant individual predictor on the
model based on p-value. Not all the individual predictor is
significant on the model with confidence level of 95%.
Variable Sig. SMA 0.000 WMA 0.000 NVI 0.000 STOCHASTICFAST 0.000 PVI 0.001 STOCHASTICSLOW 0.001 RSI 0.002 ADX 0.004 WILLIAM 0.082 RMI 0.152 ROC 0.210 EMA 0.233 MACD 0.761 OBV 0.765 BOLLINGERBAND 0.796 RVI 0.982
Table 4.32c. p-value of PGAS stock price
Table 4.32a. Calculation R, R Square, Adjusted R Square for PGAS
Table 4.32b. Result ANOVA of PGAS stock price

Page | 77
The result shows that the model has significance
statistically to predict the stock price movement according to its R
square and F value. The technical indicators that have significance
to prediction are Simple Moving Average (SMA), Weighted
Moving Average (WMA), Stochastic Fast, Positive Volume Index
(PVI), Stochastic Slow, Relative Strength Index (RSI), and
Average Directional Index (ADX).
IV.1.33 PT TAMBANG BATU BARA BUKIT ASAM (PERSERO)
TBK (PTBA)
PTBA (PT Tambang Batubara Bukit Asam) is mining
company that exploiting, exploitation, production the coal as the
product.
The result shows the model is fit and can be used to predict
the outcome based on its R square and F-value.
R R Square Adjusted R Square
.997a 0.994 0.994
Model Sum of Squares
df Mean Square F Sig.
1 Regression 497480041.518 15 33165336.101 7685.847 .000b Residual 3055103.510 708 4315.118 Total 500535145.028 723
Table 4.33a. Calculation R, R Square, Adjusted R Square for PTBA
Table 4.33b. Result ANOVA of PTBA stock price

Page | 78
The result shows the significant individual predictor on the
model p-value. Not all the individual predictor is significant on the
model with confidence level of 95%.
Variable Sig. SMA 0.000 WMA 0.000 STOCHASTICFAST 0.000 STOCHASTICSLOW 0.000 OBV 0.003 NVI 0.009 PVI 0.018 RSI 0.025 RVI 0.129 RMI 0.329 BOLLINGERBAND 0.720 MACD 0.754 ADX 0.761 WILLIAM 0.808 ROC 0.997
The result shows that the model has significance
statistically to predict the stock price movement according to its R
square and F value. The technical indicators that have significance
to prediction are Simple Moving Average (SMA), Weighted
Moving Average (WMA), Stochastic Slow, Stochastic Fast, On
Balance Volume (OBV), Negative Volume Index (NVI), Positive
Volume Index (PVI), and Relative Strength Index (RSI).
IV.1.34 PT PERUSAHAAN PEMBANGUNAN PERSERO TBK
(PTPP)
PTPP (PT Perusahaan Pembangunan Persero TBK) is a
construction company in Indonesia and one of three construction
Table 4.33c. p-value of PTBA stock price

Page | 79
company in LQ45. PTPP provide service to build the bridge,
building, road, house, and other construction projects.
The result shows the model is fit and can be used to predict
the outcome based on its R square and F-value.
R R Square Adjusted R Square
.990a 0.980 0.979
Sum of Squares
df Mean Square F Sig.
1 Regression 201480509.048 16 12592531.815 2146.749 .000b
Residual 4147164.393 707 5865.862 Total 205627673.441 723
The result shows the significant individual predictor on the
model p-value. Not all the individual predictor is significant on the
model with the confidence level of 95%.
Variable Sig. NVI 0.000 PVI 0.000 STOCHASTICFAST 0.000 SMA 0.001 STOCHASTICSLOW 0.001 WMA 0.012 RSI 0.015 ADX 0.043 WILLIAM 0.097 OBV 0.166 RMI 0.242 RVI 0.258 MACD 0.363 EMA 0.541 ROC 0.652 BOLLINGERBAND 0.856
Table 4.34c. p-value of PTPP stock price
Table 4.34a. Calculation R, R Square, Adjusted R Square for PTPP
Table 4.34b. Result ANOVA of PTPP stock price

Page | 80
The result shows that the model has significance
statistically to predict the stock price movement according to its R
square and F value. The technical indicators that have significance
to prediction are Negative Volume Index (NVI), Positive Volume
Index (PVI), Stochastic Fast, Simple Moving Average (SMA),
Stochastic Slow, Weighted Moving Average (WMA), Relative
Strength Index (RSI), and Average Directional Index (ADX).
IV.1.35 PT SURYA CITRA MEDIA TBK (SCMA)
SCMA (PT Surya Citra Media TBK) is the multimedia
company that operates to media consultation, house production,
and TV station.
The result shows the model is fit and can be used to predict
the outcome based on its R square and F-value.
R R Square Adjusted R Square
.982a 0.964 0.963
Model Sum of Squares
df Mean Square
F Sig.
1 Regression 92511203.340 16 5781950.209 1192.721 .000b Residual 3427321.246 707 4847.696 Total 95938524.586 723
The result shows the significant individual predictor on the
model based on p-value. Not all the individual predictor is
significant on the model with the confidence level of 95%.
Table 4.35a. Calculation R, R Square, Adjusted R Square for SCMA
Table 4.35b. Result ANOVA of SCMA stock price

Page | 81
Variable Sig. STOCHASTICFAST 0.000 STOCHASTICSLOW 0.004 SMA 0.007 RMI 0.015 WMA 0.057 ROC 0.070 EMA 0.132 NVI 0.493 MACD 0.524 RVI 0.560 WILLIAM 0.620 PVI 0.737 BOLLINGERBAND 0.810 ADX 0.832 OBV 0.889 RSI 0.908
The result shows that the model has significance
statistically to predict the stock price movement according to its R
square and F value. The technical indicators that have significance
to prediction are Stochastic Fast, Stochastic Slow, Simple Moving
Average (SMA), and Relative Momentum Index (RMI).
IV.1.36 PT SEMEN INDONESIA (PERSERO) TBK (SMGR)
SMGR (PT Semen Indonesia TBK) is a cement company
that operates to distribute and produce cement to Indonesia.
The result shows the model is fit and can be used to predict
the outcome based on its R square and F-value.
R R Square Adjusted R Square
.968a 0.937 0.935
Table 4.35c. p-value of SCMA stock price

Page | 82
Sum of Squares
df Mean Square F Sig.
1 Regression 583362687.920 16 36460167.995 654.909 .000b
Residual 39360205.727 707 55672.144 Total 622722893.646 723
The result shows the significant individual predictor on the
model based on p-value. Not all the individual predictor is
significant on the model with the confidence level of 95%.
Variable Sig. SMA 0.000 WMA 0.000 STOCHASTICFAST 0.000 NVI 0.001 PVI 0.001 STOCHASTICSLOW 0.002 RMI 0.052 WILLIAM 0.069 RVI 0.089 BOLLINGERBAND 0.333 RSI 0.428 MACD 0.456 ROC 0.485 OBV 0.541 ADX 0.604 EMA 0.973
The result shows that the model has significance
statistically to predict the stock price movement according to its R
square and F value. The technical indicators that have significance
to prediction are Simple Moving Average (SMA), Weighted
Moving Average (WMA), Stochastic Fast, Stochastic Slow,
Negative Volume Index (NVI), and Positive Volume Index (PVI).
Table 4.36c. p-value of SMGR stock price
Table 4.36a. Calculation R, R Square, Adjusted R Square for SMGR
Table 4.36b. Result ANOVA of SMGR stock price

Page | 83
IV.1.37 PT SRI REJEKI ISMAN TBK (SRIL)
SRIL (PT Sri Rejeki Isman TBK) is the producer of textile
and garment, uniform, and fashion clothes.
The result shows the model is fit and can be used to predict
the outcome based on its R square and F-value.
R R Square Adjusted R Square
.976a 0.952 0.951
Sum of Squares
df Mean Square
F Sig.
1 Regression
1852603.814
16 115787.738
869.025 .000b
Residual 94199.737 707 133.239 Total 1946803.55
1 723
The result shows the significant individual predictor on the
model based on p-value. Not all the individual predictor is
significant on the model with the confidence level of 95%.
Variable Sig. SMA 0.000 WMA 0.000 NVI 0.000 PVI 0.000 STOCHASTICFAST 0.000 STOCHASTICSLOW 0.000 BOLLINGERBAND 0.155 OBV 0.160 EMA 0.302 WILLIAM 0.307
Table 4.37a. Calculation R, R Square, Adjusted R Square for SRIL
Table 4.37b. Result ANOVA of SRIL stock price

Page | 84
ADX 0.342 ROC 0.522 RMI 0.564 RSI 0.814 MACD 0.827 RVI 0.873
The result shows that the model has significance
statistically to predict the stock price movement according to its R
square and F value. The technical indicators that have significance
to prediction are Simple Moving Average (SMA), Weighted
Moving Average (WMA), Negative Volume Index (NVI),
Positive Volume Index (PVI), Stochastic Fast, and Stochastic
Slow.
IV.1.38 PT SAWIT SUMBERMAS SARANA TBK (SSMS)
SSMS (PT Sawit Sumbermas Sarana TBK) produces crude
palm oil and sale it. It operates oil palm plantation and palm oil
mill.
The result shows the model is fit and can be used to predict
the outcome based on its R square and F-value.
R R Square Adjusted R Square
.987a 0.974 0.974
Model Sum of Squares
df Mean Square
F Sig.
1 Regression 28598737.791 16 1787421.112 1662.589 .000b
Table 4.38a. Calculation R, R Square, Adjusted R Square for SSMS
Table 4.37c. p-value of SRIL stock price

Page | 85
Residual 760083.756 707 1075.083 Total 29358821.547 723
The result shows the significant individual predictor on the
model based on p-value. Not all the individual predictor is
significant on the model with the confidence level of 95%.
Variable Sig. NVI 0.000 PVI 0.000 EMA 0.001 MACD 0.002 SMA 0.019 STOCHASTICFAST 0.020 BOLLINGERBAND 0.023 RVI 0.039 STOCHASTICSLOW 0.047 RSI 0.322 RMI 0.459 ADX 0.582 OBV 0.694 WILLIAM 0.765 ROC 0.766 WMA 0.956
The result shows that the model has significance
statistically to predict the stock price movement according to its R
square and F value. The technical indicators that have significance
to prediction are Negative Volume Index (NVI), Positive Volume
Index (PVI), Exponential Moving Average (EMA), Moving
Average Convergence Divergence (MACD), Simple Moving
Average (SMA), Stochastic Fast, Bollinger Band, Relative
Volatility Index (RVI), and Stochastic Slow.
Table 4.38c p-value of SSMS stock price
Table 4.38b. Result ANOVA of SSMS stock price

Page | 86
IV.1.39 PT TELEKOMUNIKASI INDONESIA PERSERO TBK
(TLKM)
TLKM (PT Telekomunikasi Indonesia TBK) is one of the
largest telecommunication company in Indonesia providing
internet and telecommunication service.
The result shows the model is fit and can be used to predict
the outcome based on its R square and F-value.
R R Square Adjusted R Square
.993a 0.987 0.986
Model Sum of Squares
df Mean Square
F Sig.
1 Regression
219645459.369
15 14643030.625
3510.016
.000b
Residual 2953623.331 708 4171.784 Total 222599082.70
0 723
The result shows the significant individual predictor on the
model based on p-value. Not all the individual predictor is
significant on the model with the confidence level of 95%.
Variable Sig. WMA 0.000 NVI 0.000 OBV 0.000 PVI 0.000 STOCHASTICFAST 0.000 STOCHASTICSLOW 0.001 SMA 0.011 RSI 0.070
Table 4.39a. Calculation R, R Square, Adjusted R Square for TLKM
Table 4.39b. Result ANOVA of TLKM stock price

Page | 87
ROC 0.174 MACD 0.205 RMI 0.439 WILLIAM 0.600 RVI 0.809 ADX 0.892 BOLLINGERBAND 0.998
The result shows that the model has significance
statistically to predict the stock price movement according to its R
square and F value. The technical indicators that have significance
to prediction are Weighted Moving Average (WMA), Negative
Volume Index (NVI), On Balance Volume (OBV), Positive
Volume Index (PVI), Stochastic Slow, Stochastic Fast, and Simple
Moving Average (SMA).
IV.1.40 PT CHANDRA ASRI PETROCHEMICAL TBK (TPIA)
TPIA (PT Chandra Asri Petrochemical TBK) is the
petrochemical producer that produce ethylene, propylene, mixed
C4 and other chemical product.
The result shows the model is fit and can be used to predict
the outcome based on its R square and F-value.
R R Square Adjusted R Square
.999a 0.998 0.998
Model Sum of Squares df Mean Square F Sig.
1 Regression 3270063537.045 14 233575966.932 24648.546 .000b
Table 4.39c. p-value of TLKM stock price
Table 4.40a. Calculation R, R Square, Adjusted R Square for TPIA

Page | 88
Residual 6718666.519 709 9476.257 Total 3276782203.564 723
The result shows the significant individual predictor on the
model based on p-value. Not all the individual predictor is
significant on the model with the confidence level of 95%.
Variable Sig. (Constant) 0.000 WMA 0.000 NVI 0.000 STOCHASTICFAST 0.000 BOLLINGERBAND 0.003 PVI 0.004 STOCHASTICSLOW 0.004 RSI 0.005 ADX 0.008 RMI 0.012 WILLIAM 0.045 OBV 0.186 MACD 0.316 RVI 0.361 ROC 0.754
The result shows that the model has significance
statistically to predict the stock price movement according to its R
square and F value. The technical indicators that has significance
to prediction are Weighted Moving Average (WMA), Negative
Volume Index (NVI), Stochastic Fast, Bollinger Band, Positive
Volume Index (PVI), Stochastic Slow, Relative Strength Index
(RSI), Average Directional Index (ADX), Relative Momentum
Index (RMI), and William %R.
Table 4.40c. p-value of TPIA stock price
Table 4.40b. Result ANOVA of TPIA stock price

Page | 89
IV.1.41 PT UNITED TRACTOR TBK (UNTR)
UNTR (PT United Tractor) is a construction machinery
company that operates to distribute and leases the machinery such
as Nissan Diesel, Komatsu, Scania, etc.
The result shows the model is fit and can be used to predict
the outcome based on its R square and F-value.
R R Square Adjusted R Square
.997a 0.993 0.993
Model Sum of Squares df Mean Square F Sig. 1 Regression 43197475226.685 15 2879831681.779 7167.305 .000b
Residual 284475224.800 708 401801.165 Total 43481950451.485 723
The result shows the significant individual predictor on the
model based on p-value. Not all the individual predictor is
significant on the model with the confidence level of 95%.
Variable Sig. BOLLINGERBAND 0.000 EMA 0.000 MACD 0.000 STOCHASTICFAST 0.000 SMA 0.036 RMI 0.073 PVI 0.147
Table 4.41a. Calculation R, R Square, Adjusted R Square for UNTR
Table 4.41b. Result ANOVA of UNTR stock price

Page | 90
RVI 0.155 STOCHASTICSLOW 0.163 RSI 0.181 NVI 0.267 ADX 0.325 ROC 0.381 OBV 0.677 (Constant) 0.707 WILLIAM 0.942
The result shows that the model has significance
statistically to predict the stock price movement according to its R
square and F value. The technical indicators that have significance
to prediction are Bollinger Band, Exponential Moving Average
(EMA), Moving Average Convergence Divergence (MACD),
Stochastic Fast, and Simple Moving Average (SMA).
IV.1.42 PT UNILEVER INDONESIA TBK (UNVR)
UNVR (PT Unilever Indonesia TBK) is a manufacturing
company that produce goods such as soap, detergent, oil, ice
cream, tea-based beverage, cosmetic, and etc.
The result shows the model is fit and can be used to predict
the outcome based on its R square and F-value.
R R Square Adjusted R Square
.991a 0.981 0.981
Model Sum of Squares df Mean Square F Sig. 1 Regression 17910385164.778 16 1119399072.799 2319.024 .000b
Table 4.41c. p-value of UNTR stock price
Table 4.42a. Calculation R, R Square, Adjusted R Square for UNVR

Page | 91
Residual 341270797.756 707 482702.684 Total 18251655962.535 723
The result shows the significant individual predictor on the
model based on p-value. Not all the individual predictor is
significant on the model with the confidence level of 95%.
Variable Sig. SMA 0.000 NVI 0.000 PVI 0.000 (Constant) 0.001 WMA 0.002 OBV 0.005 STOCHASTICFAST 0.010 RSI 0.018 WILLIAM 0.062 BOLLINGERBAND 0.082 STOCHASTICSLOW 0.130 MACD 0.138 ADX 0.145 ROC 0.675 EMA 0.694 RMI 0.952 RVI 0.971
The result shows that the model has significance
statistically to predict the stock price movement according to its R
square and F value. The technical indicators that have significance
to prediction are Simple Moving Average (SMA), Negative
Volume Index (NVI), Positive Volume Index (PVI), Weighted
Moving Average (WMA), On Balance Volume (OBV, Stochastic
Fast, and Relative Strength Index (RSI).
Table 4.42c. p-value of UNVR stock price
Table 4.42b. Result ANOVA of UNVR stock price

Page | 92
IV.1.43 PT WIJAYA KARYA (PERSERO) TBK (WIKA)
WIKA (PT Wijaya Karya TBK) is state-owned enterprise
operates on infrastructures such as build the toll road, rail track,
bridge, and the best- known project is track line MRT Jakarta.
The result shows the model is fit and can be used to predict
the outcome based on its R square and F-value.
R R Square Adjusted R Square
.992a 0.983 0.983
Model Sum of Squares
df Mean Square
F Sig.
1 Regression 113032960.437 16 7064560.027 2600.402 .000b Residual 1920719.580 707 2716.718 Total 114953680.017 723
The result shows the significant individual predictor on the
model based on p-value. Not all the individual predictor is
significant on the model with the confidence level of 95%.
Variable Sig. NVI 0.000 PVI 0.000 STOCHASTICFAST 0.000 (Constant) 0.024 ROC 0.024 EMA 0.026 SMA 0.028 RSI 0.036 BOLLINGERBAND 0.073
Table 4.43a. Calculation R, R Square, Adjusted R Square for WIKA
Table 4.43b. Result ANOVA of PTBA stock price

Page | 93
STOCHASTICSLOW 0.124 ADX 0.153 WMA 0.310 MACD 0.322 OBV 0.435 RVI 0.466 RMI 0.831 WILLIAM 0.919
The result shows that the model has significance
statistically to predict the stock price movement according to its R
square and F value. The technical indicators that have significance
to prediction are Negative Volume Index (NVI), Positive Volume
Index (PVI), Stochastic Fast, Rate of Changes (ROC), Exponential
Moving Average (EMA), Simple Moving Average (SMA), and
Relative Strength Index (RSI).
IV.1.44 PT WASKITA BETON PRECAST TBK (WSBP)
On this research, WSBP cannot be chosen to be sample due
to the requirement for being a sample on this research is the data
has to be 3 years in order to be same with other samples. WSBP
does not have 3 years historical data due to IPO of the company is
less than 3 year.
IV.1.45 PT WAKSTIKA KARYA (PERSERO) TBK (WSKT)
WSKT is one of the state-owned enterprise that operates on
infrastructure to build the road, train track line, bridge and other
infrastructure projects.
R R Square Adjusted R Square
Table 4.43c. p-value of WIKA stock price

Page | 94
.991a 0.982 0.982
Model Sum of Squares
df Mean Square
F Sig.
1 Regression
95464988.005
16 5966561.750
2422.892
.000b
Residual 1741042.796 707 2462.578 Total 97206030.80
1 723
The result shows the significant individual predictor on the
model based on p-value. Not all the individual predictor is
significant on the model with the confidence level of 95%.
Variable Sig. SMA 0.000 WMA 0.000 STOCHASTICFAST 0.000 STOCHASTICSLOW 0.000 ADX 0.017 NVI 0.049 PVI 0.054 WILLIAM 0.083 RSI 0.185 EMA 0.214 (Constant) 0.243 BOLLINGERBAND 0.245 MACD 0.251 ROC 0.451 OBV 0.657 RVI 0.670 RMI 0.691
The result shows that the model has significance
statistically to predict the stock price movement according to its R
square and F value. The technical indicators that have significance
Table 4.45a. Calculation R, R Square, Adjusted R Square for WSKT
Table 4.45b. Result ANOVA of PTBA stock price
Table 4.45c. p-value of WSKT stock price

Page | 95
to prediction are Simple Moving Average (SMA), Weighted
Moving Average (WMA), Stochastic Fast, Stochastic Slow,
Average Directional Index (ADX), and Negative Volume Index
(NVI).
IV.2. EMPERICAL TEST
Although the result on the paper shows the technical
analysis can be used to predicting the stock price, the researcher
did test to confirm the technical analysis can be used to predicting
the stock price in real case. The researcher choose only five
companies on LQ45 as samples. Five companies are selected
because they are five biggest market capitalization on LQ45.
Market capitalization shows the market value of equity of company
is calculated by current stock price times outstanding shares.
Five companies as sample on test are:
1. PT Bank Central Asia Tbk (BBCA)
2. PT Hanjaya Mandala Sampoerna Tbk (HMSP)
3. PT Bank Rakyat Indonesia Tbk (BBRI)
4. PT Telekomunikasi Indonesia (TLKM)
5. PT Bank Mandiri (Persero) (BMRI)
The cut-off date for empirical test is August 1, 2018. The
researcher identifies the indication whether the price goes up or
goes down from the technical indicators used on the research. After

Page | 96
getting the indication on the technical indicators, the researcher
make conclusion about whether the price of company goes up or
goes down. Then the researcher looked the actual movement of the
stock price on August 2nd, 2018. If the conclusion from indication
of technical indicators different with stock price on August 2nd
2018, meaning the prediction of technical analysis is wrong.
The researcher run the empirical test and the result shows
three out of five companies on empirical test can be predicted by
technical analysis which are HMSP, BBRI, and TLKM.
IV.3 RESULT SUMMARY
The result shows that the technical analysis can predict the
stock price statistically. Some technical indicators can be used to
predict the stock price based on the result of the p-value each
indicator. Although the statistical result shows all companies can
use technical analysis for predicting the price, the empirical result
shows that only 3 out of 5 company can be predicted correctly.
The interesting point is the statistical result is different with
the empirical result. It happened because if the statistical result
showed the model is significance leading to the technical analysis
can be used, it means that at least one technical indicator is
significant to the result or in other word at least one technical
indicator can be used to predict the stock price. As you can see in

Page | 97
Appendix, three companies which are BBCA and BMRI show that
the technical analysis cannot be used in predicting the stock price
because more than half of the technical indicators show different
result with the actual next day of stock price. There are few
technical indicators shows the same result with actual next day of
stock price which leads the significant to the statistical result.

Page | 98
CHAPTER V
CONCLUSION, LIMITATIONS, AND RECOMMENDATIONS
V.1 CONCLUSION
As the statistical result shows that technical analysis can be used to
predict the stock price in all forty-four companies on LQ45. It is shows by
the significance of the model that used on the research to the outcome by
the R square value and F-value.
Based on the statistical analysis using a 95% confidence level, all
companies show different individual predictor that significant to use for
prediction. It is caused by difference indication from each technical
indicator.
Empirical test shows three out of five companies can be predicted
by most of the technical indicators. Empirical test result and statistical
result shows differently due to on the statistical analysis, the model will
become significance if at least one technical indicator can be predicted the
outcome. On empirical result shows few of technical analysis has correct
prediction to the outcome although most of the technical indicator shows
wrong prediction to the outcome that leading to wrong prediction for each
company.
The conclusion is the technical analysis can be used to predict the
stock price in the future although on the empirical test, only three out of
five shows that technical analysis can predict the stock price but it does

Page | 99
not mean that all technical indicators was wrong in prediction instead there
are few of technical indicator shows the correct prediction.
V.2 LIMITATION
Every study has limitation. The limitation can be a concern for the
next of researcher for future. The limitation for the study is that the
conclusion cannot cover all public listed company in Indonesia. On the
research, it uses forty-four companies from LQ45 (one company cannot be
used due to not provide the data with time range researcher set). There are
more than six hundred public listed companies in Indonesia and the study
only cover forty-four companies be examined.
The second limitation is the technical analysis is not only technical
indicators. There is the method that analyze the price pattern such as
double top, double bottom, etc
The third limitation is the author could have subjective in analyze
the technical indicator on the empirical evidence in interpreting the signal
of stock price movement
V.3 RECOMMENDATION
For the recommendation for the next researcher, it needs to
examine the technical analysis by analyzing the price pattern to determine
sell signal or buy signal and use the most used technical indicators. After
the analyzing the price pattern, it can examine the accuracy by same
methodology or sophisticated methodology.

Page | 100
The next recommendation is for the market participant. Although
the conclusion is the technical analysis can be used to predict the stock
price movement, it is better to put consideration about fundamental aspects
such as macroeconomy, industry competitiveness, company's condition,
and other aspects that can affect the performance of the company and
eventually can affect the stock price movement.

Page | 101
APPENDIX
EMPERICAL TESTING
This test is done to prove the technical analysis to predict the stock price
by analyze each technical indicator that on the research on cut-off date (August 1,
2018). We analyze to get indication of each technical indicator whether the stock
price will go up or go down. After analyzing, the researcher concludes the stock
price movement and compare the stock price after cut-off date. If it is true, it will
be proof the technical analysis can be used to predict the price.
PT BANK CENTRAL ASIA Tbk (BBCA)
a. Average Directional Index (ADX)
ADX line show the downward meaning it is on the low reading. Low
reading of ADX mean that the stock is on the trading range environment
which more suitable use oscillator such as RSI. In other word, low reading
ADX shows us that the stock is more suitable to analyze by oscillator for
look indication and the researcher use RSI as one of oscillator that used to
determine the indication.

Page | 102
Indication: Down
b. Bollinger Band
Bollinger band is mainly volatility indicator but in order to look the
stock price movement, the researcher uses the middle band (red line)
showing the uptrend. The middle band itself is moving average and to look
the movement of price, the researcher look on the middle band.
Indication: Up
c. Exponential Moving Average (EMA)
EMA line shows the uptrend by EMA 5, EMA 20, and EMA 60. It
indicates the price goes up.
Indication: Up

Page | 103
d. Weighted Moving Average (WMA)
WMA line shows the uptrend based on WMA 5 days, WMA 20
days, and WMA 60 days. It indicates that the price will go up.
Indication: Up
e. Simple Moving Average (SMA)
SMA line shows the uptrend based on SMA 5 days, SMA 20 days,
and SMA 60 days. It indicates the price will go up.
Indication: Up
f. Moving Average Convergence Divergence (MACD)

Page | 104
MACD line shows that it crosses up the signal line. Crossing up
the signal line indicating the buy signal or the price will go up.
Indication: Up
g. Negative Volume Index (NVI)
NVI shows the uptrend indicating the price is going up although
the volume declines. NVI is calculated if only the volume is decreased. If
the volume increase, the NVI is equal the previous NVI. The line shows
the uptrend due to the closing price is increasing when the volume decline.
Indication: Up

Page | 105
h. Positive Volume Index (PVI)
PVI shows the downward indicating the stock price will goes
down. The PVI is calculated if there is increasing the volume and if there
is decreasing volume, the PVI is equal to previous PVI. It shows that the
volume is increase but the price is going down resulting the PVI decline.
Indication: Down
i. On Balance Volume (OBV)
OBV show the downward but it starts to upward. Increasing OBV
is caused by increasing the today closing price. So, it indicates the stock
price is going up.
Indication: Up

Page | 106
j. Relative Momentum Index (RMI)
RMI shows that the price is on the overbought. However, if the
price is on the overbought, the price has possibility tend to goes down or
reversal. This indicator shows the price has been down and it predicts that
it will goes out from overbought zone.
Indication: Down
k. Rate of Changes (RoC)
Rate of Changes shows that the downtrend on upper level (above
level 100). It means that the price tends to goes down.
Indication: Down
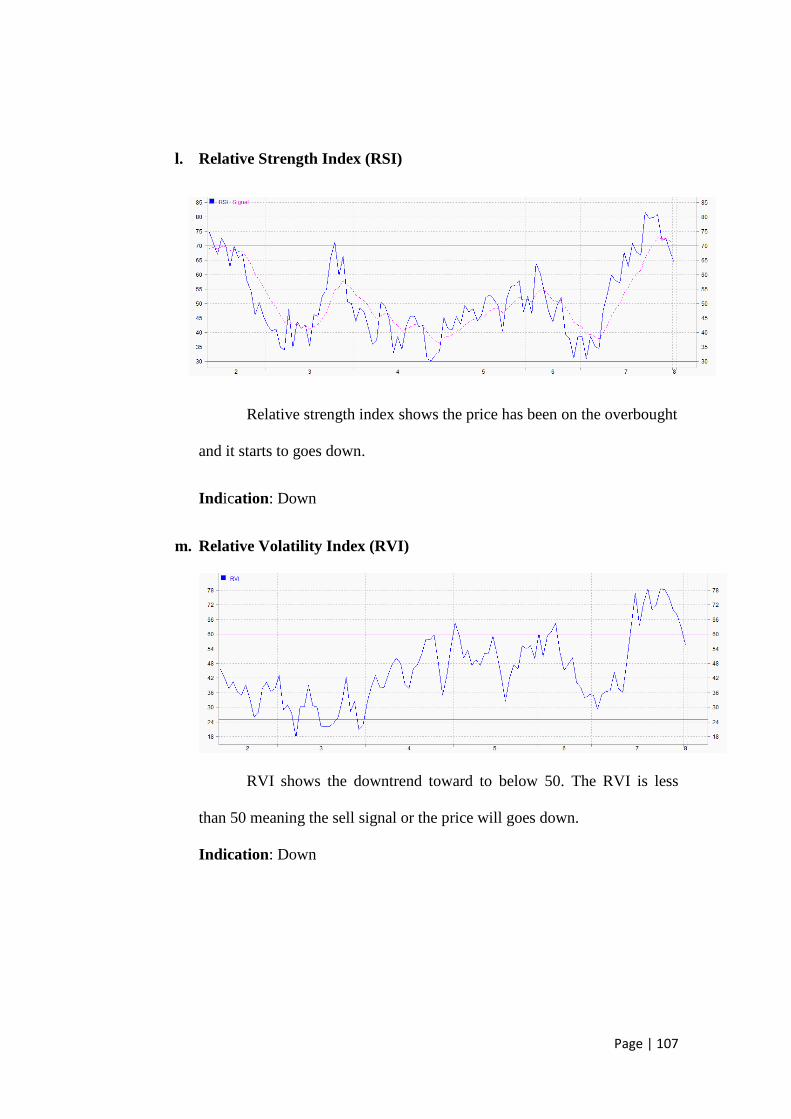
Page | 107
l. Relative Strength Index (RSI)
Relative strength index shows the price has been on the overbought
and it starts to goes down.
Indication: Down
m. Relative Volatility Index (RVI)
RVI shows the downtrend toward to below 50. The RVI is less
than 50 meaning the sell signal or the price will goes down.
Indication: Down

Page | 108
n. Stochastic Fast
The stock is on the overbought zone shown by Stochastic Fast %K
are on the above 80 level. Meaning there is probability that the price will
do reversal or in other word goes down.
Indication: Down
o. Stochastic Slow
Stochastic slow show the price is not on the overbought zone and
the %K line shows it moves upward. There is indication that the price will
goes up.
Indication: Up

Page | 109
p. William %R
William %R indicate the price is leaving the oversold meaning the
price is goes up.
Indication: Up
Technical Indicators Indication Average Directional Index (ADX) Down Bollinger Band Up Exponential Moving Average (EMA) Up Weighted Moving Average (WMA) Up Simple Moving Average (SMA) Up Moving Average Convergence Divergence (MACD)
Up
Negative Volume Index (NVI) Up Positive Volume Index (PVI) Down On Balance Volume (OBV) Up Relative Momentum Index (RMI) Down Rate of Change (ROC) Down Relative Strength Index (RSI) Down Relative Volatility Index (RVI) Down Stochastic Fast Down Stochastic Slow Up William %R Up
Prediction Actual Up Down

Page | 110
Actual Stock Movement:
The actual movement shows that the stock price on August 2nd was going down
and the close price was same on August 3rd. On next week (August 6 th), the price was
going up. The technical indicators that correctly predict the price are ADX, Positive
Volume Index, Relative Momentum Index, Rate of Change, Relative Strength Index, and
Relative Volatility Index.

Page | 111
PT HANJAYA MANDALA SAMPOERNA Tbk (HMSP)
a. Average Directional Index (ADX)
ADX line shows the upward trend after falling from point 56.
There is indication that the stock is on the trading range environment.
Stock on the trading range environment mean that the price is more
indicative trading indicator such as moving average. So, the indication will
follow the trading indicator and it is relative strength index (RSI).
Indication: Down
b. Bollinger Band
The middle band shows that the price will tend to goes up base on
the increasing in the middle band.
Indication: Up

Page | 112
c. Exponential Moving Average (EMA)
EMA shows that the EMA 5 days and EMA 20 give signal uptrend
faster than the EMA 60. It indicates that the price will be go up.
Indication: Up
d. Weighted Moving Average (WMA)
WMA shows the same indication from EMA. It shows that the
EMA 5 days and EMA 20 days is increasing meaning the price is tend to
goes up.
Indication: Up

Page | 113
e. Simple Moving Average (SMA)
SMA 5 shows the line is upward as well as SMA 20. It indicates
the stock price will go up.
Indication: Up
f. Moving Average Convergence Divergence (MACD)
MACD line shows that it is still on the above signal line. It
indicates that the stock price will be goes up.
Indication: Up

Page | 114
g. Negative Volume Index (NVI)
Declining the NVI is caused the close stock price is decline as
well. So, it indicates the stock price will goes down.
Indication: Down
h. Positive Volume Index (PVI)
Increasing the PVI shows the closing price is increasing. It
indicates the price will go up if it continues the trend.
Indication: Up

Page | 115
i. On Balance Volume (OBV)
The OBV shows the downtrend because the falling OBV are
causing from falling price. So, there is indication the price is goes down.
Indication: Down
j. Relative Momentum Index (RMI)
RMI shows the stock is overbought. Although there is probability
to price goes down from reversal, the line has just touched the level of 70
meaning there is probability that the price continues to go up as the
previous line did.
Indication: Up

Page | 116
k. Rate of Change (RoC)
ROC line shows the downtrend meaning this is indication the price
goes down.
Indication: Down
l. Relative Strength Index (RSI)
The RSI line shows it is not overbought zone but there is indication
the price will goes down after falling from 68 point.
Indication: Down

Page | 117
m. Relative Volatility Index
RVI shows it is below 50. If the RVI is below 50 meaning the sell
signal or the price will go down.
Indication: Down
n. Stochastic Fast
%K line shows the price is on the oversold after falling and touch
100 point. There is probability to reversal but it could be continue to drop.
Indication: Down

Page | 118
o. Stochastic Slow
Stochastic slow shows the price is not on the oversold but the trend
shows there is indication to falling down.
Indication: Down
p. William %R
William %R shows the price on the overbought. Overbought on
William %R is on the below. Overbought has indication the price has
reversal or in other word falling down.
Indication: Down

Page | 119
Technical indicators Indication Average Directional Index (ADX) Down Bollinger Band Up Exponential Moving Average (EMA) Up Weighted Moving Average (WMA) Up Simple Moving Average (SMA) Up Moving Average Convergence Divergence (MACD) Up Negative Volume Index (NVI) Down Positive Volume Index (PVI) Up On Balance Volume (OBV) Down Relative Momentum Index (RMI) Up Rate of Change (ROC) Down Relative Strength Index (RSI) Down Relative Volatility Index (RVI) Down Stochastic Fast Down Stochastic Slow Down William %R Down
Actual Price Movement
Prediction Actual Down Down
The stock price continued to go down on August 2nd on the August 3rd, it
started to increased. It is predicted by ADX, Negative Volume Index, On Balance
Volume, Rate of Change, Relative Strength Index, Relative Volatility Index,
Stochastic Fast, Stochastic Slow, William %R

Page | 120
PT BANK RAYKAT INDONESIA TBK (BBRI)
a. Average Directional Index (ADX)
Low reading indicating the stock on the trading mode meaning in order
to analyze the stock, the researcher look on the oscillator and the oscillator
used on this analysis is RSI (Relative Strength Index). The indication will
follow the oscillator.
Indication: Up
b. Bollinger Band
The researcher uses middle band to analyze the movement of stock
price and it shows the trend is downtrend meaning the price will goes
down.
Indication: Down.

Page | 121
c. Exponential Moving Average (EMA)
EMA 5 and EMA 20 shows the price will be rising up but the
EMA 60 has lag to identifies the signal of price going up.
Indication: Up
d. Weighted Moving Average (WMA)
WMA 5 and WMA 20 shows there is indication of price is going up so
it indicates the price goes up.
Indication: Up

Page | 122
e. Simple Moving Average (SMA)
SMA 5 and SMA 20 shows there is indication uptrend meaning the
price has probability to rising up.
Indication: Up
f. Moving Average Convergence Divergence (MACD)
MACD line shows it is above the signal line meaning the price
would be rising up.
Indication: Up

Page | 123
g. Negative Volume Index
There is decline on the NVI. It is caused by the closing price is
lower than the yesterday closing price in the calculation of NVI. If it will
continue the trend, the stock price will go down.
Indication: Down
h. Positive Volume Index
PVI show there is increasing and it indicate the stock price will be
going up.
Indication: Up

Page | 124
i. On Balance Volume
OBV shows the downtrend after falling from the highest peak. It
indicates the price could be goes down.
Indication: Down
j. Relative Momentum Index
RMI shows there is indication the movement starts to increase and start
to touch the overbought zone. It indicates the price is still continue goes
up.
Indication: Up

Page | 125
k. Rate of Changes (RoC)
RoC shows the trend is uptrend meaning the price will be goes up.
Indication: Up
l. Relative Strength Index
RSI shows the line is on the uptrend after falling the 30 point. It
does not indicate the overbought and there is no probability the price is
reversal. It will continue to rise up if followed by its trend.
Indication: Up

Page | 126
m. Relative Volatility Index
RVI shows that the trend is upward and it could be more than 50 point.
If it is more than 50 point, the price will go up.
Indication: Up
n. Stochastic Fast
Stochastic Fast has indicate the overbought meaning there is
probability reversal or other word is the price will go down
Indication: Down

Page | 127
o. Stochastic Slow
It shows the stock is on the overbought zone and there is
probability to reversal or in other word the price will go down.
Indication: Down
p. William %R
It shows the stock is on the overbought and there is probability to
reversal with caution the price is going down.
Indication: Down

Page | 128
Technical indicators Indication Average Directional Index (ADX) Up Bollinger Band Down Exponential Moving Average (EMA) Up Weighted Moving Average (WMA) Up Simple Moving Average (SMA) Up Moving Average Convergence Divergence (MACD) Up Negative Volume Index (NVI) Down Positive Volume Index (PVI) Up On Balance Volume (OBV) Down Relative Momentum Index (RMI) Up Rate of Changes (ROC) Up Relative Strength Index (RSI) Up Relative Volatility Index (RVI) Up Stochastic Fast Down Stochastic Slow Down William %R Down
Actual Price Movement:
Prediction Actual Up Up
The blue line show that on August 2nd the price is conformed going up
until the August 6th. It means that the technical indicators that can predict are
ADX, EMA, SMA, WMA, MACD, PVI, RMI, ROC, RSI, and RVI.

Page | 129
PT TELEKOMUNIKASI INDONESIA TBK (TLKM)
a. Average Directional Index (ADX)
ADX line shows us that it is still on the low reading meaning the
security on the trading mode. In other word that the security is more
significance to the oscillator such as relative strength index (RSI)
Indication: Up
b. Bollinger Band
In order to look the signal of stock price movement, the researcher
use the middle band because the calculation of middle band on Bollinger
band is actually the moving average 20 days. The middle band shows us
the line was on the bullish trend and there is starting point which the price
will go down. It can be signal that the price is starting to go down and

Page | 130
moving average on the middle band is moving average 20 which it has
longer time span and it will reduce the whipsaw
Indication: Down
c. Exponential Moving Average (EMA)
EMA shows there is indication the price will go down and it is
indicated by EMA 5 days which the fastest moving average. The
researcher looks the EMA with longer time span which is EMA 20 in
order to minimize the whipsaw. EMA 20 also show there is indication the
price will go down and EMA 60 shows the same indication.
Indication: Down
d. Weighted Moving Average (WMA)

Page | 131
WMA 5 shows the indication that the price will go down as the
EMA 5 does. The longer time span WMA, WMA 20, shows the same
indication which price will go down and WMA 60 shows the same.
Indication: Down
e. Simple Moving Average (SMA)
SMA 5 shows the same indication with the WMA and EMA. The
indication shows the price will be go down based on SMA 5. The
researcher looks the longer time span which is SMA 20 and SMA 60 for
reducing the whipsaw. The SMA 20 shows the price was on the uptrend
until there is line that direct to downside. It happened to the SMA 60 as
well. But SMA 20 and SMA 60 has longer time and it will show the
downtrend indication slower than the SMA 5.
Indication: Down

Page | 132
f. Moving Average Convergence Divergence (MACD)
MACD line shows that the line is crossing down the signal line
indicating the price will go down.
Indication: Down
g. Negative Volume Index
NVI shows it is decline. Decreasing NVI is caused by the today
closing price is lower than the yesterday closing price. If it continues, the
stock price will go down.
Indication: Down

Page | 133
h. Positive Volume Index
Positive Volume Index shows the uptrend and there was downline
in last period. It cannot be sure the price will continue to go up.
Indication: Up
i. On Balance Volume
On Balance Volume shows there is downline indicating the price
will falling down.
Indication: Down

Page | 134
j. Relative Momentum Index
RMI shows the security is on the oversold. There is possibility that
there is reversal or the price is rebound.
Indication: Up
k. Rate of Changes (RoC)
Rate of changes clearly show there is extreme decline. It indicates
the price will go down.
Indication: Down

Page | 135
l. Relative Strength Index (RSI)
Relative strength index shows the stock is on the oversold. It will
be reversal that the price will be rebound.
Indication: Up.
m. Relative Volatility Index
Relative volatility index shows the RVI is below the 50 points meaning
the it is sell signal or the price will falling down.
Indication: Down

Page | 136
n. Stochastic Fast
Stochastic fast shows the price is oversold but it shows that
reversal is starting and that is indication the price will be rebound.
Indication: Up
o. Stochastic Slow
Stochastic slow show the price is on the oversold. There is not
indication the price will reversal but there is possibility the price will
rebound.
Indication: Up

Page | 137
p. William %R
The William %R shows the price is on the oversold and there is
possibility the price will go up or rebound.
Indication: Up
Technical indicators Indication Average Directional Index (ADX) Up Bollinger Band Down Exponential Moving Average (EMA) Down Weighted Moving Average (WMA) Down Simple Moving Average (SMA) Down Moving Average Convergence Divergence (MACD) Down Negative Volume Index (NVI) Down Positive Volume Index (PVI) Up On Balance Volume (OBV) Down Relative Momentum Index (RMI) Up Rate of Changes (ROC) Down Relative Strength Index (RSI) Up Relative Volatility Index (RVI) Down Stochastic Fast Up Stochastic Slow Up William %R Up
Prediction Actual Down Down

Page | 138
Actual Price Movement
The purple line shows that at August 2nd until August 3rd the stock price of TLKM is
confirmed down followed by increasing the stock price only one day and after that the
stock price was continuing go down. The technical indicators that correctly predict the
stock price are Bollinger Band, EMA, SMA, WMA, MACD, NVI, OBV, ROC, and
RVI.

Page | 139
PT BANK MANDIRI (PERSERO) (BMRI)
a. Average Directional Index (ADX)
ADX line shows the low reading meaning the security is
significantly indicate by trading indicator such as relative strength index.
Indication: Down
b. Bollinger Band
The middle band shows there is downtrend indicating the price will be
goes down.
Indication: Down

Page | 140
c. Exponential Moving Average (EMA)
EMA 5 shows the line is rising up indicating the stock price will
rebound. It is shown by the EMA 20, which has longer time span, that the
indication of price will goes up appear but on the EMA 60, it does not
appear because the EMA 60 has the longest time span so the signal is not
responsive.
Indication: Up
d. Weighted Moving Average (WMA)
WMA 5 shows the line is rising up followed by WMA 20. It is starting
point that the stock price will start to rising up.
Indication: Up

Page | 141
e. Simple Moving Average (SMA)
SMA 5 and SMA 20 show that the line is starting to rise up. Those
SMA indicate the price will be going up.
Indication: Up
f. Moving Average Convergence Divergence (MACD)
MACD line clearly indicate the buy signal by showing the MACD line
cross up the signal line.
Indication: Up

Page | 142
g. Negative Volume Index (NVI)
Increasing NVI is caused the today closing price is higher than the
yesterday closing price followed by decreasing volume. If it continues, the
price will continue to up.
Indication: Up
h. Positive Volume Index (PVI)
Decreasing PVI shows that it will be followed by price falling. Because
the PVI is calculate when the price is goes up. If the price is going down,
the PVI will fall as well.
Indication: Down

Page | 143
i. On Balance Volume (OBV)
OBV shows that the trend is going down. It simply indicating the price
will going down.
Indication: Down
j. Relative Momentum Index (RMI)
The RMI shows that the price is on the overbought. It will indicate the
price will goes down due to possibility to reversal.
Indication: Down

Page | 144
k. Rate of Changes (RoC)
Rate of changes shows there is indication that the stock price is going
up because it shows the uptrend on the rate of changes.
Indication: Up
l. Relative Strength Index (RSI)
Relative strength index shows the line is on the overbought and it can
continue to goes up because it shows the uptrend.
Indication: Up

Page | 145
m. Relative Volatility Index
It shows the uptrend and it indicate the price will goes up.
Indication: Up
n. Stochastic Fast
Stochastic fast shows the security is on the overbought and it has
probability that the security has reversal due to high reading on the
stochastic fast.
Indication: Down

Page | 146
o. Stochastic Slow
Stochastic slow show the same with the fast one. It shows the security
is overbought and it has probability the price will reversal turning down
because it has been the high reading.
Indication: Down
p. William %R
William %R show the security is overbought. It has probability the
security has reversal.
Indication: Down

Page | 147
Technical indicators Indication Average Directional Index (ADX) Up Bollinger Band Up Exponential Moving Average (EMA) Down Weighted Moving Average (WMA) Down Simple Moving Average (SMA) Down Moving Average Convergence Divergence (MACD) Down Negative Volume Index (NVI) Up Positive Volume Index (PVI) Down On Balance Volume (OBV) Down Relative Momentum Index (RMI) Down Rate of Changes (ROC) Up Relative Strength Index (RSI) Up Relative Volatility Index (RVI) Up Stochastic Fast Down Stochastic Slow Down William %R Down
Prediction Actual Down Up
Actual Price Movement:
REFERENCES
After cut-off date, the stock price on BMRI actually was increase until August
6th. The technical indicators that correctly predict the stock price are ADX,
Bollinger Band, NVI, ROC, RSI, and RVI.

Page | 148
REFERENCES
Bloomberg. (2018). AKRA:IJ. Retrieved from Bloomberg Web Site: https://www.bloomberg.com/quote/AKRA:IJ
Equis International. (2009). MetaStock Professional. Salt Lake City: Equis International.
Fama, E. (1965). The Behavior of Stock-Market Prices. The Journal of Business, 34-105.
Fama, E. F. (1970). A Review of Theory and Empirical Work. The Journal of Finance, 383-417.
Field, A. (2009). Discovering Statistic Using SPSS: (and sex and drugs and rock 'n' roll). Los Angeles: SAGE Publications.
Grobebner, D. F., Shannon, P. W., Fry, P. C., & Smith, K. D. (2011). Business Statistic A Decision-Making Approach. New jersey: Pearson Education.
Hamilton, W. P. (1922). The stock market barometer: a study of its forecast value based on Charles H Dow's theory of the price movement : with an analysis of the market and its history since 1897. New York: Harper & Bros.
Indonesia Stock Exchange. (n.d.). LQ45 Index Methodology. Retrieved from Bursa Efek Indonesia Web Site: https://www.idx.co.id/media/1482/lq45-index-methodology-by-idx.pdf
Ivanoski, Z., Nadica, I., & Narasanov, Z. (2017). Technical Analysis Accurancy at Macedonian Stock Exchange. UTMS Journal of Economics, 105-118.
Murphy, J. (1999). Technical Analysis of Financial Market. New York: New York Institute of Finance.
Park, S. H.-H. (2007). What Do We Know About the Profitability of Technical Analysis? Journal of Economic Surveys, 786–826.
Pring, M. J. (2014). Technical Analysis Explained. Singapore: McGraw-Hill Education.
PT Bursa Efek Indonesia. (2018, July 26). Pengumuman. Retrieved from IDX Web site: http://www.idx.co.id/StaticData/NewsAndAnnouncement/ANNOUNCEMENTSTOCK/Exchange/PENG-00696_BEI-OPP_07-2018-.zip


