
The Aging Population:Driving Health Care Real Estate Investments
Corporate Presentation November 2016
Forward Looking Statements
This document contains “forward-looking” statements as that term is defined in the Private Securities Litigation Reform Act of 1995. When the
company uses words such as “may,” “will,” “intend,” “should,” “believe,” “expect,” “anticipate,” “project,” “pro forma,” “estimate” or similar
expressions that do not relate solely to historical matters, it is making forward-looking statements. In particular, these forward-looking
statements include, but are not limited to, those relating to the company’s opportunities to acquire, develop or sell properties; the company’s
ability to close its anticipated acquisitions, investments or dispositions on currently anticipated terms, or within currently anticipated
timeframes; the expected performance of the company’s operators/tenants and properties; the company’s expected occupancy rates; the
company’s ability to declare and to make distributions to stockholders; the company’s investment and financing opportunities and plans; the
company’s continued qualification as a real estate investment trust (“REIT”); the company’s ability to meet its earning guidance; and the
company’s ability to access capital markets or other sources of funds.
Forward-looking statements are not guarantees of future performance and involve risks and uncertainties that may cause the company’s
actual results to differ materially from the company’s expectations discussed in the forward-looking statements. This may be a result of
various factors, including, but not limited to: the status of the economy; the status of capital markets, including availability and cost of capital;
issues facing the health care industry, including compliance with, and changes to, regulations and payment policies, responding to
government investigations and punitive settlements and operators’/tenants’ difficulty in cost-effectively obtaining and maintaining adequate
liability and other insurance; changes in financing terms; competition within the health care and seniors housing industries; negative
developments in the operating results or financial condition of operators/tenants, including, but not limited to, their ability to pay rent and repay
loans; the company’s ability to transition or sell properties with profitable results; the failure to make new investments or acquisitions as and
when anticipated; natural disasters and other acts of God affecting the company’s properties; the company’s ability to re-lease space at
similar rates as vacancies occur; the company’s ability to timely reinvest sale proceeds at similar rates to assets sold; operator/tenant or joint
venture partner bankruptcies or insolvencies; the cooperation of joint venture partners; government regulations affecting Medicare and
Medicaid reimbursement rates and operational requirements; liability or contract claims by or against operators/tenants; unanticipated
difficulties and/or expenditures relating to future investments or acquisitions; environmental laws affecting the company’s properties; changes
in rules or practices governing the company’s financial reporting; the movement of U.S. and foreign currency exchange rates; the company’s
ability to maintain its qualification as a REIT; key management personnel recruitment and retention; and other risks described in the
company’s reports filed from time to time with the Securities and Exchange Commission. Finally, the company assumes no obligation to
update or revise any forward-looking statements, whether because of new information, future events or otherwise, or to update the reasons
why actual results could differ from those projected in any forward-looking statements.
2
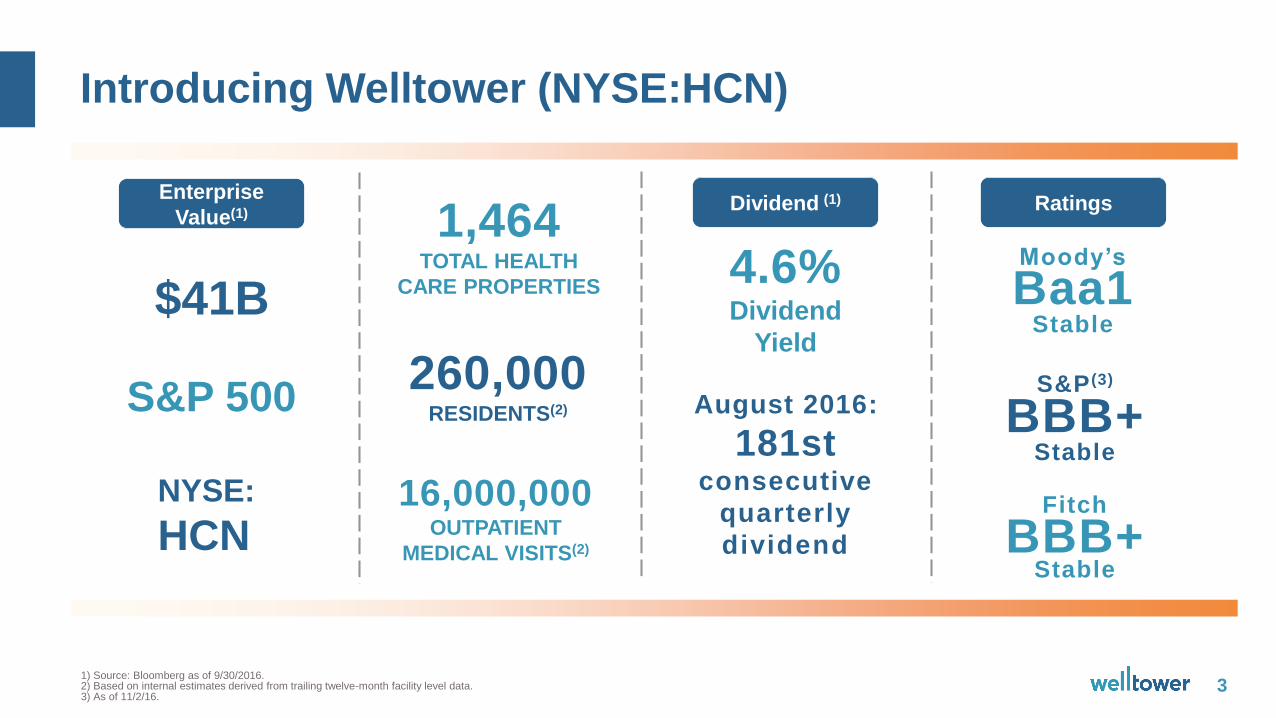
Introducing Welltower (NYSE:HCN)
3
4.6%Dividend
Yield
August 2016:
181stconsecutive
quarterly
dividend
Dividend (1)
Moody’s
Baa1Stable
S&P (3)
BBB+Stable
Fitch
BBB+Stable
Ratings
$41B
Enterprise
Value(1)
S&P 500
NYSE:
HCN
1,464TOTAL HEALTH
CARE PROPERTIES
260,000RESIDENTS(2)
16,000,000OUTPATIENT
MEDICAL VISITS(2)
1) Source: Bloomberg as of 9/30/2016.2) Based on internal estimates derived from trailing twelve-month facility level data. 3) As of 11/2/16.
4
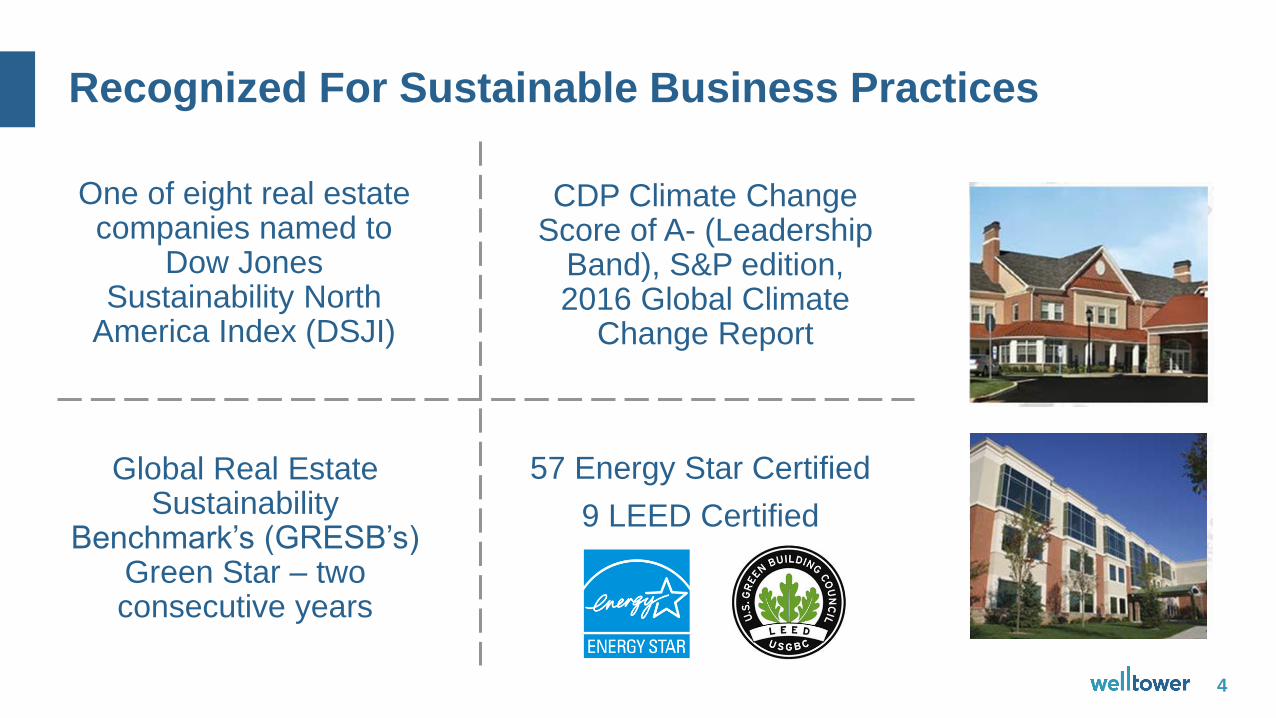
Recognized For Sustainable Business Practices
One of eight real estate companies named to
Dow Jones Sustainability North
America Index (DSJI)
Global Real Estate Sustainability
Benchmark’s (GRESB’s) Green Star – two consecutive years
CDP Climate Change Score of A- (Leadership
Band), S&P edition, 2016 Global Climate
Change Report
57 Energy Star Certified
9 LEED Certified
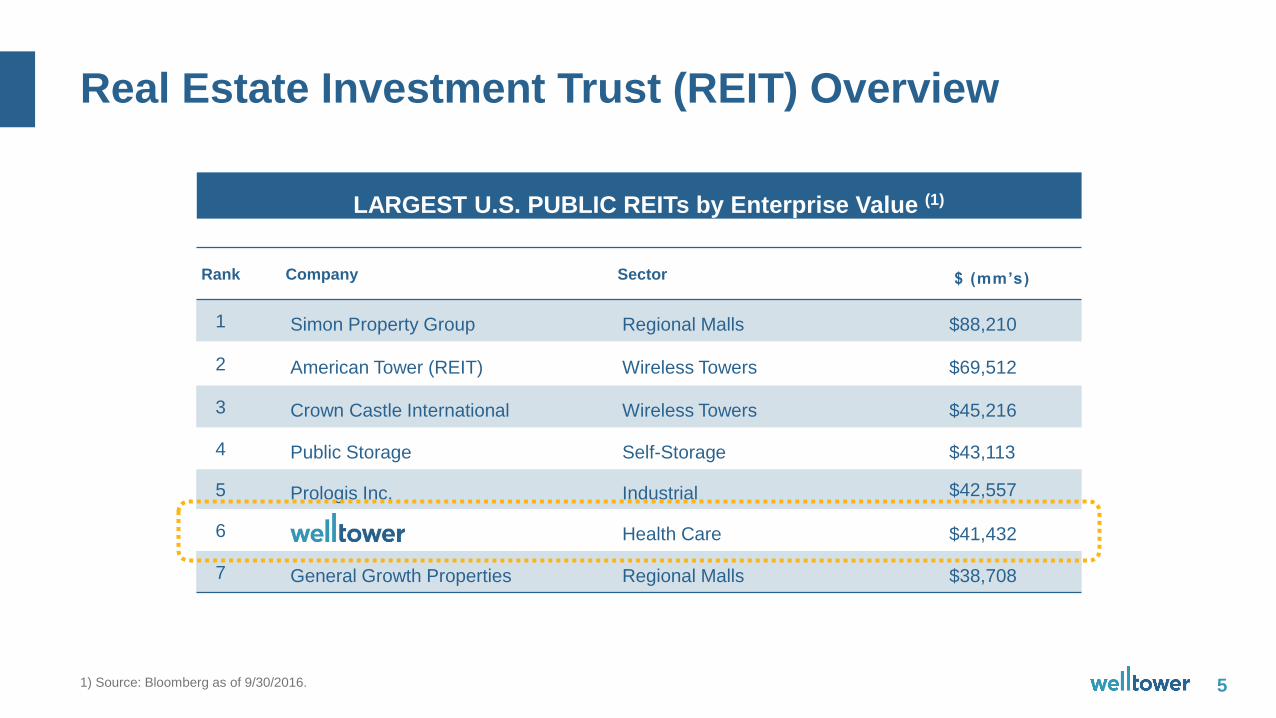
Real Estate Investment Trust (REIT) Overview
51) Source: Bloomberg as of 9/30/2016.
LARGEST U.S. PUBLIC REITs by Enterprise Value (1)
RANK COMPANY
COMPANY
Rank Company Sector $ (mm’s)
1 Simon Property Group Regional Malls $88,210
2 American Tower (REIT) Wireless Towers $69,512
3 Crown Castle International Wireless Towers $45,216
4 Public Storage Self-Storage $43,113
5 Prologis Inc. Industrial $42,557
6 Health Care $41,432
7 General Growth Properties Regional Malls $38,708
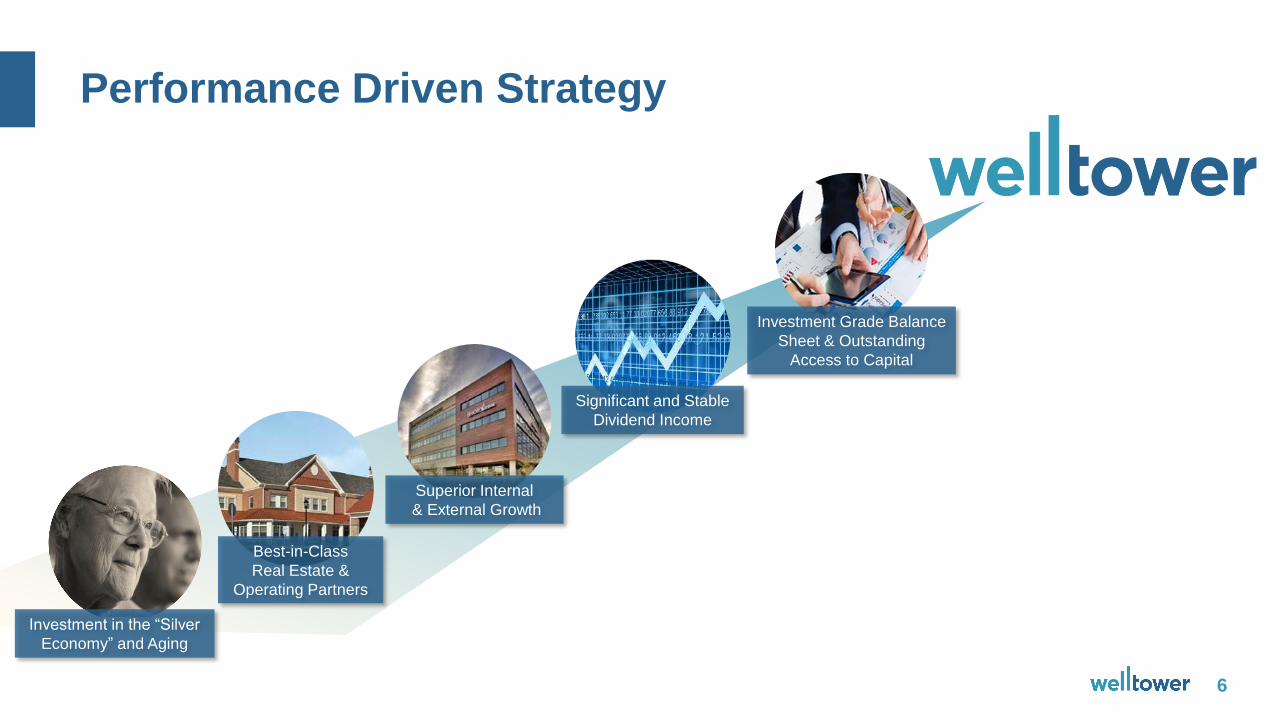
Performance Driven Strategy
6
Investment in the “Silver
Economy” and Aging
Best-in-Class
Real Estate &
Operating Partners
Superior Internal
& External Growth
Investment Grade Balance
Sheet & Outstanding
Access to Capital
Significant and Stable
Dividend Income

Powerful Growth Trends for Health Care Real Estate
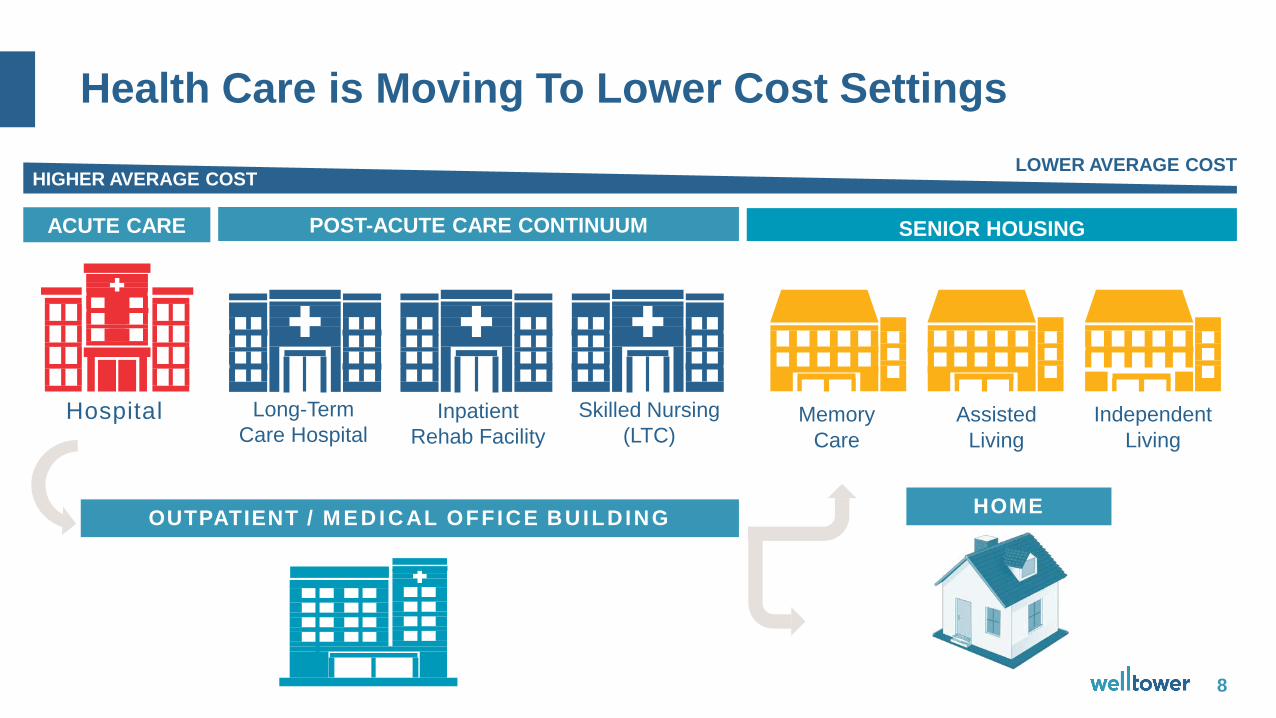
Health Care is Moving To Lower Cost Settings
8
HIGHER AVERAGE COSTLOWER AVERAGE COST
Hospital Memory
Care
Assisted
Living
Independent
Living
SENIOR HOUSINGACUTE CARE POST-ACUTE CARE CONTINUUM
Skilled Nursing
(LTC)Inpatient
Rehab Facility
Long-Term
Care Hospital
OUTPATIENT / M E D I C AL OFFICE BUILDINGHOME
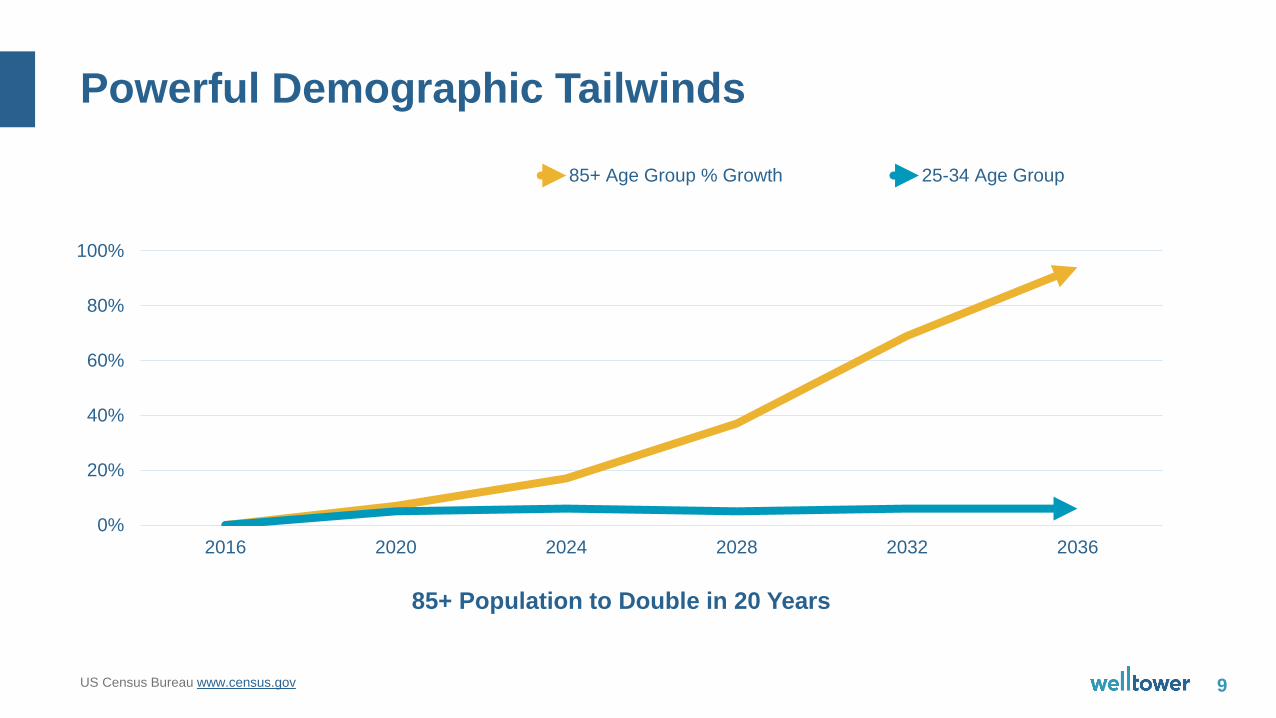
Powerful Demographic Tailwinds
9US Census Bureau www.census.gov
0%
20%
40%
60%
80%
100%
2016 2020 2024 2028 2032 2036
85+ Age Group % Growth 25-34 Age Group
85+ Population to Double in 20 Years
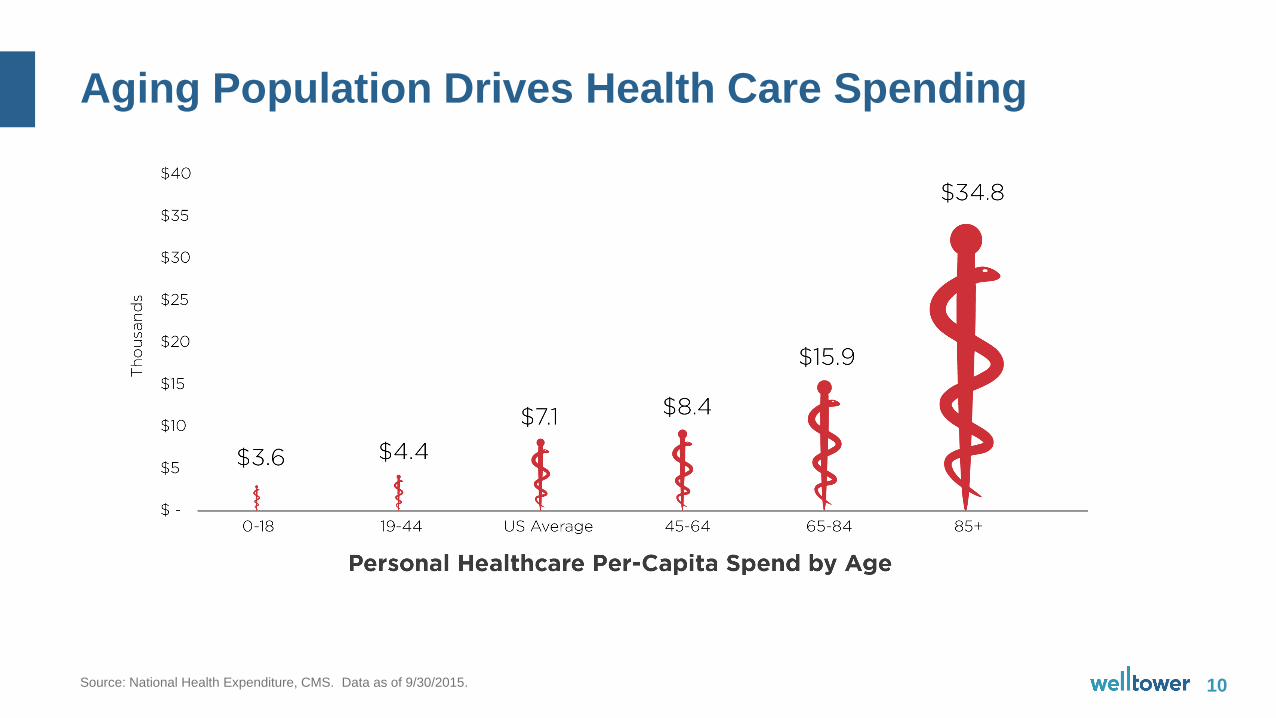
Aging Population Drives Health Care Spending
10Source: National Health Expenditure, CMS. Data as of 9/30/2015.
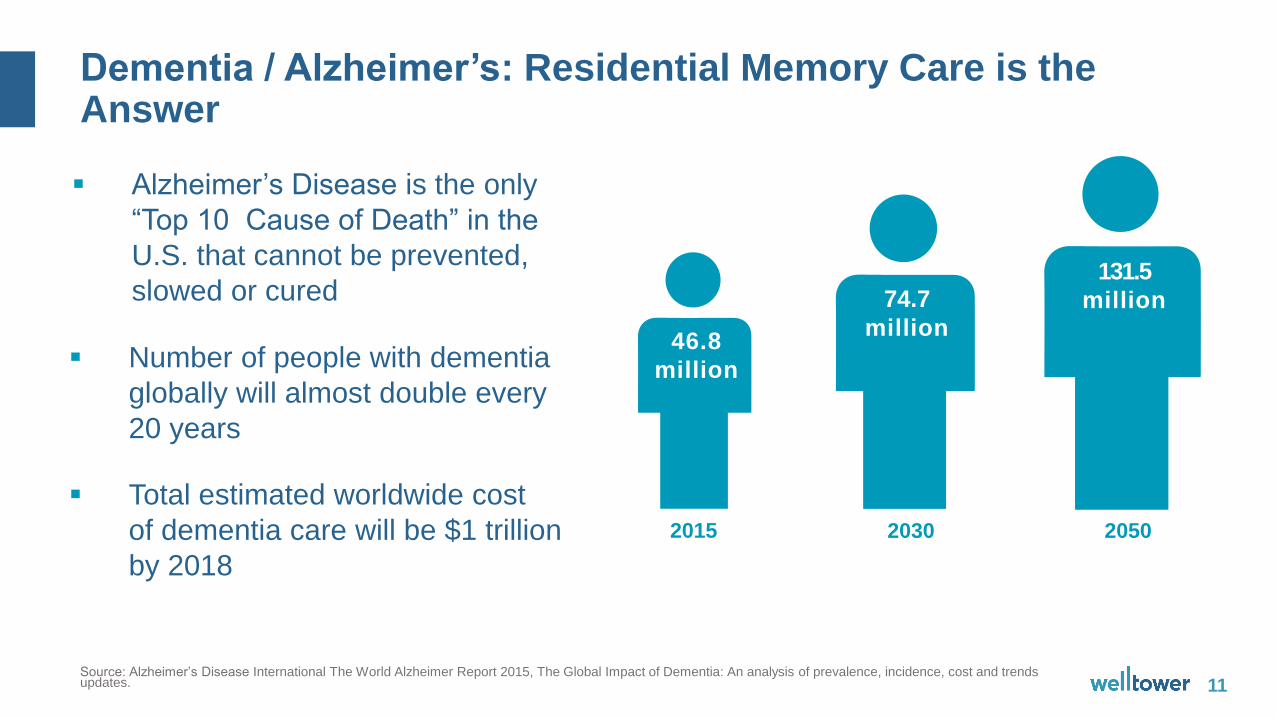
Dementia / Alzheimer’s: Residential Memory Care is the Answer
11Source: Alzheimer’s Disease International The World Alzheimer Report 2015, The Global Impact of Dementia: An analysis of prevalence, incidence, cost and trends updates.
Alzheimer’s Disease is the only
“Top 10 Cause of Death” in the
U.S. that cannot be prevented,
slowed or cured
Number of people with dementia
globally will almost double every
20 years
Total estimated worldwide cost
of dementia care will be $1 trillion
by 2018
2015 2030 2050
46.8
million
74.7
million
131.5
million

Welltower’s Unique Growth Platform
1. Based on NOI for 1Q10 and IN-Place NOI for 3Q16 and Pro forma. Please see non-GAAP financial measures and reconciliations at the end of this presentation.
2. Based on estimated 4Q16 dispositions and acquisitions per the company’s “Welltower Announces Significant Portfolio Repositioning” press release issued November 2, 2016.
3. Comprises Seniors Housing Triple-Net and Seniors Housing Operating properties.
1Q10
Private Pay: 69%
3Q16 Pro Forma (2)
Private Pay: 89%
Portfolio Transformation(1)
Private Pay: 92%
SENIORS
HOUSING(3)
64%
OUTPATIENT
MEDICAL
16%
LONG-TERM/
POST-ACUTE CARE
20%
SENIORS
HOUSING(3)
70%
OUTPATIENT
MEDICAL
17%
LONG-TERM/
POST-ACUTE CARE
13%
LONG-TERM/
POST-ACUTE CARE
31%
OUTPATIENT
MEDICAL
19%
SENIORS
HOUSING(3)
40%
LIFE SCIENCE
2%
HOSPITALS
8%
13
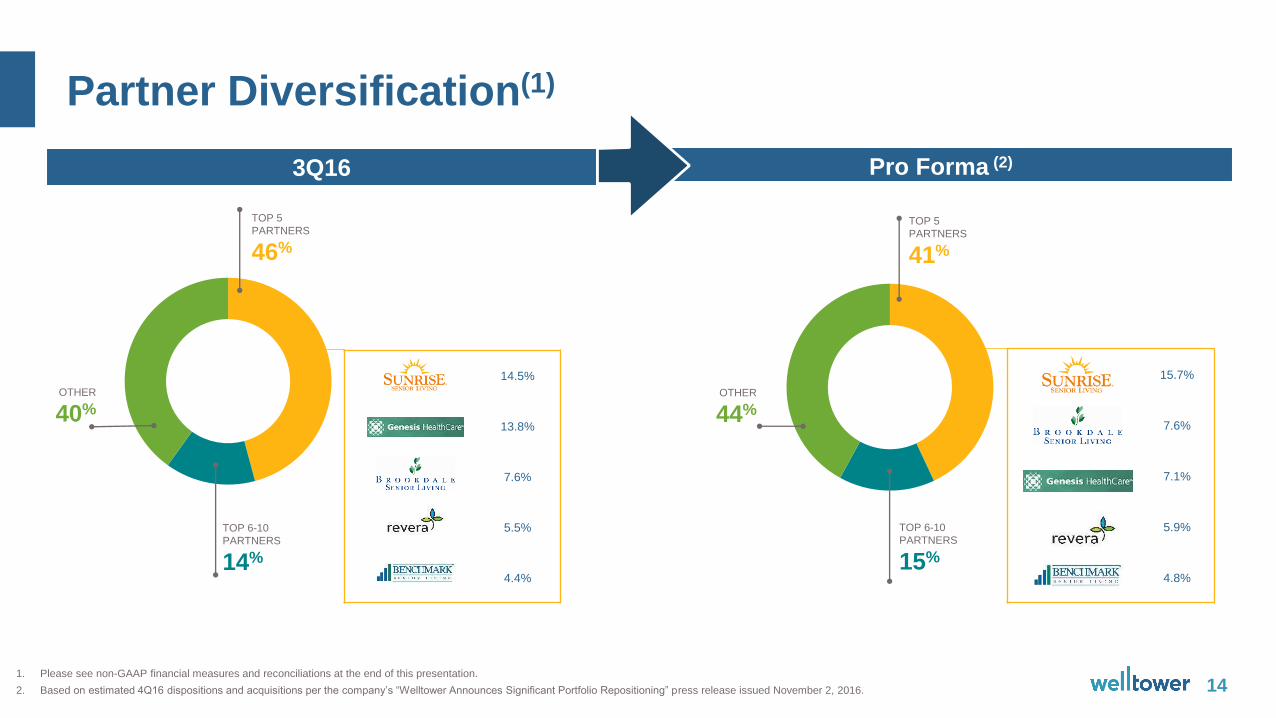
14.5%
13.8%
7.6%
5.5%
4.4%
TOP 5
PARTNERS
46%
TOP 6-10
PARTNERS
14%
1. Please see non-GAAP financial measures and reconciliations at the end of this presentation.
2. Based on estimated 4Q16 dispositions and acquisitions per the company’s “Welltower Announces Significant Portfolio Repositioning” press release issued November 2, 2016.
3Q16 Pro Forma (2)
• Positive Portfolio Transformation
Partner Diversification(1)
15.7%
7.6%
7.1%
5.9%
4.8%
OTHER
40%OTHER
44%
TOP 6-10
PARTNERS
15%
TOP 5
PARTNERS
41%
14
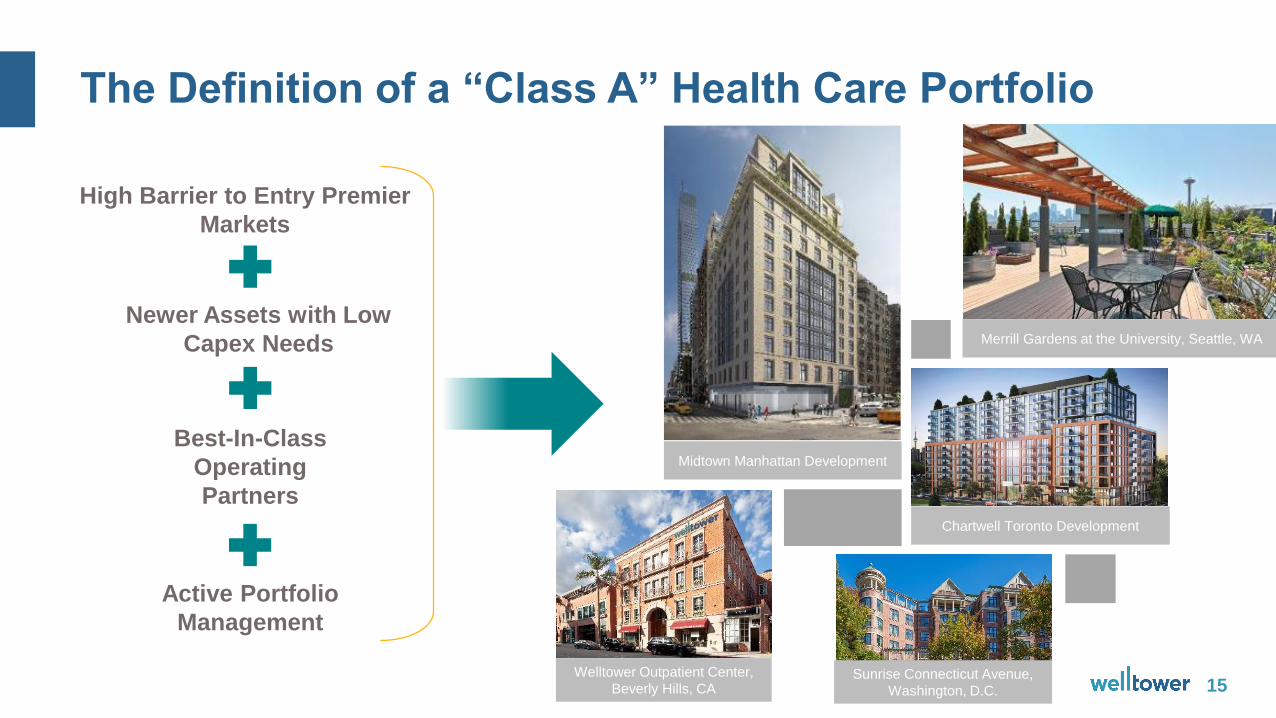
The Definition of a “Class A” Health Care Portfolio
15
Active Portfolio
Management
Best-In-Class
Operating
Partners
High Barrier to Entry Premier
Markets
Newer Assets with Low
Capex Needs
Midtown Manhattan Development
Sunrise Connecticut Avenue,
Washington, D.C.
Welltower Outpatient Center,
Beverly Hills, CA
Merrill Gardens at the University, Seattle, WA
Chartwell Toronto Development
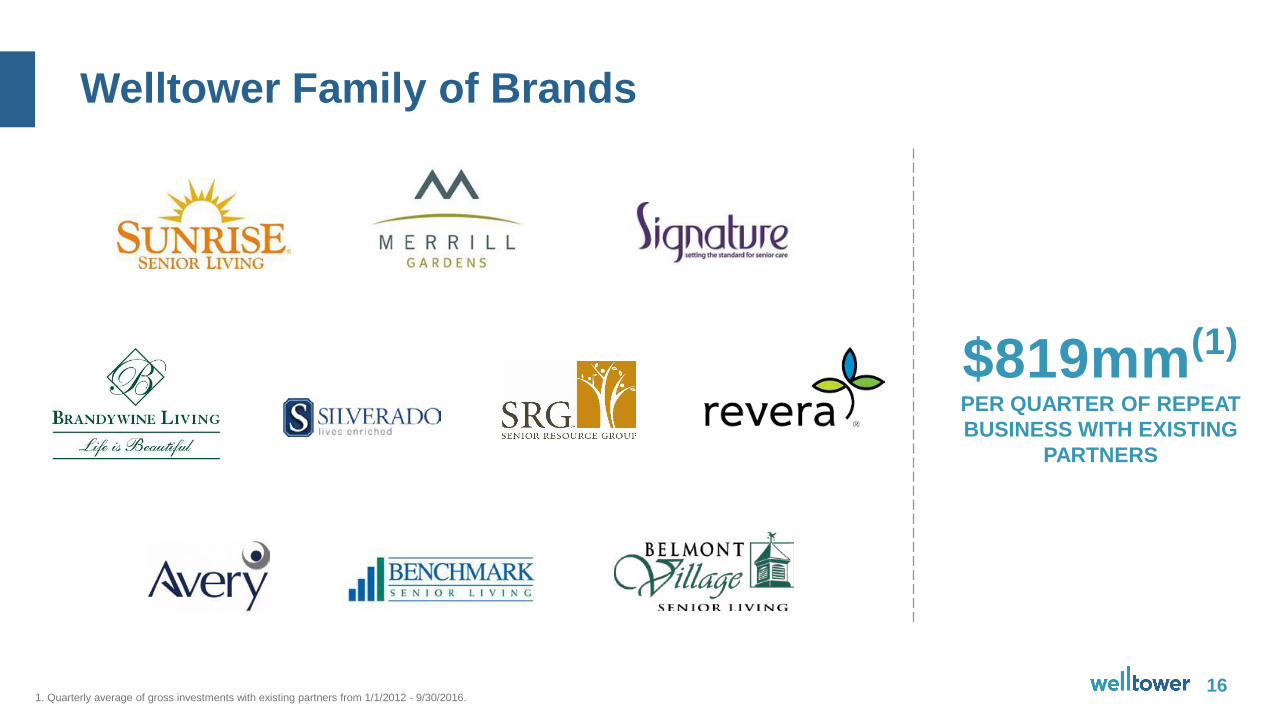
Welltower Family of Brands
161. Quarterly average of gross investments with existing partners from 1/1/2012 - 9/30/2016.
$819mm(1)
PER QUARTER OF REPEAT
BUSINESS WITH EXISTING
PARTNERS
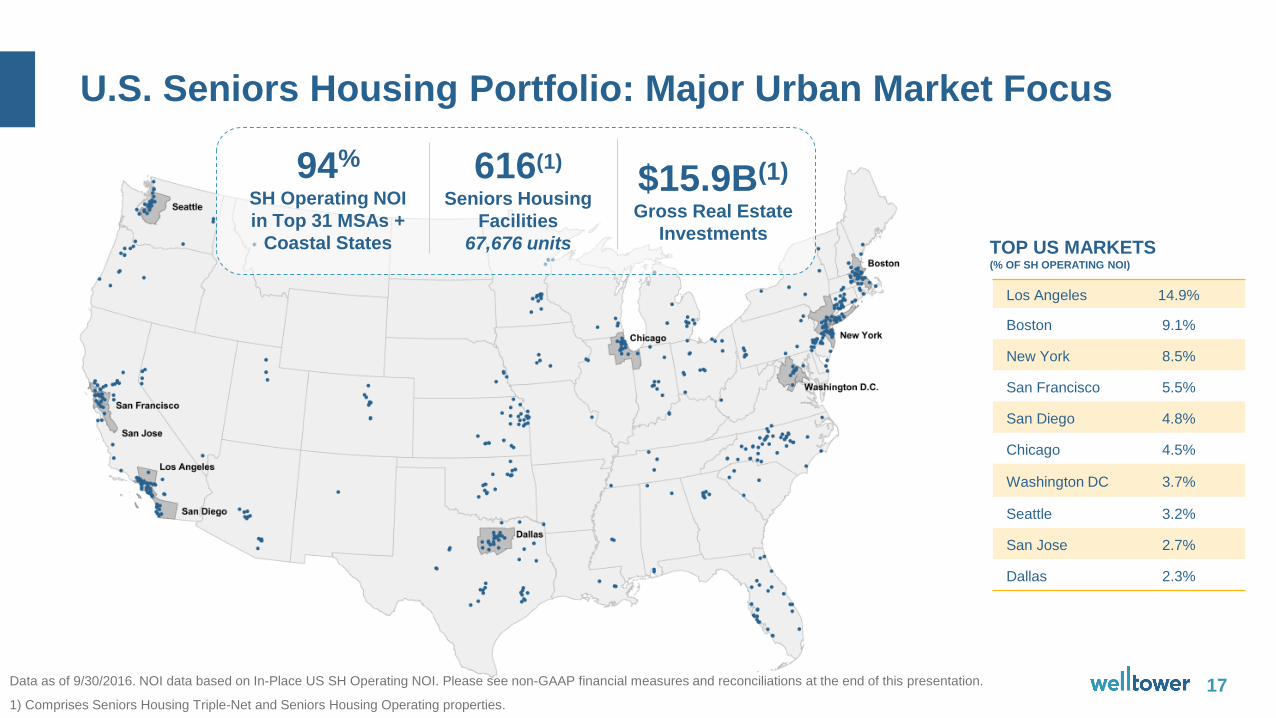
U.S. Seniors Housing Portfolio: Major Urban Market Focus
17Data as of 9/30/2016. NOI data based on In-Place US SH Operating NOI. Please see non-GAAP financial measures and reconciliations at the end of this presentation.
1) Comprises Seniors Housing Triple-Net and Seniors Housing Operating properties.
TOP US MARKETS(% OF SH OPERATING NOI)
Los Angeles 14.9%
Boston 9.1%
New York 8.5%
San Francisco 5.5%
San Diego 4.8%
Chicago 4.5%
Washington DC 3.7%
Seattle 3.2%
San Jose 2.7%
Dallas 2.3%
616(1)
Seniors Housing
Facilities
67,676 units
$15.9B(1)
Gross Real Estate
Investments
94%
SH Operating NOI
in Top 31 MSAs +
Coastal States
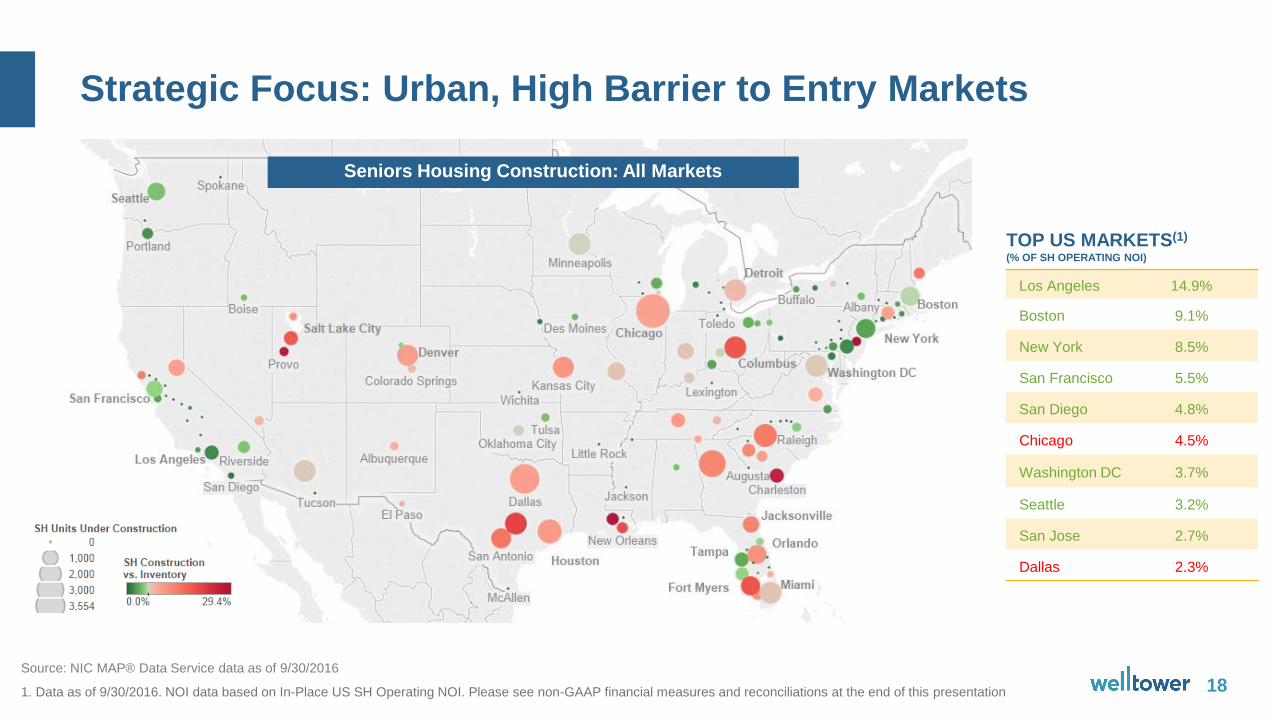
Strategic Focus: Urban, High Barrier to Entry Markets
18Source: NIC MAP® Data Service data as of 9/30/2016
1. Data as of 9/30/2016. NOI data based on In-Place US SH Operating NOI. Please see non-GAAP financial measures and reconciliations at the end of this presentation
TOP US MARKETS(1)
(% OF SH OPERATING NOI)
Los Angeles 14.9%
Boston 9.1%
New York 8.5%
San Francisco 5.5%
San Diego 4.8%
Chicago 4.5%
Washington DC 3.7%
Seattle 3.2%
San Jose 2.7%
Dallas 2.3%
Seniors Housing Construction: All Markets
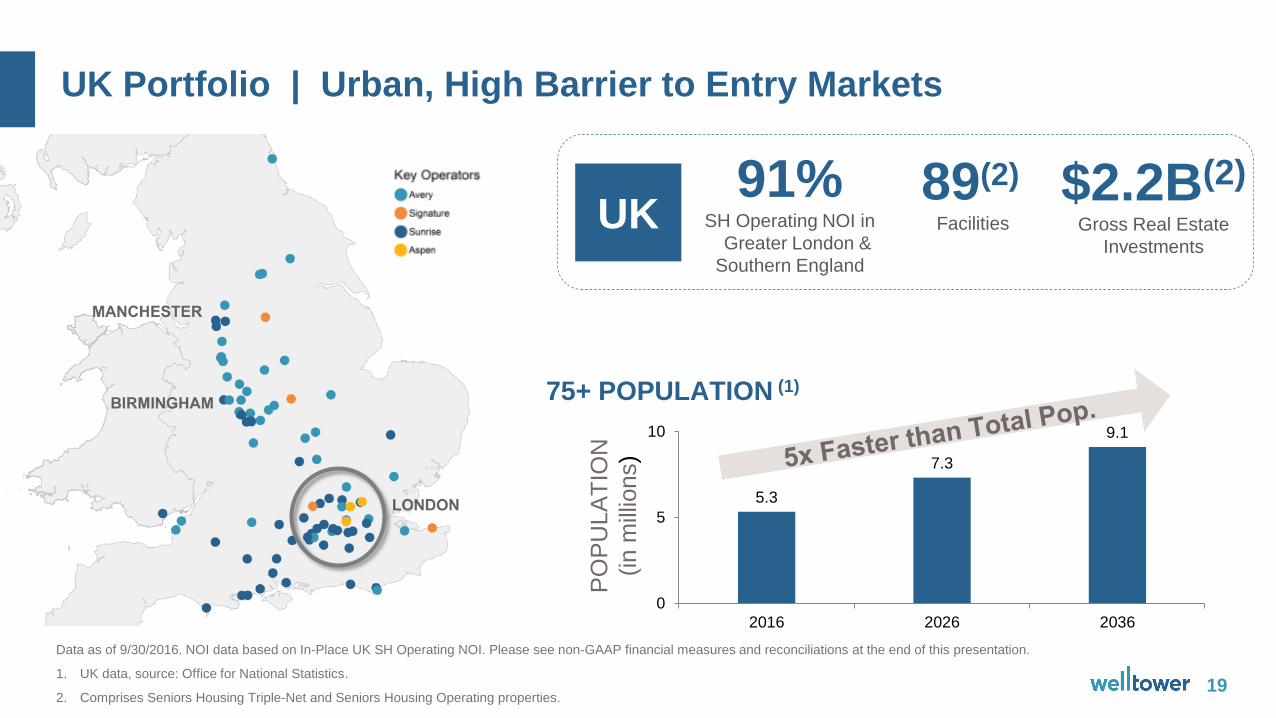
UK Portfolio | Urban, High Barrier to Entry Markets
19
Data as of 9/30/2016. NOI data based on In-Place UK SH Operating NOI. Please see non-GAAP financial measures and reconciliations at the end of this presentation.
1. UK data, source: Office for National Statistics.
2. Comprises Seniors Housing Triple-Net and Seniors Housing Operating properties.
PO
PU
LA
TIO
N
(in m
illio
ns)
5.3
7.3
9.1
0
5
10
2016 2026 2036
75+ POPULATION (1)
89(2)
Facilities
$2.2B(2)
Gross Real Estate
Investments
91%SH Operating NOI in
Greater London &
Southern England
UK
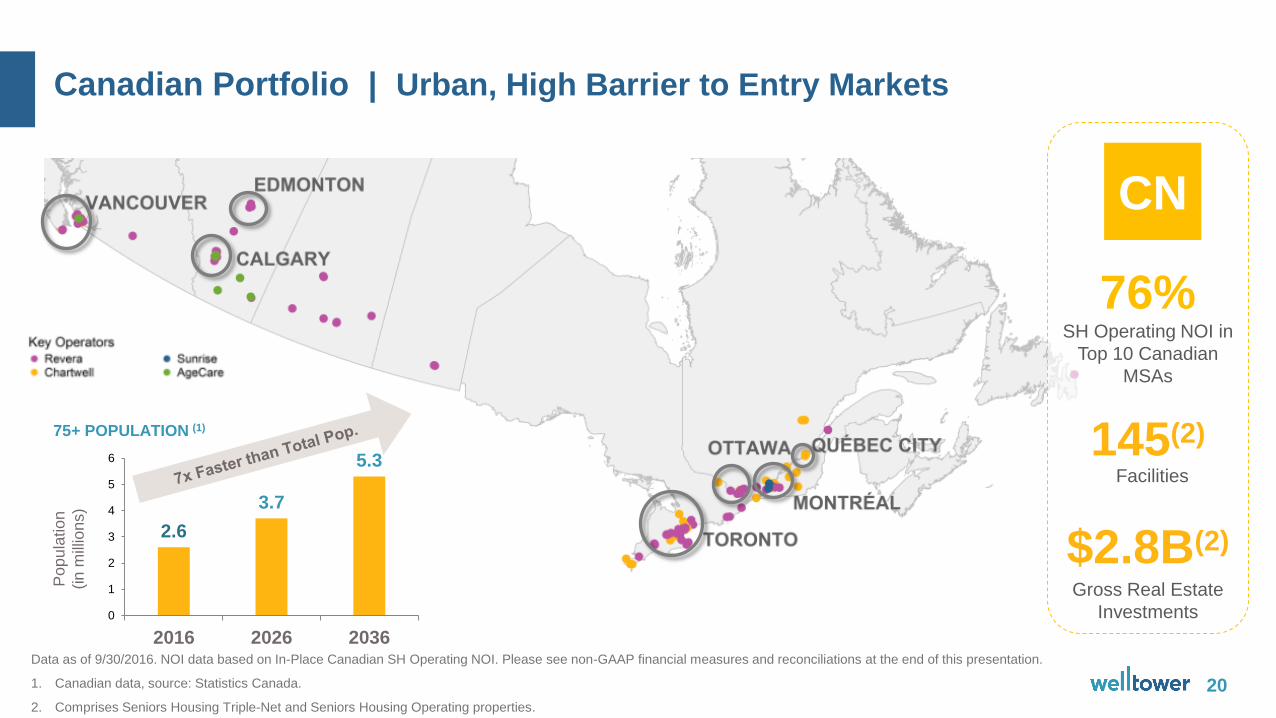
Canadian Portfolio | Urban, High Barrier to Entry Markets
20
Data as of 9/30/2016. NOI data based on In-Place Canadian SH Operating NOI. Please see non-GAAP financial measures and reconciliations at the end of this presentation.
1. Canadian data, source: Statistics Canada.
2. Comprises Seniors Housing Triple-Net and Seniors Housing Operating properties.
Po
pu
latio
n
(in
mill
ion
s)
2.6
3.7
5.3
0
1
2
3
4
5
6
2016 2026 2036
75+ POPULATION (1)
145(2)
Facilities
$2.8B(2)
Gross Real Estate
Investments
CN
76%SH Operating NOI in
Top 10 Canadian
MSAs
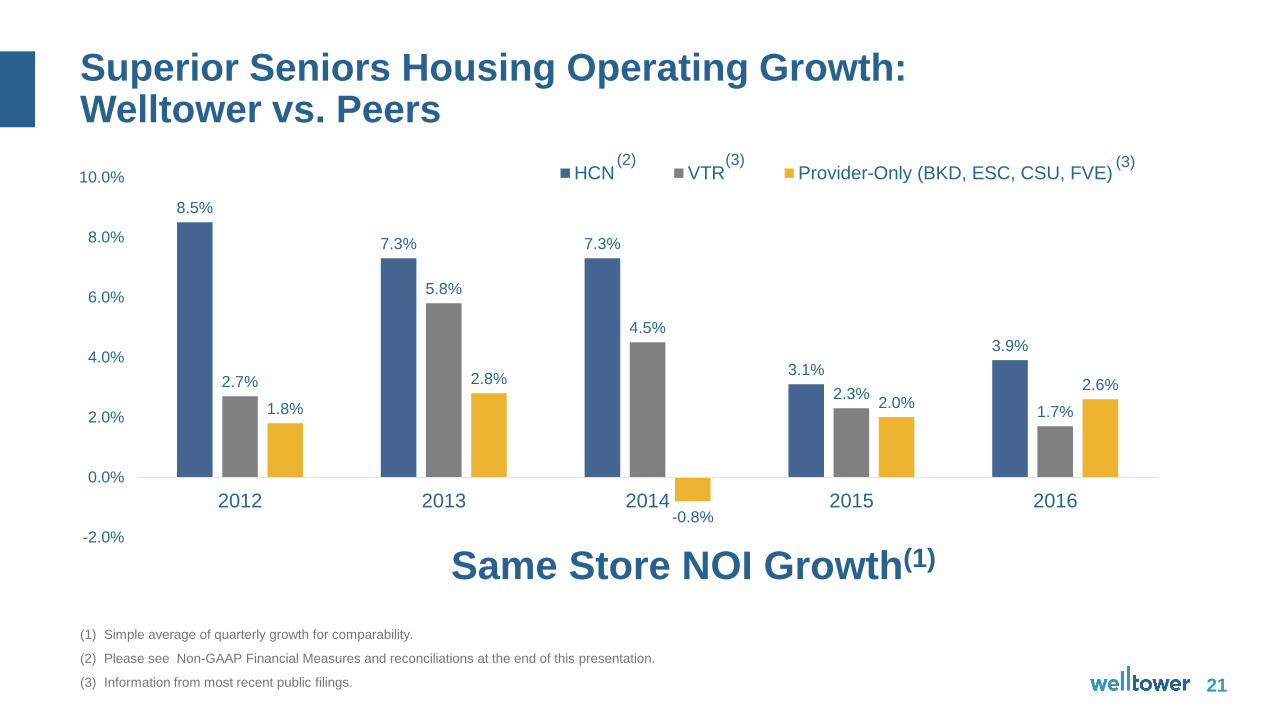
Superior Seniors Housing Operating Growth: Welltower vs. Peers
21
(1) Simple average of quarterly growth for comparability.
(2) Please see Non-GAAP Financial Measures and reconciliations at the end of this presentation.
(3) Information from most recent public filings.
8.5%
7.3% 7.3%
3.1%
3.9%
2.7%
5.8%
4.5%
2.3%1.7%1.8%
2.8%
-0.8%
2.0%2.6%
-2.0%
0.0%
2.0%
4.0%
6.0%
8.0%
10.0%
2012 2013 2014 2015 2016
Same Store NOI Growth(1)
HCN VTR Provider-Only (BKD, ESC, CSU, FVE)(3)(2) (3)
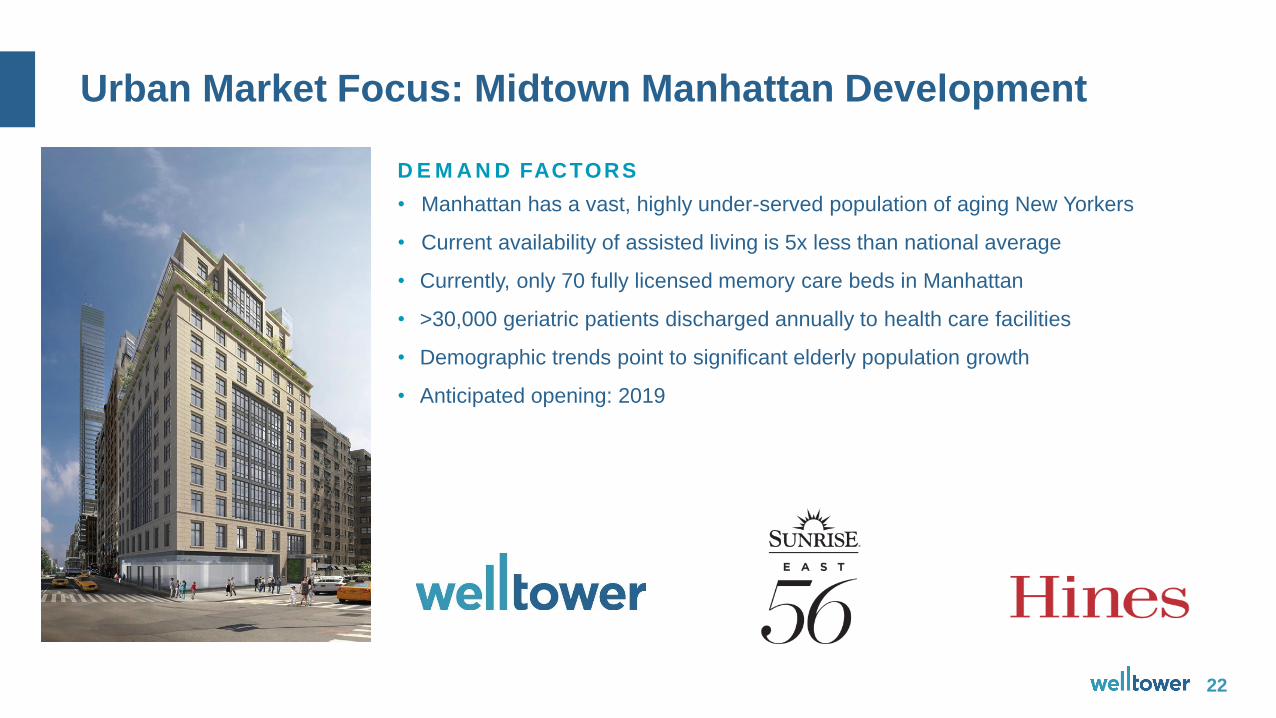
Urban Market Focus: Midtown Manhattan Development
22
D E M A N D FACTORS
• Manhattan has a vast, highly under-served population of aging New Yorkers
• Current availability of assisted living is 5x less than national average
• Currently, only 70 fully licensed memory care beds in Manhattan
• >30,000 geriatric patients discharged annually to health care facilities
• Demographic trends point to significant elderly population growth
• Anticipated opening: 2019
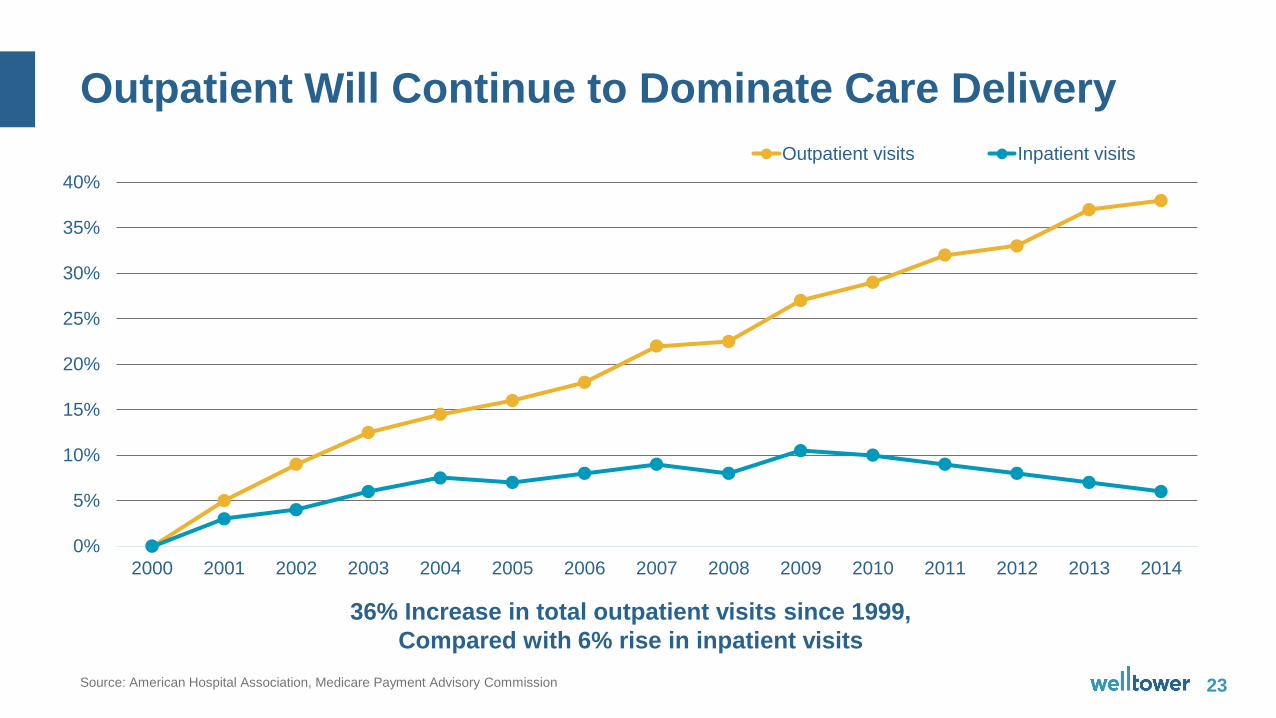
Outpatient Will Continue to Dominate Care Delivery
23Source: American Hospital Association, Medicare Payment Advisory Commission
0%
5%
10%
15%
20%
25%
30%
35%
40%
2000 2001 2002 2003 2004 2005 2006 2007 2008 2009 2010 2011 2012 2013 2014
Outpatient visits Inpatient visits
36% Increase in total outpatient visits since 1999,
Compared with 6% rise in inpatient visits
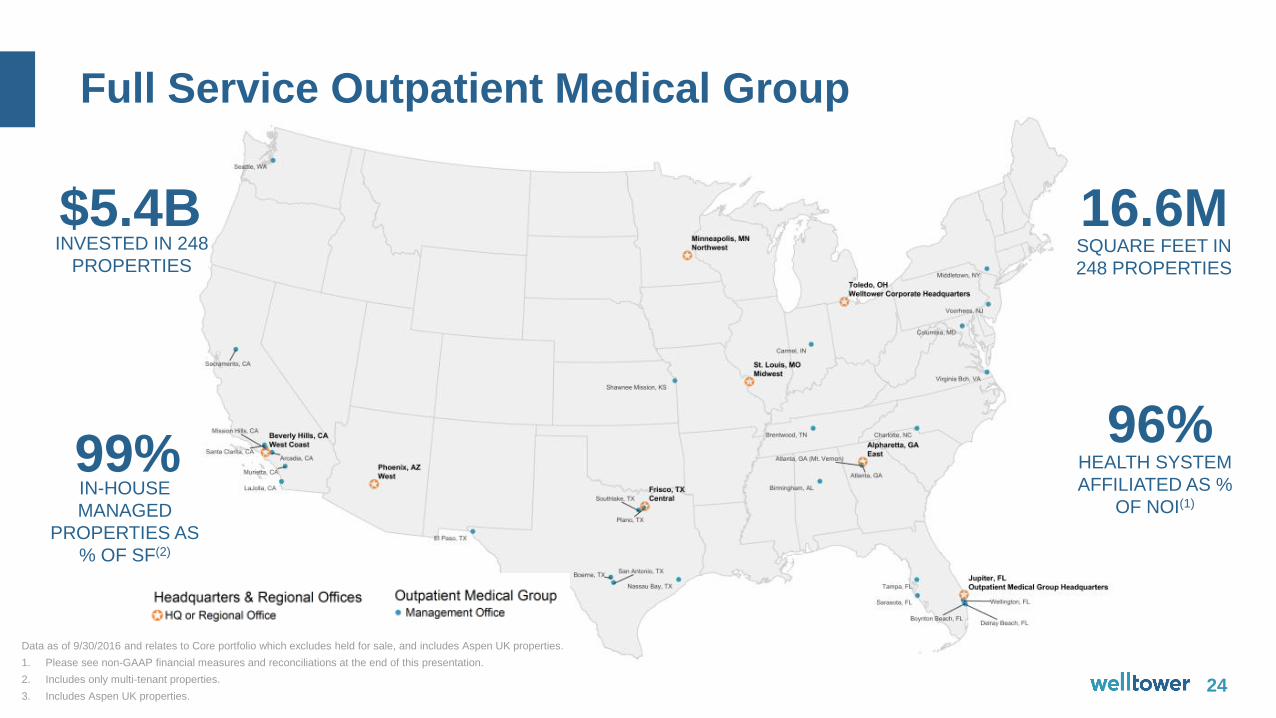
Full Service Outpatient Medical Group
24
$5.4BINVESTED IN 248
PROPERTIES
99%IN-HOUSE
MANAGED
PROPERTIES AS
% OF SF(2)
96%HEALTH SYSTEM
AFFILIATED AS %
OF NOI(1)
16.6MSQUARE FEET IN
248 PROPERTIES
Data as of 9/30/2016 and relates to Core portfolio which excludes held for sale, and includes Aspen UK properties.
1. Please see non-GAAP financial measures and reconciliations at the end of this presentation.
2. Includes only multi-tenant properties.
3. Includes Aspen UK properties.

Growing Outpatient with the Best Health Systems,Medical Groups and Capital Partners
25
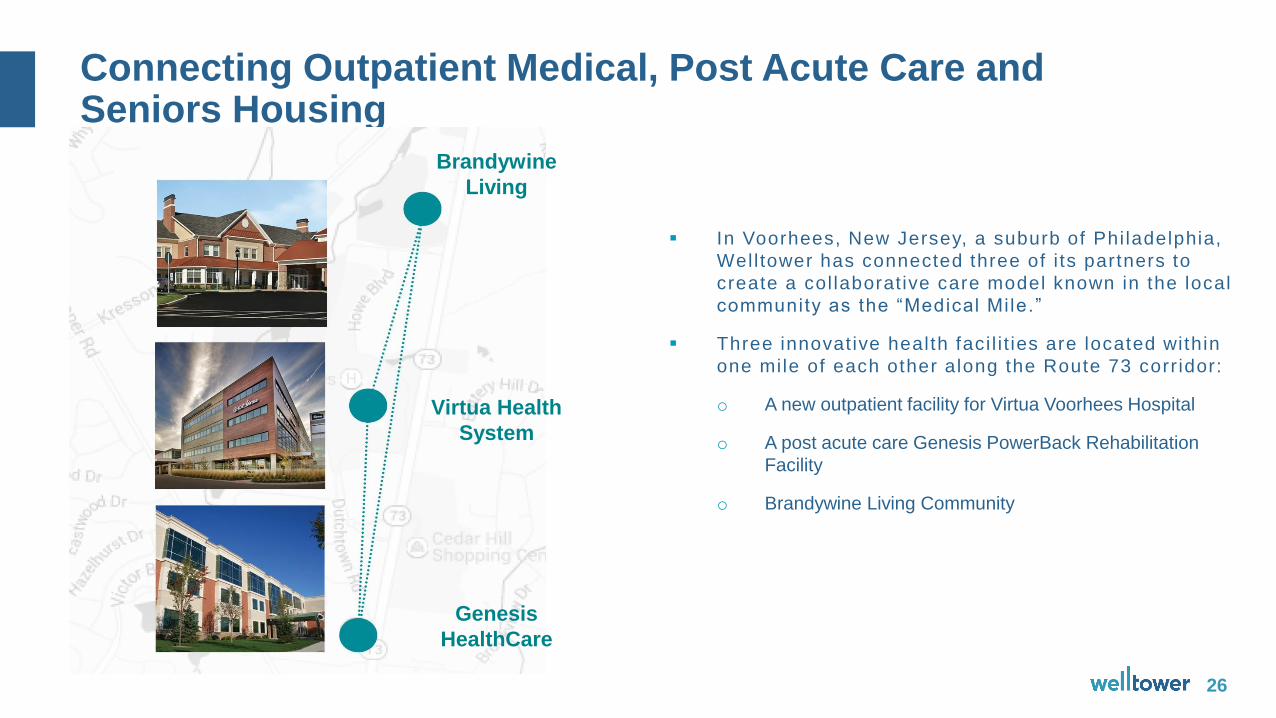
Connecting Outpatient Medical, Post Acute Care and Seniors Housing
26
In Voorhees, New Jersey, a suburb of Phi ladelphia,
Well tower has connected three of i ts partners to
create a col laborative care model known in the local
community as the “Medical Mile.”
Three innovat ive health faci l i t ies are located within
one mile of each other along the Route 73 corr idor:
o A new outpatient facility for Virtua Voorhees Hospital
o A post acute care Genesis PowerBack Rehabilitation
Facility
o Brandywine Living Community
Brandywine
Living
Virtua Health
System
Genesis
HealthCare

Financial Summary
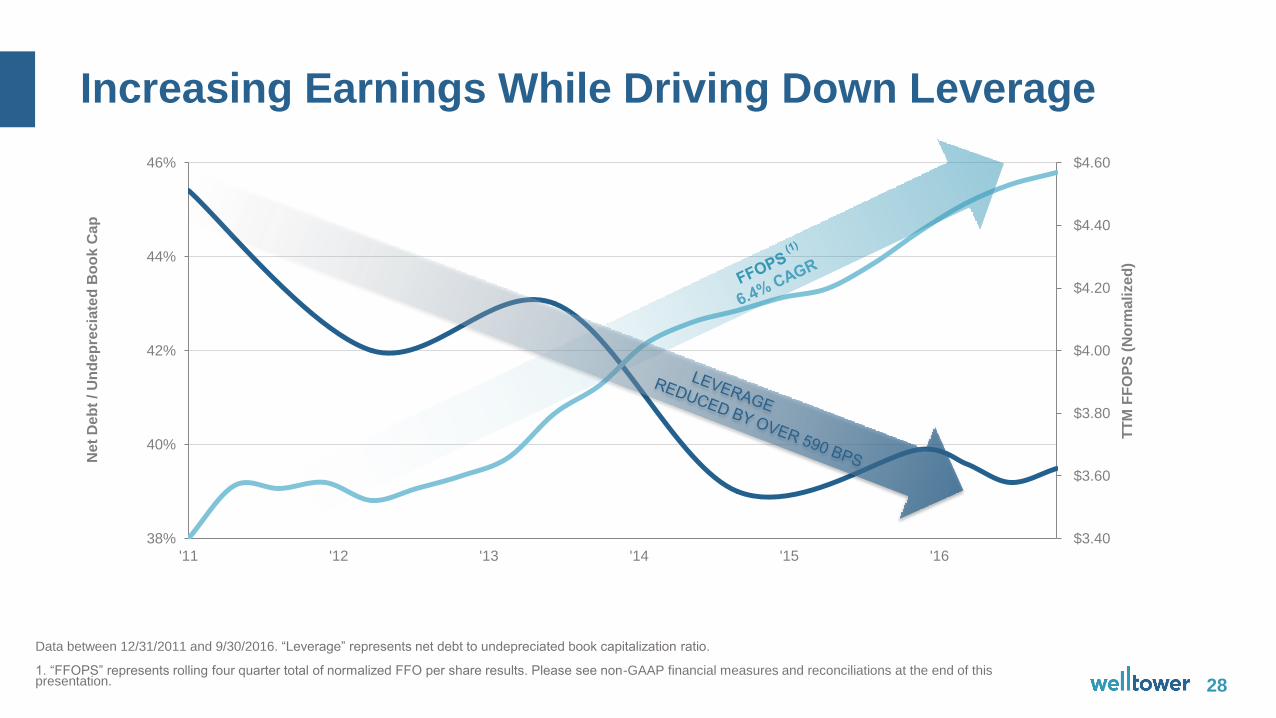
Increasing Earnings While Driving Down Leverage
28
Data between 12/31/2011 and 9/30/2016. “Leverage” represents net debt to undepreciated book capitalization ratio.
1. “FFOPS” represents rolling four quarter total of normalized FFO per share results. Please see non-GAAP financial measures and reconciliations at the end of this presentation.
$3.40
$3.60
$3.80
$4.00
$4.20
$4.40
$4.60
38%
40%
42%
44%
46%
'11 '12 '13 '14 '15 '16
TT
M F
FO
PS
(N
orm
ali
ze
d)
Ne
t D
eb
t / U
nd
ep
rec
iate
d B
oo
k C
ap
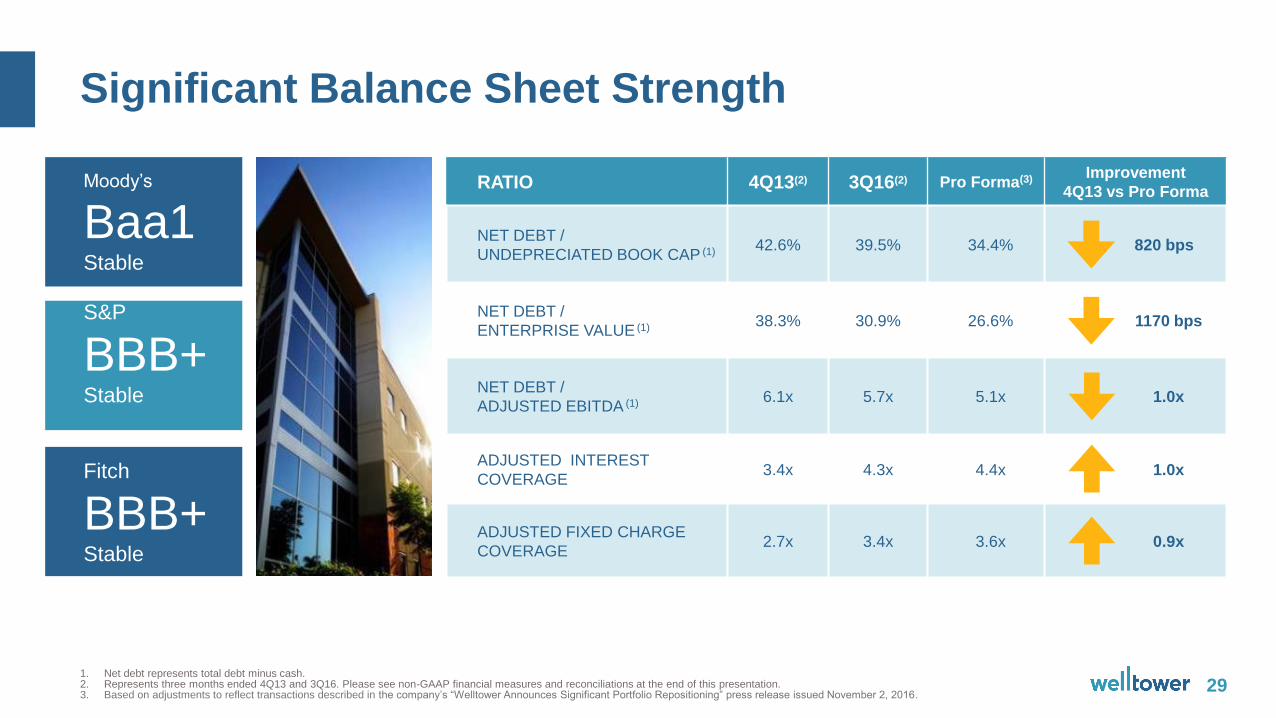
Significant Balance Sheet Strength
291. Net debt represents total debt minus cash.2. Represents three months ended 4Q13 and 3Q16. Please see non-GAAP financial measures and reconciliations at the end of this presentation.3. Based on adjustments to reflect transactions described in the company’s “Welltower Announces Significant Portfolio Repositioning” press release issued November 2, 2016.
Moody’s
Baa1Stable
S&P
BBB+Stable
Fitch
BBB+Stable
RATIO 4Q13(2) 3Q16(2) Pro Forma(3) Improvement
4Q13 vs Pro Forma
NET DEBT /
UNDEPRECIATED BOOK CAP (1) 42.6% 39.5% 34.4% 820 bps
NET DEBT /
ENTERPRISE VALUE (1) 38.3% 30.9% 26.6% 1170 bps
NET DEBT /
ADJUSTED EBITDA (1) 6.1x 5.7x 5.1x 1.0x
ADJUSTED INTEREST
COVERAGE3.4x 4.3x 4.4x 1.0x
ADJUSTED FIXED CHARGE
COVERAGE2.7x 3.4x 3.6x 0.9x
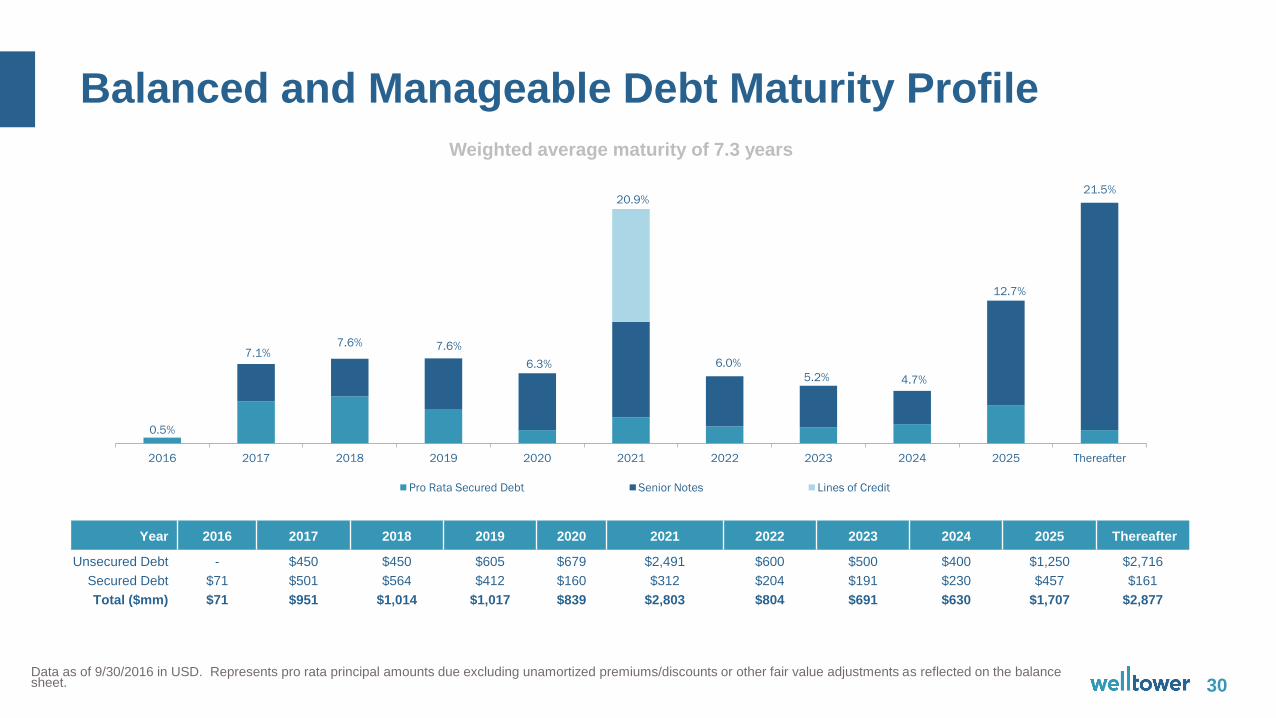
Balanced and Manageable Debt Maturity Profile
30Data as of 9/30/2016 in USD. Represents pro rata principal amounts due excluding unamortized premiums/discounts or other fair value adjustments as reflected on the balance sheet.
0.5%
7.1%7.6% 7.6%
6.3%
20.9%
6.0%
5.2% 4.7%
12.7%
21.5%
2016 2017 2018 2019 2020 2021 2022 2023 2024 2025 Thereafter
Pro Rata Secured Debt Senior Notes Lines of Credit
Year 2016 2017 2018 2019 2020 2021 2022 2023 2024 2025 Thereafter
Unsecured Debt - $450 $450 $605 $679 $2,491 $600 $500 $400 $1,250 $2,716
Secured Debt $71 $501 $564 $412 $160 $312 $204 $191 $230 $457 $161
Total ($mm) $71 $951 $1,014 $1,017 $839 $2,803 $804 $691 $630 $1,707 $2,877
Weighted average maturity of 7.3 years
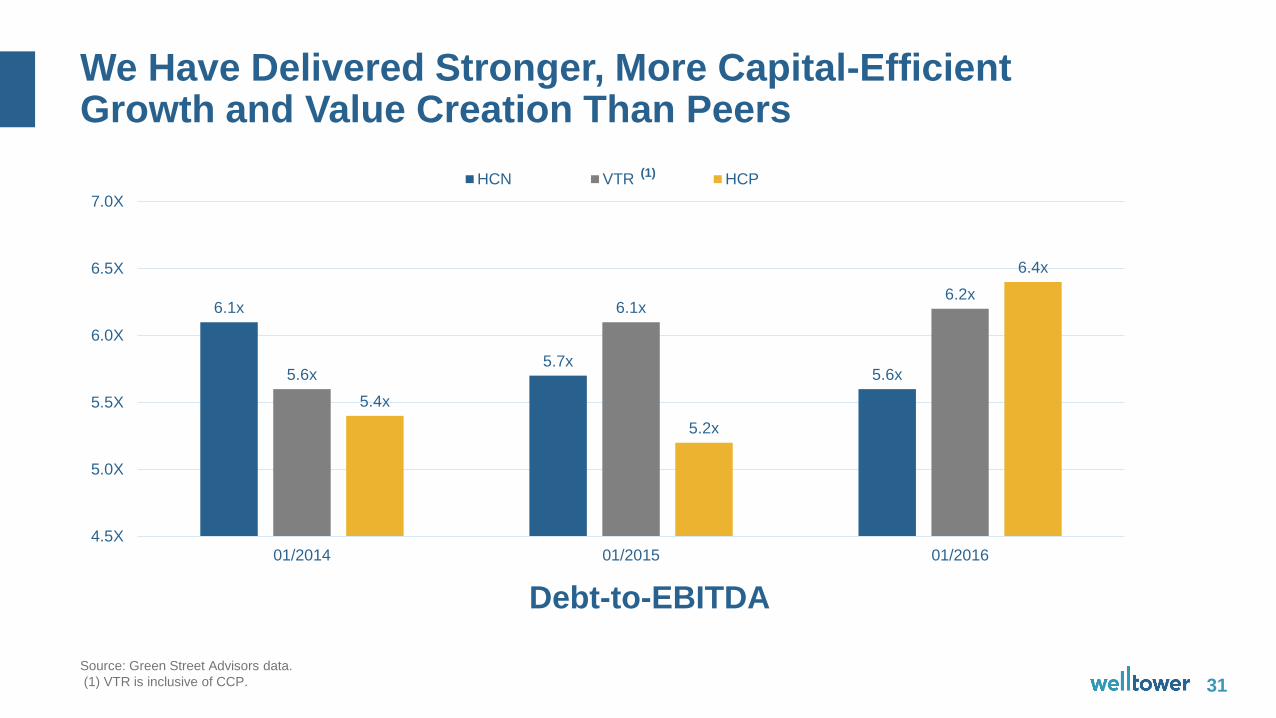
We Have Delivered Stronger, More Capital-Efficient Growth and Value Creation Than Peers
31Source: Green Street Advisors data.
(1) VTR is inclusive of CCP.
6.1x
5.7x5.6x5.6x
6.1x6.2x
5.4x
5.2x
6.4x
4.5X
5.0X
5.5X
6.0X
6.5X
7.0X
01/2014 01/2015 01/2016
HCN VTR HCP
Debt-to-EBITDA
(1)
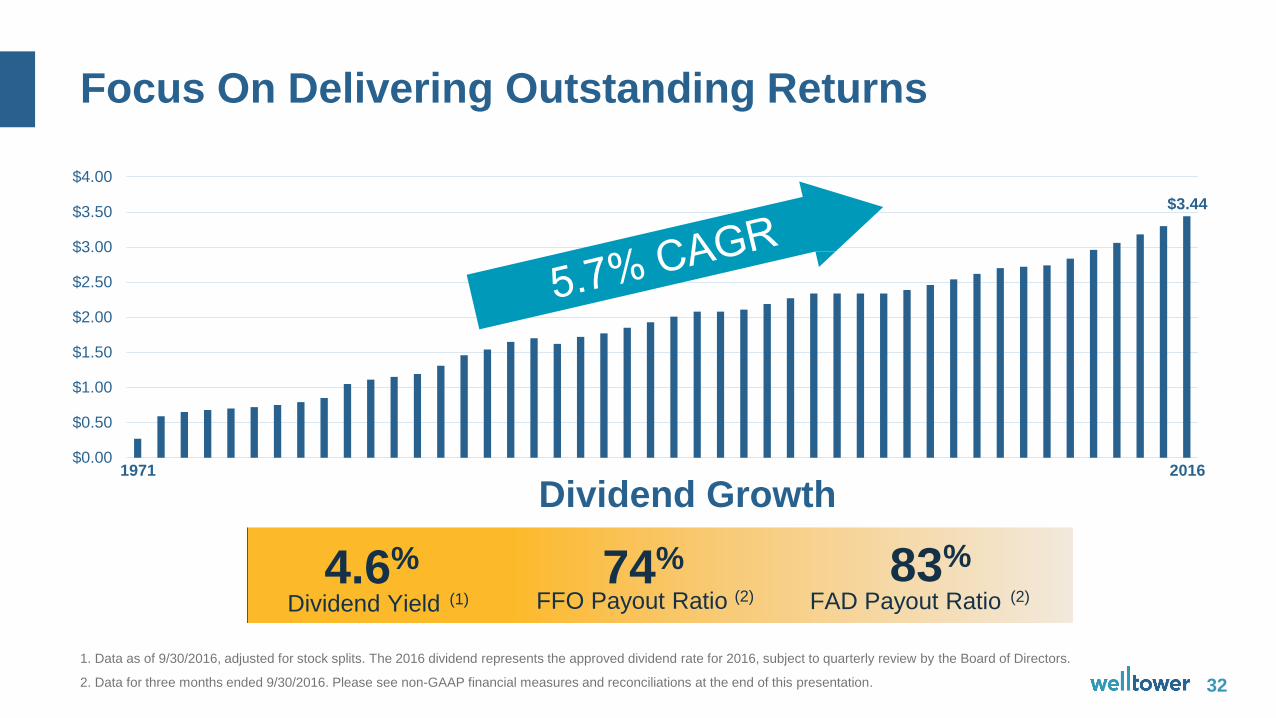
Focus On Delivering Outstanding Returns
32
1. Data as of 9/30/2016, adjusted for stock splits. The 2016 dividend represents the approved dividend rate for 2016, subject to quarterly review by the Board of Directors.
2. Data for three months ended 9/30/2016. Please see non-GAAP financial measures and reconciliations at the end of this presentation.
$0.00
$0.50
$1.00
$1.50
$2.00
$2.50
$3.00
$3.50
$4.00
Dividend Growth
Dividend Yield (1)
4.6%
FFO Payout Ratio (2)74%
FAD Payout Ratio (2)
83%
20161971
$3.44
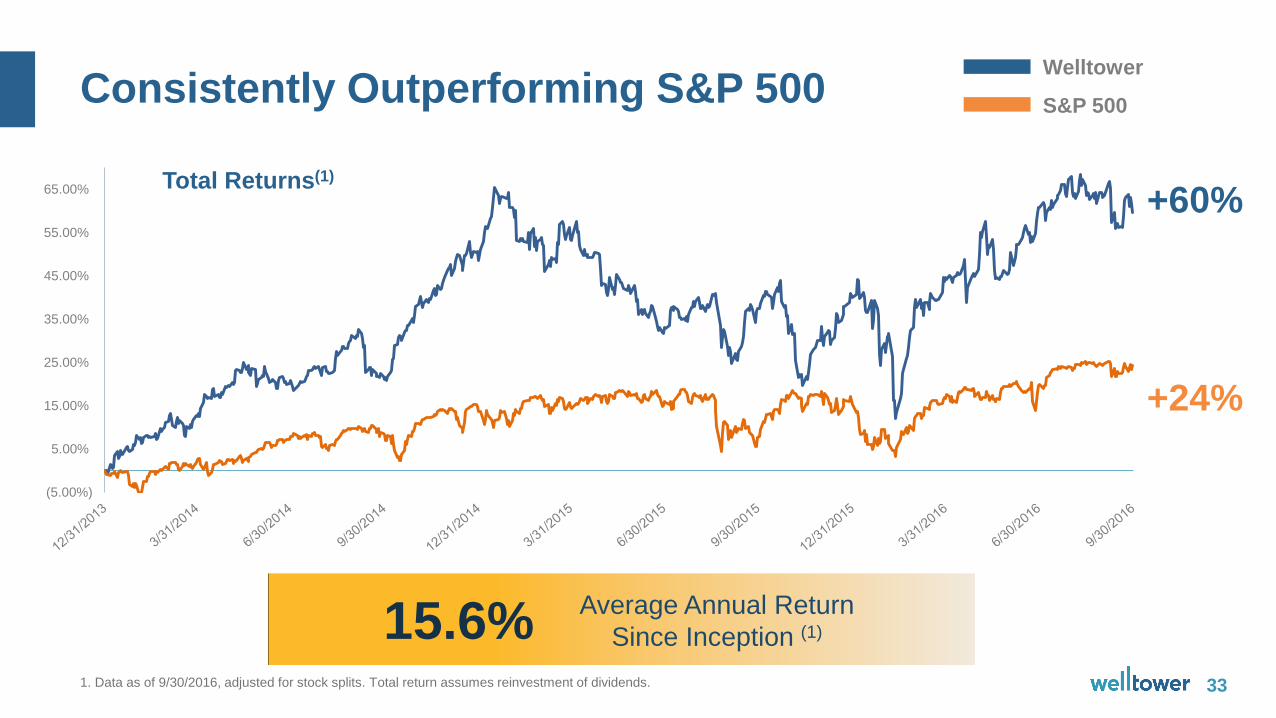
Consistently Outperforming S&P 500
331. Data as of 9/30/2016, adjusted for stock splits. Total return assumes reinvestment of dividends.
(5.00%)
5.00%
15.00%
25.00%
35.00%
45.00%
55.00%
65.00%
Welltower
S&P 500
+60%
+24%
15.6%Average Annual Return
Since Inception (1)
Total Returns(1)

Appendix
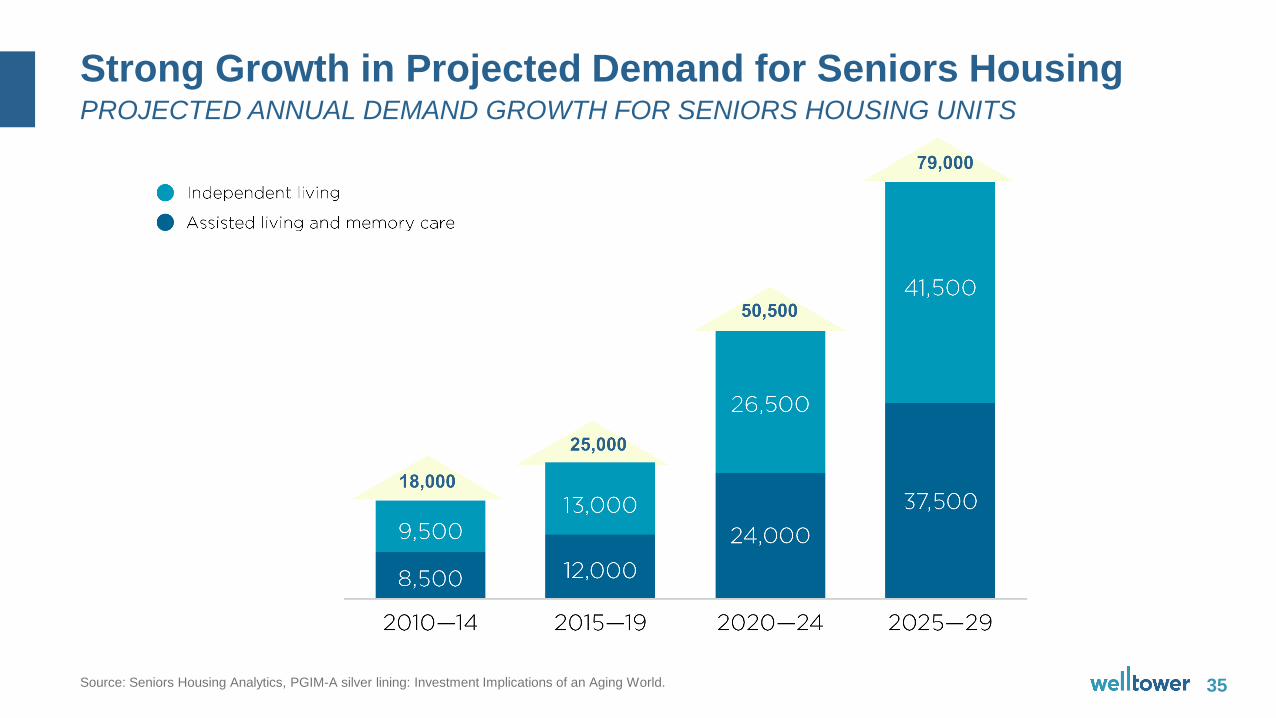
Strong Growth in Projected Demand for Seniors Housing
35
PROJECTED ANNUAL DEMAND GROWTH FOR SENIORS HOUSING UNITS
Source: Seniors Housing Analytics, PGIM-A silver lining: Investment Implications of an Aging World.
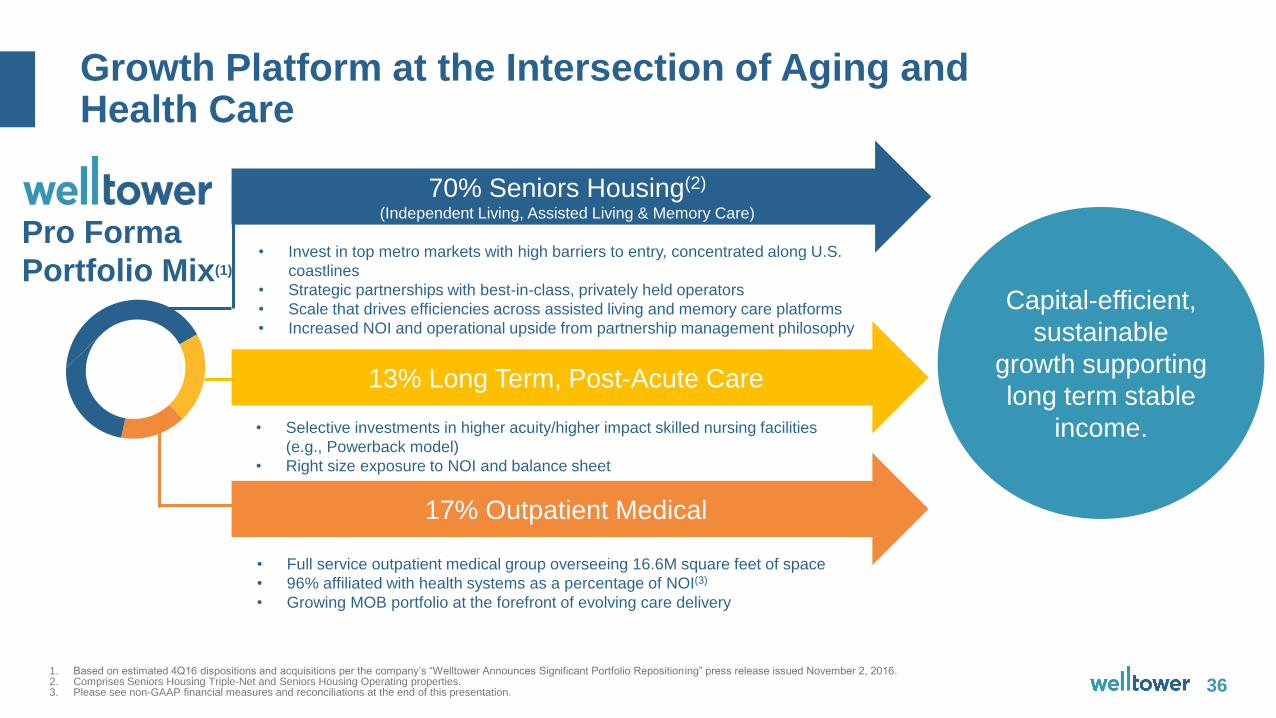
Growth Platform at the Intersection of Aging and Health Care
361. Based on estimated 4Q16 dispositions and acquisitions per the company’s “Welltower Announces Significant Portfolio Repositioning” press release issued November 2, 2016.2. Comprises Seniors Housing Triple-Net and Seniors Housing Operating properties. 3. Please see non-GAAP financial measures and reconciliations at the end of this presentation.
Pro Forma
Portfolio Mix(1)
70% Seniors Housing(2)
(Independent Living, Assisted Living & Memory Care)
• Invest in top metro markets with high barriers to entry, concentrated along U.S.
coastlines
• Strategic partnerships with best-in-class, privately held operators
• Scale that drives efficiencies across assisted living and memory care platforms
• Increased NOI and operational upside from partnership management philosophy
13% Long Term, Post-Acute Care
17% Outpatient Medical
• Selective investments in higher acuity/higher impact skilled nursing facilities
(e.g., Powerback model)
• Right size exposure to NOI and balance sheet
• Full service outpatient medical group overseeing 16.6M square feet of space
• 96% affiliated with health systems as a percentage of NOI(3)
• Growing MOB portfolio at the forefront of evolving care delivery
Capital-efficient,
sustainable
growth supporting
long term stable
income.
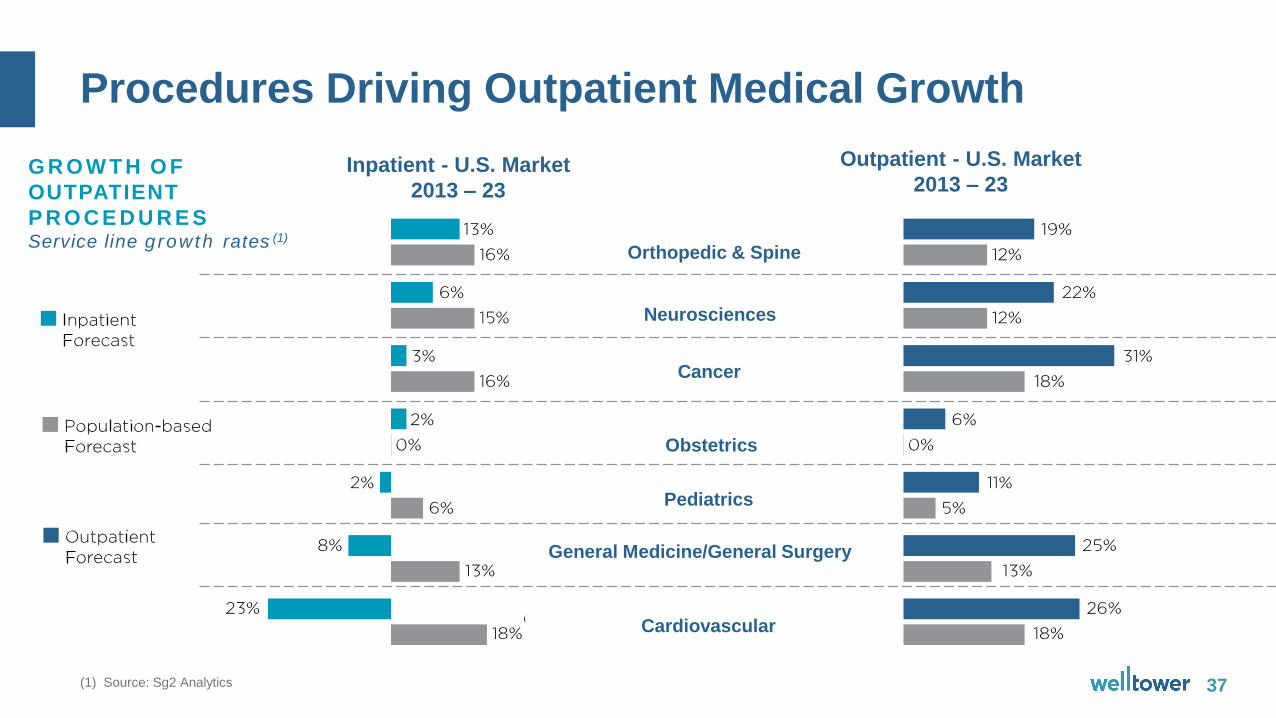
Procedures Driving Outpatient Medical Growth
37(1) Source: Sg2 Analytics
Orthopedic & Spine
Neurosciences
Cancer
Obstetrics
Pediatrics
General Medicine/General Surgery
Cardiovascular
Inpatient - U.S. Market
2013 – 23
Outpatient - U.S. Market
2013 – 23G R O W T H O F
OUTPATIENT
P R O C E D U R E SService line g rowth rates (1)
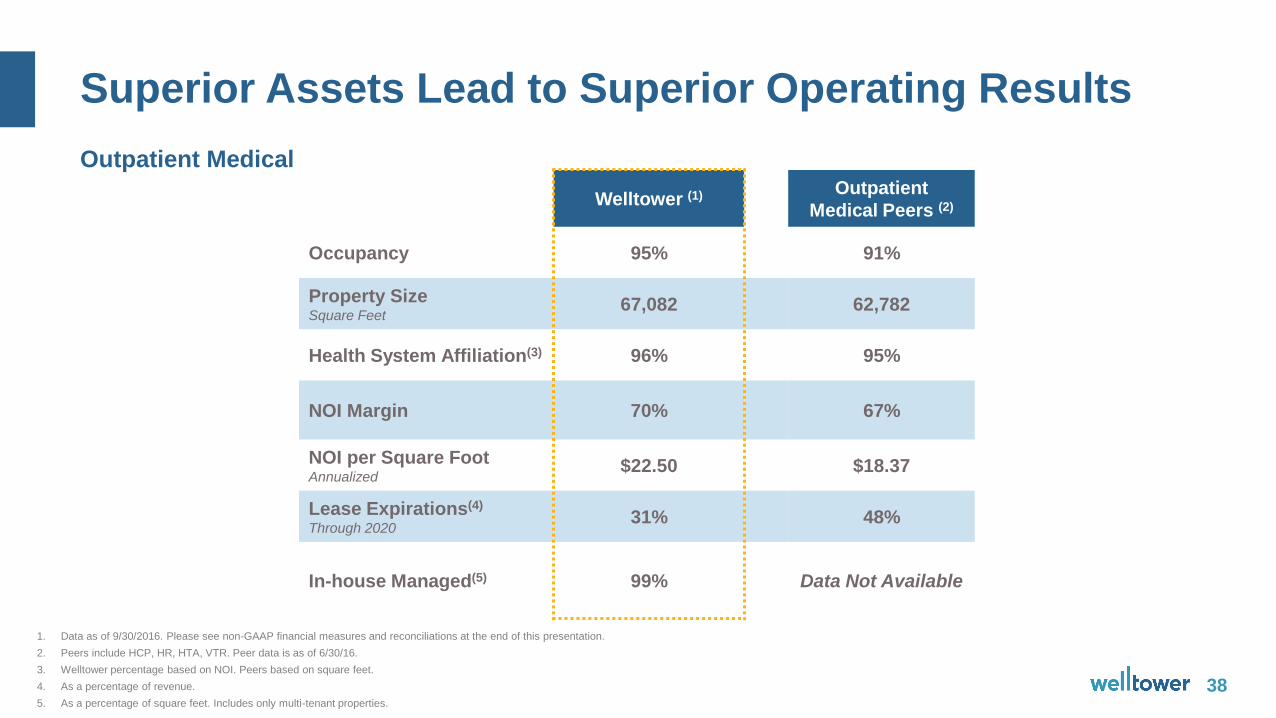
Superior Assets Lead to Superior Operating Results
38
Welltower (1) Outpatient
Medical Peers (2)
Occupancy 95% 91%
Property SizeSquare Feet
67,082 62,782
Health System Affiliation(3) 96% 95%
NOI Margin 70% 67%
NOI per Square FootAnnualized
$22.50 $18.37
Lease Expirations(4)
Through 202031% 48%
In-house Managed(5) 99% Data Not Available
Outpatient Medical
1. Data as of 9/30/2016. Please see non-GAAP financial measures and reconciliations at the end of this presentation.
2. Peers include HCP, HR, HTA, VTR. Peer data is as of 6/30/16.
3. Welltower percentage based on NOI. Peers based on square feet.
4. As a percentage of revenue.
5. As a percentage of square feet. Includes only multi-tenant properties.
Superior Assets Lead to Superior Operating Results
39
WELLTOWER
PAC/LTC (1)
HC REIT
Peers (2)
Public
Operators (3)
Industry
Benchmarks (4)
Property AgeYears
22 36 32 38
Occupancy 86% 82% 81% 82%
Quality MixPrivate & Medicare Revenue %
58%(5) 52% 52% 47%
EBITDARM Coverage 1.65x 1.7xData
Not Available
Data
Not Available
EBITDARM per BedAnnual
$19,716 $16,555 $14,438Data
Not Available
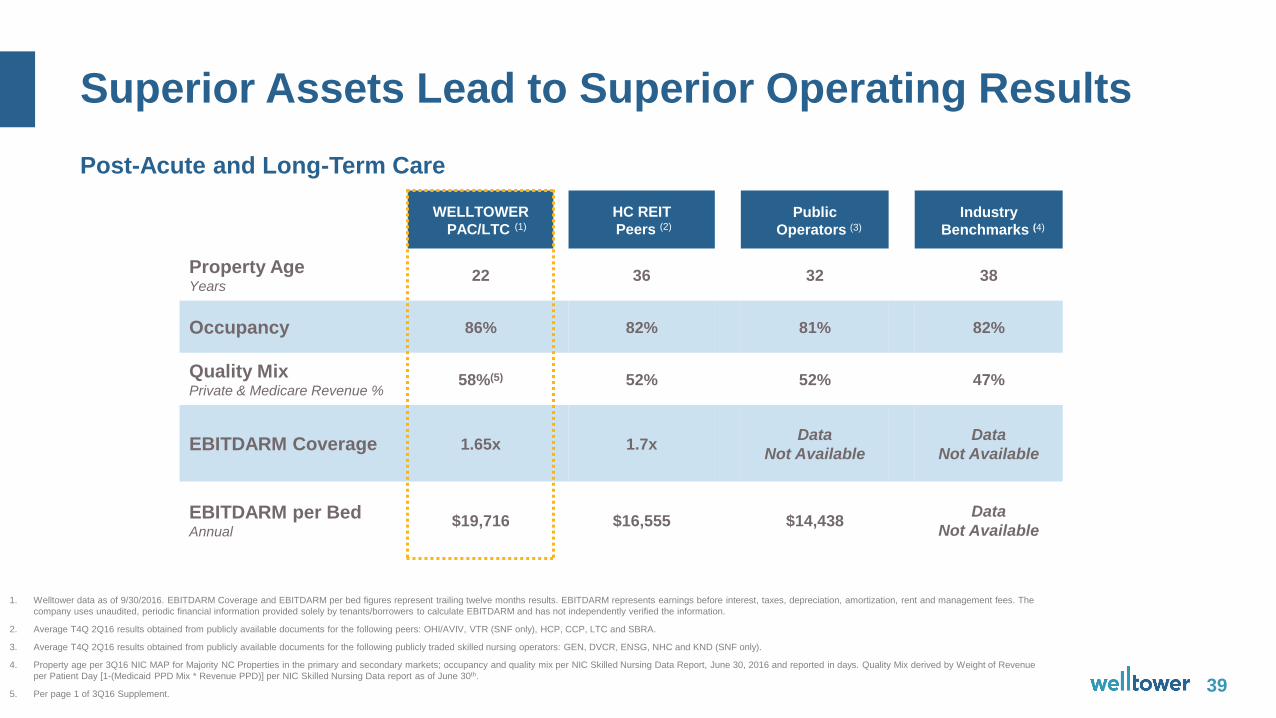
Post-Acute and Long-Term Care
1. Welltower data as of 9/30/2016. EBITDARM Coverage and EBITDARM per bed figures represent trailing twelve months results. EBITDARM represents earnings before interest, taxes, depreciation, amortization, rent and management fees. The
company uses unaudited, periodic financial information provided solely by tenants/borrowers to calculate EBITDARM and has not independently verified the information.
2. Average T4Q 2Q16 results obtained from publicly available documents for the following peers: OHI/AVIV, VTR (SNF only), HCP, CCP, LTC and SBRA.
3. Average T4Q 2Q16 results obtained from publicly available documents for the following publicly traded skilled nursing operators: GEN, DVCR, ENSG, NHC and KND (SNF only).
4. Property age per 3Q16 NIC MAP for Majority NC Properties in the primary and secondary markets; occupancy and quality mix per NIC Skilled Nursing Data Report, June 30, 2016 and reported in days. Quality Mix derived by Weight of Revenue
per Patient Day [1-(Medicaid PPD Mix * Revenue PPD)] per NIC Skilled Nursing Data report as of June 30th.
5. Per page 1 of 3Q16 Supplement.
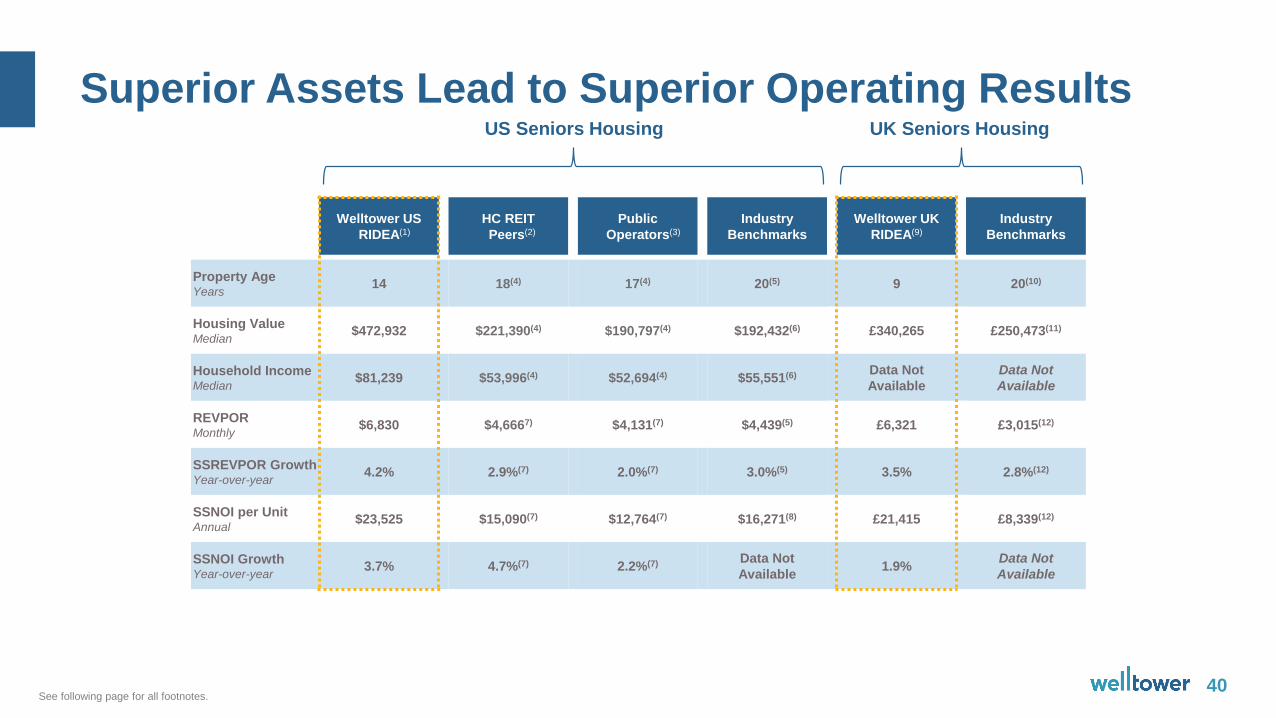
Superior Assets Lead to Superior Operating Results
40
Welltower US
RIDEA(1)
HC REIT
Peers(2)
Public
Operators(3)
Industry
Benchmarks
Welltower UK
RIDEA(9)
Industry
Benchmarks
Property AgeYears
14 18(4) 17(4) 20(5) 9 20(10)
Housing ValueMedian
$472,932 $221,390(4) $190,797(4) $192,432(6) £340,265 £250,473(11)
Household IncomeMedian
$81,239 $53,996(4) $52,694(4) $55,551(6) Data Not
Available
Data Not
Available
REVPORMonthly
$6,830 $4,6667) $4,131(7) $4,439(5) £6,321 £3,015(12)
SSREVPOR GrowthYear-over-year
4.2% 2.9%(7) 2.0%(7) 3.0%(5) 3.5% 2.8%(12)
SSNOI per Unit Annual
$23,525 $15,090(7) $12,764(7) $16,271(8) £21,415 £8,339(12)
SSNOI GrowthYear-over-year
3.7% 4.7%(7) 2.2%(7) Data Not
Available1.9%
Data Not
Available
US Seniors Housing UK Seniors Housing
See following page for all footnotes.
Detailed Footnotes
41
1. Data as of 9/30/2016 for properties included in the seniors housing segment. Property age, housing value and household income are NOI-weighted as of September 30, 2016. The median housing value and household income is used for the US, and the average housing value and household income is used for the UK and Canada. Housing value, household income and population growth are based on a 3-mile radius. Growth figures represent average performance of Welltower's same store portfolio over the past four quarters. REVPOR is based on total 3Q16 results. See pages 28 and 30 for reconciliation. Represents the annual NOI per unit available based on trailing twelve months for those properties in the portfolio for 15 months preceding the end of the portfolio performance period. NOI per unit for UK portfolio in GBP calculated by taking NOI per unit in USD divided by a standardized GBP/USD rate of 1.4950. NOI per unit for Canadian portfolio in CAD calculated by taking NOI per unit in USD divided by a standardized USD/CAD rate of 1.3495. See page 30 for reconciliation.
2. Average Trailing 4 quarters as of 6/30/2016 results for the following peers: HCP, NHI, SNH, and VTR. Housing value and household income are based on 5-mile radius median data.
3. Average Trailing 4 quarters as of 6/30/2016 results for the following publicly traded seniors housing operators: BKD, CSU and FVE. Housing value and household income are based on 5-mile radius median data.
4. Derived or obtained from BofAML research reports, NIC, Nielsen, and/or publicly available documents.
5. Per NIC 3Q16 Majority AL properties in primary and secondary markets.
6. US Median per Nielsen 2016.
7. Derived or obtained from publicly available documents.
8. The State of Seniors Housing 2016. Represents 2015 results
9. Data as of 9/30/2016 for properties included in the seniors housing operating segment, pg 9 3Q16 Supplement. Property age, housing value and household income are NOI-weighted as of September 30, 2016. The median housing value and household income is used for the US, and the average housing value and household income is used for the UK and Canada. Housing value, household income and population growth are based on a 3-mile radius. Growth figures represent average performance of Welltower's same store portfolio over the past four quarters. REVPOR is based on total 3Q16 results. Represents the annual NOI per unit available based on trailing twelve months for those properties in the portfolio for 15 months preceding the end of the portfolio performance period. NOI per unit for UK portfolio in GBP calculated by taking NOI per unit in USD divided by a standardized GBP/USD rate of 1.4950. NOI per unit for Canadian portfolio in CAD calculated by taking NOI per unit in USD divided by a standardized USD/CAD rate of 1.3495. See page 30 for reconciliation.
10.Property age per LaingBuisson, Care of Older People 27th Edition.
11.UK Average, CACI 2015 CI.
12.Knight Frank 2016 Care Homes Trading Performance Review and assumes a 5% management fee.

Financial Disclosures
Non-GAAP Financial Measures
43
Welltower Inc. believes that net income attributable to common stockholders (NICS), as defined by U.S. generally acceptedaccounting principles (U.S. GAAP), is the most appropriate earnings measurement. However, the company considers NetOperating Income (NOI), In-Place NOI (IPNOI), Same Store NOI (SSNOI), Revenues per Occupied Room (REVPOR),Same Store REVPOR (SS REVPOR), Normalized Funds From Operations (FFO), Normalized Funds Available forDistribution (FAD), Earnings Before Interest Taxes Depreciation and Amortization (EBITDA) and Adjusted EBITDA to beuseful supplemental measures of its operating performance. Excluding EBITDA and A-EBITDA, these supplementalmeasures are disclosed on a Welltower pro rata ownership basis.
Pro rata amounts are derived by reducing consolidated amounts for minority partners’ noncontrolling ownership interestsand adding Welltower’s minority ownership share of unconsolidated amounts. Welltower does not control unconsolidatedinvestments. While the company considers pro rata disclosures useful, they may not accurately depict the legal andeconomic implications of Welltower’s joint venture arrangements and should be used with caution.
Certain metrics are presented on a pro forma basis which are based on expectations for dispositions and uses of proceedsdescribed in the company’s “Welltower Announces Significant Portfolio Repositioning” press release issued November 2,2016. Pro forma estimates are subject to change and should be used with caution.
Welltower’s supplemental reporting measures and similarly entitled financial measures are widely used by investors, equityand debt analysts and rating agencies in the valuation, comparison, rating and investment recommendations of companies.Welltower’s management uses these financial measures to facilitate internal and external comparisons to historicaloperating results and in making operating decisions. Additionally, these measures are utilized by the Board of Directors toevaluate management.
None of the supplemental reporting measures represent net income or cash flow provided from operating activities asdetermined in accordance with U.S. GAAP and should not be considered as alternative measures of profitability or liquidity.Finally, the supplemental reporting measures, as defined by Welltower, may not be comparable to similarly entitled itemsreported by other real estate investment trusts or other companies. Multi-period amounts may not equal the sum of theindividual quarterly amounts due to rounding.
NOI, IPNOI, SSNOI, REVPOR and SS REVPOR
44
Net operating income (NOI) is used to evaluate the operating performance of our properties. We define NOI as totalrevenues, including tenant reimbursements, less property operating expenses. Property operating expenses represent costsassociated with managing, maintaining and servicing tenants for our seniors housing operating and outpatient medicalproperties. These expenses include, but are not limited to, property-related payroll and benefits, property management fees,marketing, housekeeping, food service, maintenance, utilities, property taxes and insurance. General and administrativeexpenses represent costs unrelated to property operations or transaction costs. These expenses include, but are not limitedto, payroll and benefits, professional services, office expenses and depreciation of corporate fixed assets.
In-Place NOI (IPNOI) represents NOI excluding interest income, other income and non-cash NOI and adjusted for timing ofcurrent quarter portfolio changes such as acquisitions, development conversions, segment transitions, dispositions andinvestments held for sale.
Revenues per occupied room (REVPOR) is used to evaluate the revenue-generating capacity and profit potential of ourseniors housing operating portfolio independent of fluctuating occupancy rates. It is calculated as total resident fees andservices revenues divided by average monthly occupied room days. REVPOR is also used in comparison against industryand competitor statistics, if known, to evaluate the quality of our seniors housing operating portfolio.
Same store NOI (SSNOI) and same store REVPOR (SS REVPOR) are used to evaluate the cash-based performance of ourproperties under a consistent population which eliminates changes in the composition of our portfolio. For purposes ofSSNOI and SS REVPOR, same store is generally defined as those revenue-generating properties in the portfolio for therelevant reporting periods. Land parcels, loans, sub-leases, and entrance fee communities for periods prior to 1Q15 as wellas any properties acquired, developed/re-developed, transitioned, sold or classified as held for sale during those periods aregenerally excluded from the same store amounts. Normalizers include adjustments and reclassifications that inmanagement’s opinion are appropriate in considering SSNOI or SS REVPOR, which are supplemental, non-GAAPperformance measures. None of these adjustments or reclassifications, which may increase or decrease SSNOI, arereflected in our financial statements prepared in accordance with U.S. GAAP.
We believe NOI, IPNOI, SSNOI, REVPOR and SS REVPOR provide investors relevant and useful information because theymeasure the operating performance of our properties at the property level on an unleveraged basis. We use these metrics tomake decisions about resource allocations and to assess the property level performance of our properties.
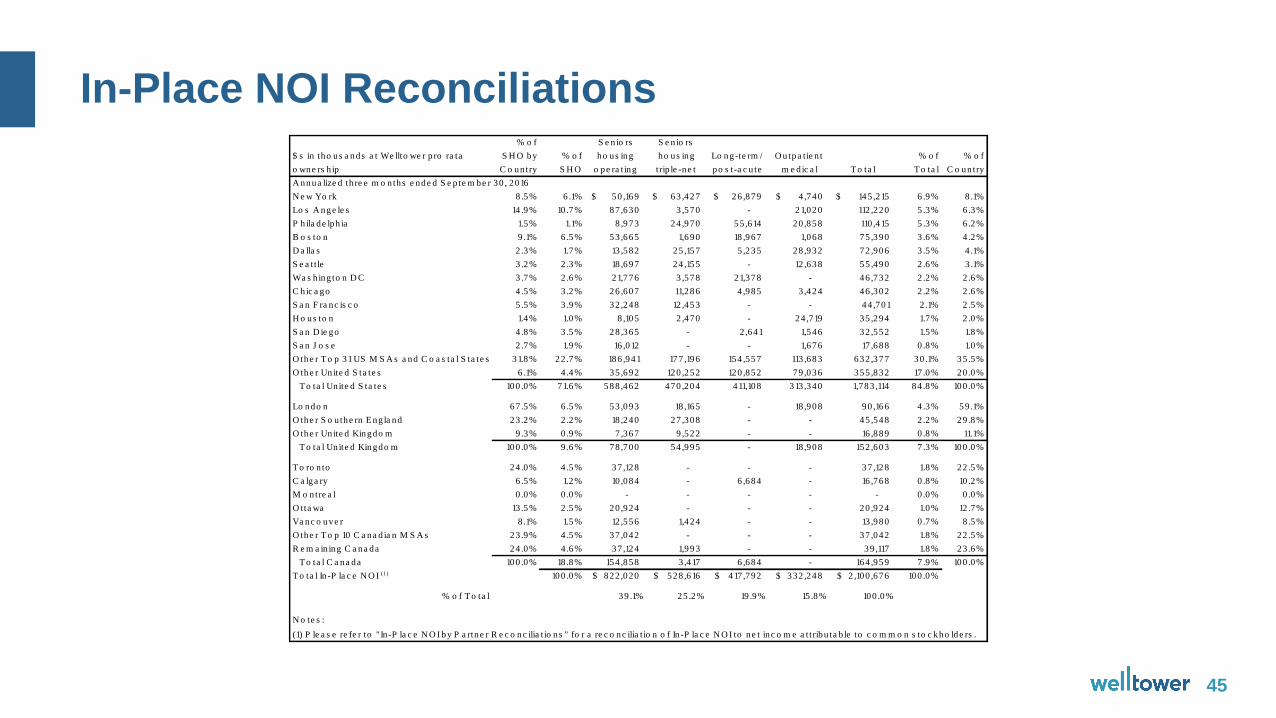
In-Place NOI Reconciliations
45
$ s in tho us a nds a t We llto we r p ro ra ta
o wne rs h ip
% o f
S H O by
C o un try
% o f
S H O
S e n io rs
ho us ing
o pe ra t ing
S e n io rs
ho us ing
trip le -ne t
Lo ng-te rm /
po s t-a c u te
O utpa tie n t
m e d ic a l T o ta l
% o f
T o ta l
% o f
C o un try
A nnua lize d th re e m o n ths e nde d S e p te m be r 30 , 2016
N e w Yo rk 8 .5% 6.1% 50 ,169$ 63 ,427$ 26 ,879$ 4 ,740$ 145 ,215$ 6 .9% 8.1%
Lo s A nge le s 14 .9% 10 .7% 87 ,630 3 ,570 - 21,020 112 ,220 5 .3% 6.3%
P hila de lph ia 1.5% 1.1% 8,973 24 ,970 55 ,614 20 ,858 110 ,415 5 .3% 6.2%
B o s to n 9 .1% 6.5% 53 ,665 1,690 18 ,967 1,068 75 ,390 3 .6% 4.2%
D a lla s 2 .3% 1.7% 13 ,582 25 ,157 5 ,235 28 ,932 72 ,906 3 .5% 4.1%
S e a tt le 3 .2% 2.3% 18 ,697 24 ,155 - 12 ,638 55 ,490 2 .6% 3.1%
Wa s h ing to n D C 3 .7% 2.6% 21,776 3 ,578 21,378 - 46 ,732 2 .2% 2.6%
C hic a go 4 .5% 3.2% 26 ,607 11,286 4 ,985 3 ,424 46 ,302 2 .2% 2.6%
S a n F ra nc is c o 5 .5% 3.9% 32 ,248 12 ,453 - - 44 ,701 2 .1% 2.5%
H o us to n 1.4% 1.0% 8,105 2 ,470 - 24 ,719 35 ,294 1.7% 2.0%
S a n D ie go 4 .8% 3.5% 28 ,365 - 2 ,641 1,546 32 ,552 1.5% 1.8%
S a n J o s e 2 .7% 1.9% 16 ,012 - - 1,676 17 ,688 0 .8% 1.0%
O the r T o p 31 US M S A s a nd C o a s ta l S ta te s 31.8% 22 .7% 186 ,941 177 ,196 154 ,557 113 ,683 632 ,377 30 .1% 35 .5%
O the r Un ite d S ta te s 6 .1% 4.4% 35 ,692 120 ,252 120 ,852 79 ,036 355 ,832 17 .0% 20 .0%
T o ta l Un ite d S ta te s 100 .0% 71.6% 588 ,462 470 ,204 411,108 313 ,340 1,783 ,114 84 .8% 100 .0%
Lo ndo n 67 .5% 6.5% 53 ,093 18 ,165 - 18 ,908 90 ,166 4 .3% 59 .1%
O the r S o u the rn E ng la nd 23 .2% 2.2% 18 ,240 27 ,308 - - 45 ,548 2 .2% 29 .8%
O the r Un ite d Kingdo m 9.3% 0.9% 7,367 9 ,522 - - 16 ,889 0 .8% 11.1%
T o ta l Un ite d Kingdo m 100 .0% 9.6% 78 ,700 54 ,995 - 18 ,908 152 ,603 7 .3% 100 .0%
T o ro n to 24 .0% 4.5% 37 ,128 - - - 37 ,128 1.8% 22 .5%
C a lga ry 6 .5% 1.2% 10 ,084 - 6 ,684 - 16 ,768 0 .8% 10 .2%
M o ntre a l 0 .0% 0.0% - - - - - 0 .0% 0.0%
O tta wa 13 .5% 2.5% 20 ,924 - - - 20 ,924 1.0% 12 .7%
Va nc o uve r 8 .1% 1.5% 12 ,556 1,424 - - 13 ,980 0 .7% 8.5%
O the r T o p 10 C a na d ia n M S A s 23 .9% 4.5% 37 ,042 - - - 37 ,042 1.8% 22 .5%
R e m a in ing C a na da 24 .0% 4.6% 37 ,124 1,993 - - 39 ,117 1.8% 23 .6%
T o ta l C a na da 100 .0% 18 .8% 154 ,858 3 ,417 6 ,684 - 164 ,959 7 .9% 100 .0%
T o ta l In -P la c e N O I (1) 100 .0% 822 ,020$ 528 ,616$ 417 ,792$ 332 ,248$ 2 ,100 ,676$ 100 .0%
% o f T o ta l 39 .1% 25 .2% 19 .9% 15 .8% 100 .0%
N o te s :
(1) P le a s e re fe r to "In -P la c e N O I by P a rtne r R e c o nc ilia t io ns " fo r a re c o nc ilia t io n o f In -P la c e N O I to ne t inc o m e a t tribu ta b le to c o m m o n s to c kho lde rs .
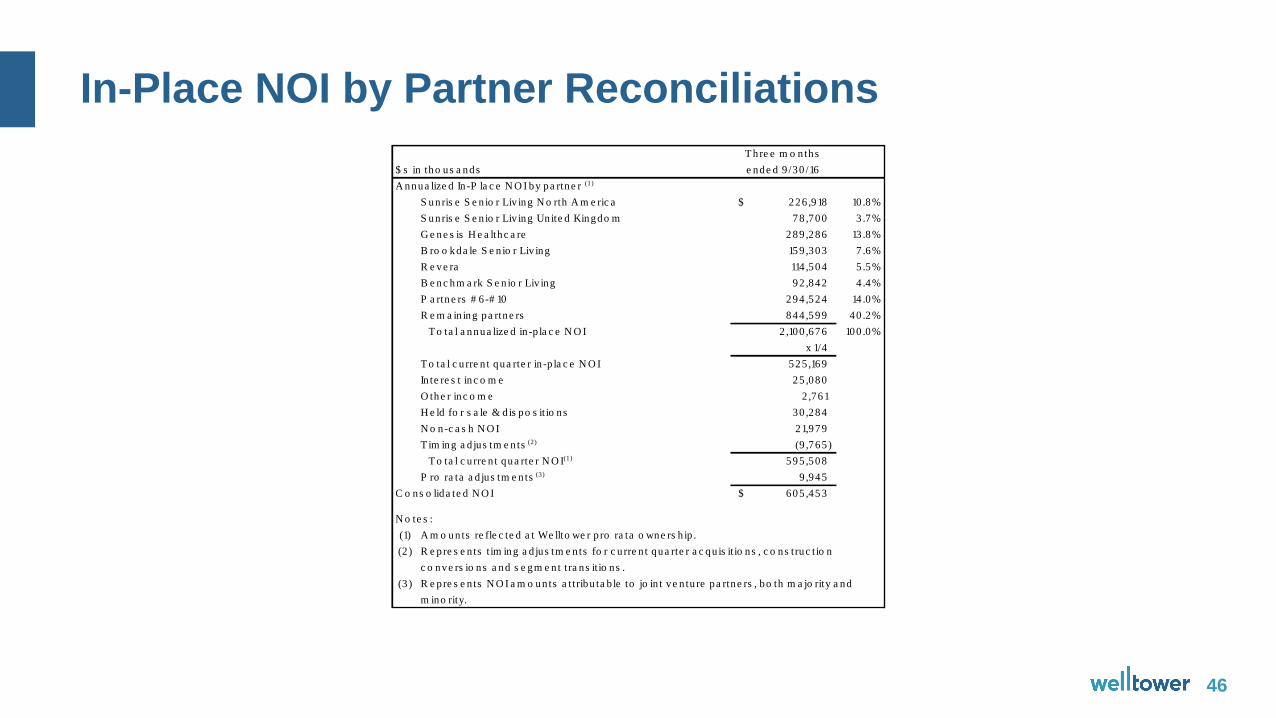
In-Place NOI by Partner Reconciliations
46
T hre e m o n ths
$ s in tho us a nds e nde d 9 /30 /16
A nnua lize d In -P la c e N O I by pa rtne r (1)
S unris e S e n io r Liv ing N o rth A m e ric a 226 ,918$ 10 .8%
S unris e S e n io r Liv ing Un ite d Kingdo m 78 ,700 3 .7%
G e ne s is H e a lthc a re 289 ,286 13 .8%
B ro o kda le S e n io r Liv ing 159 ,303 7 .6%
R e ve ra 114 ,504 5 .5%
B e nc hm a rk S e n io r Liv ing 92 ,842 4 .4%
P a rtne rs # 6 -# 10 294 ,524 14 .0%
R e m a in ing pa rtne rs 844 ,599 40 .2%
T o ta l a nnua lize d in -p la c e N O I 2 ,100 ,676 100 .0%
x 1/4
T o ta l c u rre n t qua rte r in -p la c e N O I 525 ,169
In te re s t inc o m e 25 ,080
O the r inc o m e 2 ,761
H e ld fo r s a le & d is po s it io ns 30 ,284
N o n-c a s h N O I 21,979
T im ing a d jus tm e n ts (2) (9 ,765)
T o ta l c u rre n t qua rte r N O I(1) 595 ,508
P ro ra ta a d jus tm e n ts (3) 9 ,945
C o ns o lida te d N O I 605 ,453$
N o te s :
(1)
(2 )
(3 )
A m o un ts re fle c te d a t We llto we r p ro ra ta o wne rs h ip .
R e pre s e n ts N O I a m o un ts a t tribu ta b le to jo in t ve n tu re pa rtne rs , bo th m a jo rity a nd
m ino rity.
R e pre s e n ts t im ing a d jus tm e n ts fo r c u rre n t qua rte r a c qu is it io ns , c o ns truc tio n
c o nve rs io ns a nd s e gm e n t tra ns it io ns .
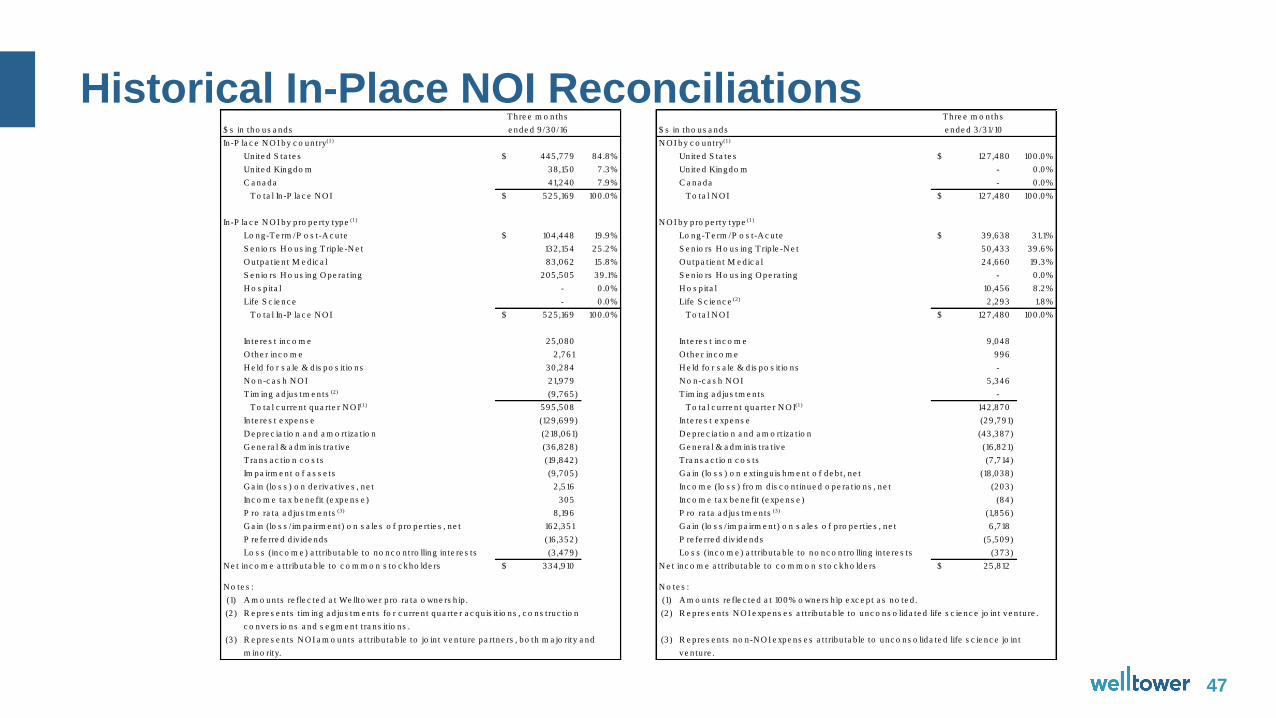
Historical In-Place NOI Reconciliations
47
T hre e m o n ths T hre e m o n ths
$ s in tho us a nds e nde d 9 /30 /16 $ s in tho us a nds e nde d 3 /31/10
In -P la c e N O I by c o un try(1) N O I by c o un try(1)
Unite d S ta te s 445 ,779$ 84 .8% Unite d S ta te s 127 ,480$ 100 .0%
Unite d Kingdo m 38 ,150 7 .3% Unite d Kingdo m - 0 .0%
C a na da 41,240 7 .9% C a na da - 0 .0%
T o ta l In -P la c e N O I 525 ,169$ 100 .0% T o ta l N O I 127 ,480$ 100 .0%
In -P la c e N O I by p ro pe rty type (1) N O I by p ro pe rty type (1)
Lo ng-T e rm /P o s t-A c u te 104 ,448$ 19 .9% Lo ng-T e rm /P o s t-A c u te 39 ,638$ 31.1%
S e n io rs H o us ing T rip le -N e t 132 ,154 25 .2% S e n io rs H o us ing T rip le -N e t 50 ,433 39 .6%
O utpa tie n t M e d ic a l 83 ,062 15 .8% O utpa tie n t M e d ic a l 24 ,660 19 .3%
S e n io rs H o us ing O pe ra t ing 205 ,505 39 .1% S e n io rs H o us ing O pe ra t ing - 0 .0%
H o s p ita l - 0 .0% H o s p ita l 10 ,456 8 .2%
Life S c ie nc e - 0 .0% Life S c ie nc e (2) 2 ,293 1.8%
T o ta l In -P la c e N O I 525 ,169$ 100 .0% T o ta l N O I 127 ,480$ 100 .0%
In te re s t inc o m e 25 ,080 In te re s t inc o m e 9 ,048
O the r inc o m e 2 ,761 O the r inc o m e 996
H e ld fo r s a le & d is po s it io ns 30 ,284 H e ld fo r s a le & d is po s it io ns -
N o n-c a s h N O I 21,979 N o n-c a s h N O I 5 ,346
T im ing a d ju s tm e n ts (2) (9 ,765 ) T im ing a d ju s tm e n ts -
T o ta l c u rre n t qua rte r N O I(1) 595 ,508 T o ta l c u rre n t qua rte r N O I(1) 142 ,870
In te re s t e xpe ns e (129 ,699 ) In te re s t e xpe ns e (29 ,791)
D e p re c ia t io n a nd a m o rt iza t io n (218 ,061) D e p re c ia t io n a nd a m o rt iza t io n (43 ,387 )
G e ne ra l & a dm in is tra t ive (36 ,828 ) G e ne ra l & a dm in is tra t ive (16 ,821)
T ra ns a c t io n c o s ts (19 ,842 ) T ra ns a c t io n c o s ts (7 ,714 )
Im pa irm e n t o f a s s e ts (9 ,705 ) G a in (lo s s ) o n e xtingu is hm e n t o f de b t , ne t (18 ,038 )
G a in (lo s s ) o n de riva t ive s , ne t 2 ,516 Inc o m e (lo s s ) fro m d is c o n tinue d o pe ra t io ns , ne t (203 )
Inc o m e ta x be ne fit (e xpe ns e ) 30 5 Inc o m e ta x be ne fit (e xpe ns e ) (84 )
P ro ra ta a d ju s tm e n ts (3) 8 ,196 P ro ra ta a d ju s tm e n ts (3) (1,856 )
G a in (lo s s / im pa irm e n t) o n s a le s o f p ro pe rt ie s , ne t 162 ,351 G a in (lo s s / im pa irm e n t) o n s a le s o f p ro pe rt ie s , ne t 6 ,718
P re fe rre d d iv ide nds (16 ,352 ) P re fe rre d d iv ide nds (5 ,509 )
Lo s s (inc o m e ) a t t ribu ta b le to no nc o n tro lling in te re s ts (3 ,479 ) Lo s s (inc o m e ) a t t ribu ta b le to no nc o n tro lling in te re s ts (373 )
N e t inc o m e a t tribu ta b le to c o m m o n s to c kho lde rs 334 ,910$ N e t inc o m e a t tribu ta b le to c o m m o n s to c kho lde rs 25 ,812$
N o te s : N o te s :
(1) (1)
(2 ) (2 )
(3 ) (3 )
A m o un ts re fle c te d a t We llto we r p ro ra ta o wne rs h ip .
R e p re s e n ts t im ing a d ju s tm e n ts fo r c u rre n t qua rte r a c qu is it io ns , c o ns truc t io n
c o nve rs io ns a nd s e gm e n t t ra ns it io ns .
R e p re s e n ts N O I a m o un ts a t t ribu ta b le to jo in t ve n tu re pa rtne rs , bo th m a jo rity a nd
m ino rity.
A m o un ts re fle c te d a t 100% o wne rs h ip e xc e p t a s no te d .
R e p re s e n ts N O I e xpe ns e s a t t ribu ta b le to unc o ns o lida te d life s c ie nc e jo in t ve n tu re .
R e p re s e n ts no n -N O I e xpe ns e s a t t ribu ta b le to unc o ns o lida te d life s c ie nc e jo in t
ve n tu re .
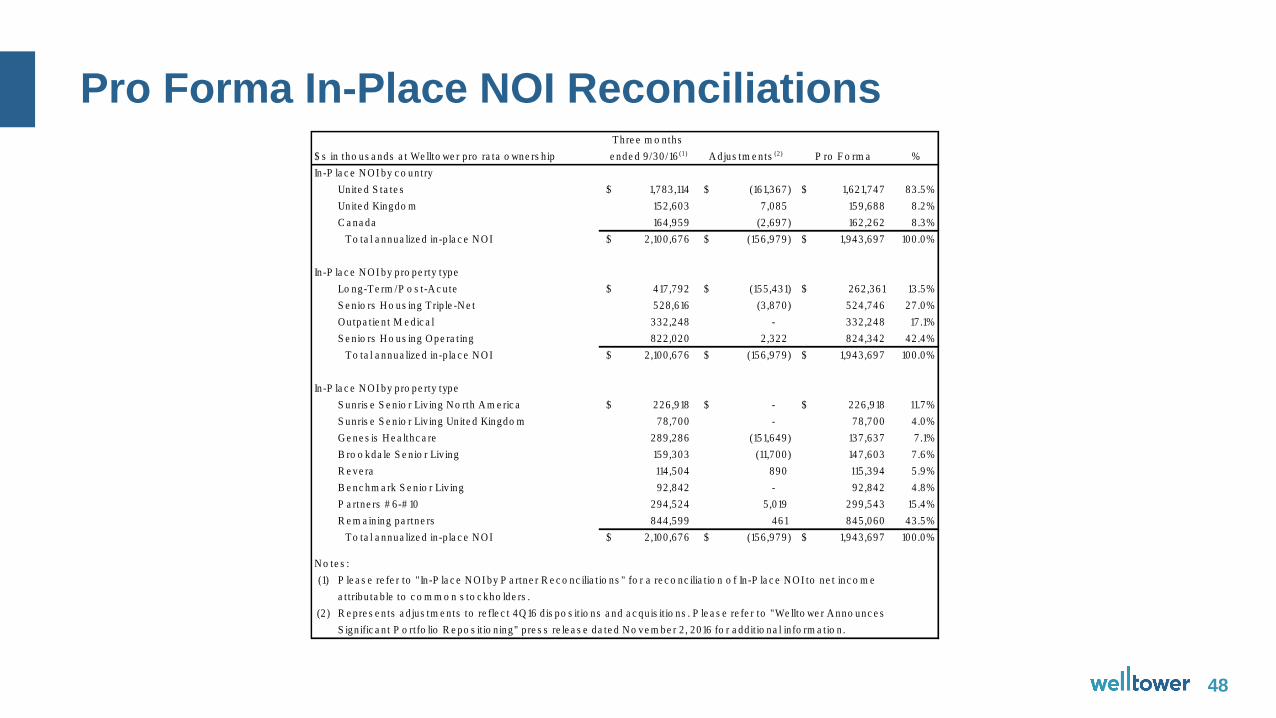
• Pro Forma In-Place NOI Reconciliations
48
T hre e m o n ths
$ s in tho us a nds a t We llto we r p ro ra ta o wne rs h ip e nde d 9 /30 /16 (1) A djus tm e n ts (2) P ro F o rm a %
In-P la c e N O I by c o un try
Unite d S ta te s 1,783 ,114$ (161,367)$ 1,621,747$ 83 .5%
Unite d Kingdo m 152 ,603 7 ,085 159 ,688 8 .2%
C a na da 164 ,959 (2 ,697) 162 ,262 8 .3%
T o ta l a nnua lize d in -p la c e N O I 2 ,100 ,676$ (156 ,979)$ 1,943 ,697$ 100 .0%
In-P la c e N O I by p ro pe rty type
Lo ng-T e rm /P o s t-A c u te 417 ,792$ (155 ,431)$ 262 ,361$ 13 .5%
S e n io rs H o us ing T rip le -N e t 528 ,616 (3 ,870) 524 ,746 27 .0%
O utpa tie n t M e d ic a l 332 ,248 - 332 ,248 17 .1%
S e n io rs H o us ing O pe ra ting 822 ,020 2 ,322 824 ,342 42 .4%
T o ta l a nnua lize d in -p la c e N O I 2 ,100 ,676$ (156 ,979)$ 1,943 ,697$ 100 .0%
In-P la c e N O I by p ro pe rty type
S unris e S e n io r Liv ing N o rth A m e ric a 226 ,918$ -$ 226 ,918$ 11.7%
S unris e S e n io r Liv ing Un ite d Kingdo m 78 ,700 - 78 ,700 4 .0%
G e ne s is H e a lthc a re 289 ,286 (151,649) 137 ,637 7 .1%
B ro o kda le S e n io r Liv ing 159 ,303 (11,700) 147 ,603 7 .6%
R e ve ra 114 ,504 890 115 ,394 5 .9%
B e nc hm a rk S e n io r Liv ing 92 ,842 - 92 ,842 4 .8%
P a rtne rs # 6 -# 10 294 ,524 5 ,019 299 ,543 15 .4%
R e m a in ing pa rtne rs 844 ,599 461 845 ,060 43 .5%
T o ta l a nnua lize d in -p la c e N O I 2 ,100 ,676$ (156 ,979)$ 1,943 ,697$ 100 .0%
N o te s :
(1)
(2 )
P le a s e re fe r to "In -P la c e N O I by P a rtne r R e c o nc ilia t io ns " fo r a re c o nc ilia t io n o f In -P la c e N O I to ne t inc o m e
a t tribu ta b le to c o m m o n s to c kho lde rs .
R e pre s e n ts a d jus tm e n ts to re fle c t 4Q 16 d is po s it io ns a nd a c qu is it io ns . P le a s e re fe r to "We llto we r A nno unc e s
S ign ific a n t P o rtfo lio R e po s it io n ing" p re s s re le a s e da te d N o ve m be r 2 , 2016 fo r a dd it io na l in fo rm a tio n .
Pro Forma In-Place NOI Reconciliations
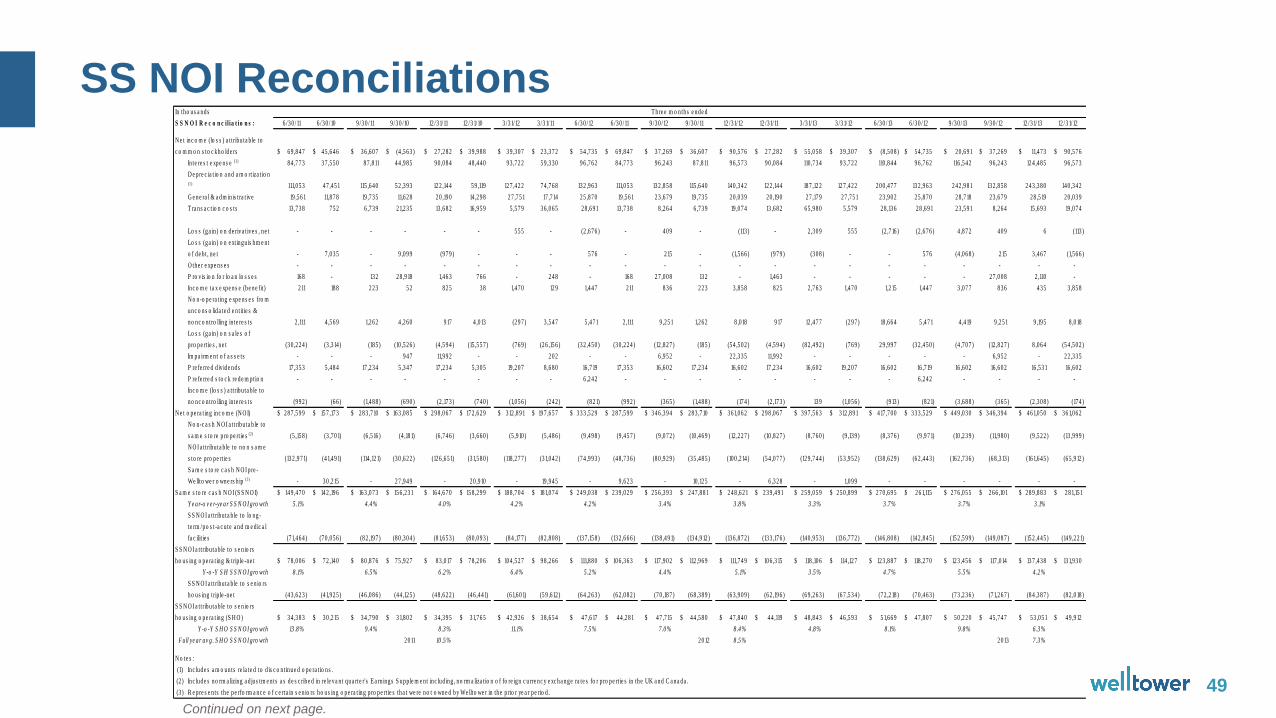
• SSNOI Reconciliations
In tho us a nds
S S N O I R e c o n c il ia t io n s : 6 /30 /11 6 /30 /10 9 /30 /11 9 /30 /10 12 /31/11 12 /31/10 3 /31/12 3 /31/11 6 /30 /12 6 /30 /11 9 /30 /12 9 /30 /11 12 /31/12 12 /31/11 3 /31/13 3 /31/12 6 /30 /13 6 /30 /12 9 /30 /13 9 /30 /12 12 /31/13 12 /31/12
69 ,847$ 45 ,646$ 36 ,607$ (4 ,563 )$ 27 ,282$ 39 ,988$ 39 ,307$ 23 ,372$ 54 ,735$ 69 ,847$ 37 ,269$ 36 ,607$ 90 ,576$ 27 ,282$ 55 ,058$ 39 ,307$ (8 ,508 )$ 54 ,735$ 20 ,691$ 37 ,269$ 11,473$ 90 ,576$
In te re s t e xpe ns e (1) 84 ,773 37 ,550 87 ,811 44 ,985 90 ,084 48 ,440 93 ,722 59 ,330 96 ,762 84 ,773 96 ,243 87 ,811 96 ,573 90 ,084 110 ,734 93 ,722 110 ,844 96 ,762 116 ,542 96 ,243 124 ,485 96 ,573
D e p re c ia t io n a nd a m o rt iza t io n (1) 111,053 47 ,451 115 ,640 52 ,393 122 ,144 59 ,119 127 ,422 74 ,768 132 ,963 111,053 132 ,858 115 ,640 140 ,342 122 ,144 187 ,122 127 ,422 200 ,477 132 ,963 242 ,981 132 ,858 243 ,380 140 ,342
G e ne ra l & a dm in is tra t ive 19 ,561 11,878 19 ,735 11,628 20 ,190 14 ,298 27 ,751 17 ,714 25 ,870 19 ,561 23 ,679 19 ,735 20 ,039 20 ,190 27 ,179 27 ,751 23 ,902 25 ,870 28 ,718 23 ,679 28 ,519 20 ,039
T ra ns a c t io n c o s ts 13 ,738 752 6 ,739 21,235 13 ,682 16 ,959 5 ,579 36 ,065 28 ,691 13 ,738 8 ,264 6 ,739 19 ,074 13 ,682 65 ,980 5 ,579 28 ,136 28 ,691 23 ,591 8 ,264 15 ,693 19 ,074
Lo s s (ga in ) o n de riva t ive s , ne t - - - - - - 555 - (2 ,676 ) - 409 - (113 ) - 2 ,309 555 (2 ,716 ) (2 ,676 ) 4 ,872 40 9 6 (113 )
Lo s s (ga in ) o n e xtingu is hm e n t
o f de b t , ne t - 7 ,035 - 9 ,099 (979 ) - - - 576 - 215 - (1,566 ) (979 ) (308 ) - - 576 (4 ,068 ) 215 3 ,467 (1,566 )
O the r e xpe ns e s - - - - - - - - - - - - - - - - - - - - - -
P ro v is io n fo r lo a n lo s s e s 168 - 132 28 ,918 1,463 7 6 6 - 248 - 168 27 ,008 132 - 1,463 - - - - - 27 ,008 2 ,110 -
Inc o m e ta x e xpe ns e (be ne fit) 211 188 223 52 82 5 3 8 1,470 129 1,447 211 836 223 3 ,858 825 2 ,763 1,470 1,215 1,447 3 ,077 83 6 435 3 ,858
N o n-o pe ra t ing e xpe ns e s fro m
unc o ns o lida te d e n tit ie s &
no nc o n tro lling in te re s ts 2 ,111 4 ,569 1,262 4 ,260 917 4 ,013 (297 ) 3 ,547 5 ,471 2 ,111 9 ,251 1,262 8 ,018 917 12 ,477 (297 ) 18 ,664 5 ,471 4 ,419 9 ,251 9 ,195 8 ,018
Lo s s (ga in ) o n s a le s o f
p ro pe rt ie s , ne t (30 ,224 ) (3 ,314 ) (185 ) (10 ,526 ) (4 ,594 ) (15 ,557 ) (769 ) (26 ,156 ) (32 ,450 ) (30 ,224 ) (12 ,827 ) (185 ) (54 ,502 ) (4 ,594 ) (82 ,492 ) (769 ) 29 ,997 (32 ,450 ) (4 ,707 ) (12 ,827 ) 8 ,064 (54 ,502 )
Im pa irm e n t o f a s s e ts - - - 947 11,992 - - 202 - - 6 ,952 - 22 ,335 11,992 - - - - - 6 ,952 - 22 ,335
P re fe rre d d iv ide nds 17 ,353 5 ,484 17 ,234 5 ,347 17 ,234 5 ,305 19 ,207 8 ,680 16 ,719 17 ,353 16 ,602 17 ,234 16 ,602 17 ,234 16 ,602 19 ,207 16 ,602 16 ,719 16 ,602 16 ,602 16 ,531 16 ,602
P re fe rre d s to c k re de m ptio n - - - - - - - - 6 ,242 - - - - - - - - 6 ,242 - - - -
Inc o m e (lo s s ) a t t ribu ta b le to
no nc o n tro lling in te re s ts (992 ) (66 ) (1,488 ) (690 ) (2 ,173 ) (740 ) (1,056 ) (242 ) (821) (992 ) (365 ) (1,488 ) (174 ) (2 ,173 ) 139 (1,056 ) (913 ) (821) (3 ,688 ) (365 ) (2 ,308 ) (174 )
N e t o pe ra t ing inc o m e (N O I) 287 ,599$ 157 ,173$ 283 ,710$ 163 ,085$ 298 ,067$ 172 ,629$ 312 ,891$ 197 ,657$ 333 ,529$ 287 ,599$ 346 ,394$ 283 ,710$ 361,062$ 298 ,067$ 397 ,563$ 312 ,891$ 417 ,700$ 333 ,529$ 449 ,030$ 346 ,394$ 461,050$ 361,062$
N o n-c a s h N O I a t tribu ta b le to
s a m e s to re p ro pe rt ie s (2) (5 ,158 ) (3 ,701) (6 ,516 ) (4 ,181) (6 ,746 ) (3 ,660 ) (5 ,910 ) (5 ,486 ) (9 ,498 ) (9 ,457 ) (9 ,072 ) (10 ,469 ) (12 ,227 ) (10 ,827 ) (8 ,760 ) (9 ,139 ) (8 ,376 ) (9 ,971) (10 ,239 ) (11,980 ) (9 ,522 ) (13 ,999 )
N O I a t tribu ta b le to no n s a m e
s to re p ro pe rt ie s (132 ,971) (41,491) (114 ,121) (30 ,622 ) (126 ,651) (31,580 ) (118 ,277 ) (31,042 ) (74 ,993 ) (48 ,736 ) (80 ,929 ) (35 ,485 ) (100 ,214 ) (54 ,077 ) (129 ,744 ) (53 ,952 ) (138 ,629 ) (62 ,443 ) (162 ,736 ) (68 ,313 ) (161,645 ) (65 ,912 )
S a m e s to re c a s h N O I p re -
We llto we r o wne rs h ip (3) - 30 ,215 - 27 ,949 - 20 ,910 - 19 ,945 - 9 ,623 - 10 ,125 - 6 ,328 - 1,099 - - - - - -
S a m e s to re c a s h N O I (S S N O I) 149 ,470$ 142 ,196$ 163 ,073$ 156 ,231$ 164 ,670$ 158 ,299$ 188 ,704$ 181,074$ 249 ,038$ 239 ,029$ 256 ,393$ 247 ,881$ 248 ,621$ 239 ,491$ 259 ,059$ 250 ,899$ 270 ,695$ 261,115$ 276 ,055$ 266 ,101$ 289 ,883$ 281,151$
5 .1% 4 .4% 4 .0% 4 .2% 4 .2% 3 .4% 3 .8% 3 .3% 3 .7% 3 .7% 3 .1%
S S N O I a t tribu ta b le to lo ng -
te rm /po s t-a c u te a nd m e d ic a l
fa c ilit ie s (71,464 ) (70 ,056 ) (82 ,197 ) (80 ,304 ) (81,653 ) (80 ,093 ) (84 ,177 ) (82 ,808 ) (137 ,158 ) (132 ,666 ) (138 ,491) (134 ,912 ) (136 ,872 ) (133 ,176 ) (140 ,953 ) (136 ,772 ) (146 ,808 ) (142 ,845 ) (152 ,599 ) (149 ,087 ) (152 ,445 ) (149 ,221)
78 ,006$ 72 ,140$ 80 ,876$ 75 ,927$ 83 ,017$ 78 ,206$ 104 ,527$ 98 ,266$ 111,880$ 106 ,363$ 117 ,902$ 112 ,969$ 111,749$ 106 ,315$ 118 ,106$ 114 ,127$ 123 ,887$ 118 ,270$ 123 ,456$ 117 ,014$ 137 ,438$ 131,930$
8 .1% 6 .5% 6 .2% 6 .4% 5 .2% 4 .4% 5 .1% 3 .5% 4 .7% 5 .5% 4 .2%
S S N O I a t tribu ta b le to s e n io rs
ho us ing trip le -ne t (43 ,623 ) (41,925 ) (46 ,086 ) (44 ,125 ) (48 ,622 ) (46 ,441) (61,601) (59 ,612 ) (64 ,263 ) (62 ,082 ) (70 ,187 ) (68 ,389 ) (63 ,909 ) (62 ,196 ) (69 ,263 ) (67 ,534 ) (72 ,218 ) (70 ,463 ) (73 ,236 ) (71,267 ) (84 ,387 ) (82 ,018 )
34 ,383$ 30 ,215$ 34 ,790$ 31,802$ 34 ,395$ 31,765$ 42 ,926$ 38 ,654$ 47 ,617$ 44 ,281$ 47 ,715$ 44 ,580$ 47 ,840$ 44 ,119$ 48 ,843$ 46 ,593$ 51,669$ 47 ,807$ 50 ,220$ 45 ,747$ 53 ,051$ 49 ,912$
13 .8% 9 .4% 8 .3% 11.1% 7 .5% 7 .0% 8 .4% 4 .8% 8 .1% 9 .8% 6 .3%
2011 10 .5% 2012 8 .5% 2013 7 .3%
N o te s :
(1)
(2 )
(3 )
Y -o -Y S H O S S N O I g ro wth
Inc lude s a m o un ts re la te d to d is c o n tinue d o pe ra t io ns .
Inc lude s no rm a lizing a d ju s tm e n ts a s de s c ribe d in re le va n t qua rte r's E a rn ings S upp le m e n t inc lud ing , no rm a liza t io n o f fo re ign c u rre nc y e xc ha nge ra te s fo r p ro pe rt ie s in the UK a nd C a na da .
R e p re s e n ts the pe rfo rm a nc e o f c e rta in s e n io rs ho us ing o pe ra t ing p ro pe rt ie s tha t we re no t o wne d by We llto we r in the p rio r ye a r pe rio d .
T h re e m o n ths e nde d
N e t inc o m e (lo s s ) a t t ribu ta b le to
c o m m o n s to c kho lde rs
Y e ar-o v e r-ye ar S S N O I g ro wth
S S N O I a t tribu ta b le to s e n io rs
ho us ing o pe ra t ing & trip le -ne t
Y -o -Y S H S S N O I g ro wth
S S N O I a t tribu ta b le to s e n io rs
ho us ing o pe ra t ing (S H O )
F ull ye ar av g . S H O S S N O I g ro wth
SS NOI Reconciliations
Continued on next page.
49
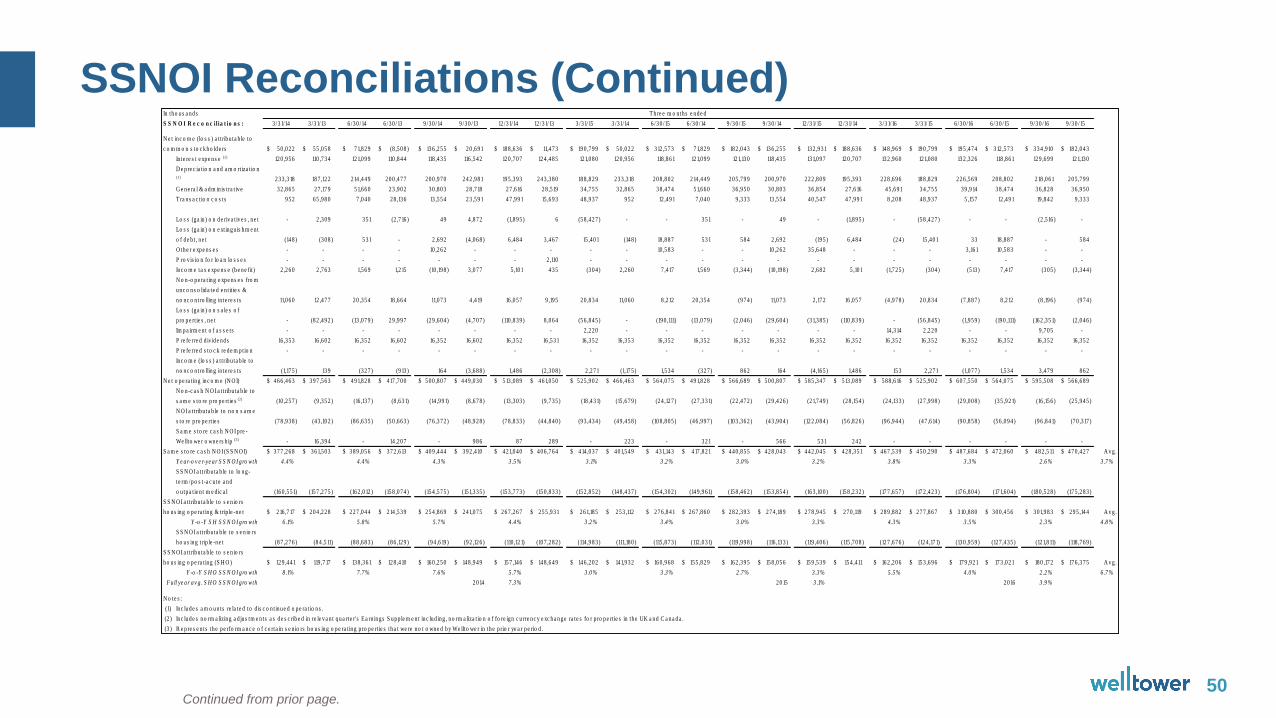
• SSNOI Reconciliations (Continued)
Continued from prior page.
In tho us a nds
S S N O I R e c o n c il ia t io n s : 3 /31/14 3 /31/13 6 /30 /14 6 /30 /13 9 /30 /14 9 /30 /13 12 /31/14 12 /31/13 3 /31/15 3 /31/14 6 /30 /15 6 /30 /14 9 /30 /15 9 /30 /14 12 /31/15 12 /31/14 3 /31/16 3 /31/15 6 /30 /16 6 /30 /15 9 /30 /16 9 /30 /15
50 ,022$ 55 ,058$ 71,829$ (8 ,508 )$ 136 ,255$ 20 ,691$ 188 ,636$ 11,473$ 190 ,799$ 50 ,022$ 312 ,573$ 71,829$ 182 ,043$ 136 ,255$ 132 ,931$ 188 ,636$ 148 ,969$ 190 ,799$ 195 ,474$ 312 ,573$ 334 ,910$ 182 ,043$
In te re s t e xpe ns e (1) 120 ,956 110 ,734 121,099 110 ,844 118 ,435 116 ,542 120 ,707 124 ,485 121,080 120 ,956 118 ,861 121,099 121,130 118 ,435 131,097 120 ,707 132 ,960 121,080 132 ,326 118 ,861 129 ,699 121,130
D e p re c ia t io n a nd a m o rt iza t io n (1) 233 ,318 187 ,122 214 ,449 200 ,477 200 ,970 242 ,981 195 ,393 243 ,380 188 ,829 233 ,318 208 ,802 214 ,449 205 ,799 200 ,970 222 ,809 195 ,393 228 ,696 188 ,829 226 ,569 208 ,802 218 ,061 205 ,799
G e ne ra l & a dm in is tra t ive 32 ,865 27 ,179 51,660 23 ,902 30 ,803 28 ,718 27 ,616 28 ,519 34 ,755 32 ,865 38 ,474 51,660 36 ,950 30 ,803 36 ,854 27 ,616 45 ,691 34 ,755 39 ,914 38 ,474 36 ,828 36 ,950
T ra ns a c t io n c o s ts 952 65 ,980 7 ,040 28 ,136 13 ,554 23 ,591 47 ,991 15 ,693 48 ,937 95 2 12 ,491 7 ,040 9 ,333 13 ,554 40 ,547 47 ,991 8 ,208 48 ,937 5 ,157 12 ,491 19 ,842 9 ,333
Lo s s (ga in ) o n de riva t ive s , ne t - 2 ,309 3 51 (2 ,716 ) 49 4 ,872 (1,895 ) 6 (58 ,427 ) - - 351 - 49 - (1,895 ) - (58 ,427 ) - - (2 ,516 ) -
Lo s s (ga in ) o n e xtingu is hm e n t
o f de b t , ne t (148 ) (308 ) 5 31 - 2 ,692 (4 ,068 ) 6 ,484 3 ,467 15 ,401 (148 ) 18 ,887 531 584 2 ,692 (195 ) 6 ,484 (24 ) 15 ,401 33 18 ,887 - 584
O the r e xpe ns e s - - - - 10 ,262 - - - - - 10 ,583 - - 10 ,262 35 ,648 - - - 3 ,161 10 ,583 - -
P ro v is io n fo r lo a n lo s s e s - - - - - - - 2 ,110 - - - - - - - - - - - - - -
Inc o m e ta x e xpe ns e (be ne fit) 2 ,260 2 ,763 1,569 1,215 (10 ,198 ) 3 ,077 5 ,101 4 3 5 (304 ) 2 ,260 7 ,417 1,569 (3 ,344 ) (10 ,198 ) 2 ,682 5 ,101 (1,725 ) (304 ) (513 ) 7 ,417 (305 ) (3 ,344 )
N o n-o pe ra t ing e xpe ns e s fro m
unc o ns o lida te d e n tit ie s &
no nc o n tro lling in te re s ts 11,060 12 ,477 20 ,354 18 ,664 11,073 4 ,419 16 ,057 9 ,195 20 ,834 11,060 8 ,212 20 ,354 (974 ) 11,073 2 ,172 16 ,057 (4 ,978 ) 20 ,834 (7 ,887 ) 8 ,212 (8 ,196 ) (974 )
Lo s s (ga in ) o n s a le s o f
p ro pe rt ie s , ne t - (82 ,492 ) (13 ,079 ) 29 ,997 (29 ,604 ) (4 ,707 ) (110 ,839 ) 8 ,064 (56 ,845 ) - (190 ,111) (13 ,079 ) (2 ,046 ) (29 ,604 ) (31,385 ) (110 ,839 ) - (56 ,845 ) (1,959 ) (190 ,111) (162 ,351) (2 ,046 )
Im pa irm e n t o f a s s e ts - - - - - - - - 2 ,220 - - - - - - - 14 ,314 2 ,220 - - 9 ,705 -
P re fe rre d d iv ide nds 16 ,353 16 ,602 16 ,352 16 ,602 16 ,352 16 ,602 16 ,352 16 ,531 16 ,352 16 ,353 16 ,352 16 ,352 16 ,352 16 ,352 16 ,352 16 ,352 16 ,352 16 ,352 16 ,352 16 ,352 16 ,352 16 ,352
P re fe rre d s to c k re de m ptio n - - - - - - - - - - - - - - - - - - - - - -
Inc o m e (lo s s ) a t t ribu ta b le to
no nc o n tro lling in te re s ts (1,175 ) 139 (327 ) (913 ) 164 (3 ,688 ) 1,486 (2 ,308 ) 2 ,271 (1,175 ) 1,534 (327 ) 862 164 (4 ,165 ) 1,486 153 2 ,271 (1,077 ) 1,534 3 ,479 862
N e t o pe ra t ing inc o m e (N O I) 466 ,463$ 397 ,563$ 491,828$ 417 ,700$ 500 ,807$ 449 ,030$ 513 ,089$ 461,050$ 525 ,902$ 466 ,463$ 564 ,075$ 491,828$ 566 ,689$ 500 ,807$ 585 ,347$ 513 ,089$ 588 ,616$ 525 ,902$ 607 ,550$ 564 ,075$ 595 ,508$ 566 ,689$
N o n-c a s h N O I a t tribu ta b le to
s a m e s to re p ro pe rt ie s (2) (10 ,257 ) (9 ,352 ) (16 ,137 ) (8 ,631) (14 ,991) (8 ,678 ) (13 ,303 ) (9 ,735 ) (18 ,431) (15 ,679 ) (24 ,127 ) (27 ,331) (22 ,472 ) (29 ,426 ) (21,749 ) (28 ,154 ) (24 ,133 ) (27 ,998 ) (29 ,008 ) (35 ,921) (16 ,156 ) (25 ,945 )
N O I a t tribu ta b le to no n s a m e
s to re p ro pe rt ie s (78 ,938 ) (43 ,102 ) (86 ,635 ) (50 ,663 ) (76 ,372 ) (48 ,928 ) (78 ,833 ) (44 ,840 ) (93 ,434 ) (49 ,458 ) (108 ,805 ) (46 ,997 ) (103 ,362 ) (43 ,904 ) (122 ,084 ) (56 ,826 ) (96 ,944 ) (47 ,614 ) (90 ,858 ) (56 ,094 ) (96 ,841) (70 ,317 )
S a m e s to re c a s h N O I p re -
We llto we r o wne rs h ip (3) - 16 ,394 - 14 ,207 - 9 86 8 7 2 8 9 - 22 3 - 321 - 566 531 242 - - - - - -
S a m e s to re c a s h N O I (S S N O I) 377 ,268$ 361,503$ 389 ,056$ 372 ,613$ 409 ,444$ 392 ,410$ 421,040$ 406 ,764$ 414 ,037$ 401,549$ 431,143$ 417 ,821$ 440 ,855$ 428 ,043$ 442 ,045$ 428 ,351$ 467 ,539$ 450 ,290$ 487 ,684$ 472 ,060$ 482 ,511$ 470 ,427$ A vg .
4 .4% 4 .4% 4 .3% 3 .5% 3 .1% 3 .2% 3 .0% 3 .2% 3 .8% 3 .3% 2 .6% 3 .7%
S S N O I a t tribu ta b le to lo ng -
te rm /po s t-a c u te a nd
o u tpa t ie n t m e d ic a l (160 ,551) (157 ,275 ) (162 ,012 ) (158 ,074 ) (154 ,575 ) (151,335 ) (153 ,773 ) (150 ,833 ) (152 ,852 ) (148 ,437 ) (154 ,302 ) (149 ,961) (158 ,462 ) (153 ,854 ) (163 ,100 ) (158 ,232 ) (177 ,657 ) (172 ,423 ) (176 ,804 ) (171,604 ) (180 ,528 ) (175 ,283 )
216 ,717$ 204 ,228$ 227 ,044$ 214 ,539$ 254 ,869$ 241,075$ 267 ,267$ 255 ,931$ 261,185$ 253 ,112$ 276 ,841$ 267 ,860$ 282 ,393$ 274 ,189$ 278 ,945$ 270 ,119$ 289 ,882$ 277 ,867$ 310 ,880$ 300 ,456$ 301,983$ 295 ,144$ A vg .
6 .1% 5 .8% 5 .7% 4 .4% 3 .2% 3 .4% 3 .0% 3 .3% 4 .3% 3 .5% 2 .3% 4 .8%
S S N O I a t tribu ta b le to s e n io rs
ho us ing trip le -ne t (87 ,276 ) (84 ,511) (88 ,683 ) (86 ,129 ) (94 ,619 ) (92 ,126 ) (110 ,121) (107 ,282 ) (114 ,983 ) (111,180 ) (115 ,873 ) (112 ,031) (119 ,998 ) (116 ,133 ) (119 ,406 ) (115 ,708 ) (127 ,676 ) (124 ,171) (130 ,959 ) (127 ,435 ) (121,811) (118 ,769 )
129 ,441$ 119 ,717$ 138 ,361$ 128 ,410$ 160 ,250$ 148 ,949$ 157 ,146$ 148 ,649$ 146 ,202$ 141,932$ 160 ,968$ 155 ,829$ 162 ,395$ 158 ,056$ 159 ,539$ 154 ,411$ 162 ,206$ 153 ,696$ 179 ,921$ 173 ,021$ 180 ,172$ 176 ,375$ A vg .
8 .1% 7 .7% 7 .6% 5 .7% 3 .0% 3 .3% 2 .7% 3 .3% 5 .5% 4 .0% 2 .2% 6 .7%
2014 7 .3% 2015 3 .1% 2016 3 .9%
N o te s :
(1)
(2 )
(3 )
Y -o -Y S H O S S N O I g ro wth
Inc lude s a m o un ts re la te d to d is c o n tinue d o pe ra t io ns .
Inc lude s no rm a lizing a d ju s tm e n ts a s de s c ribe d in re le va n t qua rte r's E a rn ings S upp le m e n t inc lud ing , no rm a liza t io n o f fo re ign c u rre nc y e xc ha nge ra te s fo r p ro pe rt ie s in the UK a nd C a na da .
R e p re s e n ts the pe rfo rm a nc e o f c e rta in s e n io rs ho us ing o pe ra t ing p ro pe rt ie s tha t we re no t o wne d by We llto we r in the p rio r ye a r pe rio d .
T h re e m o n ths e nde d
N e t inc o m e (lo s s ) a t t ribu ta b le to
c o m m o n s to c kho lde rs
Y e ar-o v e r-ye ar S S N O I g ro wth
S S N O I a t tribu ta b le to s e n io rs
ho us ing o pe ra t ing & trip le -ne t
Y -o -Y S H S S N O I g ro wth
S S N O I a t tribu ta b le to s e n io rs
ho us ing o pe ra t ing (S H O )
F ull ye ar av g . S H O S S N O I g ro wth
SSNOI Reconciliations (Continued)
50
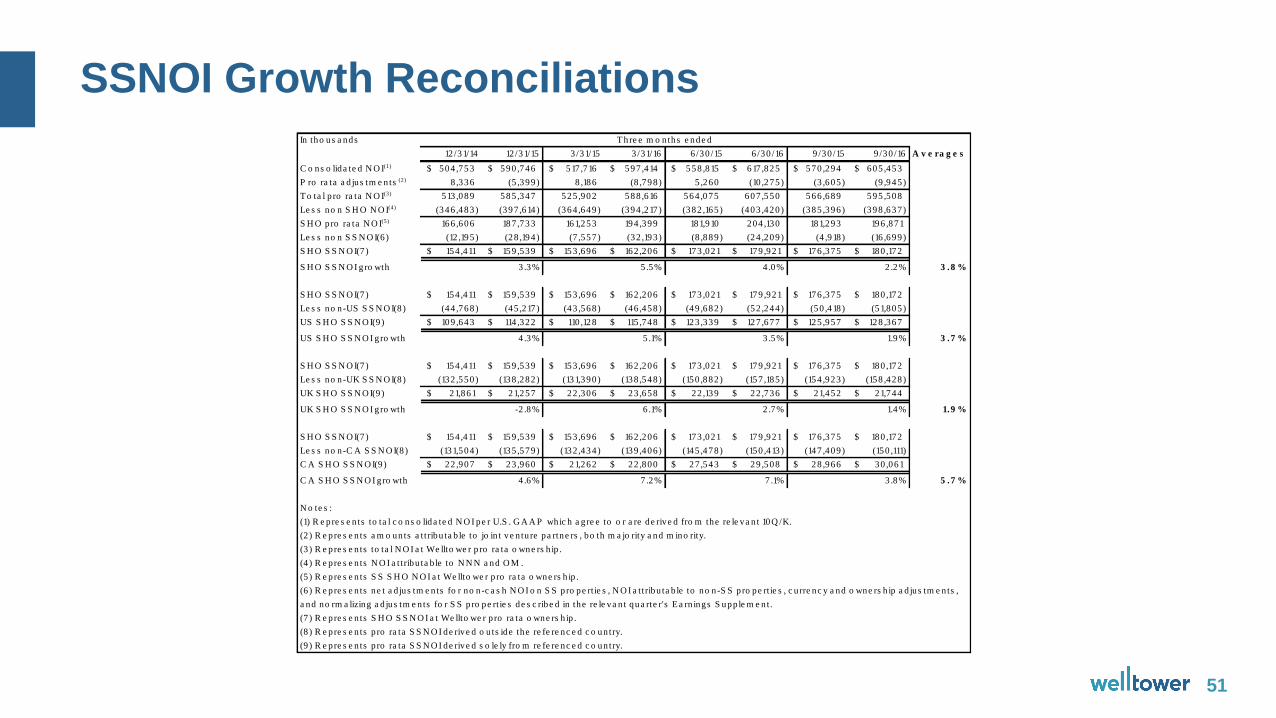
• SSNOI Growth Reconciliations
In tho us a nds
12 /31/14 12 /31/15 3 /31/15 3 /31/16 6 /30 /15 6 /30 /16 9 /30 /15 9 /30 /16 A v e ra g e s
C o ns o lida te d N O I(1) 504 ,753$ 590 ,746$ 517 ,716$ 597 ,414$ 558 ,815$ 617 ,825$ 570 ,294$ 605 ,453$
P ro ra ta a d jus tm e n ts (2) 8 ,336 (5 ,399) 8 ,186 (8 ,798) 5 ,260 (10 ,275) (3 ,605) (9 ,945)
T o ta l p ro ra ta N O I(3) 513 ,089 585 ,347 525 ,902 588 ,616 564 ,075 607 ,550 566 ,689 595 ,508
Le s s no n S H O N O I(4) (346 ,483) (397 ,614) (364 ,649) (394 ,217) (382 ,165) (403 ,420) (385 ,396) (398 ,637)
S H O pro ra ta N O I(5) 166 ,606 187 ,733 161,253 194 ,399 181,910 204 ,130 181,293 196 ,871
Le s s no n S S N O I(6 ) (12 ,195) (28 ,194) (7 ,557) (32 ,193) (8 ,889) (24 ,209) (4 ,918) (16 ,699)
S H O S S N O I(7 ) 154 ,411$ 159 ,539$ 153 ,696$ 162 ,206$ 173 ,021$ 179 ,921$ 176 ,375$ 180 ,172$
S H O S S N O I g ro wth 3 .3% 5.5% 4.0% 2.2% 3 .8 %
S H O S S N O I(7 ) 154 ,411$ 159 ,539$ 153 ,696$ 162 ,206$ 173 ,021$ 179 ,921$ 176 ,375$ 180 ,172$
Le s s no n-US S S N O I(8 ) (44 ,768) (45 ,217) (43 ,568) (46 ,458) (49 ,682) (52 ,244) (50 ,418) (51,805)
US S H O S S N O I(9 ) 109 ,643$ 114 ,322$ 110 ,128$ 115 ,748$ 123 ,339$ 127 ,677$ 125 ,957$ 128 ,367$
US S H O S S N O I g ro wth 4 .3% 5.1% 3.5% 1.9% 3 .7 %
S H O S S N O I(7 ) 154 ,411$ 159 ,539$ 153 ,696$ 162 ,206$ 173 ,021$ 179 ,921$ 176 ,375$ 180 ,172$
Le s s no n-UK S S N O I(8 ) (132 ,550) (138 ,282) (131,390) (138 ,548) (150 ,882) (157 ,185) (154 ,923) (158 ,428)
UK S H O S S N O I(9 ) 21,861$ 21,257$ 22 ,306$ 23 ,658$ 22 ,139$ 22 ,736$ 21,452$ 21,744$
UK S H O S S N O I g ro wth -2 .8% 6.1% 2.7% 1.4% 1.9 %
S H O S S N O I(7 ) 154 ,411$ 159 ,539$ 153 ,696$ 162 ,206$ 173 ,021$ 179 ,921$ 176 ,375$ 180 ,172$
Le s s no n-C A S S N O I(8 ) (131,504) (135 ,579) (132 ,434) (139 ,406) (145 ,478) (150 ,413) (147 ,409) (150 ,111)
C A S H O S S N O I(9 ) 22 ,907$ 23 ,960$ 21,262$ 22 ,800$ 27 ,543$ 29 ,508$ 28 ,966$ 30 ,061$
C A S H O S S N O I g ro wth 4 .6% 7.2% 7.1% 3.8% 5 .7 %
N o te s :
T hre e m o n ths e nde d
(7 ) R e pre s e n ts S H O S S N O I a t We llto we r p ro ra ta o wne rs h ip .
(8 ) R e pre s e n ts p ro ra ta S S N O I de rive d o u ts ide the re fe re nc e d c o un try.
(9 ) R e pre s e n ts p ro ra ta S S N O I de rive d s o le ly fro m re fe re nc e d c o un try.
(1) R e pre s e n ts to ta l c o ns o lida te d N O I pe r U.S . G A A P whic h a g re e to o r a re de rive d fro m the re le va n t 10Q /K.
(2 ) R e pre s e n ts a m o un ts a t tribu ta b le to jo in t ve n tu re pa rtne rs , bo th m a jo rity a nd m ino rity.
(3 ) R e pre s e n ts to ta l N O I a t We llto we r p ro ra ta o wne rs h ip .
(4 ) R e pre s e n ts N O I a t tribu ta b le to N N N a nd O M .
(5 ) R e pre s e n ts S S S H O N O I a t We llto we r p ro ra ta o wne rs h ip .
(6 ) R e pre s e n ts ne t a d jus tm e n ts fo r no n-c a s h N O I o n S S p ro pe rt ie s , N O I a t tribu ta b le to no n-S S p ro pe rt ie s , c u rre nc y a nd o wne rs h ip a d jus tm e n ts ,
a nd no rm a lizing a d jus tm e n ts fo r S S p ro pe rt ie s de s c ribe d in the re le va n t qua rte r's E a rn ings S upp le m e n t.
SSNOI Growth Reconciliations
51
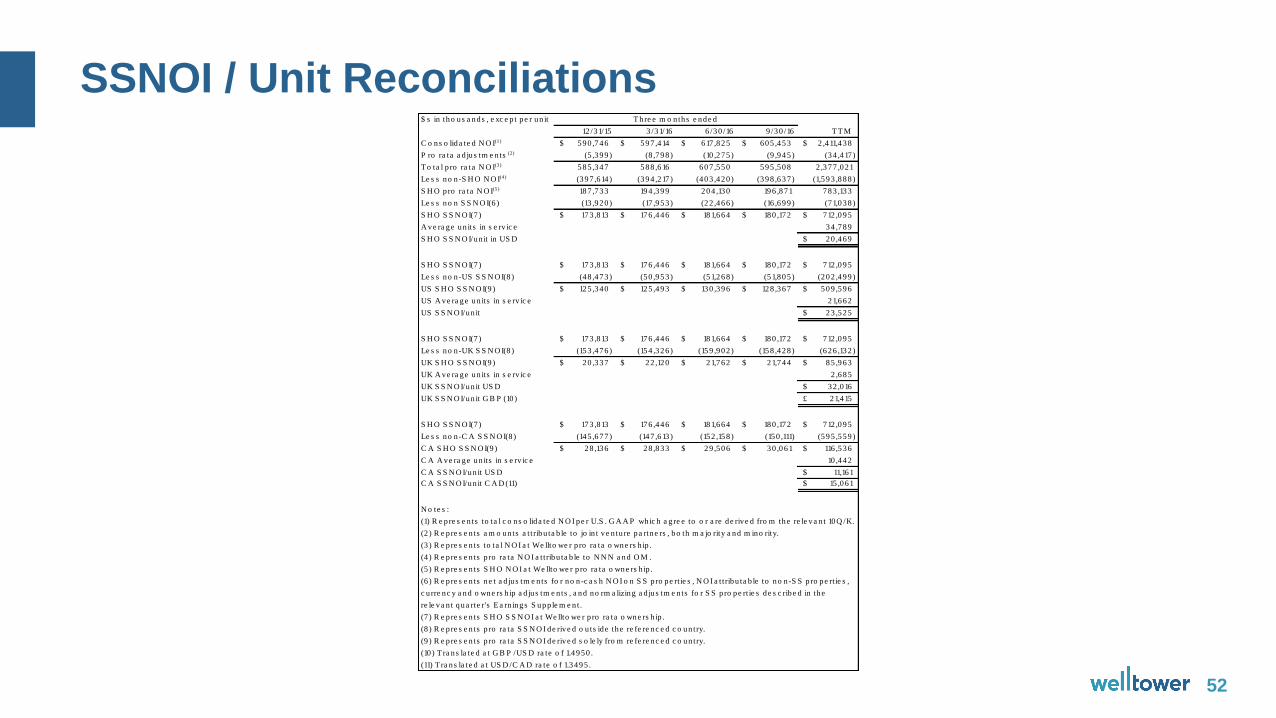
• SSNOI / Unit Reconciliations
$ s in tho us a nds , e xc e p t pe r un it
12 /31/15 3 /31/16 6 /30 /16 9 /30 /16 T T M
C o ns o lida te d N O I(1) 590 ,746$ 597 ,414$ 617 ,825$ 605 ,453$ 2 ,411,438$
P ro ra ta a d ju s tm e n ts (2) (5 ,399 ) (8 ,798 ) (10 ,275 ) (9 ,945 ) (34 ,417 )
T o ta l p ro ra ta N O I(3) 585 ,347 588 ,616 607 ,550 595 ,508 2 ,377 ,021
Le s s no n -S H O N O I(4) (397 ,614 ) (394 ,217 ) (403 ,420 ) (398 ,637 ) (1,593 ,888 )
S H O p ro ra ta N O I(5) 187 ,733 194 ,399 204 ,130 196 ,871 783 ,133
Le s s no n S S N O I(6 ) (13 ,920 ) (17 ,953 ) (22 ,466 ) (16 ,699 ) (71,038 )
S H O S S N O I(7 ) 173 ,813$ 176 ,446$ 181,664$ 180 ,172$ 712 ,095$
A ve ra ge un its in s e rv ic e 34 ,789
S H O S S N O I/un it in US D 20 ,469$
S H O S S N O I(7 ) 173 ,813$ 176 ,446$ 181,664$ 180 ,172$ 712 ,095$
Le s s no n -US S S N O I(8 ) (48 ,473 ) (50 ,953 ) (51,268 ) (51,805 ) (202 ,499 )
US S H O S S N O I(9 ) 125 ,340$ 125 ,493$ 130 ,396$ 128 ,367$ 509 ,596$
US A ve ra ge un its in s e rv ic e 21,662
US S S N O I/un it 23 ,525$
S H O S S N O I(7 ) 173 ,813$ 176 ,446$ 181,664$ 180 ,172$ 712 ,095$
Le s s no n -UK S S N O I(8 ) (153 ,476 ) (154 ,326 ) (159 ,902 ) (158 ,428 ) (626 ,132 )
UK S H O S S N O I(9 ) 20 ,337$ 22 ,120$ 21,762$ 21,744$ 85 ,963$
UK A ve ra ge un its in s e rv ic e 2 ,685
UK S S N O I/un it US D 32 ,016$
UK S S N O I/un it G B P (10 ) 21,415£
S H O S S N O I(7 ) 173 ,813$ 176 ,446$ 181,664$ 180 ,172$ 712 ,095$
Le s s no n -C A S S N O I(8 ) (145 ,677 ) (147 ,613 ) (152 ,158 ) (150 ,111) (595 ,559 )
C A S H O S S N O I(9 ) 28 ,136$ 28 ,833$ 29 ,506$ 30 ,061$ 116 ,536$
C A A ve ra ge un its in s e rv ic e 10 ,442
C A S S N O I/un it US D 11,161$
C A S S N O I/un it C A D (11) 15 ,061$
N o te s :
T h re e m o n ths e nde d
(7 ) R e p re s e n ts S H O S S N O I a t We llto we r p ro ra ta o wne rs h ip .
(8 ) R e p re s e n ts p ro ra ta S S N O I de rive d o u ts ide the re fe re nc e d c o un try.
(9 ) R e p re s e n ts p ro ra ta S S N O I de rive d s o le ly fro m re fe re nc e d c o un try.
(11) T ra ns la te d a t US D /C A D ra te o f 1.3495 .
(1) R e p re s e n ts to ta l c o ns o lida te d N O I pe r U.S . G A A P wh ic h a g re e to o r a re de rive d fro m the re le va n t 10Q /K.
(2 ) R e p re s e n ts a m o un ts a t t ribu ta b le to jo in t ve n tu re pa rtne rs , bo th m a jo rity a nd m ino rity.
(3 ) R e p re s e n ts to ta l N O I a t We llto we r p ro ra ta o wne rs h ip .
(4 ) R e p re s e n ts p ro ra ta N O I a t tribu ta b le to N N N a nd O M .
(5 ) R e p re s e n ts S H O N O I a t We llto we r p ro ra ta o wne rs h ip .
(6 ) R e p re s e n ts ne t a d ju s tm e n ts fo r no n -c a s h N O I o n S S p ro pe rt ie s , N O I a t tribu ta b le to no n -S S p ro pe rt ie s ,
c u rre nc y a nd o wne rs h ip a d ju s tm e n ts , a nd no rm a lizing a d ju s tm e n ts fo r S S p ro pe rt ie s de s c ribe d in the
re le va n t qua rte r's E a rn ings S upp le m e n t.
(10 ) T ra ns la te d a t G B P /US D ra te o f 1.4950 .
SSNOI / Unit Reconciliations
52
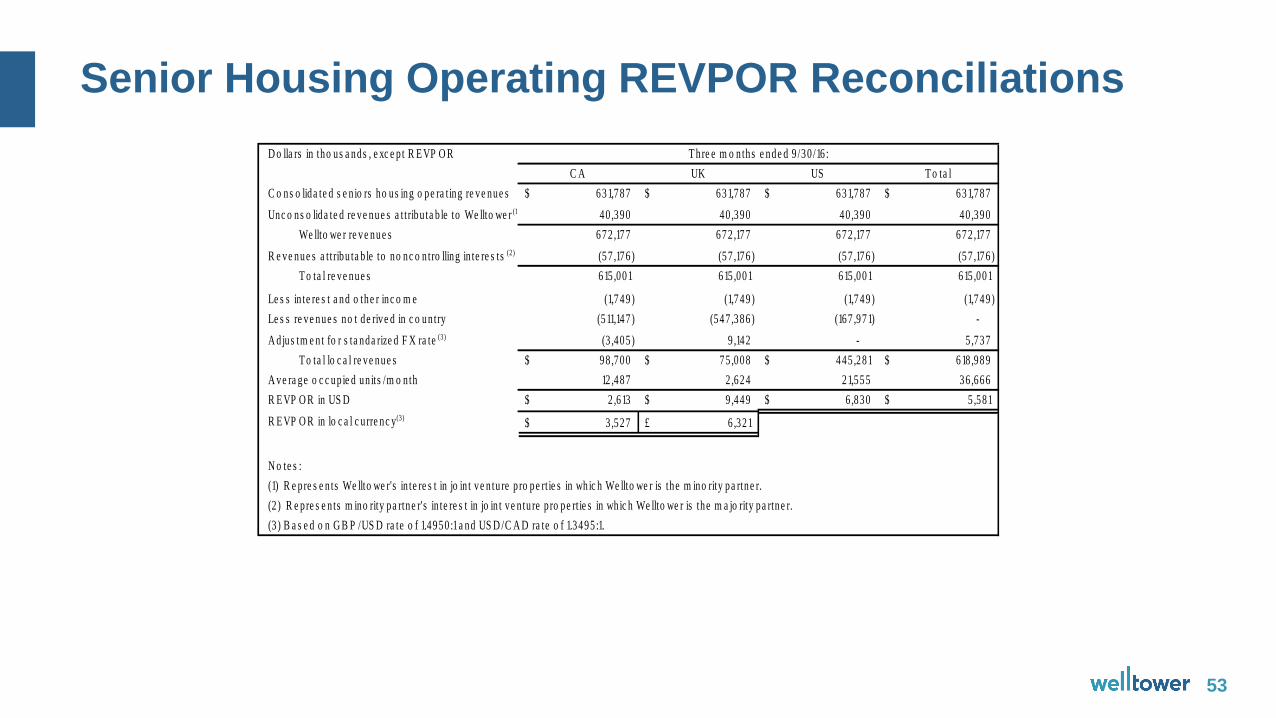
• Seniors Housing Operating REVPOR Reconciliations
D o lla rs in tho us a nds , e xc e p t R E VP O R
C A UK US T o ta l
C o ns o lida te d s e n io rs ho us ing o pe ra t ing re ve nue s 631,787$ 631,787$ 631,787$ 631,787$
Unc o ns o lida te d re ve nue s a t tribu ta b le to We llto we r (1) 40 ,390 40 ,390 40 ,390 40 ,390
We llto we r re ve nue s 672 ,177 672 ,177 672 ,177 672 ,177
R e ve nue s a t tribu ta b le to no nc o n tro lling in te re s ts (2) (57 ,176) (57 ,176) (57 ,176) (57 ,176)
T o ta l re ve nue s 615 ,001 615 ,001 615 ,001 615 ,001
Le s s in te re s t a nd o the r inc o m e (1,749) (1,749) (1,749) (1,749)
Le s s re ve nue s no t de rive d in c o un try (511,147) (547 ,386) (167 ,971) -
A d jus tm e n t fo r s ta nda rize d F X ra te (3) (3 ,405) 9 ,142 - 5 ,737
T o ta l lo c a l re ve nue s 98 ,700$ 75 ,008$ 445 ,281$ 618 ,989$
A ve ra ge o c c up ie d un its /m o n th 12 ,487 2 ,624 21,555 36 ,666
R E VP O R in US D 2,613$ 9 ,449$ 6 ,830$ 5 ,581$
R E VP O R in lo c a l c u rre nc y(3)3 ,527$ 6 ,321£
N o te s :
(1) R e pre s e n ts We llto we r's in te re s t in jo in t ve n tu re p ro pe rt ie s in wh ic h We llto we r is the m ino rity pa rtne r.
(2 ) R e pre s e n ts m ino rity pa rtne r's in te re s t in jo in t ve n tu re p ro pe rt ie s in wh ic h We llto we r is the m a jo rity pa rtne r.
(3 ) B a s e d o n G B P /US D ra te o f 1.4950 :1 a nd US D /C A D ra te o f 1.3495 :1.
T hre e m o n ths e nde d 9 /30 /16 :
Senior Housing Operating REVPOR Reconciliations
53
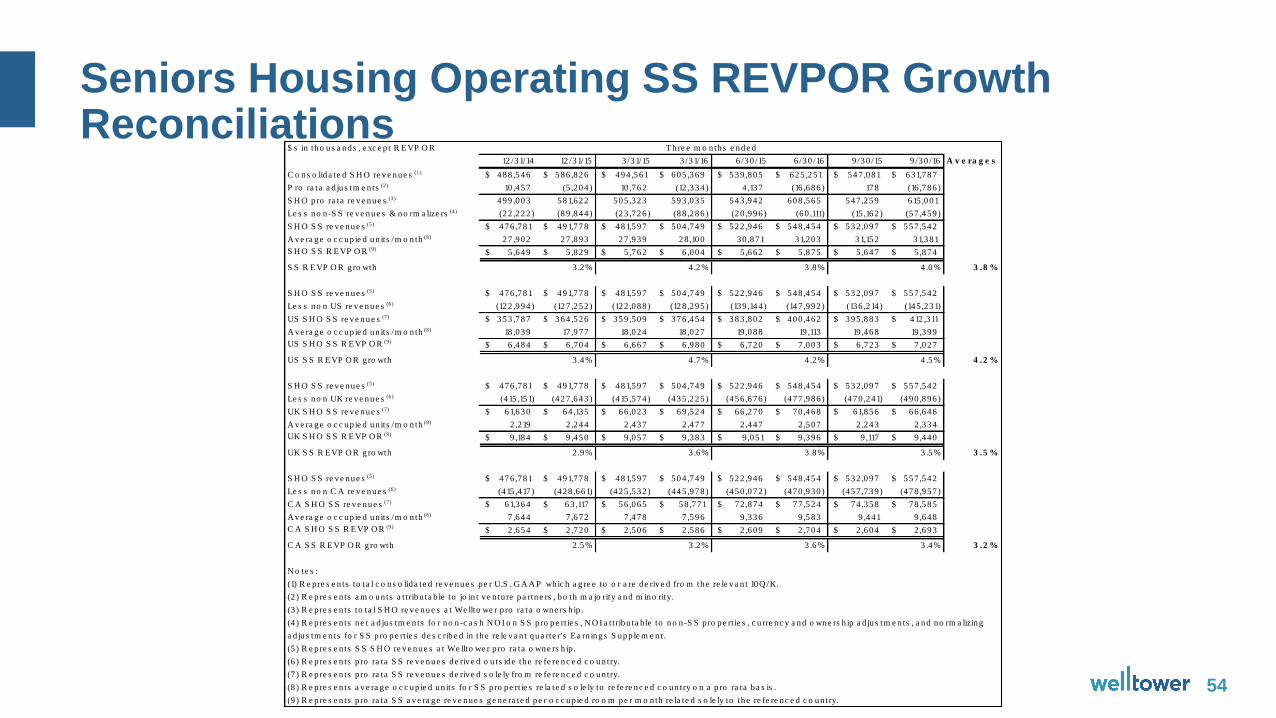
• Seniors Housing Operating SS REVPOR Growth Reconciliations
$ s in tho us a nds , e xc e p t R E VP O R
12 /31/14 12 /31/15 3 /31/15 3 /31/16 6 /30 /15 6 /30 /16 9 /30 /15 9 /30 /16 A v e ra g e s
C o ns o lida te d S H O re ve nue s (1) 488 ,546$ 586 ,826$ 494 ,561$ 605 ,369$ 539 ,805$ 625 ,251$ 547 ,081$ 631,787$
P ro ra ta a d ju s tm e n ts (2) 10 ,457 (5 ,204 ) 10 ,762 (12 ,334 ) 4 ,137 (16 ,686 ) 178 (16 ,786 )
S H O p ro ra ta re ve nue s (3) 499 ,003 581,622 505 ,323 593 ,035 543 ,942 608 ,565 547 ,259 615 ,001
Le s s no n -S S re ve nue s & no rm a lize rs (4) (22 ,222 ) (89 ,844 ) (23 ,726 ) (88 ,286 ) (20 ,996 ) (60 ,111) (15 ,162 ) (57 ,459 )
S H O S S re ve nue s (5) 476 ,781$ 491,778$ 481,597$ 504 ,749$ 522 ,946$ 548 ,454$ 532 ,097$ 557 ,542$
A ve ra ge o c c up ie d un its /m o n th (8) 27 ,902 27 ,893 27 ,939 28 ,100 30 ,871 31,203 31,152 31,381
S H O S S R E VP O R (9)5 ,649$ 5 ,829$ 5 ,762$ 6 ,004$ 5 ,662$ 5 ,875$ 5 ,647$ 5 ,874$
S S R E VP O R g ro wth 3 .2% 4 .2% 3 .8% 4 .0% 3 .8 %
S H O S S re ve nue s (5) 476 ,781$ 491,778$ 481,597$ 504 ,749$ 522 ,946$ 548 ,454$ 532 ,097$ 557 ,542$
Le s s no n US re ve nue s (6) (122 ,994 ) (127 ,252 ) (122 ,088 ) (128 ,295 ) (139 ,144 ) (147 ,992 ) (136 ,214 ) (145 ,231)
US S H O S S re ve nue s (7) 353 ,787$ 364 ,526$ 359 ,509$ 376 ,454$ 383 ,802$ 400 ,462$ 395 ,883$ 412 ,311$
A ve ra ge o c c up ie d un its /m o n th (8) 18 ,039 17 ,977 18 ,024 18 ,027 19 ,088 19 ,113 19 ,468 19 ,399
US S H O S S R E VP O R (9)6 ,484$ 6 ,704$ 6 ,667$ 6 ,980$ 6 ,720$ 7 ,003$ 6 ,723$ 7 ,027$
US S S R E VP O R g ro wth 3 .4% 4 .7% 4 .2% 4 .5% 4 .2 %
S H O S S re ve nue s (5) 476 ,781$ 491,778$ 481,597$ 504 ,749$ 522 ,946$ 548 ,454$ 532 ,097$ 557 ,542$
Le s s no n UK re ve nue s (6) (415 ,151) (427 ,643 ) (415 ,574 ) (435 ,225 ) (456 ,676 ) (477 ,986 ) (470 ,241) (490 ,896 )
UK S H O S S re ve nue s (7) 61,630$ 64 ,135$ 66 ,023$ 69 ,524$ 66 ,270$ 70 ,468$ 61,856$ 66 ,646$
A ve ra ge o c c up ie d un its /m o n th (8) 2 ,219 2 ,244 2 ,437 2 ,477 2 ,447 2 ,507 2 ,243 2 ,334
UK S H O S S R E VP O R (9)9 ,184$ 9 ,450$ 9 ,057$ 9 ,383$ 9 ,051$ 9 ,396$ 9 ,117$ 9 ,440$
UK S S R E VP O R g ro wth 2 .9% 3 .6% 3 .8% 3 .5% 3 .5 %
S H O S S re ve nue s (5) 476 ,781$ 491,778$ 481,597$ 504 ,749$ 522 ,946$ 548 ,454$ 532 ,097$ 557 ,542$
Le s s no n C A re ve nue s (6) (415 ,417 ) (428 ,661) (425 ,532 ) (445 ,978 ) (450 ,072 ) (470 ,930 ) (457 ,739 ) (478 ,957 )
C A S H O S S re ve nue s (7) 61,364$ 63 ,117$ 56 ,065$ 58 ,771$ 72 ,874$ 77 ,524$ 74 ,358$ 78 ,585$
A ve ra ge o c c up ie d un its /m o n th (8) 7 ,644 7 ,672 7 ,478 7 ,596 9 ,336 9 ,583 9 ,441 9 ,648
C A S H O S S R E VP O R (9)2 ,654$ 2 ,720$ 2 ,506$ 2 ,586$ 2 ,609$ 2 ,704$ 2 ,604$ 2 ,693$
C A S S R E VP O R g ro wth 2 .5% 3 .2% 3 .6% 3 .4% 3 .2 %
N o te s :
T h re e m o n ths e nde d
(4 ) R e p re s e n ts ne t a d ju s tm e n ts fo r no n -c a s h N O I o n S S p ro pe rt ie s , N O I a t tribu ta b le to no n -S S p ro pe rt ie s , c u rre nc y a nd o wne rs h ip a d ju s tm e n ts , a nd no rm a lizing
a d ju s tm e n ts fo r S S p ro pe rt ie s de s c ribe d in the re le va n t qua rte r's E a rn ings S upp le m e n t.
(1) R e p re s e n ts to ta l c o ns o lida te d re ve nue s pe r U.S . G A A P wh ic h a g re e to o r a re de rive d fro m the re le va n t 10Q /K.
(2 ) R e p re s e n ts a m o un ts a t t ribu ta b le to jo in t ve n tu re pa rtne rs , bo th m a jo rity a nd m ino rity.
(3 ) R e p re s e n ts to ta l S H O re ve nue s a t We llto we r p ro ra ta o wne rs h ip .
(5 ) R e p re s e n ts S S S H O re ve nue s a t We llto we r p ro ra ta o wne rs h ip .
(6 ) R e p re s e n ts p ro ra ta S S re ve nue s de rive d o u ts ide the re fe re nc e d c o un try.
(7 ) R e p re s e n ts p ro ra ta S S re ve nue s de rive d s o le ly fro m re fe re nc e d c o un try.
(8 ) R e p re s e n ts a ve ra ge o c c up ie d un its fo r S S p ro pe rt ie s re la te d s o le ly to re fe re nc e d c o un try o n a p ro ra ta ba s is .
(9 ) R e p re s e n ts p ro ra ta S S a ve ra ge re ve nue s ge ne ra te d pe r o c c up ie d ro o m pe r m o n th re la te d s o le ly to the re fe re nc e d c o un try.
Seniors Housing Operating SS REVPOR Growth Reconciliations
54
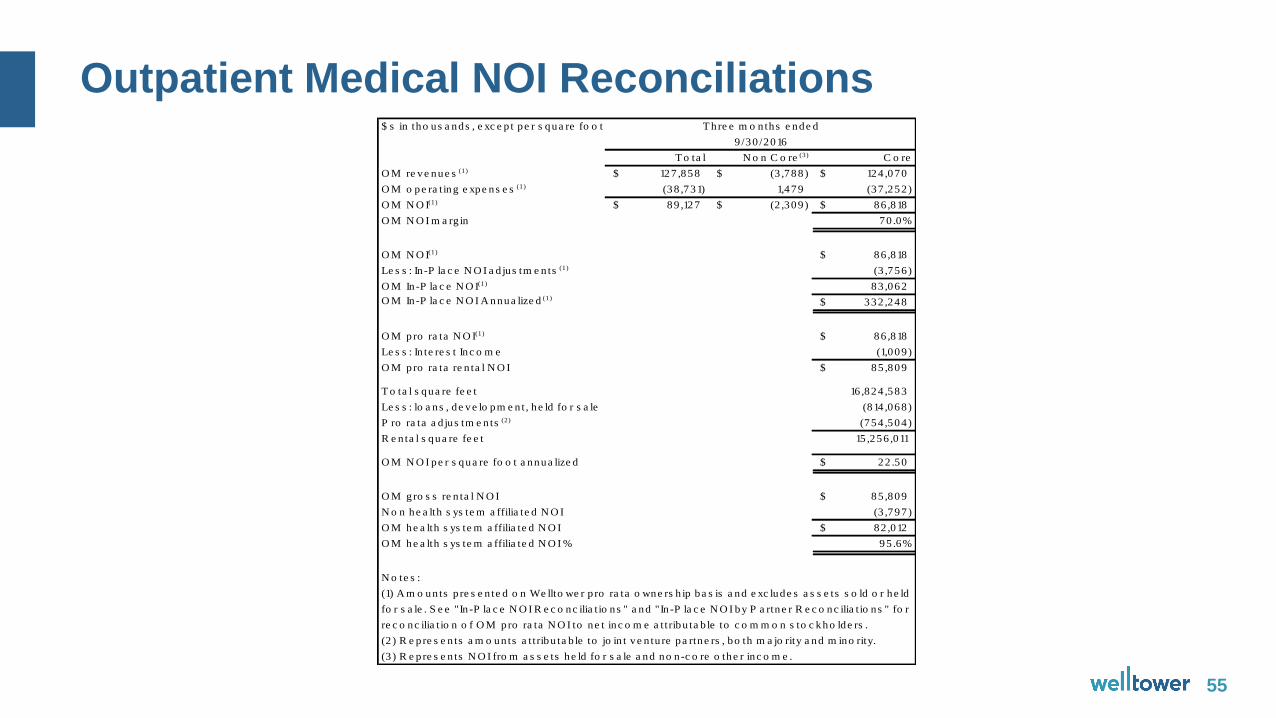
• Outpatient Medical NOI Reconciliations
$ s in tho us a nds , e xc e p t pe r s qua re fo o t
T o ta l N o n C o re (3) C o re
O M re ve nue s (1) 127 ,858$ (3 ,788)$ 124 ,070$
O M o pe ra ting e xpe ns e s (1) (38 ,731) 1,479 (37 ,252)
O M N O I(1) 89 ,127$ (2 ,309)$ 86 ,818$
O M N O I m a rg in 70 .0%
O M N O I(1) 86 ,818$
Le s s : In -P la c e N O I a d jus tm e n ts (1) (3 ,756)
O M In -P la c e N O I(1) 83 ,062
O M In -P la c e N O I A nnua lize d (1)332 ,248$
O M pro ra ta N O I(1) 86 ,818$
Le s s : In te re s t Inc o m e (1,009)
O M pro ra ta re n ta l N O I 85 ,809$
T o ta l s qua re fe e t 16 ,824 ,583
Le s s : lo a ns , de ve lo pm e n t, he ld fo r s a le (814 ,068)
P ro ra ta a d jus tm e n ts (2) (754 ,504)
R e n ta l s qua re fe e t 15 ,256 ,011
O M N O I pe r s qua re fo o t a nnua lize d 22 .50$
O M gro s s re n ta l N O I 85 ,809$
N o n he a lth s ys te m a ffilia te d N O I (3 ,797)
O M he a lth s ys te m a ffilia te d N O I 82 ,012$
O M he a lth s ys te m a ffilia te d N O I % 95 .6%
N o te s :
(1) A m o un ts p re s e n te d o n We llto we r p ro ra ta o wne rs h ip ba s is a nd e xc lude s a s s e ts s o ld o r he ld
fo r s a le . S e e "In -P la c e N O I R e c o nc ilia t io ns " a nd "In -P la c e N O I by P a rtne r R e c o nc ilia t io ns " fo r
re c o nc ilia t io n o f O M pro ra ta N O I to ne t inc o m e a t tribu ta b le to c o m m o n s to c kho lde rs .
(2 ) R e pre s e n ts a m o un ts a t tribu ta b le to jo in t ve n tu re pa rtne rs , bo th m a jo rity a nd m ino rity.
(3 ) R e pre s e n ts N O I fro m a s s e ts he ld fo r s a le a nd no n-c o re o the r inc o m e .
T hre e m o n ths e nde d
9 /30 /2016
Outpatient Medical NOI Reconciliations
55
• Normalized FFO & FAD
Historical cost accounting for real estate assets in accordance with U.S. GAAPimplicitly assumes that the value of real estate assets diminishes predictably overtime as evidenced by the provision for depreciation and amortization. However,since real estate values have historically risen or fallen with market conditions,many industry investors and analysts have considered presentations of operatingresults for real estate companies that use historical cost accounting to beinsufficient. In response, the National Association of Real Estate Investment Trusts(NAREIT) created FFO as a supplemental measure of operating performance forREITs that excludes historical cost depreciation from net income. FFO, as definedby NAREIT, means net income attributable to common stockholders, computed inaccordance with U.S. GAAP, excluding gains (or losses) from sales of real estateand impairments of depreciable assets, plus real estate depreciation andamortization, and after adjustments for unconsolidated entities and noncontrollinginterests. Normalized FFO represents FFO adjusted for certain items as detailedin the reconciliations. FAD represents FFO excluding net straight-line rentaladjustments, amortization related to above/below market leases and amortizationof non-cash interest expenses and less cash used to fund capital expenditures,tenant improvements and lease commissions. Normalized FAD represents FADadjusted for certain items detailed in the reconciliations.
Normalized FFO & FAD
56
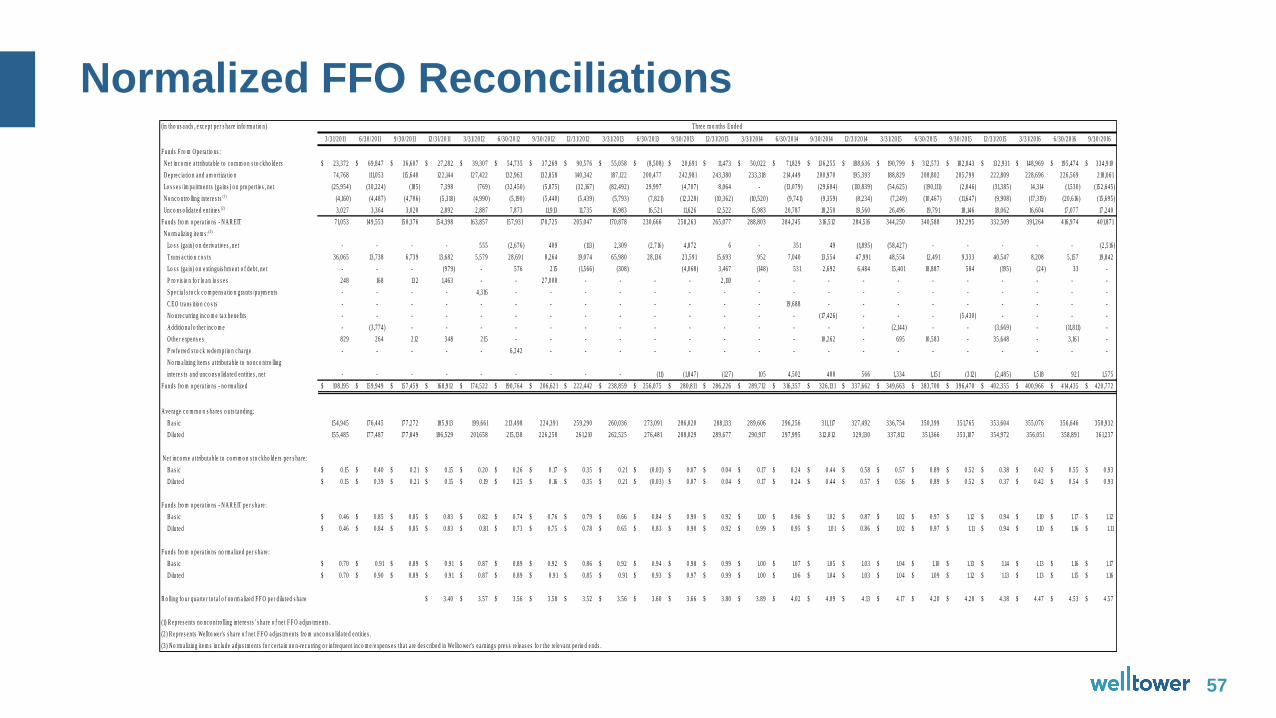
• Normalized FFO Reconciliations
(in tho us a nds , e xc e p t pe r s ha re in fo rm a tio n )
3 /31/2011 6 /30 /2011 9 /30 /2011 12 /31/2011 3 /31/2012 6 /30 /2012 9 /30 /2012 12 /31/2012 3 /31/2013 6 /30 /2013 9 /30 /2013 12 /31/2013 3 /31/2014 6 /30 /2014 9 /30 /2014 12 /31/2014 3 /31/2015 6 /30 /2015 9 /30 /2015 12 /31/2015 3 /31/2016 6 /30 /2016 9 /30 /2016
F unds F ro m O pe ra t io ns :
N e t inc o m e a t tribu ta b le to c o m m o n s to c kho lde rs 23 ,372$ 69 ,847$ 36 ,607$ 27 ,282$ 39 ,307$ 54 ,735$ 37 ,269$ 90 ,576$ 55 ,058$ (8 ,508 )$ 20 ,691$ 11,473$ 50 ,022$ 71,829$ 136 ,255$ 188 ,636$ 190 ,799$ 312 ,573$ 182 ,043$ 132 ,931$ 148 ,969$ 195 ,474$ 334 ,910$
D e p re c ia t io n a nd a m o rt iza t io n 74 ,768 111,053 115 ,640 122 ,144 127 ,422 132 ,963 132 ,858 140 ,342 187 ,122 200 ,477 242 ,981 243 ,380 233 ,318 214 ,449 200 ,970 195 ,393 188 ,829 208 ,802 205 ,799 222 ,809 228 ,696 226 ,569 218 ,061
Lo s s e s / im pa irm e n ts (ga in s ) o n p ro pe rt ie s , ne t (25 ,954 ) (30 ,224 ) (185 ) 7 ,398 (769 ) (32 ,450 ) (5 ,875 ) (32 ,167 ) (82 ,492 ) 29 ,997 (4 ,707 ) 8 ,064 - (13 ,079 ) (29 ,604 ) (110 ,839 ) (54 ,625 ) (190 ,111) (2 ,046 ) (31,385 ) 14 ,314 (1,530 ) (152 ,645 )
N o nc o n tro lling in te re s ts (1) (4 ,160 ) (4 ,487 ) (4 ,706 ) (5 ,318 ) (4 ,990 ) (5 ,190 ) (5 ,440 ) (5 ,439 ) (5 ,793 ) (7 ,821) (12 ,328 ) (10 ,362 ) (10 ,520 ) (9 ,741) (9 ,359 ) (8 ,234 ) (7 ,249 ) (10 ,467 ) (11,647 ) (9 ,908 ) (17 ,319 ) (20 ,616 ) (15 ,695 )
Unc o ns o lida te d e n tit ie s (2) 3 ,027 3 ,364 3 ,020 2 ,892 2 ,887 7 ,873 11,913 11,735 16 ,983 16 ,521 11,626 12 ,522 15 ,983 20 ,787 18 ,250 19 ,560 26 ,496 19 ,791 18 ,146 18 ,062 16 ,604 17 ,077 17 ,240
F unds fro m o pe ra t io ns - N A R E IT 71,053 149 ,553 150 ,376 154 ,398 163 ,857 157 ,931 170 ,725 205 ,047 170 ,878 230 ,666 258 ,263 265 ,077 288 ,803 284 ,245 316 ,512 284 ,516 344 ,250 340 ,588 392 ,295 332 ,509 391,264 416 ,974 401,871
N o rm a lizing ite m s :(3)
Lo s s (ga in ) o n de riva t ive s , ne t - - - - 555 (2 ,676 ) 409 (113 ) 2 ,309 (2 ,716 ) 4 ,872 6 - 3 5 1 49 (1,895 ) (58 ,427 ) - - - - - (2 ,516 )
T ra ns a c t io n c o s ts 36 ,065 13 ,738 6 ,739 13 ,682 5 ,579 28 ,691 8 ,264 19 ,074 65 ,980 28 ,136 23 ,591 15 ,693 9 5 2 7 ,040 13 ,554 47 ,991 48 ,554 12 ,491 9 ,333 40 ,547 8 ,208 5 ,157 19 ,842
Lo s s (ga in ) o n e xtingu is hm e n t o f de b t , ne t - - - (979 ) - 576 215 (1,566 ) (308 ) (4 ,068 ) 3 ,467 (148 ) 5 3 1 2 ,692 6 ,484 15 ,401 18 ,887 584 (195 ) (24 ) 33 -
P ro v is io n fo r lo a n lo s s e s 248 168 132 1,463 - - 27 ,008 - - - - 2 ,110 - - - - - - - - - - -
S pe c ia l s to c k c o m pe ns a t io n g ra n ts /pa ym e n ts - - - - 4 ,316 - - - - - - - - - - - - - - - - - -
C E O tra ns it io n c o s ts - - - - - - - - - - - - - 19 ,688 - - - - - - - - -
N o nre c u rring inc o m e ta x be ne fits - - - - - - - - - - - - - - (17 ,426 ) - - - (5 ,430 ) - - - -
A dd it io na l o the r inc o m e - (3 ,774 ) - - - - - - - - - - - - - - (2 ,144 ) - - (3 ,669 ) - (11,811) -
O the r e xpe ns e s 829 264 212 348 215 - - - - - - - - - 10 ,262 - 69 5 10 ,583 - 35 ,648 - 3 ,161 -
P re fe rre d s to c k re de m ptio n c ha rge - - - - - 6 ,242 - - - - - - - - - - - - - - - - -
N o rm a lizing ite m s a t tribu ta b le to no nc o n tro lling
in te re s ts a nd unc o ns o lida te d e n tit ie s , ne t - - - - - - - - - (11) (1,847 ) (127 ) 105 4 ,502 488 5 66 1,334 1,151 (312 ) (2 ,485 ) 1,518 9 2 1 1,575
F unds fro m o pe ra t io ns - no rm a lize d 108 ,195$ 159 ,949$ 157 ,459$ 168 ,912$ 174 ,522$ 190 ,764$ 206 ,621$ 222 ,442$ 238 ,859$ 256 ,075$ 280 ,811$ 286 ,226$ 289 ,712$ 316 ,357$ 326 ,131$ 337 ,662$ 349 ,663$ 383 ,700$ 396 ,470$ 402 ,355$ 400 ,966$ 414 ,435$ 420 ,772$
A ve ra ge c o m m o n s ha re s o u ts ta nd ing :
B a s ic 154 ,945 176 ,445 177 ,272 185 ,913 199 ,661 213 ,498 224 ,391 259 ,290 260 ,036 273 ,091 286 ,020 288 ,133 289 ,606 296 ,256 311,117 327 ,492 336 ,754 350 ,399 351,765 353 ,604 355 ,076 356 ,646 358 ,932
D ilu te d 155 ,485 177 ,487 177 ,849 186 ,529 201,658 215 ,138 226 ,258 261,210 262 ,525 276 ,481 288 ,029 289 ,677 290 ,917 297 ,995 312 ,812 329 ,130 337 ,812 351,366 353 ,107 354 ,972 356 ,051 358 ,891 361,237
N e t inc o m e a t tribu ta b le to c o m m o n s to c kho lde rs pe r s ha re :
B a s ic 0 .15$ 0 .40$ 0 .21$ 0 .15$ 0 .20$ 0 .26$ 0 .17$ 0 .35$ 0 .21$ (0 .03 )$ 0 .07$ 0 .04$ 0 .17$ 0 .24$ 0 .44$ 0 .58$ 0 .57$ 0 .89$ 0 .52$ 0 .38$ 0 .42$ 0 .55$ 0 .93$
D ilu te d 0 .15$ 0 .39$ 0 .21$ 0 .15$ 0 .19$ 0 .25$ 0 .16$ 0 .35$ 0 .21$ (0 .03 )$ 0 .07$ 0 .04$ 0 .17$ 0 .24$ 0 .44$ 0 .57$ 0 .56$ 0 .89$ 0 .52$ 0 .37$ 0 .42$ 0 .54$ 0 .93$
F unds fro m o pe ra t io ns - N A R E IT pe r s ha re :
B a s ic 0 .46$ 0 .85$ 0 .85$ 0 .83$ 0 .82$ 0 .74$ 0 .76$ 0 .79$ 0 .66$ 0 .84$ 0 .90$ 0 .92$ 1.00$ 0 .96$ 1.02$ 0 .87$ 1.02$ 0 .97$ 1.12$ 0 .94$ 1.10$ 1.17$ 1.12$
D ilu te d 0 .46$ 0 .84$ 0 .85$ 0 .83$ 0 .81$ 0 .73$ 0 .75$ 0 .78$ 0 .65$ 0 .83$ 0 .90$ 0 .92$ 0 .99$ 0 .95$ 1.01$ 0 .86$ 1.02$ 0 .97$ 1.11$ 0 .94$ 1.10$ 1.16$ 1.11$
F unds fro m o pe ra t io ns no rm a lize d pe r s ha re :
B a s ic 0 .70$ 0 .91$ 0 .89$ 0 .91$ 0 .87$ 0 .89$ 0 .92$ 0 .86$ 0 .92$ 0 .94$ 0 .98$ 0 .99$ 1.00$ 1.07$ 1.05$ 1.03$ 1.04$ 1.10$ 1.13$ 1.14$ 1.13$ 1.16$ 1.17$
D ilu te d 0 .70$ 0 .90$ 0 .89$ 0 .91$ 0 .87$ 0 .89$ 0 .91$ 0 .85$ 0 .91$ 0 .93$ 0 .97$ 0 .99$ 1.00$ 1.06$ 1.04$ 1.03$ 1.04$ 1.09$ 1.12$ 1.13$ 1.13$ 1.15$ 1.16$
R o lling fo u r qua rte r to ta l o f no rm a lize d F F O pe r d ilu te d s ha re 3 .40$ 3 .57$ 3 .56$ 3 .58$ 3 .52$ 3 .56$ 3 .60$ 3 .66$ 3 .80$ 3 .89$ 4 .02$ 4 .09$ 4 .13$ 4 .17$ 4 .20$ 4 .28$ 4 .38$ 4 .47$ 4 .53$ 4 .57$
(1) R e p re s e n ts no nc o n tro lling in te re s ts ' s ha re o f ne t F F O a d ju s tm e n ts .
(2 ) R e p re s e n ts We llto we r's s ha re o f ne t F F O a d ju s tm e n ts fro m unc o ns o lida te d e n tit ie s .
T h re e m o n ths E nde d
(3 ) N o rm a lizing ite m s inc lude a d ju s tm e n ts fo r c e rta in no n -re c u rring o r in fre que n t inc o m e /e xpe ns e s tha t a re de s c ribe d in We llto we r's e a rn ings p re s s re le a s e s fo r the re le va n t pe rio d e nds .
Normalized FFO Reconciliations
57
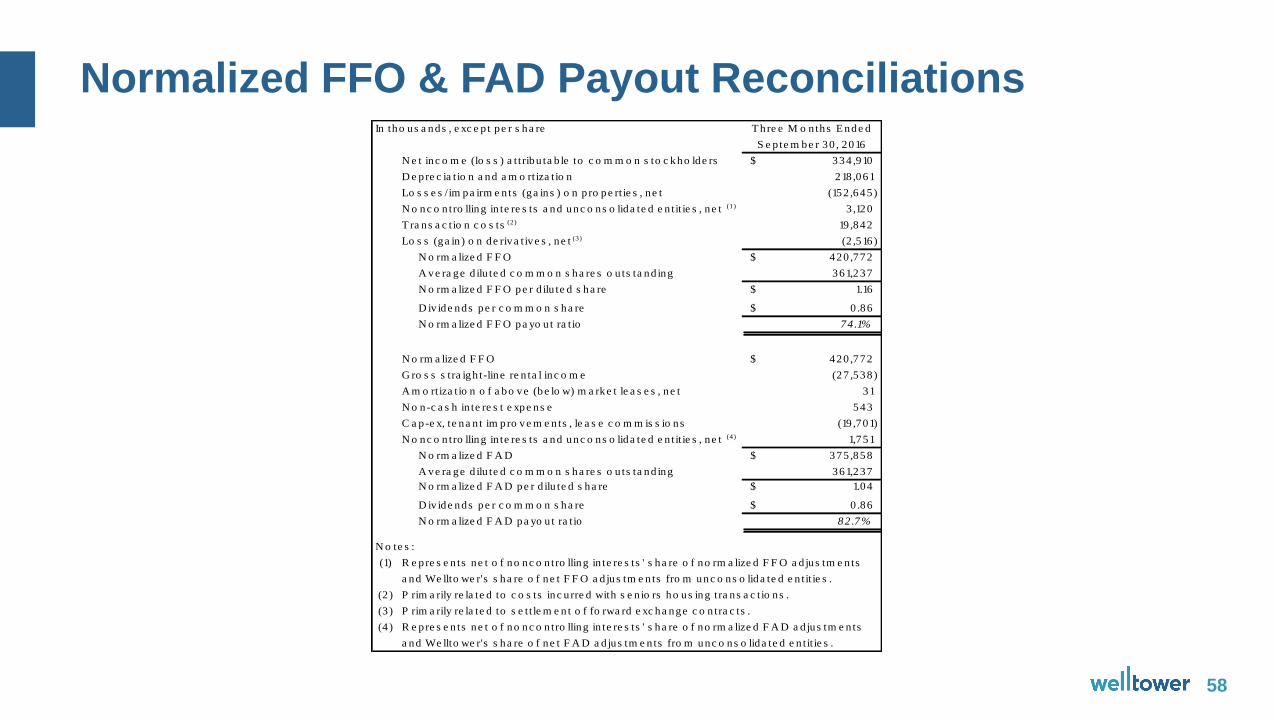
• Normalized FFO & FAD Payout Reconciliations
In tho us a nds , e xc e p t pe r s ha re T hre e M o nths E nde d
S e p te m be r 30 , 2016
N e t inc o m e (lo s s ) a t tribu ta b le to c o m m o n s to c kho lde rs 334 ,910$
D e pre c ia t io n a nd a m o rtiza t io n 218 ,061
Lo s s e s / im pa irm e n ts (ga ins ) o n p ro pe rt ie s , ne t (152 ,645)
N o nc o n tro lling in te re s ts a nd unc o ns o lida te d e n tit ie s , ne t (1) 3 ,120
T ra ns a c tio n c o s ts (2) 19 ,842
Lo s s (ga in ) o n de riva tive s , ne t (3) (2 ,516)
N o rm a lize d F F O 420 ,772$
A ve ra ge d ilu te d c o m m o n s ha re s o u ts ta nd ing 361,237
N o rm a lize d F F O pe r d ilu te d s ha re 1.16$
D iv ide nds pe r c o m m o n s ha re 0 .86$
N o rm a lize d F F O pa yo u t ra t io 74 .1%
N o rm a lize d F F O 420 ,772$
G ro s s s tra igh t-line re n ta l inc o m e (27 ,538)
A m o rtiza t io n o f a bo ve (be lo w) m a rke t le a s e s , ne t 31
N o n-c a s h in te re s t e xpe ns e 543
C a p-e x, te na n t im pro ve m e n ts , le a s e c o m m is s io ns (19 ,701)
N o nc o n tro lling in te re s ts a nd unc o ns o lida te d e n tit ie s , ne t (4) 1,751
N o rm a lize d F A D 375 ,858$
A ve ra ge d ilu te d c o m m o n s ha re s o u ts ta nd ing 361,237
N o rm a lize d F A D pe r d ilu te d s ha re 1.04$
D iv ide nds pe r c o m m o n s ha re 0 .86$
N o rm a lize d F A D pa yo u t ra t io 82 .7%
N o te s :
(1)
(2 )
(3 )
(4 ) R e pre s e n ts ne t o f no nc o n tro lling in te re s ts ' s ha re o f no rm a lize d F A D a d jus tm e n ts
a nd We llto we r's s ha re o f ne t F A D a d jus tm e n ts fro m unc o ns o lida te d e n tit ie s .
R e pre s e n ts ne t o f no nc o n tro lling in te re s ts ' s ha re o f no rm a lize d F F O a d jus tm e n ts
a nd We llto we r's s ha re o f ne t F F O a d jus tm e n ts fro m unc o ns o lida te d e n tit ie s .
P rim a rily re la te d to c o s ts inc u rre d with s e n io rs ho us ing tra ns a c tio ns .
P rim a rily re la te d to s e t t le m e n t o f fo rwa rd e xc ha nge c o n tra c ts .
Normalized FFO & FAD Payout Reconciliations
58
• EBITDA and Adjusted EBITDA
EBITDA stands for earnings (net income per income statement) before interest expense, incometaxes, depreciation and amortization. Covenants in our primary line of credit arrangement, seniorunsecured notes and Canadian denominated term loan contain financial ratios based on adefinition of EBITDA that is specific to those agreements. Failure to satisfy these covenants couldresult in an event of default that could have a material adverse impact on our cost and availabilityof capital, which could in turn have a material adverse impact on our consolidated results ofoperations, liquidity and/or financial condition. Due to the materiality of these debt agreements andthe financial covenants, we have defined Adjusted EBITDA (A-EBITDA) to include adjustments forstock-based compensation expense, provision for loan losses, gains/losses on extinguishment ofdebt, transactions costs, gains/losses/impairments on properties, gains/losses on derivatives, andother non-recurring and/or non-cash income/charges.
We believe that EBITDA and A-EBITDA, along with net income and cash flow provided fromoperating activities, are important supplemental measures because they provide additionalinformation to assess and evaluate the performance of our operations. We primarily utilize EBITDAand A-EBITDA to measure our interest coverage ratio, which represents EBITDA or A-EBITDAdivided by total interest, and our fixed charge coverage ratio, which represents EBITDA or A-EBITDA divided by fixed charges. Fixed charges include total interest, secured debt principalamortization and preferred dividends.
EBITDA and Adjusted EBITDA
59
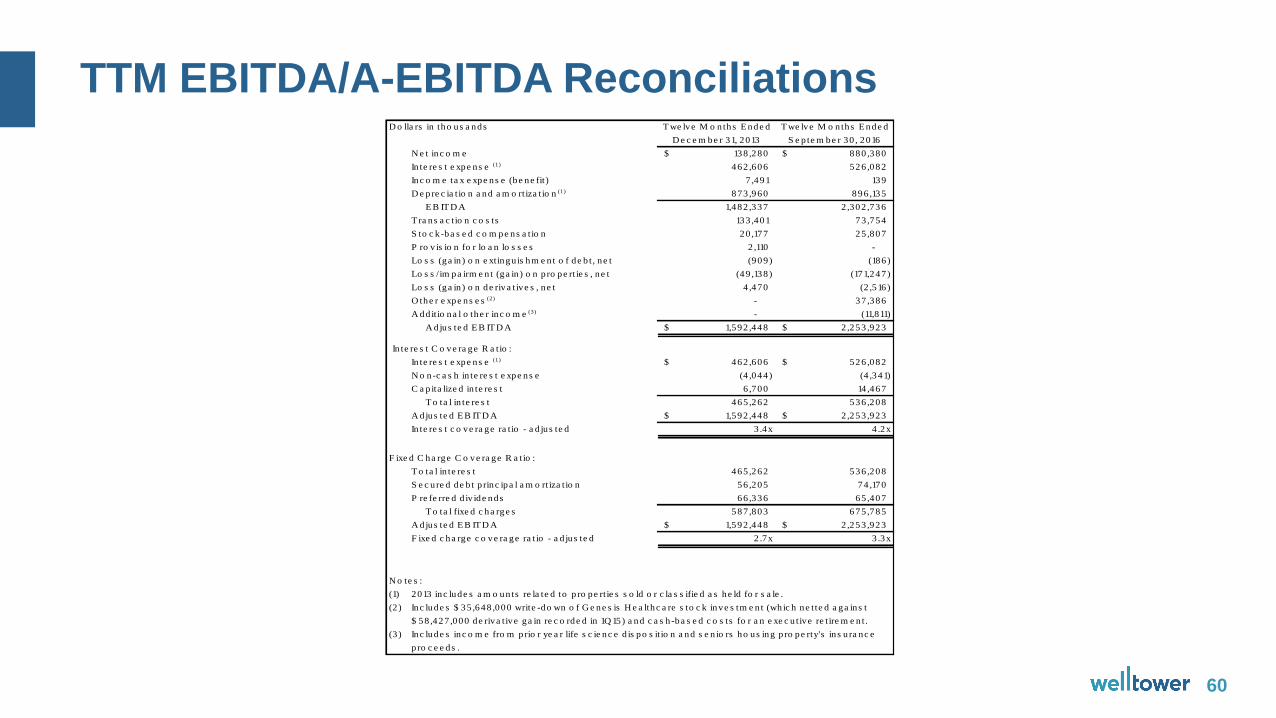
• TTM EBITDA/A-EBITDA Reconciliations
D o lla rs in tho us a nds T we lve M o nths E nde d T we lve M o nths E nde d
D e c e m be r 31, 2013 S e p te m be r 30 , 2016
N e t inc o m e 138 ,280$ 880 ,380$
In te re s t e xpe ns e (1) 462 ,606 526 ,082
Inc o m e ta x e xpe ns e (be ne fit) 7 ,491 139
D e pre c ia t io n a nd a m o rtiza t io n (1) 873 ,960 896 ,135
E B IT D A 1,482 ,337 2 ,302 ,736
T ra ns a c tio n c o s ts 133 ,401 73 ,754
S to c k -ba s e d c o m pe ns a tio n 20 ,177 25 ,807
P ro v is io n fo r lo a n lo s s e s 2 ,110 -
Lo s s (ga in ) o n e xtingu is hm e n t o f de b t , ne t (909) (186)
Lo s s / im pa irm e n t (ga in ) o n p ro pe rt ie s , ne t (49 ,138) (171,247)
Lo s s (ga in ) o n de riva tive s , ne t 4 ,470 (2 ,516)
O the r e xpe ns e s (2) - 37 ,386
A dd it io na l o the r inc o m e (3) - (11,811)
A d jus te d E B IT D A 1,592 ,448$ 2 ,253 ,923$
In te re s t C o ve ra ge R a tio :
In te re s t e xpe ns e (1) 462 ,606$ 526 ,082$
N o n-c a s h in te re s t e xpe ns e (4 ,044) (4 ,341)
C a p ita lize d in te re s t 6 ,700 14 ,467
T o ta l in te re s t 465 ,262 536 ,208
A d jus te d E B IT D A 1,592 ,448$ 2 ,253 ,923$
In te re s t c o ve ra ge ra t io - a d jus te d 3 .4x 4 .2x
F ixe d C ha rge C o ve ra ge R a tio :
T o ta l in te re s t 465 ,262 536 ,208
S e c u re d de b t p rinc ipa l a m o rtiza t io n 56 ,205 74 ,170
P re fe rre d d iv ide nds 66 ,336 65 ,407
T o ta l fixe d c ha rge s 587 ,803 675 ,785
A d jus te d E B IT D A 1,592 ,448$ 2 ,253 ,923$
F ixe d c ha rge c o ve ra ge ra t io - a d jus te d 2 .7x 3 .3x
N o te s :
(1) 2013 inc lude s a m o un ts re la te d to p ro pe rt ie s s o ld o r c la s s ifie d a s he ld fo r s a le .
(2 )
(3 ) Inc lude s inc o m e fro m p rio r ye a r life s c ie nc e d is po s it io n a nd s e n io rs ho us ing p ro pe rty's in s u ra nc e
p ro c e e ds .
Inc lude s $ 35 ,648 ,000 write -do wn o f G e ne s is H e a lthc a re s to c k inve s tm e n t (wh ic h ne tte d a ga ins t
$ 58 ,427 ,000 de riva tive ga in re c o rde d in 1Q 15) a nd c a s h -ba s e d c o s ts fo r a n e xe c u tive re t ire m e n t.
TTM EBITDA/A-EBITDA Reconciliations
60
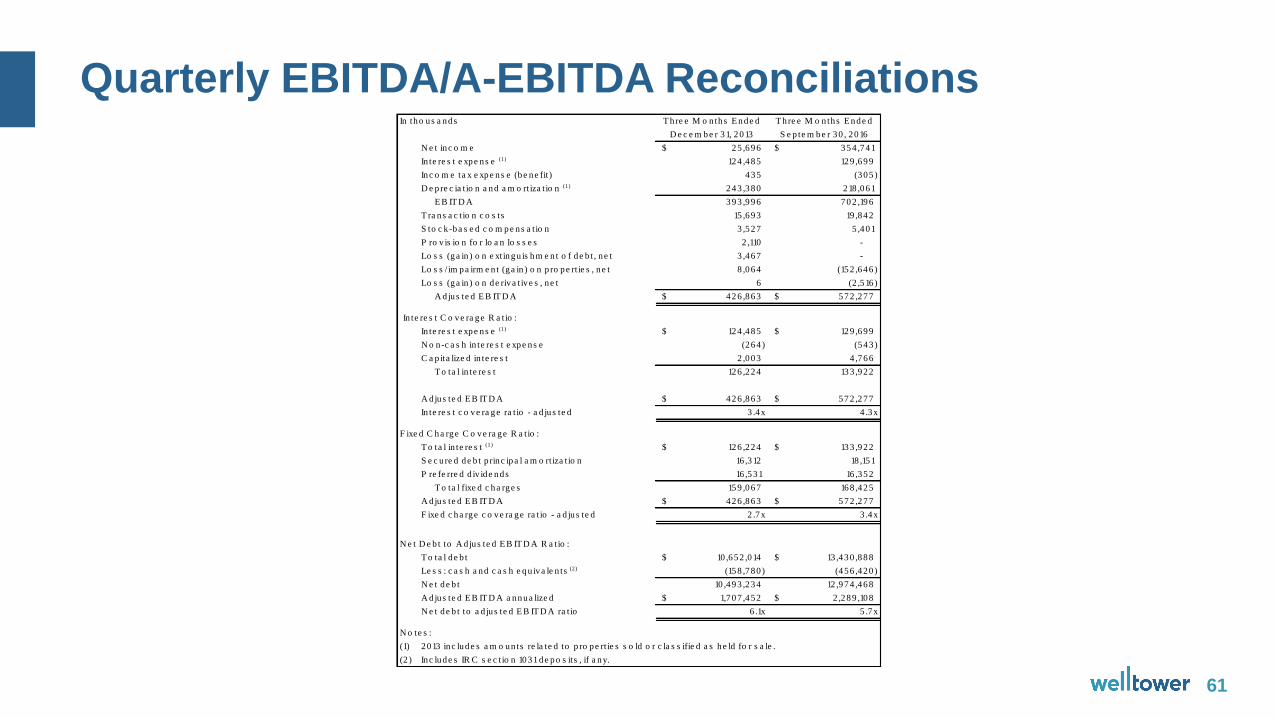
• Quarterly EBITDA/A-EBITDA Reconciliations
In tho us a nds T hre e M o n ths E nde d T hre e M o n ths E nde d
D e c e m be r 31, 2013 S e p te m be r 30 , 2016
N e t inc o m e 25 ,696$ 354 ,741$
In te re s t e xpe ns e (1) 124 ,485 129 ,699
Inc o m e ta x e xpe ns e (be ne fit ) 435 (305 )
D e p re c ia t io n a nd a m o rt iza t io n (1) 243 ,380 218 ,061
E B IT D A 393 ,996 702 ,196
T ra ns a c t io n c o s ts 15 ,693 19 ,842
S to c k -ba s e d c o m pe ns a t io n 3 ,527 5 ,401
P ro v is io n fo r lo a n lo s s e s 2 ,110 -
Lo s s (ga in ) o n e xtingu is hm e n t o f de b t , ne t 3 ,467 -
Lo s s / im pa irm e n t (ga in ) o n p ro pe rt ie s , ne t 8 ,064 (152 ,646 )
Lo s s (ga in ) o n de riva t ive s , ne t 6 (2 ,516 )
A d jus te d E B IT D A 426 ,863$ 572 ,277$
In te re s t C o ve ra ge R a tio :
In te re s t e xpe ns e (1) 124 ,485$ 129 ,699$
N o n-c a s h in te re s t e xpe ns e (264 ) (543 )
C a p ita lize d in te re s t 2 ,003 4 ,766
T o ta l in te re s t 126 ,224 133 ,922
A d jus te d E B IT D A 426 ,863$ 572 ,277$
In te re s t c o ve ra ge ra t io - a d ju s te d 3 .4x 4 .3x
F ixe d C ha rge C o ve ra ge R a tio :
T o ta l in te re s t (1) 126 ,224$ 133 ,922$
S e c u re d de b t p rinc ipa l a m o rt iza t io n 16 ,312 18 ,151
P re fe rre d d iv ide nds 16 ,531 16 ,352
T o ta l fixe d c ha rge s 159 ,067 168 ,425
A d jus te d E B IT D A 426 ,863$ 572 ,277$
F ixe d c ha rge c o ve ra ge ra t io - a d ju s te d 2 .7x 3 .4x
N e t D e b t to A d jus te d E B IT D A R a tio :
T o ta l de b t 10 ,652 ,014$ 13 ,430 ,888$
Le s s : c a s h a nd c a s h e qu iva le n ts (2) (158 ,780 ) (456 ,420 )
N e t de b t 10 ,493 ,234 12 ,974 ,468
A d jus te d E B IT D A a nnua lize d 1,707 ,452$ 2 ,289 ,108$
N e t de b t to a d ju s te d E B IT D A ra t io 6 .1x 5 .7x
N o te s :
(1) 2013 inc lude s a m o un ts re la te d to p ro pe rt ie s s o ld o r c la s s ifie d a s he ld fo r s a le .
(2 ) Inc lude s IR C s e c t io n 1031 de po s its , if a ny.
Quarterly EBITDA/A-EBITDA Reconciliations
61
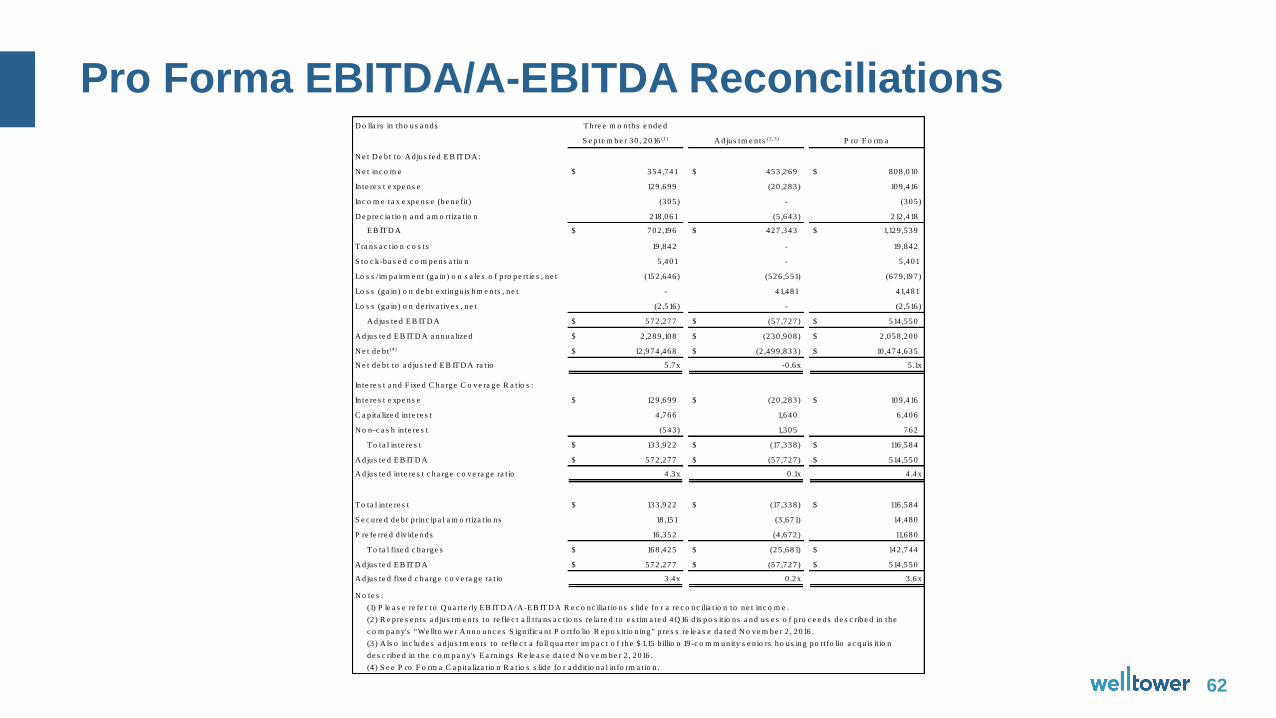
• Pro Forma EBITDA/A-EBITDA Reconciliations
D o lla rs in tho us a nds
$ 354 ,741 $ 453 ,269 $ 808 ,010
129 ,699 (20 ,283 ) 109 ,416
(305 ) - (305 )
218 ,061 (5 ,643 ) 212 ,418
E B IT D A $ 702 ,196 $ 427 ,343 $ 1,129 ,539
19 ,842 - 19 ,842
5 ,401 - 5 ,401
(152 ,646 ) (526 ,551) (679 ,197 )
- 41,481 41,481
(2 ,516 ) - (2 ,516 )
A d jus te d E B IT D A $ 572 ,277 $ (57 ,727 ) $ 514 ,550
$ 2 ,289 ,108 $ (230 ,908 ) $ 2 ,058 ,200
$ 12 ,974 ,468 $ (2 ,499 ,833 ) $ 10 ,474 ,635
5 .7x -0 .6x 5 .1x
$ 129 ,699 $ (20 ,283 ) $ 109 ,416
4 ,766 1,640 6 ,406
(543 ) 1,305 762
T o ta l in te re s t $ 133 ,922 $ (17 ,338 ) $ 116 ,584
$ 572 ,277 $ (57 ,727 ) $ 514 ,550
4 .3x 0 .1x 4 .4x
$ 133 ,922 $ (17 ,338 ) $ 116 ,584
18 ,151 (3 ,671) 14 ,480
16 ,352 (4 ,672 ) 11,680
T o ta l fixe d c ha rge s $ 168 ,425 $ (25 ,681) $ 142 ,744
$ 572 ,277 $ (57 ,727 ) $ 514 ,550
3 .4x 0 .2x 3 .6x
T hre e m o n ths e nde d
A djus te d fixe d c ha rge c o ve ra ge ra t io
N o te s :
(1) P le a s e re fe r to Q ua rte rly E B IT D A /A -E B IT D A R e c o nc ilia t io ns s lide fo r a re c o nc ilia t io n to ne t inc o m e .
(2 ) R e p re s e n ts a d ju s tm e n ts to re fle c t a ll t ra n s a c t io ns re la te d to e s t im a te d 4Q 16 d is po s it io ns a nd u s e s o f p ro c e e ds de s c ribe d in the
c o m pa ny's "We llto we r A nno unc e s S ign ific a n t P o rtfo lio R e po s it io n ing" p re s s re le a s e da te d N o ve m be r 2 , 2016 .
(3 ) A ls o inc lude s a d ju s tm e n ts to re fle c t a fu ll qua rte r im pa c t o f the $ 1.15 b illio n 19 -c o m m unity s e n io rs ho us ing po rtfo lio a c qu is it io n
de s c ribe d in the c o m pa ny's E a rn ings R e le a s e da te d N o ve m be r 2 , 2016 .
(4 ) S e e P ro F o rm a C a p ita liza t io n R a tio s s lide fo r a dd it io na l in fo rm a tio n .
A d jus te d E B IT D A
A djus te d in te re s t c ha rge c o ve ra ge ra t io
T o ta l in te re s t
S e c u re d de b t p rinc ipa l a m o rt iza t io ns
P re fe rre d d iv ide nds
A d jus te d E B IT D A
N e t de b t to a d ju s te d E B IT D A ra t io
In te re s t a nd F ixe d C ha rge C o ve ra ge R a tio s :
In te re s t e xpe ns e
C a p ita lize d in te re s t
N o n-c a s h in te re s t
S to c k -ba s e d c o m pe ns a t io n
Lo s s / im pa irm e n t (ga in ) o n s a le s o f p ro pe rt ie s , ne t
Lo s s (ga in ) o n de b t e xt ingu is hm e n ts , ne t
Lo s s (ga in ) o n de riva t ive s , ne t
A d jus te d E B IT D A a nnua lize d
N e t de b t (4)
N e t D e b t to A d jus te d E B IT D A :
N e t inc o m e
In te re s t e xpe ns e
Inc o m e ta x e xpe ns e (be ne fit)
D e p re c ia t io n a nd a m o rt iza t io n
T ra ns a c t io n c o s ts
S e p te m be r 30 , 2016 (1) A djus tm e n ts (2, 3) P ro F o rm a
Pro Forma EBITDA/A-EBITDA Reconciliations
62
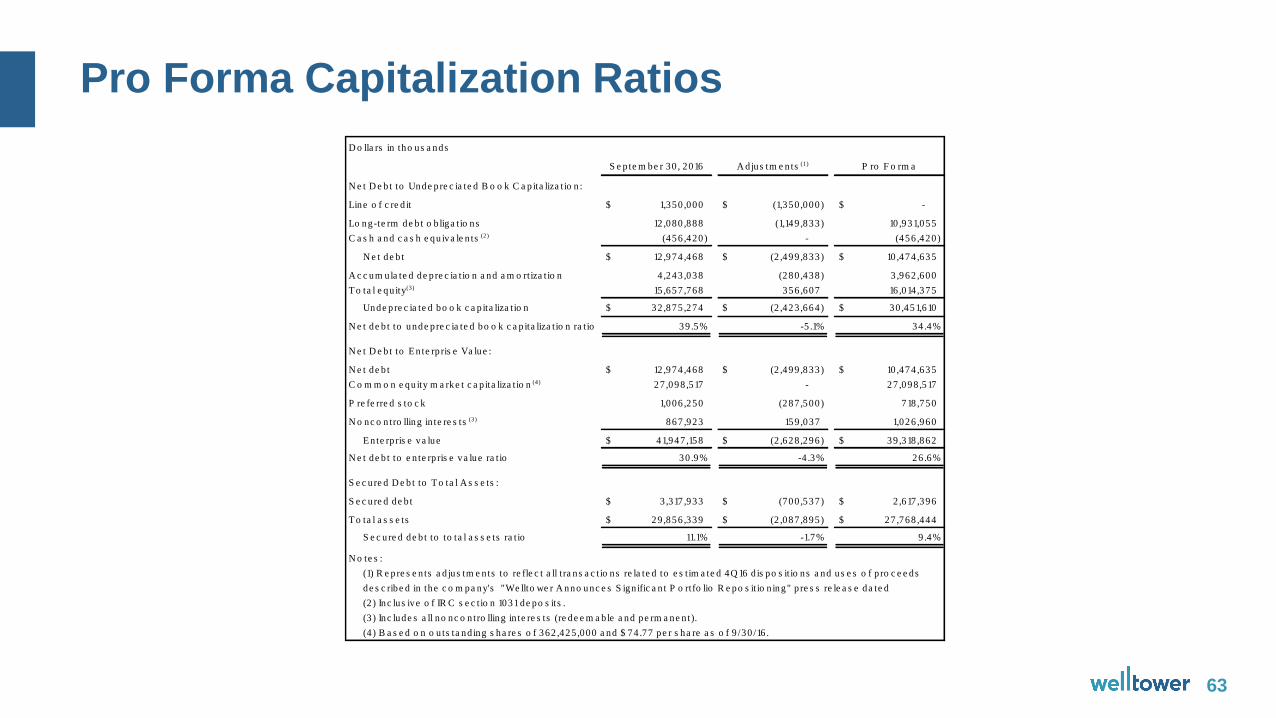
• Pro Forma Capitalization Ratios
$ 1,350 ,000 $ (1,350 ,000) $ -
12 ,080 ,888 (1,149 ,833) 10 ,931,055
(456 ,420) - (456 ,420)
N e t de b t $ 12 ,974 ,468 $ (2 ,499 ,833) $ 10 ,474 ,635
4 ,243 ,038 (280 ,438) 3 ,962 ,600
15 ,657 ,768 356 ,607 16 ,014 ,375
Unde pre c ia te d bo o k c a p ita liza t io n $ 32 ,875 ,274 $ (2 ,423 ,664) $ 30 ,451,610
39 .5% -5 .1% 34 .4%
$ 12 ,974 ,468 $ (2 ,499 ,833) $ 10 ,474 ,635
27 ,098 ,517 - 27 ,098 ,517
1,006 ,250 (287 ,500) 718 ,750
867 ,923 159 ,037 1,026 ,960
E n te rp ris e va lue $ 41,947 ,158 $ (2 ,628 ,296) $ 39 ,318 ,862
30 .9% -4 .3% 26 .6%
$ 3 ,317 ,933 $ (700 ,537) $ 2 ,617 ,396
$ 29 ,856 ,339 $ (2 ,087 ,895) $ 27 ,768 ,444
S e c u re d de b t to to ta l a s s e ts ra t io 11.1% -1.7% 9.4%
D o lla rs in tho us a nds
S e p te m be r 30 , 2016 A djus tm e n ts (1) P ro F o rm a
P re fe rre d s to c k
N e t D e b t to Unde pre c ia te d B o o k C a p ita liza t io n :
Line o f c re d it
Lo ng-te rm de b t o b liga tio ns
C a s h a nd c a s h e qu iva le n ts (2)
A c c um ula te d de p re c ia t io n a nd a m o rtiza t io n
T o ta l e qu ity(3)
N e t de b t to unde pre c ia te d bo o k c a p ita liza t io n ra t io
N e t D e b t to E n te rp ris e Va lue :
N e t de b t
C o m m o n e qu ity m a rke t c a p ita liza t io n (4)
(1) R e pre s e n ts a d jus tm e n ts to re fle c t a ll t ra ns a c tio ns re la te d to e s t im a te d 4Q 16 d is po s it io ns a nd us e s o f p ro c e e ds
de s c ribe d in the c o m pa ny's "We llto we r A nno unc e s S ign ific a n t P o rtfo lio R e po s it io n ing" p re s s re le a s e da te d
(2 ) Inc lus ive o f IR C s e c tio n 1031 de po s its .
(3 ) Inc lude s a ll no nc o n tro lling in te re s ts (re de e m a b le a nd pe rm a ne n t).
(4 ) B a s e d o n o u ts ta nd ing s ha re s o f 362 ,425 ,000 a nd $ 74 .77 pe r s ha re a s o f 9 /30 /16 .
N o nc o n tro lling in te re s ts (3)
N e t de b t to e n te rp ris e va lue ra t io
S e c ure d D e b t to T o ta l A s s e ts :
S e c u re d de b t
T o ta l a s s e ts
N o te s :
Pro Forma Capitalization Ratios
63


