
Copyright © 2002‐2012 Urgent Matters 1
THE CARE MANAGEMENT UNIT IMPROVES ED FLOW GRADY HEALTH SYSTEM
Publication Year: 2004
Summary: Patients with specific diagnoses, including chest pain, heart failure, asthma, hyperglycemia, are moved to a Care Management Unit directly from the ED
Hospital: Grady Health System Location: 80 Jesse Hill Jr. Dr., SE Atlanta, Georgia 30303
Category: C: Clinician Initial Evaluation &
Throughput E: Exit from the ED
Key Words: Crowding Patient Satisfaction Patient Volume Queuing Wait Times
Hospital Metrics: (Taken from FY2005 AHA Annual Survey) Annual ED Volume: 155,681 Hospital Beds: 1,423 Ownership: Public Trauma Level: 1 Teaching Status: Yes
Tools Provided: Attacking the Three-Point Continuum
This tool is a 37-slide presentation about Grady’s initiatives, implementation tactics and outcomes, and is used by hospital administration as confirmation that efforts by Grady produced successful results.
Average Telemetry Bed Usage This tool is a one-page graph displaying the decrease in average telemetry bed usage since the CMU was implemented, and is used to compare the bed usage before and after the CMU was implemented.
Best Practices: Care Management Unit This tool is a 57-slide presentation of the objectives, implementation, outcomes and lessons learned from the Care Management Unit at Grady, and was presented in November 2004 to Urgent Matters participants.

Copyright © 2002‐2012 Urgent Matters 2
Clinical Areas Affected:
Clinics Emergency Department Inpatient Units Outpatient Units
Staff Involved:
Administrators Nurses Physicians
Innovation Patients with specific diagnoses, including chest pain, heart failure, asthma, hyperglycemia, are admitted to a seven‐bed Care Management Unit (CMU) directly from the ED. Placing patients in the CMU allows them to be moved out of the ED more quickly and helps to ensure that they receive the appropriate care for their condition. The goals of the CMU are to improve access to primary care, decrease relapse rates, decrease admission to telemetry beds, decrease short stay admissions, and decrease cost. As a key indicator, patient satisfaction showed Grady Health System (Grady) that it faced several specific challenges related to ED crowding. In 2002, patient satisfaction levels were at an all‐time low in terms of the patient’s perception of care and wait times. For example, ED patients waiting for an inpatient bed, long patient throughput time in the ED, increasing ambulance diversions, and increasing rate of patients who left without being seen (LWBS). Grady found major bottlenecks in both the throughput and output stages. In terms of throughput, patients in the ED were waiting to be seen for many hours. Additionally, time in the ED was extended by problems such as an excessively long order entry process. In terms of output, many patients had to wait a long time following treatment in the ED in order to be admitted to the hospital. As a result, Grady undertook an initiative to improve ED patient flow for patients with specific diagnoses (See Attacking the Three‐Point Continuum). Results Several specific goals have been accomplished by the CMU. There has been a decrease in the number of short stay admissions, a decrease in the number of admissions to telemetry beds, a decrease in cost, a decrease in the relapse rate, and an increase in patient satisfaction (See Average Telemetry Bed Usage). Following their stay in the CMU, 85 percent of the patients are discharged home, while 15 percent are admitted. The average length of stay (ALOS) in the CMU is 18 hours, 58 minutes. For congestive heart failure, the ALOS is 19 hours, 49 minutes. Additionally, the CMU has improved access to primary care. Data collected from September 2003 through February 2004 indicate all patients were given an appointment within 48‐72 hours of their CMU visit. For the diabetes clinic, 41 percent of patients kept their appointment, for the DSE, 44 percent kept their appointment, and for the Medical Clinic, 44 percent kept their appointment (See Best Practices: Care Management Unit). Overall, Grady has found the CMU to be a successful combination of observation medicine and case management. The multidisciplinary approach has worked well with coordination and support from hospital administration, nursing, the pharmacy, and outpatient clinics. Other gains have included physician billing for observation care, a positive impact on residents (in terms of compliance with Accreditation Council for Graduate Medical Education guidelines and workload), and establishing a research database. Innovation Implementation Grady implemented the care management unit (CMU) to improve ED flow by focusing on patients with specific

Copyright © 2002‐2012 Urgent Matters 3
diagnoses. The goals of the CMU are to improve access to primary care, decrease relapse rates, decrease admission to telemetry beds, decrease short stay admissions, and decrease cost. The CMU is a seven‐bed unit with four dedicated CMU nurses and four dedicated case managers. Admission criteria are chest pain (low to intermediate risk) (53 percent of patients), heart failure (11 percent), asthma (33 percent), and hyperglycemia (3 percent). Grady will continue to re‐evaluate protocols to decrease subsequent hospital admission rates. The Case Manager’s duties include patient/family disease‐specific education, primary care follow up (after 48‐72 hours), direct phone follow‐up, and database management. Advice and Lessons Learned Challenges with the CMU included issues surrounding volume versus staffing and capacity, a change in hospital administration, obtaining data on telemetry admissions and revisit rates, lab and radiology turnaround times, coordination with two schools of medicine (cardiology fellows not available for all patients for in‐unit testing) and patients keeping appointments (with many patients being homeless or not having phones). Tools to Download Attacking the Three‐Point Continuum This tool is a 37‐slide presentation about Grady’s initiatives, implementation tactics and outcomes, and is used by hospital administration as confirmation that efforts by Grady produced successful results. Average Telemetry Bed Usage This tool is a one‐page graph displaying the decrease in average telemetry bed usage since the CMU was implemented, and is used to compare the bed usage before and after the CMU was implemented. Best Practices: Care Management Unit This tool is a 57‐slide presentation of the objectives, implementation, outcomes and lessons learned from the Care Management Unit at Grady, and was presented in November 2004 to Urgent Matters participants.

1
“Attacking the Three-Point Continuum”
Leon L. Haley Jr., MD, MHSA, FACEPDeputy Senior Vice-President, Medical Affairs
Chief of Emergency Medicine Grady Health System
Vice Chair, Clinical AffairsAssistant Professor of Emergency Medicine
Emory University
Grady Health System®
Overall Objectives
Outline existing challenges within the ECC
Establish plan/approaches to address challenges
Measure the success/failure rate of plan
Analyze and disseminate results of plan
Share Lessons Learned / Next Steps

2
Level 1 Trauma Center for North Georgia. City of Atlanta’s ACLS Ambulance Provider1 of only 2 Burn Centers for GeorgiaHome of Georgia’s Poison Control CenterGeorgia’s only Cancer Center of ExcellenceComprehensive Sickle Cell Center
Grady Health System Overview
Discharges – 33, 000Out-Patient Visits – 817,000Ambulance Transports – 85,000Level 1 Trauma Admissions – 3,500 in ‘03Budget - $630 Million
Grady Health System Overview

3
ECC100K+
Emergent and Urgent Care Services
UCC50,492
2002 Volume Data
Sickle Cell
3,826
WUCC17,109
Advice Nurse
180,000 calls/yr
Psych ER
24,293
HSCH55,000
Emergency Care Center Structure
Triage - Ambulance and Ambulatory Pts, 5 Level Triage SystemPACe – Designated “Fast Track” area Red Zone – Major-Minor Trauma, Surgery, Medical BackupBlue Zone – Major-Minor Medical, Surgical BackupAsthma – Mild to Moderate Detention – Mild to Moderate Prisoner CareCare Management Unit – CP, CHF, Asthma, Hyperglycemia

4
Emergency Care Center Structure
RED ZONE
Trauma
PACe
BLUE ZONE
CMU
TRIAGE
ASTHMA & DETENTION
As of Q1, 2002, the Overall LOS within the ECC was approximately 7+ hours with outliers up to 24+ hours.
Patient Satisfaction levels were at an all-time low as it relates to perception of care and wait times.
Background Information:

5
Admitted Patient Load in the ECC
Admitted patients are sicker, more complex patients than other patients in the ECC and may require more time and resources
Admitted patients are patients that usually no longer require emergent care, yet must be cared for by ECC resources
Admitted patients in the ECC impede the movement of all remaining patients
From January through July of 2002, 22% of patients seen in the ECC necessitated admission as compared to the national average of 13%
GHS ECC Overcrowding Study
ECC Admited Patient Load
Aug-Sept 2002
020406080
100120140
8:00
10:00
12:00
14:00
16:00
18:00
20:00
22:00 0:
002:00
4:00
6:00
Pa
tie
nts
in
EC
C
in ECC
Admitted
Total Pts AdmittedHour in ECC Patients % Admitted
8:00 75 25 33.5%10:00 77 22 28.5%12:00 87 21 24.2%14:00 96 22 23.4%16:00 101 25 24.5%18:00 111 28 25.5%20:00 121 31 25.5%22:00 124 31 25.4%
0:00 124 32 25.8%2:00 116 31 26.5%4:00 105 29 27.8%6:00 93 25 26.8%
Average 27 26.4%Aug - Sept Max Admitted - 46
Aug-Sept Min Admitted - 4
AVG Admitted Patient LoadAug - Sept 2002
Background Information:
All three points of the continuum had major bottlenecks which led to further issues and delays
o Input (ex. Patients waiting in the waiting room were there for an unacceptable length of time)o Throughput (ex. The order process was taking an unacceptable length of time)o Output (ex. The admissions process was inefficient and taking an unacceptable length of time)Therefore, initiatives were taken in order to address not
only the above mentioned topics, but all related topics as well.

6
Leadership Organizational Structure
Urgent Matterso Rapid Cycle Testing, Learning Network, Site Visits
ED Operations (Steering Committee)o CEO, COO, ED Chief, CNO, Other VP’sECC Leadershipo ED Chief, Nursing Director, Manager, Other
Leadership StaffInpatient Teamso AVP Nursing, Medical Staff, RN’sECC Task Forceo CNO, ED Chief, Representatives from other disciplines
Introduction to PACe problem
Wait times had soared to 10+ hours for those patients waiting to be seen in our PACe (fast track) area in 2002.
Providers had no clear understanding of how long the patients were waiting to be seen.
Additionally, those providers had no clear understanding of actually how many patients were in the waiting area waiting to be seen

7
PACe WAIT TIME DATA
0
2
4
6
8
10
12
F02
A02
M02
J02
J02
A02
S02
O02
N02
D02
LOSWAIT TIME
8.75
10.2 10.28
8.36 8.46
9.65 9.5610.85
6.185.53
Relocate patient chart in-basket from the Information Desk to PACe
Purpose: o Give ownership to the PACe staff of patients waiting to be seeno Proactively assess patients triaged to PACe for ancillary serviceso Establish and publish wait time goals.o Reduce upfront wait timeo Decrease overall throughput timeo Increase patient satisfaction
Sample Size and duration of study (Study conducted for two weeks)
o Week 10 – 180 patientso Week 11 – 156 patients
PACe (fast track)
Initiatives:

8
PACe (fast track) – Graphical display
256
115
219
94
125
161
0
50
100
150
200
250
300
Week 6 Week 7 Week 8 Week 9 Week 10 Week 11
PACe Throughput
0:00
1:12
2:24
3:36
4:48
6:00
Week 9 Week 10
Reduction of 2 hours 10 minutes
PACe (fast track) – Graphical display

9
Results:
PACe (fast track)
Average time from arrival to bed placement decreased from 219 minutes to 94 minutes.
Productivity increased by 33%o The average daily volume for PACe is 51 patientso During the Pilot/Change, the volume increase to 67
patientsOverall throughput decreased from 5 hours 40 minutes to 3
hours 31 minutes (38 % decrease)Residual affects:o Average Time of Bed Placement to Exam - From 43 to
35 Minutes (19 % decrease)
PACe Lessons Learned/Next Steps
Provider Staffing Issues
Nurse Staffing Issues
Perceptions of Increased Workload
Improve Patient Satisfaction

10
PACe Key Message
Leadership Support
Unit Ownership
Publish Results / Data
Incentives
Introduction to Order Entry Problem
Inconsistent sequence of patient orders
Prioritization of patient issues
Length of Time to process orders
Increased throughput time

11
Approach:
Brainstorming sessions with Project Team
Flow charting processes and identifying bottlenecks
Identifying measurements that would determine project outcome
Develop implementation plan
Implement Plan
Initial Process for Ordering Labs in the Red Zone with Order Entry
Start
Provider Writes Order and Puts in
Order Box
Nurse Removes the Order from the Orders Box
Nurse Explains Procedure to
Patient
Nurse Stamps Up Labels for the
Lab Tubes
Nurse Draws Labs
Nurse Sends Requisition
Confirmation and Lab Tubes to the
ECC Lab Through the CTS
End
Nurse Labels the Lab Tubes
Nurse Locates and Identifies Patient
Provider Puts Order in Orders
Box
Nurse Enters Order into Order Entry
System
Nurse Retrieves Validation Number from System and Writes it in Chart
Nurse Retrieves Requisition
Confirmation from Printer
Expediting order entry processes, and Implementation of patient care ordersA two-phase pilot of centralized order entry was implemented.
• The initial pilot was conducted over the course of three days for a total of approximately twenty- four hours. Sample size was 41 patients; data was collected in the Red Zone.
• Phase- two of the pilot was also conducted in the Red Zone over a twenty-four hour period. Sample size was thirty- eight patients.
Data collected was:Time order writtenTime chart placed in rackTime order entered into computerTime of order initiation Time of order completion
Centralized Order Entry - Initiatives

12
De-Centralized vs. Centralized Results:
Centralized Order Entry:
66%1132Orders entered to Orders initiated
Orders initiated to Complete
Order placed in rack to Orders entered into the system
Measure
76%
87%
% Change
9
9
Centralized (Ave. min)
69
38
De-Centralized (Ave min)
Centralized Order Entry – Graphical Display
Order initiation to order completion
0
20
40
60
80
100
120
140
160
180
200
1 3 5 7 9 11 13 15 17 19 21 23 25 27 29 31 33 35 37 39 41 43number of patients
time
in m
inut
es
DeCentralized Centralized
Results:

13
Centralized Order Entry – Graphical Display
Time from orders to rack and orders entered
0
50
100
150
200
250
300
350
1 3 5 7 9 11 13 15 17 19 21 23 25 27 29 31 33 35 37 39 41
number of patients
time
in m
inut
es
DeCentralized Centralized
Results:
COE Lessons Learned
Confusion with Order Location
Transportation Issues
Patient Prep Issues
Order Prioritization Issues
Length of time from Physician Order to Order entered into system

14
Introduction to Discharge Problem
Extended Length of time for Discharge process
Staffing Issues / Nursing Priority
Paperwork/Documentation Issues
Transportation Issues
Social Issues
Designated Discharge Nurse
This change was implemented multiple times
o The weeks of September 8, 22, and October 13
Duties Include:
Audit Charts to see which patients are ready for discharge.
Work with Physicians to expedite the disposition process through.
Initiatives:
Designated Discharge Nurse:

15
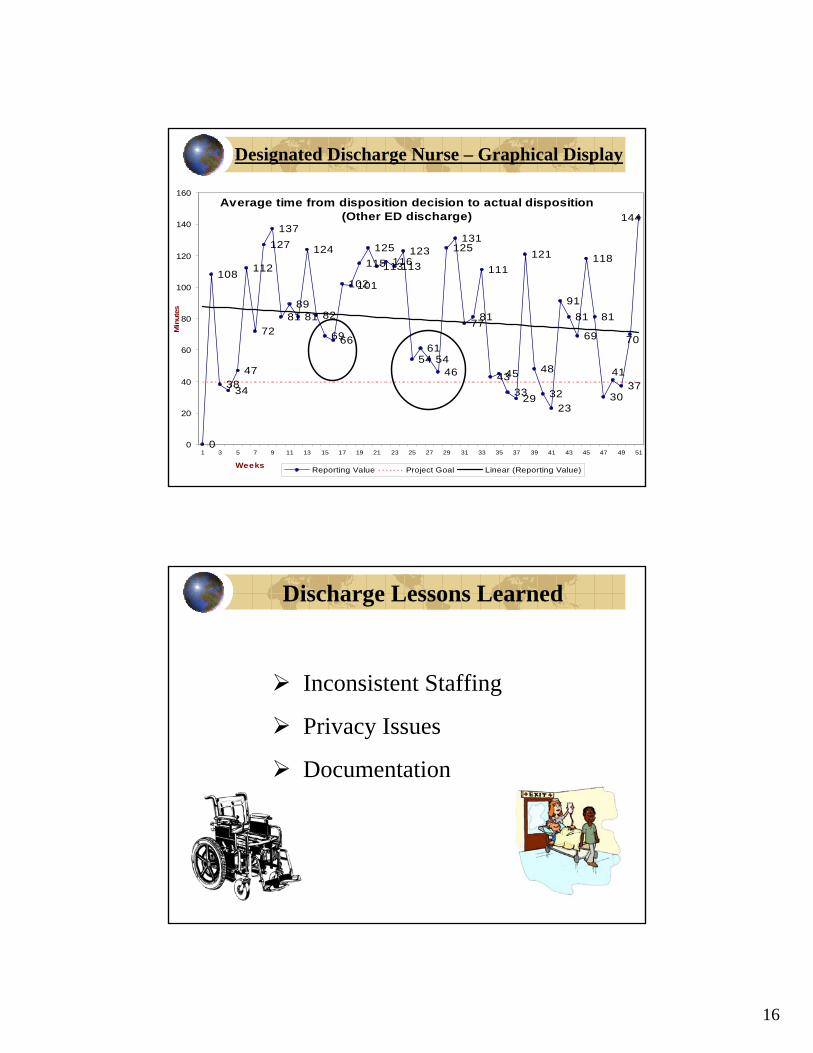
Designated Discharge Nurse:
Results:During the time periods that
initiative was occurring, there was significant decrease in overall average times
Decreased average time from disposition decision to actual disposition (other ED Discharged) by 17 %
Due to staffing challenges, we are unable to rollout this initiative on a permanent basis
KPI’s Observed:Average time from disposition decision to actual dispositiono Other ED Patients (Primary)o Admitted Patients (Secondary)
Results:From Week 14 to 15, a decrease of 16% in the primary indicator was noticed and a decrease of 17% in the secondary indicator was noticed.
Week 14 Week 15 Week 16 % change from week 14 to 15
% change from week 15 to 16
Average time from disposition decision to actual disposition
(Other ED discharged)82 69 66 16% 4%
Average time from disposition decision to actual disposition
(Admitted)503 415 320 17% 23%
Designated Discharge Nurse:
16
Average time from disposition decision to actual disposition (Other ED discharge)
0
108
3834
47
112
72
127137
8189
81
124
82
6966
102101
115125
113116113123
5461
5446
125131
7781
111
4345
3329
121
48
3223
9181
69
118
81
3037
144
70
41
0
20
40
60
80
100
120
140
160
1 3 5 7 9 11 13 15 17 19 21 23 25 27 29 31 33 35 37 39 41 43 45 47 49 51
Weeks
Min
utes
Reporting Value Project Goal Linear (Reporting Value)
Designated Discharge Nurse – Graphical Display
Discharge Lessons Learned
Inconsistent Staffing
Privacy Issues
Documentation

17
Conclusion:Due to the initiatives implemented throughout this past
calendar year, significant improvements have been made.
The data collection and analysis of these indicators continue to be measured and strides are still being made.
Hospital Administration continues to grow in support of the ECC goals and efforts.
Regular meetings are still taking place with the emphasis on the three points of the Throughput Continuum.
Order initiation to order completion
0
20
40
60
80
100
120
140
160
180
200
1 3 5 7 9 11 13 15 17 19 21 23 25 27 29 31 33 35 37 39 41 43
num ber of patients
time
in m
inut
es
DeCentralized Centralized
256
115
219
94
125
161
0
50
100
150
200
250
300
Week 6 Week 7 Week 8 Week 9 Week 10 Week 11
Average time from disposition decision to actual disposition (Other ED discharge)
0
108
3834
47
112
72
127137
8189
81
124
82
6966
102101
115125
113116113123
5461
5446
125131
7781
111
4345
3329
121
48
3223
9181
69
118
81
3037
144
70
41
0
20
40
60
80
100
120
140
160
1 3 5 7 9 11 13 15 17 19 21 23 25 27 29 31 33 35 37 39 41 43 45 47 49 51
Weeks
Min
utes
Reporting Value Project Goal Linear (Reporting Value)
Facilitates the Admission of inpatient, outpatient, and observation patients by initiating care as quickly as possible.
To eliminate holding patients in the ED for an extended period of time, improving flow of patient access, improving customer service and overall quality of care.
o 24 Beds
8 ICU
Isolation Beds
New Care Initiation Unit (CIU)

18
Benchmarking
IdentifyIdentifyrelevantrelevantperformanceperformancedatadata
DetermineDetermineprocess(es)process(es)to be studiedto be studied
Compare/Compare/discoverdiscover
bestbest--inin--classclassenablersenablers
Regularly Monitor Regularly Monitor PerformancePerformance
Adopt/Adopt/adaptadapt
selected selected enablersenablers
Gather data fromGather data fromyour organizationyour organizationand from bestand from best--inin--classclass•• SurveySurvey•• Site visitsSite visits
Benchmarking is defined as the search for best practices to support organizational improvement and the development of systems and processes to change behavior
Projects are selected based on priorities set by senior leaders
Benchmarking
Care delivery and support• Process focused• Unit cost management• Elimination of process
defects• Efficiency optimization
Clinical decision making• Procedure/condition
focused• Utilization management• Variation minimized• Clinical practice
advancement
Do Things RightDo the Right Thing
OperationalBenchmarkingOperationalOperational
BenchmarkingBenchmarkingClinical
BenchmarkingClinicalClinical
BenchmarkingBenchmarking
HighHigh--Quality,Quality,Efficient Efficient PatientPatientCareCare

19
Organizational focus on patient flowPhysician commitment to the processOrganized approach to bed managementFlexibility in placing patientsEffective use of staff resourcesDischarge planning that occurs early and oftenCommitment to rapid bed turnaround times
Keys to Success

Grady Health System
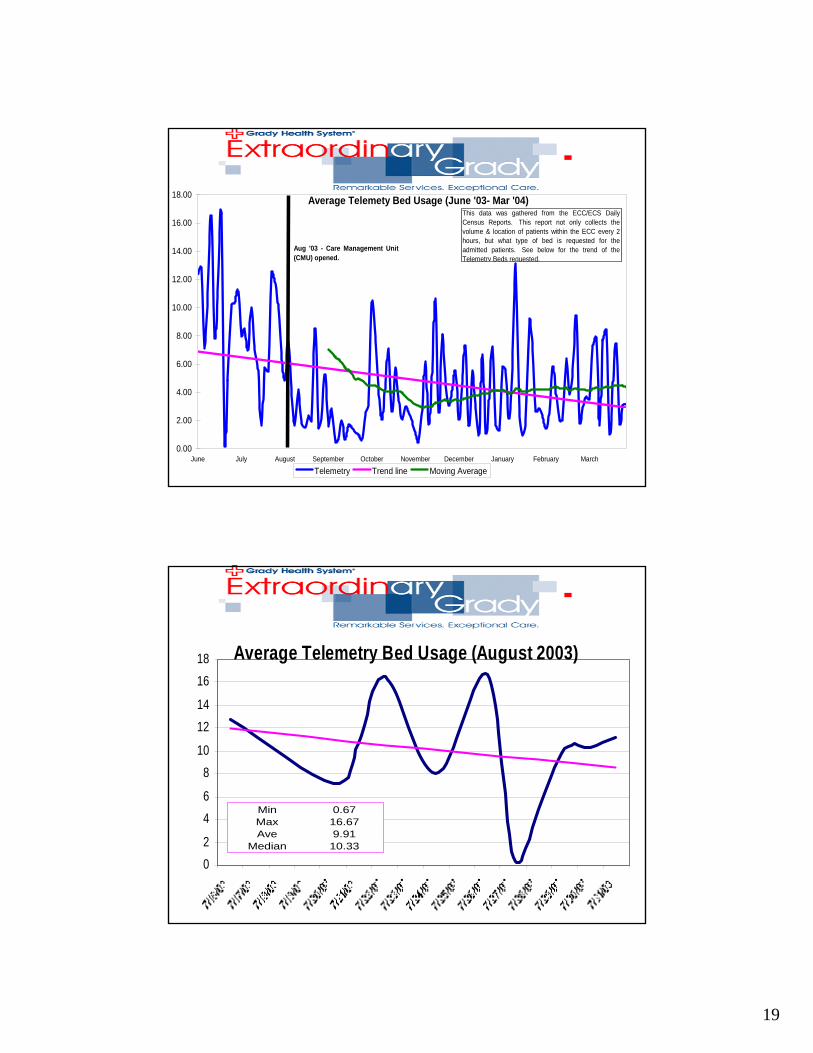
Average Telemety Bed Usage (June '03- Mar '04)
0.00
2.00
4.00
6.00
8.00
10.00
12.00
14.00
16.00
18.00
June July August September October November December January February March
Telemetry Trend line Moving Average
This data was gathered from the ECC/ECS DailyCensus Reports. This report not only collects thevolume & location of patients within the ECC every 2hours, but what type of bed is requested for theadmitted patients. See below for the trend of theTelemetry Beds requested.
Aug '03 - Care Management Unit(CMU) opened.
This document is copyrighted to Urgent Matters or its original author. No copies or duplication outside The Urgent Matters II Project is authorized without express written permission.

1
The Care Management Unit: A CDU Upgrade
Leon L. Haley Jr., MD, MHSA, FACEPDeputy Senior Vice-President Medical AffairsChief of Emergency MedicineGrady Health SystemVice-Chairman, Clinical AffairsAssociate ProfessorDepartment of Emergency MedicineEmory University
November 2004This document is copyrighted to Urgent Matters or its original author. No copies or duplication outside The Urgent Matters II Project is
authorized without express written permission.
Goals and ObjectivesCrowding Overview Understand the application of case management to the clinical decision unit populationUnderstand the CMU impact on ED crowding and primary care referral and accessLearn strategies to use and avoid when developing a CMU in your ED

2
Sept.10, 2001
Operational costsOperational costsNurse ShortageNurse ShortageTechnologyTechnologyOnOn--callcallInflationInflation
OnOn--Call Specialty Call Specialty Physician Shortage Physician Shortage
Pediatric BedPediatric BedShortageShortage
RevenueRevenueMedicaid / MedicareMedicaid / MedicareManaged careManaged careUncompensated careUncompensated careStock market Stock market
Balanced BudgetBalanced BudgetAct of 1997Act of 1997
EMTALAEMTALA
ED Volume IncreasesED Volume Increases
UndocumentedUndocumentedAliensAliens EMERGENCY EMERGENCY
DEPARTMENTDEPARTMENT
The Perfect Storm:ED Healthcare Braces for a Crisis
AmbulanceAmbulanceDiversionDiversion

3
The Crowding Problem• Identified need for emergency services outstrips
available resources in the ED
• More patients than staffed ED beds, plus long wait times
• Patients typically treated and monitored in hallways
• Constrains ability to triage patients
• A hospital problem, not an ED problem
Hypothesized Consequences of Crowding (Derlet and Richards 2000)
• Public safety at risk• Prolonged pain and suffering• Long waits and dissatisfaction of patients• Ambulance diversions• Decreased physician productivity• Violence• Negative effect on teaching missions in academic medical
centers• Miscommunication because of increased volume

4
Volume
Qua
lity
of O
utco
mes
Volume-Outcome Relationship for ED Crowding?
Level 1 Trauma Center for North Georgia. City of Atlanta’s ACLS Ambulance Provider1 of only 2 Burn Centers for GeorgiaHome of Georgia’s Poison Control CenterGeorgia’s only Cancer Center of ExcellenceComprehensive Sickle Cell Center
Overview

5
Discharges – 33, 000Out-Patient Visits – 817,000Ambulance Transports – 85,000Level 1 Trauma Admissions – 3,500 in ‘03Budget - $630 Million
Overview
ECC100K+
UCC50,492
2002 Volume Data
Sickle Cell
3,826
WUCC17,109
Advice Nurse
180,000 calls/yr
Psych ER
24,293
Neighbor-hood
Clinics189,416
HSCH52,165
Emergent and Urgent Care Services

6
Admitted Patient Load in the ECCAdmitted patients are sicker, more complex patients than other patients in the ECC and may require more
time and resources
Admitted patients are patients that usually no longer require emergent care, yet must be cared for by ECC resources
Admitted patients in the ECC impede the movement of all remaining patients
From January through July of 2002, 22% of patients seen in the ECC necessitated admission as compared to the national average of 13%
ECC Admited Patient Load
Aug-Sept 2002
020406080
100120140
8:00
10:00
12:00
14:00
16:00
18:00
20:00
22:00 0:
002:00
4:00
6:00
Pa
tie
nts
in
EC
C
in ECC
Admitted
Total Pts AdmittedHour in ECC Patients % Admitted
8:00 75 25 33.5%10:00 77 22 28.5%12:00 87 21 24.2%14:00 96 22 23.4%16:00 101 25 24.5%18:00 111 28 25.5%20:00 121 31 25.5%22:00 124 31 25.4%
0:00 124 32 25.8%2:00 116 31 26.5%4:00 105 29 27.8%6:00 93 25 26.8%
Average 27 26.4%Aug - Sept Max Admitted - 46
Aug-Sept Min Admitted - 4
AVG Admitted Patient LoadAug - Sept 2002
0
20
40
60
80
100
120
140
160
Total (Patients) 90.10 88.20 99.47 108.03 118.73 120.37 143.71 143.59 135.66 130.43 126.00 112.32
Admitted 19.60 18.97 18.00 17.63 17.97 19.83 24.18 23.79 24.29 22.86 20.96 20.04
CMU 4.10 3.63 3.63 3.50 3.53 3.41 3.41 3.66 3.61 3.79 3.79 3.82
800 1000 1200 1400 1600 1800 2000 2200 0 200 400 600

7
• 7 Bed Unit (Existing Chest Pain Center)
• 4 dedicated CMU Nurses (Through March 2004)
• 4 dedicated Case Managers (Through March 2004)
• Admission Criteria– Chest Pain (Low to Intermediate Risk)– Heart Failure– Asthma– Hyperglycemia
• ED Faculty Supervision
0
20
40
60
80
100
Asthma Chest Pain CHF DMHome Admit ED Obs
Physician Survey - Disposition

8
CMU Goals• Decrease Admission to Telemetry Beds• Decrease Short Stay Admissions• Improve Access to Primary Care• Decrease Relapse Rates• Improve Patient Satisfaction• Decrease Cost
CMU NursesResponsibilities
o Verifying that patients meet admission criteria prior to transfer to the unit.o Coordinate patient’s care while in the unit and carry out all orderso All appropriate nursing documentationo Report all significant changes in patient status to the attending physiciano Track patient through the clinical pathwayo Notify physician of significant changes in patient status as well as readiness for dischargeo Ensure that patient understands discharge instructions

9
CMU NursesEducation / Training
Experienced Registered Nurses
Experienced Emergency Department nurses
CMU Protocol Training
Lectures and Training
o Chest Pain Evaluation and management
o Chest Pain Risk Stratification
o EKG interpretation
o Observation care
o Nuclear Medicine/Sestamibi injection
CMU Case ManagerResponsibilities
o Coordinate appropriate follow up planning for patientso Work directly with the patient’s PCP and/or clinic to arrange appointments, home nursing, education, social work evaluation and other needs of the patiento Discuss plans with the patient and attending physiciano Document information on the patient’s chart
Fill prescriptionsEnter patient information into databaseMaintain phone contact with patients to ensure compliance,
answer questions, etc.o Direct Phone follow upo Database

10
CMU Case ManagerExperienced Registered Nurses
Diabetes Training: Grady Memorial Hospital Department of Endocrinology
Asthma Training – Grady Memorial Hospital Department of Pulmonary Medicine
o Asthma pathophysiologyo Management Training and Educationo Educating the patientso Medication administration
Chest Pain Evaluation and ManagementCase Management InstructionInstruction on utilization of CMU database
Admission Criteria
Ambulatory sensitive diagnoses
Diagnoses with frequent emergency department visits
Frequently short hospital stays
Criteria and protocols were developed via a collaborative effort with Internal Medicine, Cardiology, Endocrinology and Pulmonary Medicine

11
CHEST PAIN PROTOCOL CRITERIAEligibility Criteria Exclusion Criteria Testing and
Documentation prior to CPC
Treatment prior to CPC
CMU observation and treatment
Discharge Criteria
HospitalAdmission Criteria
1. Non traumatic chest pain
2. Chest pain less typicalfor ischemia and no new EKG changes
1. EKG changes suggestive of ischemia (ST elevation >2 consecutive leads, ST depression, symmetrical T wave inversion, hyperacute T waves, Q waves, new BBB
2. Positive cardiac enzymes
3. Patients requiring continuous nitratesor heparin
4. Hemodynamicinstability
5. New arrhythmia6. Other unstable
disease (i.e. CHF, ARF, CRF on HD, DKA, etc.)
7. Other complicating illness
1. Hx and PE
2. Attending Note
3. EKG4. One set
cardiac enzymes
5. CBC6. CXR7. Pulse ox8. Review of
previous stress test or Cath
9. Other test based on individual patient requirements
10. Complete documentation of CPC admission form
1. IV access2. Aspirin
(unless contraindicated)
3. Pain management
4. Other treatment based on individual patient requirements
1. VS q 4 and PRN2. Nitropaste PRN3. Cardiac Monitor4. STAT EKG for CP5. Cardiac Enzymes,
EKG per protocol 0, 3 and 6 hours
6. Sestimibi for patients with no history of previous MI and pain within 6 hours of presentation
7. Stress testing/cardiology consult for patients with history of previous MI or pain greater than 6 hours from time of presentation
8. Stress testing/cardiology consult if suspicious in spite of negative enzymes and sestimibi
9. Stress test if available for sestimibi >8% (may consider outpatient stress test in 48 hours if same day testing not available)
10. Notify MD for change in status or DC criteria met
11. Case Manager evaluation
1. Cardiac enzymes negative
2. Sestimibi<10%
3. Case manager complete
4. Follow up arranged
1. Positive Cardiac enzymes
2. Sestimibi>15% (if same day stress test not available)
3. New EKG changescompatible with ischemia
4. Other complications as deemed necessary by attending physician
*Sestimibi 8-15% may consider dc home if able to arrange stress test in 48 hours and chest pain resolved.
*Sestimibi <8% considered negative unless clinical suspicion remains
Female48%Male
52%
Caucasian5%
Hispanic2%
African American
83%
Other10%
General Demographics of Patient Population

12
N
EW
S
Home Location
(zip codes)
175
1147
30
100200300400500600700800900
1000110012001300
Admitted Home Transfer to zone
CMU Total Patients (1325)

13
33%
53%
11%3%
Asthma Chest Pain Heart Failure Hyperglycemia
Percent Each
Diagnosis Admitted
Admitted14.57%
Transfer to zone
0.23%
Home85.21%
Disposition of Patients

14
121
882
94 5054 9719 51 1 1 0
0100
200300
400
500600
700800
900
1000
Asthma Chest Pain Heart Failure Hyperglycemia
Home Admitted Transfer to zone
Disposition for individual diagnoses
69%
90%
82% 91%
Co-Morbidities for DiagnosesHTNDMCHFHypercholesterolemiaSmokingEtoh abuseIllicit drug use
15
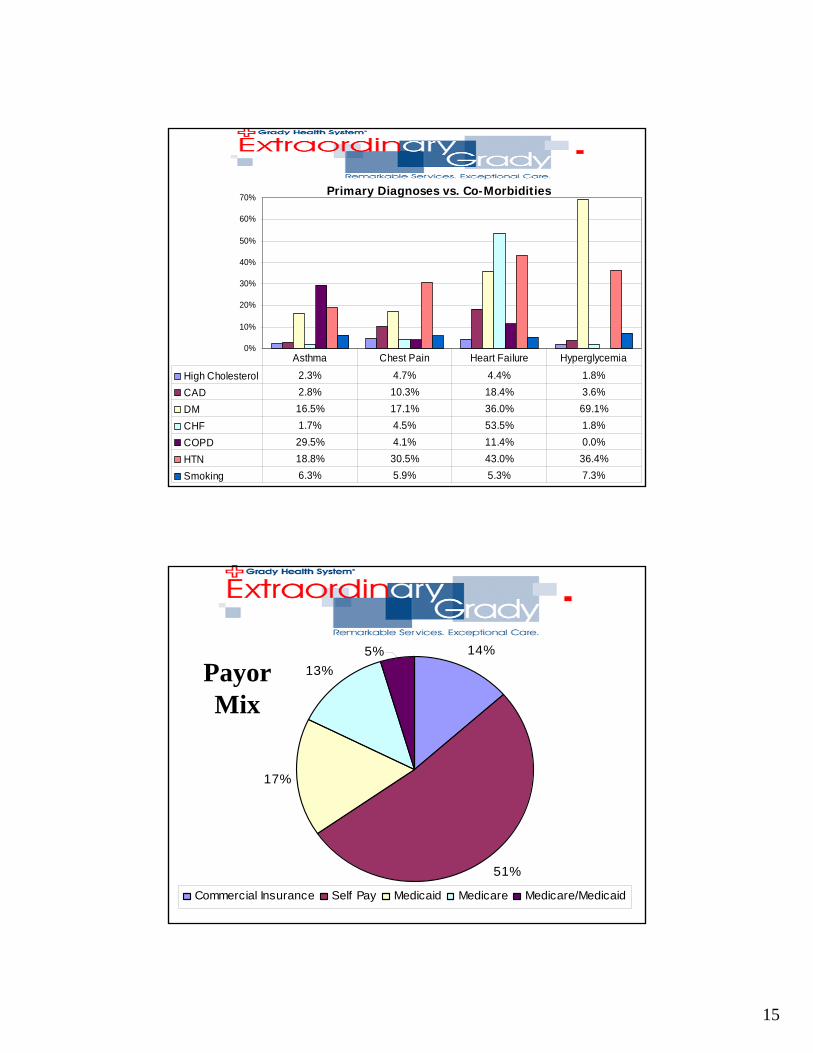
0%
10%
20%
30%
40%
50%
60%
70%
High Cholesterol 2.3% 4.7% 4.4% 1.8%CAD 2.8% 10.3% 18.4% 3.6%DM 16.5% 17.1% 36.0% 69.1%CHF 1.7% 4.5% 53.5% 1.8%COPD 29.5% 4.1% 11.4% 0.0%HTN 18.8% 30.5% 43.0% 36.4%Smoking 6.3% 5.9% 5.3% 7.3%
Asthma Chest Pain Heart Failure Hyperglycemia
Primary Diagnoses vs. Co-Morbidities
14%
51%
17%
13%5%
Commercial Insurance Self Pay Medicaid Medicare Medicare/Medicaid
PayorMix

16
•Average Length of stay for all diagnoses–Average: 18:58
•Average Length of stay for CHF–Average:19:49
CMU Patient ALOS

17
27
3
15
6
46
0
5
10
15
20
25
30
35
40
45
50
CP/USA/ Enzymes Sestimibi EKG Change Other
Admitted Chest Pain Patients(Reason for Admission)
Admitted Hyperglycemia Patients(Reason for Admission)
2
1
2
0
0.5
1
1.5
2
2.5
DKA DM, DEHYDRATION Hyperglycemia

18
Admitted Heart Failure Patients(Reason For Admission)
14
1 1 1 11
0
2
4
6
8
10
12
14
16
CHF COPDEXACERBATION
CP R/ O MI Increased Hear tRat e
R/ O TB VALVULAR HEARTDISEASE WITH
DECOMPENSATION
Admitted Asthma Patients(Reason for Admission)
47
1 4 205
101520253035404550
ASTHM A PNEUM ONIA COPD with Exacerbat ion CP, R/O M I - CK-M BPOS. X 3. TROP. POS
0.12
19
Average Telemety Bed Usage (June '03- Mar '04)
0.00
2.00
4.00
6.00
8.00
10.00
12.00
14.00
16.00
18.00
June July August September October November December January February March
Telemetry Trend line Moving Average
This data was gathered from the ECC/ECS DailyCensus Reports. This report not only collects thevolume & location of patients within the ECC every 2hours, but what type of bed is requested for theadmitted patients. See below for the trend of theTelemetry Beds requested.
Aug '03 - Care Management Unit(CMU) opened.
Average Telemetry Bed Usage (August 2003)
02
46
810
1214
1618
Min 0.67Max 16.67Ave 9.91
Median 10.33

20
Average total ED throughput timeGrady Health System - ECC6.8
4.9
5.3
5.15
5.6
5.1
6
5.5
5.8
5.3
4.9
5.25.3
54.9
5.3
5.1
5.85.9 5.9
5.55.4
5.3
4.7
54.9
5.6
5.3
4.84.9
5.35.2
5.4
5.1
5.25.2
5.3
5.35.4
5.55.55.4
6.16
5.5 5.55.6 5.55.5
4
4.5
5
5.5
6
6.5
7
1 3 5 7 9 11 13 15 17 19 21 23 25 27 29 31 33 35 37 39 41 43 45 47 49Weeks
Hou
rs
Reporting Value Project Goal Linear (Reporting Value)
CMU opened Aug 2003
Grady Diversion Time
99168
433
1800
3873 4000
2922
1341
1788
0
500
1000
1500
2000
2500
3000
3500
4000
1997 1998 1999 2000 2001 2002 2003 Q1-3'04 2004(projected)

21
Referrals
818
61
122
60
9069105
UCC
MEDICAL CLINIC
DIABETES CLINIC
ASTHMA CLINIC
NEIGHBORHOODCLINICSSPECIALSTUDIESOTHER
Follow Up• Primary Care Access
– Open Template to Neighborhood Clinics– Daily appointments available Hospital Medical Clinic
• Chest Pain– Outpatient DSE/Thallium available 48-72 hours
• Asthma– Appointments available 48 hours
• Heart Failure– Medical Clinic Follow up 48 hours
• Diabetes– Follow up 48 hours in diabetes clinic

22
Improved Access to Primary Care
• Data Collected from September 2003-February 2004
• All patients given appointment within 48-72 hours of CMU visit– Diabetes Clinic 41% kept appointment– DSE – 44% kept appointment– Medical Clinic – 44% kept appointment
Reasons Patients did not keep Appointment:
• Patient Forgot• No transportation• Felt better• Came back to ED

23
Show Rates for Clinics:
• Diabetes Clinic 41% kept appointment• DSE – 44% kept appointment• Medical Clinic – 44% kept appointment
Relapse Rate• Patient Characteristics:
– 20 males (66.6%) and 10 females (33.33%) were reviewed in the study• 63 patient encounters evaluated overall (43 male/20 female)
– Average patient visit was 2.1 (max=4/ min=1)• Data:
– Of 63 encounters, 38 (60%) ED visits after initial CMU admission– Evaluation of the return visits demonstrated that 55% were related to
the chief complaint of the initial visit.– Of the 21 related return visits, only 33% of the patients had attended
their follow-up appointments– Of the 54 follow-up appointments, 35% were kept– Of the 19 patients that attended follow-up, 36% returned for a related
complaint– 64% of the study population did not attend follow-up

24
0.00%
10.00%
20.00%
30.00%
40.00%
50.00%
60.00%
Excellent (4) 37.78% 40.00% 36.36% 44.44% 40.00% 42.22% 44.44% 45.45% 40.00% 34.88%
Go od (3) 53.33% 53.33% 52.27% 48.89% 51.11% 46.67% 44.44% 43.18% 44.44% 44.19%
Average (2) 8.89% 2.22% 4.55% 4.44% 0.00% 8.89% 4.44% 9.09% 8.89% 16.28%
P o or (1) 0.00% 4.44% 6.82% 2.22% 8.89% 2.22% 6.67% 2.27% 6.67% 4.65%
Friendliness o f staff n=45
Nurses reponsive to needs n=45
Staff explained all procedures
n=44
Cleanliness n=45
Satisfactio n with physcian
n=45
Degree o f satisfactio n
overall care in
Understanding o f reaso n
admitted n=44
Understanding o f illness n=44
Understanding o f after care
n=45
Satisfaction overall (ECC)
n=43
Patient Satisfaction
Decrease Cost• University Health System Consortium
– June 2002-2003• 1,122 CHF admissions• $4,472.00 per patient• Average LOS 4 days (Below average)
• Cost Savings for CHF• Avoided 97 hospital admissions• ECC/CMU cost $616.28 – $1061.62• Savings per patient $3410.38 - $3855.72• Total Savings:
o Minimum Savings - $330,806.86 o Maximum Savings - $374,004.84

25
Lessons Learned• Volume/Staffing/Capacity• New Hospital Administration• Data (Telemetry and Specialty Bed Admissions)• Two schools of Medicine
– Cardiology Fellows not available for all patients for in unit testing
• Keeping scheduled appointments – Homeless patients/No Phones
• Continue as center for excellence• Improved nurse staffing • Improve documentation and compliance• Include additional diagnosis• Consider expanding and additional funding
Lessons Learned

26
• Re-evaluate protocols to decrease subsequent hospital admission rate
• Continued Analysis of Datapoints– Decrease telemetry admissions– Decrease number of short stay admissions– Decrease relapse rate– Patient satisfaction – Cost savings
Lessons Learned
• Successful combination of observation of Observation medicine and case management
• Multidisciplinary approach• Cooperation and support of hospital
administration, nursing, pharmacy and outpatient clinics
• Concept/Design can be introduced into other facilities
Lessons Learned

27
• Physician Billing for Observation Care
• Resident Impact: RRC Guidelines, Workload
• Research Database Creation
Lessons Learned
CMU Statistics – Professional (Charges)
Encounter Forms Processed - 1004
Charges YTD - $233,918
Ave Charge Per Pt (Prof) – $233.00

28
Emergency DescriptionCharges Per E/M Observation Description
Charges Per E/M
99281 EMERGENCY DEPT VISIT 33.00$ 99217 OBSERVATION CARE DISCHARGE 132.00$ 99282 EMERGENCY DEPT VISIT 54.00$ 99218 OBSERVATION CARE 132.00$ 99283 EMERGENCY DEPT VISIT 122.00$ 99219 HOSPITAL CARE 221.00$ 99284 EMERGENCY DEPT VISIT 191.00$ 99220 HOSP OBSERVATION CODE 309.00$ 99285 EMERGENCY DEPT VISIT 297.00$ 99234 OBSERV/HOSP SAME DATE 266.00$ 99291 CRITICAL CARE, FIRST HOUR 407.00$ 99235 OBSERV/HOSP SAME DATE 352.00$ 99292 CRITICAL CARE, ADD'L 30 MIN 203.00$ 99236 OBSERV/ HOSP SAME DATE 441.00$
CMU E/M VS. ER E/M
• Specific Goals were accomplished – Decrease number of short stay admissions– Decrease number of admissions to telemetry beds– Decrease cost– Decrease relapse rate– Patient Satisfaction
Lessons Learned

29


