
Working
Paper06-02D
oesF
DIM
odeofE
ntryM
atterfor
Econom
icP
erformance?:T
heC
aseofK
oreaSeong-B
ongL
eeand
Mikyung
Yun
Working Paper 06-02
Does FDI Mode of Entry Matter for Economic Performance?: The Case of Korea
Seong-Bong Lee and Mikyung Yun
This paper attempted to empirically test the proposition that unlike the typical concernagainst M&A, there is little difference in firm performance by modes of FDI entry. If this isthe case, there is no reason to prefer other modes of entry over M&A. The majorcontribution of this paper is that it calls into question the current classification scheme ofmode of FDI entry, on which government tax incentives are based. This paper corrects forthis, reclassifying the modes of entry through detailed analysis of each investment case toreflect as much as possible actual complexity of the cross border investment deal.
Seong-Bong Lee and Mikyung Yun
Working Paper 06-02
Does FDI Mode of Entry Matter forEconomic Performance?:
The Case of Korea

The Korea Institute for International Economic Policy (KIEP) was founded in1990 as a government-funded economic research institute. It is the world’s leadinginstitute on the international economy and its relationship with Korea. KIEP advisesthe government on all major international economic policy issues, and also serves as awarehouse of information on Korea’s international economic policies. Further, KIEPcarries out research for foreign institutes and governments on all areas of the Koreanand international economies.
KIEP has highly knowledgeable economic research staff in Korea. Now numberingover 100, our staff includes research fellows with Ph.D.s in economics frominternational graduate programs, supported by more than 40 researchers. Our staff’sefforts are augmented by our affiliates, the Korea Economic Institute of America (KEI)in Washington, D.C. and the KIEP Beijing office, which provide crucial and timelyinformation on the local economies. KIEP has been designated by the government asthe Northeast Asia Research and Information Center, the National APEC StudyCenter and the secretariat for the Korea National Committee for the Pacific EconomicCooperation Council (KOPEC). KIEP also maintains a wide network of prominentlocal and international economists and business people who contribute their expertiseon individual projects.
KIEP continually strives to increase its coverage and grasp of world economicevents. Expanding cooperative relations has been an important part of these efforts. Inaddition to many ongoing joint projects, KIEP is also aiming to be a part of a broad andclose network of the world’s leading research institutes. Considering the rapidlychanging economic landscape of Asia that is leading to a further integration of theworld’s economies, we are confident KIEP’s win-win proposal of greater cooperationand sharing of resources and facilities will increasingly become standard practice in thefield of economic research.
Kyung Tae LeePresident
300-4 Yomgok-Dong, Seocho-Gu, Seoul 137-747, KoreaTel: 02) 3460-1114 / FAX: 02) 3460-1144,1199URL: http//www.kiep.go.kr
Price USD 2
KIEP Working Paper 06-02
Seong-Bong Lee and Mikyung Yun
Does FDI Mode of Entry Matter for Economic Performance?:
The Case of Korea

KOREA INSTITUTE FOR
INTERNATIONAL ECONOMIC POLICY (KIEP)
300-4 Yomgok-Dong, Seocho-Gu, Seoul 137-747, Korea
Tel: (822) 3460-1178 Fax: (822) 3460-1144
URL: http://www.kiep.go.kr
Kyung Tae Lee, President
KIEP Working Paper 06-02
Published August 14, 2006 in Korea by KIEP
ⓒ 2006 KIEP

This paper attempted to empirically test the proposition that unlike
the typical concern against M&A, there is little difference in firm
performance by modes of FDI entry. If this is the case, there is no
reason to prefer other modes of entry over M&A. The major
contribution of this paper is that it calls into question the current
classification scheme of mode of FDI entry, on which government tax
incentives are based. This paper corrects for this, reclassifying the
modes of entry through detailed analysis of each investment case to
reflect as much as possible actual complexity of the cross border
investment deal.
The empirical part of this paper confirms, even after reclassifying
the mode of entry into three groups, that there are indeed no
significant differences between greenfield, M&A and P&A in terms of
corporate performance (measured by various profitability measures)
and subsequent investment behavior (measured by changes in total
assets). As shown through the case studies, the main reason behind
this result is that at the time of entry, investing multinationals and
target domestic companies employ complex deals, mixing various
modes within a single investment case. Therefore, when the impact
analysis is made at the level of the firm, which is a reasonable thing
to do, it is not surprising to find that there are no differences between
the various modes. Further, sequential investment may take different
forms from the original mode of entry, making it difficult to alienate
economic impact of each part of a single investment deal over time.
An important policy implication of this result is that there is no
Executive Summary

logical foundation to provide tax incentives on the basis of mode of
FDI entry, which assumes that different modes of entry will have
differential economic impact on the host country. The tax incentives for
FDI, which are granted for the FDI of an acquisition of newly issued
stocks, should be changed. Especially, the tax incentives for the FDI in
the mode of P&A should be abolished, because there is no difference
between the modes of P&A and M&A in terms of economic substance.
JEL classification: F21, F23
Key words: FDI, modes of entry, greenfield, M&A, P&A
Dr. Seongbong Lee, a research fellow at the Korea Institute for International
Economic Policy (KIEP), earned his Ph.D. in Business Administration at the
University of Mannheim, Germany. He was a visiting scholar at the Temple
University (USA) and teaches international business at the Ajou University
(Korea) as an adjunct professor. He specializes in international business and
foreign direct investment.
Dr. Mikyung Yun is currently a professor at the Catholic University of
Korea. She received her doctoral degree in Economics from the University of
Oxford and worked as a research fellow at KIEP. Her main field of research
is in applied industrial organization and foreign direct investment. She
currently serves as policy advisor to the Korea Fair Trade Commission and
the Ministry of Foreign Affairs.

Contents
Executive Summary 3
I. Introduction 11
II. Empirical Study 16
1. Classification of FDI by Mode of Entry and the Data Set 16
2. Performance Comparison by Mode of Entry 20
III. Case Studies 27
1. LG Phillips LCD 27
2. BASF Korea 32
IV. Implications and Limitations 38
References 41

Tables
Table 1. Categorization of FDI Modes of Entry 17
Table 2. Distribution of Mode of Entry by Industry 18
Table 3. Summary Statistics 19
Table 4. Two-Sample t-Test with Unequal Variances 22
Table 5. Differential Impact of Modes of Entry on
Subsequent Investment 26

Figures
Figure 1. Financial Performance of LG Philips LCD 31
Figure 2. Financial Performance of BASF Company Ltd 36

Does FDI Mode of Entry Matter for
Economic Performance?:
The Case of Korea
1)Seong‐Bong Lee* and Mikyung Yun**
I. Introduction
The positive spillover effects of FDI (eg through technology transfer,
worker training, and increased competition) for economic development
of a host country are well recognized in the literature.1) Recent
literature on corporate governance also show that foreign ownership,
through better monitoring, improve firm performance of the affiliate
in the host country (Choi and Yoo 2006). This recognition has
increasingly led to liberalization towards foreign direct investment in
developing countries. But, does the positive effect of FDI on
economic development differ by the mode of its entry?
Popular belief, as well as implications from the scholarly literature,
is that greenfield is always good where as M&A is not. The
presumption here is that cross‐border M&A do not contribute to new
capital formation or employment at the time of entry but simply
means a change of ownership from domestic to foreign investor in an
* KIEP E-mail: [email protected]
** Catholic University of Korea E-mail: [email protected]
1) See Lipsey(2002) for a survey of the spillover literatue.
12 Does FDI Mode of Entry Matter for Economic Performance?: The Case of Korea
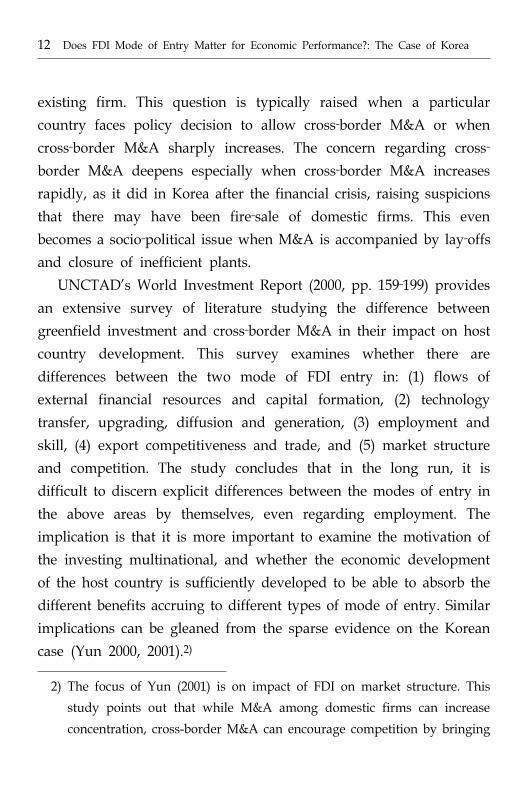
existing firm. This question is typically raised when a particular
country faces policy decision to allow cross‐border M&A or when
cross‐border M&A sharply increases. The concern regarding cross‐border M&A deepens especially when cross‐border M&A increases
rapidly, as it did in Korea after the financial crisis, raising suspicions
that there may have been fire‐sale of domestic firms. This even
becomes a socio‐political issue when M&A is accompanied by lay‐offs
and closure of inefficient plants.
UNCTAD’s World Investment Report (2000, pp. 159‐199) provides
an extensive survey of literature studying the difference between
greenfield investment and cross‐border M&A in their impact on host
country development. This survey examines whether there are
differences between the two mode of FDI entry in: (1) flows of
external financial resources and capital formation, (2) technology
transfer, upgrading, diffusion and generation, (3) employment and
skill, (4) export competitiveness and trade, and (5) market structure
and competition. The study concludes that in the long run, it is
difficult to discern explicit differences between the modes of entry in
the above areas by themselves, even regarding employment. The
implication is that it is more important to examine the motivation of
the investing multinational, and whether the economic development
of the host country is sufficiently developed to be able to absorb the
different benefits accruing to different types of mode of entry. Similar
implications can be gleaned from the sparse evidence on the Korean
case (Yun 2000, 2001).2)
2) The focus of Yun (2001) is on impact of FDI on market structure. This
study points out that while M&A among domestic firms can increase
concentration, cross-border M&A can encourage competition by bringing

I. Introduction 13
The authors re‐examine the mode of entry debate for the Korean
case, and verify if UNCTAD’s conclusions are indeed correct. Authors
feel that this is necessary because first of all, the current government
statistics do not accurately reflect the complex characteristics of
modes of entry involved in cross‐border investment. The only
standard by which the government has categorized mode of entry is
based on whether foreign investor acquires existing stock or newly
issued stock, treating the former as M&A and the latter as greenfield.
The major weakness of this standard is that it puts purchase and
assumption (P&A) into the category of greenfield, even though this
mode of entry resembles M&A more than greenfield. P&A refers to
a case where a company is newly established, but most facilities and
assets are acquired from an existing host country company or
companies. It is a type of M&A through asset purchase but technically,
without involving acquisition of stocks of any existing companies. In
addition, even when part of cash paid in a P&A deal is paid directly
to the selling out owner, rather than invested in the newly incorporated
company, making it indistinguishable from an M&A, the single
investment deal is categorized as greenfield.
Inaccurate categorization makes it impossible to properly assess
in new entrant into the domestic economy, or by preventing an existing
player to exit the market. However, the study warns that while M&A
can seem innocuous at the outset, having neutral impact on market
structure, and facilitating corporate restructuring, through series of
subsequent investment over time, the FDI firm can acquire dominance
and market power, with negative impact on competition. This would be
especially true if the firm was already importing its own goods into the
host country.

14 Does FDI Mode of Entry Matter for Economic Performance?: The Case of Korea
FDI impact by mode of entry. Yet important FDI related policies such
as tax incentives, are based on whether the FDI is greenfield or
M&A. The Foreign Investment Promotion Act promulgates that tax
incentives are given only to greenfield FDI of certain size, and in
preferred industries.3) This rule may be unsound on two grounds.
First, since under the current government classifications P&As are
also greenfield, P&As also receive tax incentives, whether or not this
mode of entry is more akin to M&A in its actual characteristics or
investment motive than greenfield. Therefore, incentives maybe given
to P&As even when all the benefits that is assumed to accrue to
greenfield as opposed to M&As, are not realized.
Second, if there is little difference between modes of entry in
terms of economic impact on the domestic economy as the UNCTAD
reports, then the above rule would be distorting investment
incentives. Greenfield and P&A investment may enjoy incentives and
perform better with tax assistance without necessarily benefiting the
host economy more than M&A investment. In this case, the tax
incentive would be inefficient. Mode of entry should be chosen as a
best response to given economic circumstances rather than to tax
incentives. The policy implication from this empirical verification is
therefore very important. More realistic categorization and impact
assessment is a pre‐requisite to establishing a sound FDI policy.
The main hypothesis of this paper is that there are no differences
between modes of FDI on host country economic development. Since
FDI occurs at the firm level, and corporate performance forms the
micro foundation of the host country’s competitiveness, this paper
3) See Lee 2000 for further details on tax incentives.

I. Introduction 15
considers economic development in terms of corporate performance
and subsequent investment behavior of the FDI firms. In Section 2,
the authors first reclassify the modes of entry through examining as
much circumstantial evidence as possible (including press articles,
annual reports of financial statements of firms and interviews with
corporate personnel actually involved making the deals). Then,
economic performance of greenfield, M&A and P&A groups are
compared through mean significance tests of various performance
variables. A simple regression is also undertaken to assess how the
different modes of entry may affect subsequent investment.
In Section 3, case studies (LG‐.Philips LCD and BASF Company
Ltd) are undertaken to show in detail the complexity of a cross‐border investment deal. The case studies focus on how the modes of
entry is mixed at the time of entry, and how the investment
characteristics change over time as subsequent investment is made. In
addition, the case studies examine the economic contribution of the
two cases in terms of flows of financial resources, global competitiveness,
financial performances, linkage formation and spillover effects to
ascertain what benefits M&As bring, when receiving company and
the economy are able to absorb it.

II. Empirical Study
1. Classification of FDI by Mode of Entry and the Data Set
As explained in the Introduction, the government classification of
mode of entry is basically based on the nature of the stock acquired
by the foreign investor. Acquisition of existing stock is regarded as
M&A, while acquisition of newly issued stock is regarded as
greenfield. If a foreign investor acquires existing assets – whether it
is a part of a firm or a whole firm ‐ and then newly establishes a
legal entity, this would be regarded as greenfield. The 2004
modification of the FDI notification system enables identification of
P&As to a certain extent. Foreign investors are asked to notify the
mode of investment and the motivation of the investment. When the
mode of entry is establishment of new facilities but the motivation is
mergers and acquisition, then this can be presumed to be a P&A.
While this change is welcome, it still does not separate out the P&A
category fully. More importantly, the new classification scheme is
only applied to FDI data from 2004.
In this study, pre 2004 FDI data is reclassified for the first time,
into greenfield, M&A and P&A. As much circumstantial evidence,
including annual corporate financial statements, press articles,
interviews with corporate personnel actually involved in making the
deals, are examined for the reclassification. Table 1 shows the
reclassification criteria. Here, greenfield is taken as those establishing
a new business, making new investment in fixed asset such as
manufacturing facilities and equipment. M&As are those acquiring

II. Empirical Study 17
existing stock and when new stocks are issued by the target firm to
foreign investors. The P&A category is composed of those newly
establishing a company but acquiring existing business operations
and assets of the target firm.
Table 2 shows the data set for this study by mode of entry under
the above classification scheme. The sample consists of top 101 FDI
firms by investment amount. FDI here means that equity share of the
majority holding foreign investor exceeds 10% of total equity. This is
a small sample, representing only 6.41% of total number of
manufacturing FDI firms (1,778 firms) listed in the database of Korea
Investment Services Co (KIS). However, by amount, the sample totals
14.9 billion US dollars, which represents 72% of the total of the firms
listed in the above KIS database. Of these, there are 49 Greenfield
cases (48.5%), 25 M&A (24.75%) and 27 P&A cases (26.73%).
Table 1. Categorization of FDI Modes of Entry
Greenfield
investmentPurchase and Assumption (P&A)
Mergers and
Acquisition (M&A)
The company was
newly established.
Most facilities and
assets of the firm
were also newly
established with
new foreign
capital.
The company was newly established,
but most facilities and assets were
acquired from an existing Korean
company or companies. It is a type
of mergers and acquisitions (M&A)
through asset purchase but without
acquisition of stocks of any existing
company.
The company became
a foreign invested
enterprise through
acquisition of stocks
of an existing Korean
firm or when new
stocks are issued by
the target firm to
foreign investors
18 Does FDI Mode of Entry Matter for Economic Performance?: The Case of Korea
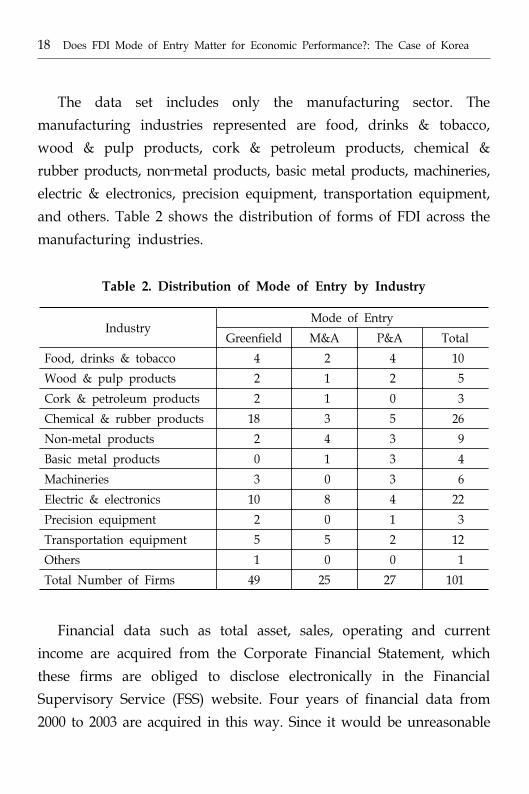
The data set includes only the manufacturing sector. The
manufacturing industries represented are food, drinks & tobacco,
wood & pulp products, cork & petroleum products, chemical &
rubber products, non‐metal products, basic metal products, machineries,
electric & electronics, precision equipment, transportation equipment,
and others. Table 2 shows the distribution of forms of FDI across the
manufacturing industries.
Financial data such as total asset, sales, operating and current
income are acquired from the Corporate Financial Statement, which
these firms are obliged to disclose electronically in the Financial
Supervisory Service (FSS) website. Four years of financial data from
2000 to 2003 are acquired in this way. Since it would be unreasonable
Table 2. Distribution of Mode of Entry by Industry
IndustryMode of Entry
Greenfield M&A P&A Total
Food, drinks & tobacco 4 2 4 10
Wood & pulp products 2 1 2 5
Cork & petroleum products 2 1 0 3
Chemical & rubber products 18 3 5 26
Non-metal products 2 4 3 9
Basic metal products 0 1 3 4
Machineries 3 0 3 6
Electric & electronics 10 8 4 22
Precision equipment 2 0 1 3
Transportation equipment 5 5 2 12
Others 1 0 0 1
Total Number of Firms 49 25 27 101

II. Empirical Study 19
to expect foreign investment to yield profits immediately after the
investment, especially in the case of Greenfield, performance of these
firms cannot be compared to firms that received investment much
earlier. Therefore, firms that received FDI after 2000 were not
included in the sample. Of these 101 firms, 10 firms whose financial
data were judged to be unreliable were further dropped from the
Table 3. Summary Statistics
Greenfield
VariableNo. of
observationMean Std. Dev.
Operating Income/Sales 44 0.190 0.544
Current Income/Sales 44 0.083 0.401
Net Profit After Tax/Sales 44 0.063 0.309
Total Asset Growth 41 14.27 12.24
M&A
VariableNo. of
observationMean Std. Dev.
Operating Income/Sales 21 0.022 0.142
Current Income/Sales 21 0.015 0.136
Net Profit After Tax/Sales 21 0.028 0.090
Total Asset Growth 21 14.51 10.63
P&A
VariableNo. of
observationMean Std. Dev.
Operating Income/Sales 26 0.043 0.087
Current Income/Sales 26 0.017 0.155
Net Profit After Tax/Sales 26 0.005 0.256
Total Asset Growth 26 8.17 10.32

20 Does FDI Mode of Entry Matter for Economic Performance?: The Case of Korea
sample for statistical analysis4), yielding a total of 91 firms and 364
observations for analysis.
Table 3 shows summary statistics of important measures used in
the analysis. It is notable that the M&A group on average, are
showing positive current income and net profit rates compared to
greenfield and P&A.
2. Performance Comparison by Mode of Entry
In this section, the performances of the three FDI groups are
compared, to see if there is any difference between them by
characteristics of mode of entry. The main performance variables
compared are the three profit rates operating income to sales, current
income to sales, and net profit after tax to sales. Operating income to
sales assesses the performance of day to day operations (manufacturing
and marketing) of the company. Current income to sales assesses the
overall performance of the company including financial activities in
addition to manufacturing and marketing. Net profit after tax to sales
assesses overall profitability of the company. A non‐profit related
performance variable is total asset growth. Since FDI is important for
capital formation, this variable assesses whether different mode of
entry results in different levels of total assets.
4) For example, for one of these firms, the total asset growth from the
previous year recorded more than 90,000%. The anomaly seems to have
arisen because most of them received foreign investment for the first
time only in 2000, and some of them had gone through M&As in stages,
making it difficult to trace many of the financial variables accurately. Of
these, six are Greenfield, three M&As and one P&A.

II. Empirical Study 21
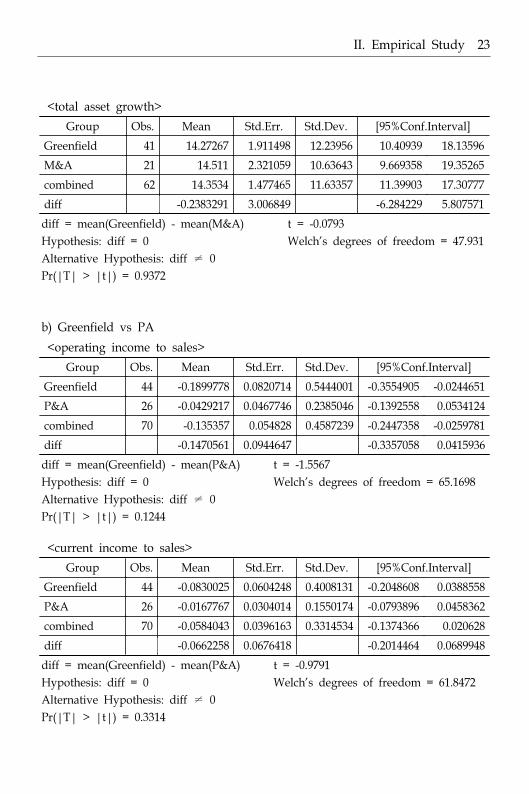
Table 4 shows whether group mean profit rates and total assets of
the three modes of entry are significantly different from each other.
The compared group means are calculated by first taking the
difference of the firm’s profit rates or total asset from industry
average, and then averaging profit rates and total asset growth over
the four years from 2000 to 2003. Difference from industry average is
taken to account for any common industry‐wide shock since
performance may vary depending on which industry the firm
belongs to. Averaging over time is undertaken to smooth out any
peculiarities occurring in a given year. Industry average data is
acquired from Financial Statement Analysis published annually by the
Bank of Korea.
Table 4a) compares Greenfield and M&A. Assuming unequal
variance of the two groups, the results show that mean operating
income and net profit after tax to sales ratios between the two groups
are significantly different at 10% (mean of M&A is higher) but mean
current income to sales ratio is not significantly different. Likewise,
there are no significant differences between the groups in mean total
asset growth. Table 4b) shows that Greenfield and P&A do not show
any statistically significant difference in mean profit rates, in whatever
way they are measured. However, Greenfield shows significantly
higher mean total asset growth. Likewise, when M&A and P&A (see
Table 4c)) are compared, the two groups do not show any significant
difference in any of the mean profitability rates, but M&A show
significantly greater mean total asset growth.

22 Does FDI Mode of Entry Matter for Economic Performance?: The Case of Korea
Table 4. Two-Sample t-Test with Unequal Variances
a) Greenfield vs MA
<operating income to sales>
Group Obs. Mean Std.Err. Std.Dev. [95% Conf.Interval]
Greenfield 44 -0.1899778 0.0820714 0.5444001 -0.3554905 -0.0244651
M&A 21 -0.0216607 0.0310332 0.1422119 -0.0863948 0.0430734
combined 65 -0.1355984 0.0570745 0.4601492 -0.2496178 -0.021579
diff -0.1683171 0.0877426 -0.3441988 0.0075646
diff = mean(Greenfield) - mean(M&A)
Hypothesis: diff = 0
Alternative Hypothesis: diff ≠ 0
Pr(|T| > |t|) = 0.0603
t = -1.9183
Welch's degrees of freedom = 54.4284
<current income to sales>
Group Obs. Mean Std.Err. Std.Dev. [95% Conf.Interval]
Greenfield 44 -0.0830025 0.0604248 0.4008131 -0.2048608 0.0388558
M&A 21 0.0155274 0.0296947 0.1360784 -0.0464148 0.0774695
combined 65 -0.0511698 0.0422229 0.3404122 -0.1355198 0.0331803
diff -0.0985298 0.0673271 -0.2332056 0.0361459
diff = mean(Greenfield) - mean(M&A)
Hypothesis: diff = 0
Alternative Hypothesis: diff ≠ 0
Pr(|T| > |t|) = 0.1486
t = -1.4634
Welch's degrees of freedom = 59.9674
<net profit after tax to sales>
Group Obs. Mean Std.Err. Std.Dev. [95%Conf.Interval]
Greenfield 44 -0.0629187 0.0466872 0.309688 -0.1570725 0.0312351
M&A 21 0.0285287 0.0195873 0.0897601 -0.0123296 0.0693871
combined 65 -0.0333741 0.032537 0.2623215 -0.0983742 0.0316259
diff 0.0914474 0.0506296 -0.1928499 0.009955
diff = mean(Greenfield) - mean(M&A)
Hypothesis: diff = 0
Alternative Hypothesis: diff ≠ 0
Pr(|T| > |t|) = 0.0762
t = -1.8062
Welch's degrees of freedom = 56.5267
II. Empirical Study 23
<total asset growth>
Group Obs. Mean Std.Err. Std.Dev. [95%Conf.Interval]
Greenfield 41 14.27267 1.911498 12.23956 10.40939 18.13596
M&A 21 14.511 2.321059 10.63643 9.669358 19.35265
combined 62 14.3534 1.477465 11.63357 11.39903 17.30777
diff -0.2383291 3.006849 -6.284229 5.807571
diff = mean(Greenfield) - mean(M&A)
Hypothesis: diff = 0
Alternative Hypothesis: diff ≠ 0
Pr(|T| > |t|) = 0.9372
t = -0.0793
Welch's degrees of freedom = 47.931
b) Greenfield vs PA
<operating income to sales>
Group Obs. Mean Std.Err. Std.Dev. [95%Conf.Interval]
Greenfield 44 -0.1899778 0.0820714 0.5444001 -0.3554905 -0.0244651
P&A 26 -0.0429217 0.0467746 0.2385046 -0.1392558 0.0534124
combined 70 -0.135357 0.054828 0.4587239 -0.2447358 -0.0259781
diff -0.1470561 0.0944647 -0.3357058 0.0415936
diff = mean(Greenfield) - mean(P&A)
Hypothesis: diff = 0
Alternative Hypothesis: diff ≠ 0
Pr(|T| > |t|) = 0.1244
t = -1.5567
Welch's degrees of freedom = 65.1698
<current income to sales>
Group Obs. Mean Std.Err. Std.Dev. [95%Conf.Interval]
Greenfield 44 -0.0830025 0.0604248 0.4008131 -0.2048608 0.0388558
P&A 26 -0.0167767 0.0304014 0.1550174 -0.0793896 0.0458362
combined 70 -0.0584043 0.0396163 0.3314534 -0.1374366 0.020628
diff -0.0662258 0.0676418 -0.2014464 0.0689948
diff = mean(Greenfield) - mean(P&A)
Hypothesis: diff = 0
Alternative Hypothesis: diff ≠ 0
Pr(|T| > |t|) = 0.3314
t = -0.9791
Welch's degrees of freedom = 61.8472

24 Does FDI Mode of Entry Matter for Economic Performance?: The Case of Korea
<net profit after tax to sales>
Group Obs. Mean Std.Err. Std.Dev. [95%Conf.Interval]
Greenfield 44 -0.0629187 0.0466872 0.309688 -0.1570725 0.0312351
P&A 26 -0.004693 0.0229682 0.1171154 -0.0519969 0.042611
combined 70 -0.041292 0.0305989 0.2560088 -0.1023351 0.0197511
diff -0.0582257 0.0520311 -0.16226 0.0458085
diff = mean(Greenfield) - mean(P&A)
Hypothesis: diff = 0
Alternative Hypothesis: diff ≠ 0
Pr(|T| > |t|) = 0.2675
t = -1.1191
Welch's degrees of freedom = 61.2438
<total asset growth>
Group Obs. Mean Std.Err. Std.Dev. [95%Conf.Interval]
Greenfield 41 14.27267 1.911498 12.23956 10.40939 18.13596
P&A 26 8.172354 2.023552 10.31813 4.00477 12.33994
combined 67 11.90539 1.445994 11.83597 9.018365 14.79241
diff 6.10032 2.783629 0.5358361 11.6648
diff = mean(Greenfield) - mean(P&A)
Hypothesis: diff = 0
Alternative Hypothesis: diff ≠ 0
Pr(|T| > |t|) = 0.0322
t = 2.1915
Welch's degrees of freedom = 61.9498
c) MA vs PA
<operating income to sales>
Group Obs. Mean Std. Err. Std. Dev. [95% Conf.Interval]
M&A 21 -0.0216607 0.0310332 0.1422119 -0.0863948 0.0430734
P&A 26 -0.0429217 0.0467746 0.2385046 -0.1392558 0.0534124
combined 47 -0.0334221 0.0291083 0.1995564 -0.092014 0.0251699
diff 0.021261 0.0561331 -0.0919237 0.1344457
diff = mean(M&A) - mean(P&A)
Hypothesis: diff = 0
Alternative Hypothesis: diff ≠ 0
Pr(|T| > |t|) = 0.7067
t = 0.3788
Welch's degrees of freedom = 43.2428

II. Empirical Study 25
<current income to sales>
Group Obs. Mean Std. Err. Std. Dev. [95% Conf. Interval]
M&A 21 0.0155274 0.0296947 0.1360784 -0.0464148 0.0774695
P&A 26 -0.0167767 0.0304014 0.1550174 -0.0793896 0.0458362
combined 47 -0.002343 0.0213255 0.1462004 -0.045269 0.0405831
diff 0.032304 0.0424973 -0.0532042 0.1178123
diff = mean(M&A) - mean(P&A)
Hypothesis: diff = 0
Alternative Hypothesis: diff ≠ 0
Pr(|T| > |t|) = 0.4510
t = 0.7601
Welch's degrees of freedom = 46.6966
<net profit after tax to sales>
Group Obs. Mean Std. Err. Std. Dev. [95% Conf. Interval]
M&A 21 0.0285287 0.0195873 0.0897601 -0.0123296 0.0693871
P&A 26 -0.004693 0.0229682 0.1171154 -0.0519969 0.042611
combined 47 0.0101508 0.0154617 0.1060004 -0.0209721 0.0412736
diff 0.0332217 0.0301861 -0.0275101 0.0939536
diff = mean(M&A) - mean(P&A)
Hypothesis: diff = 0
Alternative Hypothesis: diff ≠ 0
Pr(|T| > |t|) = 0.2767
t = 1.1006
Welch's degrees of freedom = 46.846
<total asset growth>
Group Obs. Mean Std. Err. Std. Dev. [95% Conf.Interval]
M&A 21 14.511 2.321059 10.63643 9.669358 19.35265
P&A 26 8.172354 2.023552 10.31813 4.00477 12.33994
combined 47 11.00452 1.579093 10.82572 7.825967 14.18307
diff 6.338649 3.079299 0.1340723 12.54323
diff = mean(M&A) - mean(P&A)
Hypothesis: diff = 0
Alternative Hypothesis: diff ≠ 0
Pr(|T| > |t|) = 0.0455
t = 2.0585
Welch's degrees of freedom = 44.3396
This supports the hypothesis that there is little difference between
the three modes of entry. Indeed, the results show that M&A firms

26 Does FDI Mode of Entry Matter for Economic Performance?: The Case of Korea
do not necessarily perform worse than Greenfield or P&A firms, and
seems to contribute to capital formation more than P&A. P&A firms
do not show any advantage in profitability, even though they receive
tax reduction and other financial incentives whereas M&A firms have
assumed all the risks associated with the target firms.
Table 5 shows the relationship between foreign investment and
investment in total assets post the first entry of the foreign investor
through a simple OLS regression. The explained variable is year on
year change in total assets and the explanatory variables are FDI
representing the proportion of foreign equity share in the firm, and two
dummies representing M&A and P&A firms. The result shows that
foreign investment is positively associated with subsequent investment
in total asset. Obviously R2 is very low, implying that there are many
other factors influencing a firm’s investment behavior. However, the
variables are jointly significant. M&A do not seem to influence
subsequent investment significantly, whereas P&A had a significantly
negative effect on subsequent investment. The constant, which reflects
the influence of greenfield is positive and significant. This result is in
conformance with the result of the mean difference tests above.
Table 5. Differential Impact of Modes of Entry on
Subsequent Investment
Asset Growth Coef. Std. Err. t P>|t| [95% Conf. Interval]
FDI Ratio 0.0757036 0.0425147 1.78 0.076 -0.0080163 0.1594235
M&A 1.629554 2.778 0.59 0.558 -3.840887 7.099995
P&A -6.265545 2.390407 -2.62 0.009 -10.97274 -1.558352
Constant (Greenfield) 0.1587296 3.917927 0.04 0.968 -7.556458 7.873917

III. Case Studies
1. LG Phillips LCD
1) Was it Greenfield or M&A Investment?
LG Philips LCD Co. was established through a joint‐venture
contract between LG Electronics and Philips in 1999. This company
was not newly established: it was renamed from LG LCD after the JV
contract. In 1998, LG LCD was split from LG Electronics. After a half
year of negotiation, the two partners, LG and Philips, agreed on the
Philips’ payment of 1.6 billion US dollars for 50% of shares of the
newly established venture named LG Philips LCD. Of this payment,
1 billion US dollars went directly to LG Electronics, and the rest
flowing into LG Philips LCD in the form of issuing new stocks
valued at 600 million US dollars
Considering the transaction and flows of funding for acquiring
new stocks of LG Philips LCD (50% of its shares), the investment of
Phillips can be seen as a mixed form of cross‐border M&A and
greenfield investment. The part of the deal where Philips paid one
billion US dollars directly to LG Electronics has attributions of an
M&A investment, while the part where 600 million US dollars paid
to acquire the newly issued stocks of LG Philips LCD for acquiring
its newly issued stocks means that this can be possibly classified as
a greenfield investment. Actually, LG Philips LCD was classified as a
greenfield investment by the Korean government, which allowed 10‐year tax incentives (50% for the first 7 years and 25% for the
28 Does FDI Mode of Entry Matter for Economic Performance?: The Case of Korea
following years) to this company.5) The M&A part of the deal did not
enter into any government statistics, indicating that this may be one
reason why statistics tend to under‐estimate the extent of cross‐border
M&As in Korea.
2) Economic Contributions of Investment from Phillips
(1) Financial resources and investment
The one billion US dollars in cash that LG Electronics received was
used to improve the financial structure of LG Electronics. Since LG
Electronics, along with LG Chemicals, was a core company of the LG
Group, the improvement in the financial structure of LG Electronics
remarkably contributed to the financial stability of the LG Group as a
whole. Also at that time, LG Electronics was in a position where it had
to make continuous investment in the LCD business to secure
competitiveness in this field, The 600 million US dollars provided by
Philips and the subsequent investments of LG Philips LCD resolved
the difficulty of fund raising at the time of financial distress
(2) Global competitiveness
LG has its beginnings in home appliances and semi‐conductors
and became a renowned world player in these fields. LG focused on
home appliances and semi‐conductors until the mid‐1990’s. Since
then, it began to promote its strategic business in the LCD field in an
effort to rise in the world market as a global electronics company. It
was successful in accumulating sufficient LCD manufacturing techniques
5) Financial Statements of LG Phillips LCD <http://dart.fss.or.kr>.

III. Case Studies 29
to compete with Japanese incumbent firms and those entering the
business after its entry.
However, LG management was well aware that it could not
achieve global competitiveness simply because it had advanced LCD
manufacturing technologies. It needed a brand name in this field, and
this, Philips had. Philips, globally competitive in terms of brand
power, basic technical expertise, and global network for distribution
was the best strategic alliance partner for LG. On the other hand,
even though Philips had the world‐renowned technical expertise in
the electronics field, it didn’t have any globally recognized number
one product. Accordingly, Philips hoped to build up a global number
‐one product brand image through cooperation with LG, which
already had mass production arrangements and advanced technologies.
LG suggested “Single One = World Number One” cooperation model
to Philips (Lee, Yun & Lee, 2000). Both companies were sure of
mutual benefits from a strategic alliance with capital commitments.
(3) Financial Performances
The alliance of the two companies resulted in reinforcing global
competitiveness of both companies through a successful fundraising
for the LG Philips LCD. In July 2004, LG Philips LCD was able to
raise one billion US dollars as it was listed on the stock exchange in
New York and Seoul. After being listed, both companies’ share
became 45:45 and the remaining 10% of shares were dispersed to
investors in Korea and the U.S.
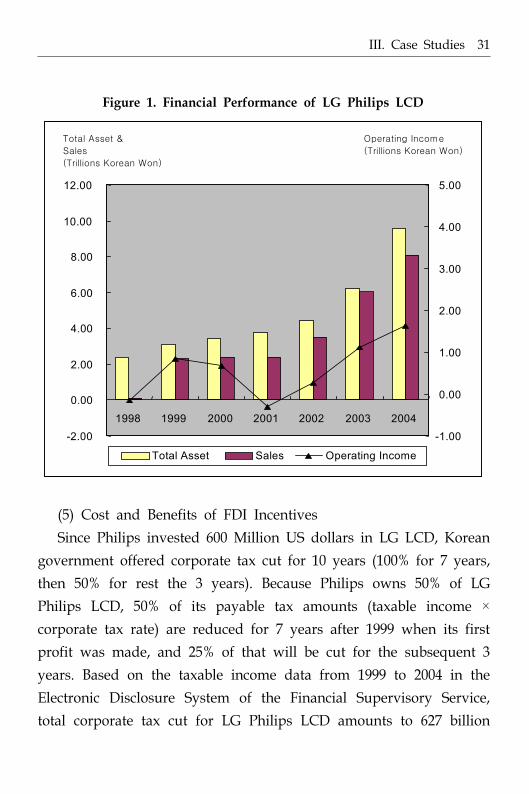
Since 1999, when the investment from Philips was made, the
performance of the LCD business has improved. With total sales of
8.1 trillion Korean won and net profit after tax of 1.65 trillion won in

30 Does FDI Mode of Entry Matter for Economic Performance?: The Case of Korea
2004, which is a 251.5% increase from 2.3 trillion won and a 168%
increase from 0.6 trillion won in 1999, respectively. Also, total assets
increased to 9.6 trillion won in 2004 from 3.1 trillion won in 1999,
and the debt to equity ratio decreased from 234% in 1998 to 71% in
1999, and then to 66.28% in 2004.
(4) Linkage and spillover effects
The linkage and spillover effects from investments of LG Philips
LCD are potentially large. Its major investment is the construction of
the 7th
generation LCD line plant for the mass production of 42 and
47 inch LCD in Paju City in 2004. The company is planning to
establish other plants following this 7th generation plant, which will
be completed in 2006. Along with the plants of LG Phillips LCD, a
giant LCD display cluster has emerged in Paju City. Other foreign
investors have followed suit, and many Korean small‐medium
enterprises have located here to benefit from business with the
foreign investors.
For example, LG Philips LCD and Nippon Electric Glass jointly
founded the Paju Electric Glass Co. Ltd. with a start‐up capital of 36
billion won in a 40 to 60 participation ratio of the two parties,
respectively. The LCD glass plant is in the process of being
constructed. In addition, three foreign manufacturers of LCD parts
are negotiating an MOU with the Korean government to invest in
Paju Display Cluster. Meanwhile, around 40 Korean companies in
LCD parts and equipments have also decided to invest in the cluster,
and have made some progress towards building their plants.
According to a government official of Paju City, 35,000 new jobs are
expected to be created when this cluster is completed by 2008.
III. Case Studies 31
(5) Cost and Benefits of FDI Incentives
Since Philips invested 600 Million US dollars in LG LCD, Korean
government offered corporate tax cut for 10 years (100% for 7 years,
then 50% for rest the 3 years). Because Philips owns 50% of LG
Philips LCD, 50% of its payable tax amounts (taxable income ×
corporate tax rate) are reduced for 7 years after 1999 when its first
profit was made, and 25% of that will be cut for the subsequent 3
years. Based on the taxable income data from 1999 to 2004 in the
Electronic Disclosure System of the Financial Supervisory Service,
total corporate tax cut for LG Philips LCD amounts to 627 billion
Figure 1. Financial Performance of LG Philips LCD
-2.00
0.00
2.00
4.00
6.00
8.00
10.00
12.00
1998 1999 2000 2001 2002 2003 2004-1.00
0.00
1.00
2.00
3.00
4.00
5.00
Total Asset Sales Operating Income
Operating Income
(Trillions Korean Won)
Total Asset &
Sales
(Trillions Korean Won)
-2.00
0.00
2.00
4.00
6.00
8.00
10.00
12.00
1998 1999 2000 2001 2002 2003 2004-1.00
0.00
1.00
2.00
3.00
4.00
5.00
Total Asset Sales Operating Income
Operating Income
(Trillions Korean Won)
Total Asset &
Sales
(Trillions Korean Won)
32 Does FDI Mode of Entry Matter for Economic Performance?: The Case of Korea
won (around 500 million US dollars), which was calculated from the
application of 50% reduction in the Korean corporate tax rate ((30.8%
for 1999, 2000, 2001 and 29.7% for 2002, 2003, 2004) with the taxable
income of each year. LG Philips LCD can still enjoy tax cuts for the
remaining four years.
The incentives offered by the Korean government can be assessed
to be successful only if the benefits accruing to the 1.6 billion US
dollars investment of Philips to the Korean economy exceeds the total
amount of taxes exempted. This case study cannot provide a
numerical estimation evaluating the benefits from the investment of
Philips. However, it can offer some insights as to what factors should
be considered for such an estimation. The benefits should include
50% of total value added directly created by LG Philips LCD, value
added created by 1 billion US dollars transferred from Philips to LG
Electronics, the part of additional future cash flow of LG Philips LCD
that would be possible if the company gains higher global
competitiveness through this strategic alliance, and backward linkage
and other spillover effects within and beyond the Paju Display
Cluster site.
2. BASF Korea
1) Can All of BASF’s Investment be Classified into a Single Mode of
Entry?
BASF is a German multinational corporation producing around
9,000 kinds of chemicals throughout its facilities in more than 40
countries worldwide. BASF started trade with Korea in 1954 through

III. Case Studies 33
FOHAG (Far East Trading Company) and made its first direct
investment in Korea through the establishment of Hyosung BASF, the
50:50 joint venture with Hyosung Group. In 1982, it established a
100% subsidiary named BASF Korea, then in 1988, it again founded
Hanyang BASF Urethane (later Hanwha‐BASF Urethane), a 50:50 joint
venture with Hanyang Group. Before the financial crisis in Korea,
BASF had continuously expanded facilities and investments in these
three companies in the form of greenfield investment.
After the financial crisis, however, the investment by BASF
showed a mixed form of M&A and greenfield investment. In 1998,
BASF completed 4 giant M&A transactions. It purchased shares of the
two joint venture partners, Hyosung and Hanwha for 64 billion won
(about 42 million US$) and 100 billion won (about 65 million US
dollars) respectively. Also, BASF purchased the lysine business unit
from Daesang at 900 billion won (600 million US dollars). At that
time, Daesang made huge profits (annually 80 billion KW in net
profit) from this lysine business, enjoying around 20% of the world
market share. In December 1998, BASF acquired the polyol business
unit from Dongsung Chemicals at 11.1 billion won (7 million US
dollars). After these four M&As, all Korean subsidiaries of BASF
were merged into a single entity, BASF Company Ltd., which is a
wholly owned subsidiary. Furthermore, in November 2000, BASF
acquired 1,450 shares of Hanwha Petrochemicals at the cost of 120
billion won (110 million US dollars) to get stable supply of raw
materials. In June 2001, it also acquired a styrene monomer (SM)
plant from SK Group at the cost of 169 billion (130 million US
dollars).
In addition to the above mentioned M&As undertaken after the
34 Does FDI Mode of Entry Matter for Economic Performance?: The Case of Korea
crisis, BASF has continued to carry out large‐scale greenfield
investments by expanding the old plants and constructing new
plants. Investing 60 billion KW, it established a Vitamin B2 production
facility in Kunsan City. Also, it expanded its Ulsan and Yeochun
facilities at a cost of more than 120 billion won. In 2000, 400 million
US dollars was invested to embark on the construction of a
toluenediisocyanate (TDI) plant, which was completed by the end of
2003. The Korean government provided a 10‐year tax incentive for
this investment.
As we have seen above, parts of BASF’s investments are classified
as greenfield investment while others took the form of cross‐border
M&A. All these investments, however, are now registered under one
umbrella of the BASF Company Ltd. in Korea, regardless of their
different modes of entry. Therefore, it is impossible to classify 25
years of investment by BASF sharply into either greenfield or cross‐border M&A. It would be more important to understand how the
company evolved, and to interpret each investment of BASF as a sign
of its commitment to the Korean economy, while also taking
advantage of the resources available in Korea, including tax
exemptions and FDI regime liberalization.
2) Economic Contributions of Investment from BASF
(1) Financial resources and investment
BASF have invested more than 2.2 billion US dollars in Korea
since its first investment in 1980. About 50% of the total amount can
be considered to be greenfield investment and the other 50% as
M&A. At the time of the financial crisis, most M&A funds flowed

III. Case Studies 35
into the Korean partners or other companies having liquidity
problems. Significant amount of funds from greenfield investment by
BASF also went to Korean construction enterprises that participated
in factory construction. Even though BASF has experienced declining
demand worldwide recently, it is still planning to increase its
investment in Korea.
(2) Motivations of Investment
High skilled labor force seems to be the main reason behind
BASF’s investmet into Korea. One of the executives of BASF
headquarter said “Korea has abundant high‐quality human resources.
Although the labor cost increases fast, we are planning to increase
our investment. The chemical industry in Korea is well developed,
and many high‐skilled workers are available.”6) BASF’s increasing
investment focused mainly on achieving vertical integration and scale
of economies in Korea. The expansion strategy of BASF and Korea’s
developed chemical industry and high‐quality workers matches well.
(3) Financial Performances
When comparing the financial performances of 2004 with those of
1999, when major M&A investments were made, one notices that all
the numbers in the financial statements have been getting better. The
total assets and sales have increased from 753 and 784 billion won in
1999 to 1.45 and 1.96 trillion won in 2004 respectively, due to the
consistent increase of investments. Operating income increased
dramatically to 91.7 billion won in 2004 from 20 billion won in 1999,
6) Hankyung Daily News, July 22, 2002.

36 Does FDI Mode of Entry Matter for Economic Performance?: The Case of Korea
while net profit after tax increased by 184% to 47.8 billion won in
2004, from 16.8 billion won in 1999. This shows that M&A investment
by BASF has helped greatly in bringing around its illiquid partners.
(4) Job Security
One of economic performances of BASF Company Ltd. was that it
kept all the employees of acquired Korean companies without lay‐offs, even after merging all subsidiaries into one company in 1999.
The fundamental reason behind this was that BASF was still under
Figure 2. Financial Performance of BASF Company Ltd
0
200
400
600
800
1000
1200
1400
1600
1800
2000
1999 2000 2001 2002 2003 20040
10
20
30
40
50
60
70
80
90
100
Total Asses Sales Operating Income
Operating Income(Billion Korean Won)
Total Asset & Sales(Billion Korean Won)
0
200
400
600
800
1000
1200
1400
1600
1800
2000
1999 2000 2001 2002 2003 20040
10
20
30
40
50
60
70
80
90
100
Total Asses Sales Operating Income
Operating Income(Billion Korean Won)
Total Asset & Sales(Billion Korean Won)
III. Case Studies 37
an expansionary process through greenfield investment at the same
time as it was pursuing restructuring of the acquired firm.
(5) Linkage and spillover effects
The fact that BASF has vertically integrated many related
manufacturing process in house could lead to an underestimation of
linkage formation and spillover effects in the Korean economy due to
its. However, the chemical industry is known to have a high level of
forward and backward linkage structure, and it is hoped that BASF’s
investment will be effective in upgrading the Korean chemical
industry. Its environment‐friendly management would especially
change the image of chemical industry as a polluter industry. In
addition, considering that 40% of BASF Company Ltd’s sale is
exported, it could be said that BASF has made a great contribution in
improving Korea’s export competitiveness in the chemical industry.

IV. Implications and Limitations
This paper attempted to empirically test the proposition that
unlike the typical concern against M&A, there is little difference in
firm performance by modes of FDI entry. If this is the case, there is
no reason to prefer other modes of entry over M&A. The major
contribution of this paper is that it calls into question the current
classification scheme of mode of FDI entry, on which government tax
incentives are based. This paper corrects for this, reclassifying the
modes of entry through detailed analysis of each investment case to
reflect as much as possible actual complexity of the cross border
investment deal.
The empirical part of this paper confirms, even after reclassifying
the mode of entry into three groups, that there are indeed no
significant differences between greenfield, M&A and P&A in terms of
corporate performance (measured by various profitability measures)
and subsequent investment behavior (measured by changes in total
assets). As shown through the case studies, the main reason behind
this result is that at the time of entry, investing multinationals and
target domestic companies employ complex deals, mixing various
modes within a single investment case. Therefore, when the impact
analysis is made at the level of the firm, which is a reasonable thing
to do, it is not surprising to find that there are no differences
between the various modes. Further, sequential investment may take
different forms from the original mode of entry, making it difficult to
alienate economic impact of each part of a single investment deal
over time.

IV. Implications and Limitations 39
An important policy implication of this result is that there is no
logical foundation to provide tax incentives on the basis of mode of
FDI entry, which assumes that different modes of entry will have
differential economic impact on the host country. The tax incentives
for FDI, which are granted for the FDI of an acquisition of newly
issued stocks, should be changed. Especially, the tax incentives for
the FDI in the mode of P&A should be abolished, because there is no
difference between the modes of P&A and M&A in terms of
economic substance.
The major limitation of this study is that although it includes most
of the large FDI cases, the sample size is quite small. Another data
limitation is that due to lack of data on employment and depreciation,
better measures of firm performance, such as value added or
productivity could not be calculated. Profitability measures tend to be
very noisy, and changes in total assets may not fully reflect all the
contributions of an FDI firm. The case studies partially supplements
for this inadequacy, but the case studies only examined the successful
cases. It is also possible that performance of the foreign invested
firms depend on when the first FDI was made. The longer the
presence of the foreign investor, the greater the adjustment made to
local conditions and greater the involvement in the domestic economy.
For example, FDI firms can become more used to domestic institutions,
ways of doing business and cooperate better with domestic business
partners such as suppliers, the longer they have operated in Korea. In
future studies, this aspect could be taken into account by considering
years of presence of the particular foreign investor.
In addition, this dataset includes only the foreign invested firms – i.e., the local affiliates of the MNEs. From this, it is difficult to

40 Does FDI Mode of Entry Matter for Economic Performance?: The Case of Korea
measure the general spillover effect on the performance of purely
domestic firms at large. For example, the results do not answer such
questions as does FDI lead to productivity improvement not only in
the firm where FDI occurs directly occurs, but also in other domestic
Korean firms through technology transfer, demonstration effect and
increased competition and does such effect matter by mode of entry?
Augmenting the sample size, refining variables and data to reflect the
degree of involvement of the FDI firms and to measure economic
impact in foreign invested firms as well as purely domestic firms,
and including case studies of failures, are left for future research.

References
Choi, Jongmoo Jay, and Yoo, Sehyun. 2005. “Foreign equity investment and
firm performance.” Working Paper. Korea Institute for International
Economic Policy.
Financial Statements. 114 FDI firms. http://dart.fss.or.kr.
Hankyung Daily News. 2002 (July 22)
Lee, Seongbong. 2001. “Tax Benefits Analysis of Incentives for Foreign Direct
Investment in Korea.” International Tax Review, Vol. 19, No. 12, pp.
396-401.
Lee, Seongbong, Mikyung Yun and Donggi Lee. 2000. Promotion Policy for
Cross-border M&A in Korea. KIEP Report to the Ministry of Commerce,
Industry and Energy. (Korean)
Lipsey, R. E. 2002. “Home and Host Country Effects of FDI.” Working Paper
9293. NBER.
UNCTAD. 2000. World Investment Report 2000: Cross-border Mergers and
Acquisitions and Development. New York and Geneva: United Nations.
Yun, Mikyung. 2000. “Cross-border M&As and their impact on the Korean
economy.” Paper presented at the UNCTAD Seminar on Cross-border
M&As and Sustained Competitiveness in Asia: Trends, Impacts and
Policy Implications (Bangkok, 9-10 March), mimeo.
. 2001. “Impact of FDI on Competition in Korean Manufacturing
Industries: 1991-97.” Journal of International Economic Policy Studies, No
2, pp. 111-140.
01-01 Does the Gravity Model Fit Korea’s Trade Patterns?
Implications for Korea’s FTA Policy and North-South Korean Trade
Chan-Hyun Sohn and Jinna Yoon
01-02 Impact of China’s Accession to the WTO and Policy Implications for
Asia-Pacific Developing Economies Wook Chae and Hongyul Han
01-03 Is APEC Moving Towards the Bogor Goal?
Kyung Tae Lee and Inkyo Cheong
01-04 Impact of FDI on Competition: The Korean Experience
Mikyung Yun and Sungmi Lee
01-05 Aggregate Shock, Capital Market Opening, and Optimal Bailout
Se-Jik Kim and Ivailo Izvorski
02-01 Macroeconomic Effects of Capital Account Liberalization: The Case of Korea
Soyoung Kim, Sunghyun H. Kim, and Yunjong Wang
02-02 A Framework for Exchange Rate Policy in Korea
Michael Dooley, Rudi Dornbusch, and Yung Chul Park
02-03 New Evidence on High Interest Rate Policy During the Korean Crisis
Chae-Shick Chung and Se-Jik Kim
02-04 Who Gains Benefits from Tax Incentives for Foreign Direct Investment
in Korea? Seong-Bong Lee
02-05 Interdependent Specialization and International Growth Effect of Geographical
Agglomeration Soon-chan Park
02-06 Hanging Together: Exchange Rate Dynamics between Japan and Korea
Sammo Kang, Yunjong Wang, and Deok Ryong Yoon
02-07 Korea's FDI Outflows: Choice of Locations and Effect on Trade
List of KIEP Publications (2001~2006. 8)
A list of all KIEP publications is available at: http://www.kiep.go.kr.
■ Working Papers
Chang-Soo Lee
02-08 Trade Integration and Business Cycle Co-movements: the Case of Korea with
Other Asian Countries Kwanho Shin and Yunjong Wang
02-09 A Dynamic Analysis of a Korea-Japan Free Trade Area: Simulations with the
G-Cubed Asia-Pacific Model
Warwick J. McKibbin, Jong-Wha Lee, and Inkyo Cheong
02-10 Bailout and Conglomeration Se-Jik Kim
02-11 Exchange Rate Regimes and Monetary Independence in East Asia
Chang-Jin Kim and Jong-Wha Lee
02-12 Has Trade Intensity in ASEAN+3 Really Increased? - Evidence from a Gravity
Analysis Heungchong KIM
02-13 An Examination of the Formation of Natural Trading Blocs in East Asia
Chang-Soo Lee and Soon-Chan Park
02-14 How FTAs Affect Income Levels of Member Countries: Converge or Diverge?
Chan-Hyun Sohn
02-15 Measuring Tariff Equivalents in Cross-Border Trade in Services
Soon-Chan Park
02-16 Korea's FDI into China: Determinants of the Provincial Distribution
Chang-Soo Lee and Chang-Kyu Lee
02-17 How far has Regional Integration Deepened? - Evidence from Trade in
Services Soon-Chan Park
03-01 Trade Integration and Business Cycle Synchronization in East Asia
Kwanho Shin and Yunjong Wang
03-02 How to Mobilize the Asian Savings within the Region: Securitization and
Credit Enhancement for the Development of East Asia's Bond Market
Gyutaeg Oh, Daekeun Park, Jaeha Park, and Doo Yong Yang
03-03 International Capital Flows and Business Cycles in the Asia Pacific Region
Soyoung Kim, Sunghyun H. Kim, and Yunjong Wang
03-04 Dynamics of Open Economy Business Cycle Models: The Case of Korea
Hyungdo Ahn and Sunghyun H. Kim
03-05 The Effects of Capital Outflows from Neighboring Countries on a Home
Country's Terms of Trade and Real Exchange Rate: The Case of East Asia
Sammo Kang
03-06 Fear of Inflation: Exchange Rate Pass-Through in East Asia

Sammo Kang and Yunjong Wang
03-07 Macroeconomic Adjustments and the Real Economy In Korea and Malaysia
Since 1997 Zainal-Abidin Mahani, Kwanho Shin, and Yunjong Wang
03-08 Potential Impact of Changes in Consumer Preferences on Trade in the Korean
and World Motor Vehicle Industry Sang-yirl Nam and Junsok Yang
03-09 The Effect of Labor Market Institutions on FDI Inflows
Chang-Soo Lee
03-10 Finance and Economic Development in East Asia
Yung Chul Park, Wonho Song, and Yunjong Wang
03-11 Exchange Rate Uncertainty and Free Trade Agreement between Japan and
Korea Kwanho Shin and Yunjong Wang
03-12 The Decision to Invest Abroad: The Case of Korean Multinationals
Hongshik Lee
03-13 Financial Integration and Consumption Risk Sharing in East Asia
Soyoung Kim, Sunghyun H. Kim, and Yunjong Wang
03-14 Intra-industry Trade and Productivity Structure: Application of a Cournot-
Ricardian Model E. Young Song and Chan-Hyun Sohn
03-15 Corporate Restructuring in Korea: Empirical Evaluation of Corporate Restructuring
Programs Choong Yong Ahn and Doo Yong Yang
03-16 Specialization and Geographical Concentration in East Asia: Trends and
Industry Characteristics Soon-Chan Park
03-17 Trade Structure and Economic Growth - A New Look at the Relationship
between Trade and Growth Chan-Hyun Sohn and Hongshik Lee
04-01 The Macroeconomic Consequences of Terrorism
S. Brock Blomberg, Gregory D. Hess, and Athanasios Orphanides
04-02 Regional vs. Global Risk Sharing in East Asia
Soyoung Kim, Sunghyun H. Kim, and Yunjong Wang
04-03 Complementarity of Horizontal and Vertical Multinational Activities
Sungil Bae and Tae Hwan Yoo
04-04 E-Finance Development in Korea Choong Yong Ahn and Doo Yong Yang
04-05 Expansion Strategies of South Korean Multinationals Hongshik Lee
04-06 Finance and Economic Development in Korea
Yung Chul Park, Wonho Song, and Yunjong Wang

04-07 Impacts of Exchange Rates on Employment in Three Asian Countries: Korea,
Malaysia, and the Philippines Wanjoong Kim and Terrence Kinal
04-08 International Capital Market Imperfections: Evidence from Geographical
Features of International Consumption Risk Sharing Yonghyup Oh
04-09 North Korea's Economic Reform Under An International Framework
Jong-Woon Lee
04-10 Exchange Rate Volatilities and Time-varying Risk Premium in East Asia
Chae-Shick Chung and Doo Yong Yang
04-11 Marginal Intra-industry Trade, Trade-induced Adjustment Costs and the Choice of
FTA Partners Chan-Hyun Sohn and Hyun-Hoon Lee
04-12 Geographic Concentration and Industry Characteristics: An Empirical Investigation
of East Asia Soon-Chan Park, Hongshik Lee, and Mikyung Yun
04-13 Location Choice of Multinational Companies in China: Korean and Japanese
Companies Sung Jin Kang and Hongshik Lee
04-14 Income Distribution, Intra-industry Trade and Foreign Direct Investment in East
Asia Chan-Hyun Sohn and Zhaoyong Zhang
05-01 Natural Resources, Governance, and Economic Growth in Africa
Bokyeong Park and Kang-Kook Lee
05-02 Financial Market Integration in East Asia: Regional or Global?
Jongkyou Jeon, Yonghyup Oh, and Doo Yong Yang
05-03 Have Efficiency and Integration Progressed in Real Capital Markets of Europe
and North America During 1988-1999? Yonghyup Oh
05-04 A Roadmap for the Asian Exchange Rate Mechanism
Gongpil Choi and Deok Ryong Yoon
05-05 Exchange Rates, Shocks and Inter-dependency in East Asia: Lessons from a
Multinational Model Sophie Saglio, Yonghyup Oh, and Jacques Mazier
05-06 Exchange Rate System in India: Recent Reforms, Central Bank Policies and
Fundamental Determinants of the Rupee-Dollar Rates
Vivek Jayakumar, Tae Hwan Yoo, and Yoon Jung Choi
06-01 Investment Stagnation in East Asia and Policy Implications for Sustainable
Growth Hak K. Pyo
06-02 Does FDI Mode of Entry Matter for Economic Performance?: The Case of
Korea Seong-Bong Lee and Mikyung Yun
01-01 Korea’s FTA (Free Trade Agreement) Policy: Current Status and Future
Prospects Chan-Hyun Sohn and Jinna Yoon
01-02 An Appraisal of ASEM Economic Dialogues and Future Prospects
Chong Wha Lee
02-01 Searching for a Better Regional Surveillance Mechanism in East Asia
Yunjong Wang and Deok Ryong Yoon
02-02 Korea's FTA Policy: Focusing on Bilateral FTAs with Chile and Japan
Inkyo Cheong
02-03 Update on Korean Economic Reforms and Issues in Korea's Future Economic
Competitiveness Junsok Yang
02-04 Prospects for Financial and Monetary Cooperation in East Asia
Yunjong Wang
02-05 An Overview of Currency Union: Theory and Practice
Sammo Kang and Yunjong Wang
02-06 Korea's Trade Policy Regime in the Development Process Nakgyoon Choi
02-07 Reform of the Financial Institutions in China: Issues and Policies
Eui-Hyun Choi
02-08 Reverse Sequencing: Monetary Integration ahead of Trade Integration in East
Asia Kwanho Shin and Yunjong Wang
02-09 Can East Asia Emulate European Economic Integration?
Yung Chul Park and Yunjong Wang
02-10 Debt Resolution, Cross-Border M&As, Governance and Control in Korea's
Post-Crisis Corporate Restructuring Chan-Hyun Sohn
■ Discussion Papers

02-11 Liberalization Measures in the Process of Korea's Corporate Restructuring
Trade, Investment and Capital Account Market Openings
Chan-Hyun Sohn, Junsok Yang, and Seung Beom Kim
03-01 Inward Foreign Direct Investment into Korea: Recent Performance and Future
Agenda June-Dong Kim
03-02 The Need for Intraregional Exchange Rate Stability in Emerging East Asian
Economies Jonghwa Cho
03-03 Evolving Patterns of Corporate Financing in Korea
Haesik Park and Yunjong Wang
03-04 Trade Facilitation in the WTO
Implications for Developing Countries and a Roadmap to Cancun
Chan-Hyun Sohn and Junsok Yang
03-05 Moving Forward on the Establishment of an Effective Surveillance System and
an Improved Financial Architecture for East Asia
Yunjong Wang and Wing Thye Woo
04-01 Monetary Union and Real Convergence Compared: Europe and East Asia
Heungchong Kim, Woosik Moon, and Deok Ryong Yoon
04-02 A Critical Assessment of India's Banking Sector Reform Tae Hwan Yoo
04-03 The Structure of North Korea's Political Economy: Changes and Effects
Young-Sun Lee and Deok Ryong Yoon
05-01 A Brief Appraisal of India’s Economic and Political Relations with China,
Japan, ASEAN, the EU and the U.S.
Tae Hwan Yoo and V. Balaji Venkatachalam
WorkingPaper06-02
Does
FD
IMode
ofEntry
Matter
forE
conomic
Perform
ance?:The
Case
ofKorea
Seong-Bong
Lee
andM
ikyungY
un
Working Paper 06-02
Does FDI Mode of Entry Matter for Economic Performance?: The Case of Korea
Seong-Bong Lee and Mikyung Yun
This paper attempted to empirically test the proposition that unlike the typical concernagainst M&A, there is little difference in firm performance by modes of FDI entry. If this isthe case, there is no reason to prefer other modes of entry over M&A. The majorcontribution of this paper is that it calls into question the current classification scheme ofmode of FDI entry, on which government tax incentives are based. This paper corrects forthis, reclassifying the modes of entry through detailed analysis of each investment case toreflect as much as possible actual complexity of the cross border investment deal.
Seong-Bong Lee and Mikyung Yun
Working Paper 06-02
Does FDI Mode of Entry Matter forEconomic Performance?:
The Case of Korea


