
The copyright laws of the United States (Title 17 U.S. Code) forbid the unauthorized reproduction of this report by any means, including facsimile or computerized formats. Copyright © 2010, CALIFORNIA ASSOCIATION OF REALTORS®
Distressed Sales
Press Release Aug 22, 2011

REOs Short Sales Distressed Sales0%
20%
40%
60%
26.3%
20.9%
47.7%
27.3%
19.3%
46.9%
26.7%
17.5%
44.5%
July-10 Jun-11 Jul-11
Share of Distressed Sales to Total Sales
SOURCE: California Association of REALTORS®

Type of Sale July-10 June-11 July-11
REOs 26.3% 27.3% 26.7%
Short Sales 20.9% 19.3% 17.5%
Other Distressed Sales (Not Specif ied) 0.5% 0.4% 0.3%
Total Distressed Sales 47.7% 46.9% 44.5%
SOURCE: California Association of REALTORS®
Share of Distressed Sales to Total Sales

Ma
rin
Sa
n D
ieg
o
Hu
mb
old
t
Ora
ng
e
Sa
n L
uis
Ob
isp
o
Lo
s A
ng
ele
s
Bu
tte
So
no
ma
Na
pa
Am
ad
or
Sa
cra
me
nto
Me
nd
oc
ino
Riv
ers
ide
Sa
n B
ern
ard
ino
So
lan
o
Me
rce
d
Te
ha
ma
La
ke
Ma
de
ra
0%
20%
40%
60%
80%
100%
25% 26% 27%32%
42% 42% 43% 46%51%
55%60% 61% 62% 65%
70% 71% 72% 73%
86%
July-11
Distressed Sales by County(Percent of Total Sales)
SOURCE: California Association of REALTORS®

County July-10 June-11 July-11
Amador 59% 51% 55%Butte 28% 34% 43%Humboldt 27% 29% 27%Kern 69% 66% NALake 56% 86% 73%Los Angeles 47% 47% 42%Madera 65% 83% 86%Marin 19% 26% 25%Mendocino 71% 63% 61%Merced 62% 64% 71%Napa 40% 51% 51%Orange 35% 35% 32%
SOURCE: California Association of REALTORS®
Distressed Sales by County(Percent of Total Sales) 1 of 2

County July-10 June-11 July-11
Riverside 67% 61% 62%Sacramento 62% 65% 60%San Bernardino 72% 69% 65%San Diego 26% 28% 26%San Luis Obispo 41% 42% 42%Solano NA 72% 70%Sonoma 43% 51% 46%Tehama 77% 73% 72%CALIFORNIA 48% 47% 45%
SOURCE: California Association of REALTORS®
Distressed Sales by County(Percent of Total Sales) 2 of 2
Ma
rin
Sa
n D
ieg
o
Hu
mb
old
t
Ora
ng
e
Sa
n L
uis
Ob
isp
o
Lo
s A
ng
ele
s
Bu
tte
So
no
ma
Na
pa
Am
ad
or
Sa
cra
me
nto
Me
nd
oc
ino
Riv
ers
ide
Sa
n B
ern
ard
ino
So
lan
o
Me
rce
d
Te
ha
ma
La
ke
Ma
de
ra
0%
20%
40%
60%
80%
100%
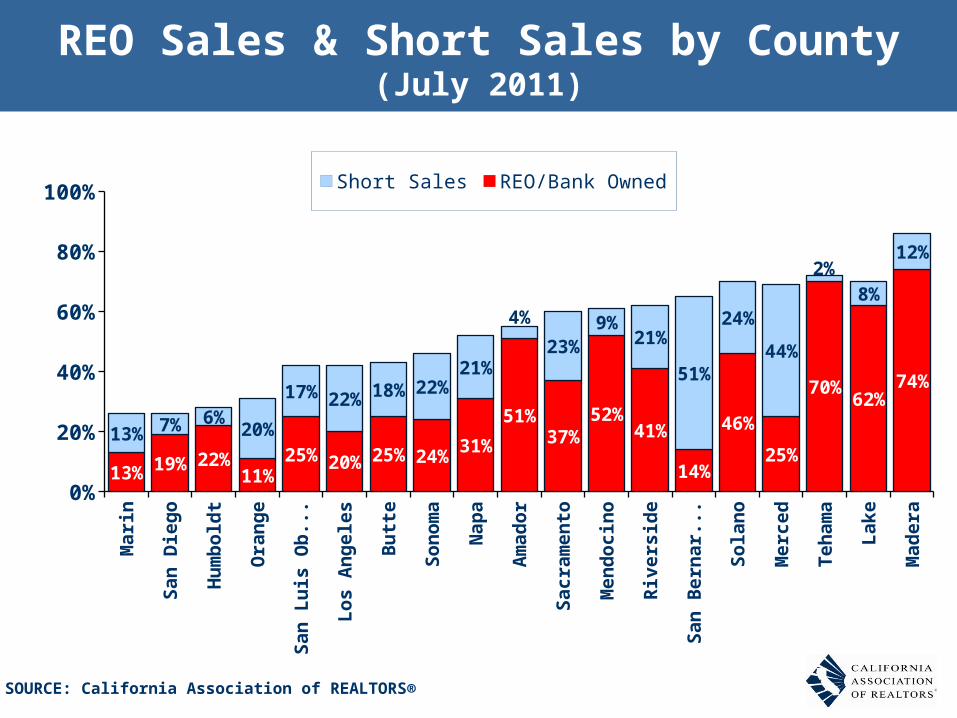
13% 19% 22%11%
25% 20% 25% 24%31%
51%37%
52%41%
14%
46%
25%
70%62%
74%
13% 7% 6%20%
17% 22% 18% 22%21%
4%
23%9%
21%
51%
24%
44%
2%8%
12%
Short Sales REO/Bank Owned
REO Sales & Short Sales by County(July 2011)
SOURCE: California Association of REALTORS®

County July-10 June-11 July-11
Amador 44% 33% 51%Butte 17% 23% 25%Humboldt 23% 22% 22%Kern 47% 45% NALake 51% 73% 62%Los Angeles 21% 22% 20%Madera 56% 66% 74%Marin 10% 15% 13%Mendocino 58% 60% 52%Merced 37% 39% 25%Napa 22% 29% 31%Orange 11% 12% 11%
SOURCE: California Association of REALTORS®
REO Sales by County(Percent of Total Sales) 1 of 2

County July-10 June-11 July-11
Riverside 39% 38% 41%Sacramento 39% 42% 37%San Bernardino 52% 52% 14%San Diego 18% 20% 19%San Luis Obispo 25% 25% 25%Solano NA 50% 46%Sonoma 25% 29% 24%Tehama 65% 67% 70%CALIFORNIA 26% 27% 27%
SOURCE: California Association of REALTORS®
REO Sales by County(Percent of Total Sales) 2 of 2
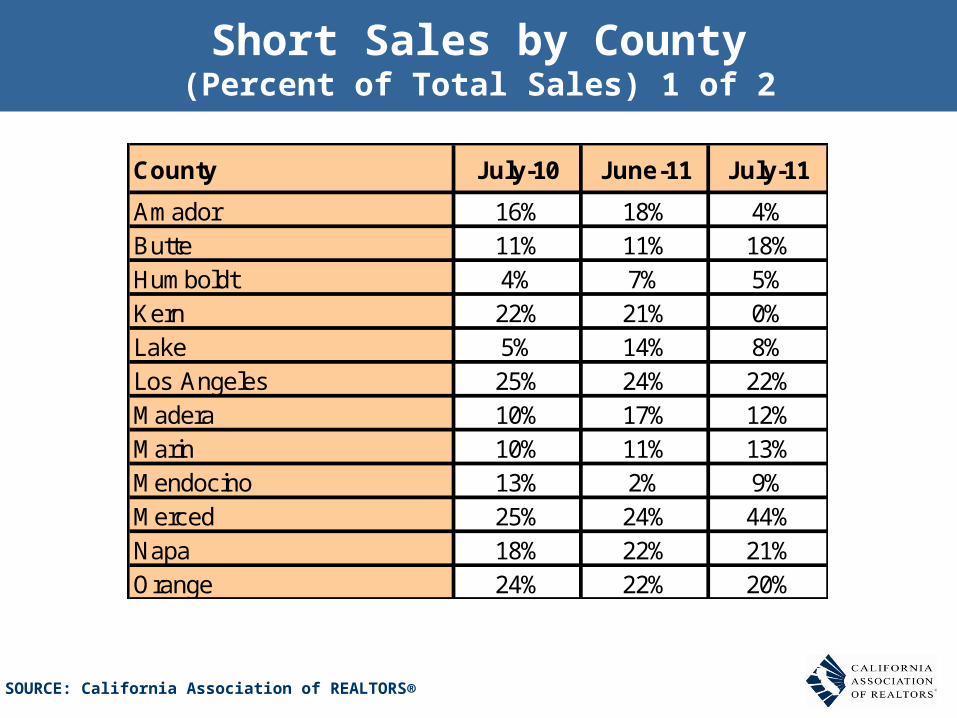
County July-10 June-11 July-11
Amador 16% 18% 4%Butte 11% 11% 18%Humboldt 4% 7% 5%Kern 22% 21% 0%Lake 5% 14% 8%Los Angeles 25% 24% 22%Madera 10% 17% 12%Marin 10% 11% 13%Mendocino 13% 2% 9%Merced 25% 24% 44%Napa 18% 22% 21%Orange 24% 22% 20%
SOURCE: California Association of REALTORS®
Short Sales by County(Percent of Total Sales) 1 of 2

County July-10 June-11 July-11
Riverside 27% 23% 21%Sacramento 23% 23% 23%San Bernardino 19% 16% 51%San Diego 8% 7% 7%San Luis Obispo 16% 17% 17%Solano 0% 22% 24%Sonoma 18% 21% 22%Tehama 12% 7% 2%CALIFORNIA 21% 19% 18%
SOURCE: California Association of REALTORS®
Short Sales by County(Percent of Total Sales) 2 of 2

Median Price by Type of SaleREO, Short-Sale, Non-Distressed
SOURCE: C.A.R.
Median Price
$0
$50,000
$100,000
$150,000
$200,000
$250,000
$300,000
$350,000
$400,000
$450,000
$500,000
Jan-09
Apr-09
Jul-09
Oct-09
Jan-10
Apr-10
Jul-10
Oct-10
Jan-11
Apr-11
Jul-11
Non-Distressed Short Sale Bank Owned

Price TrendsREO, Short-Sale, Non-Distressed
SOURCE: C.A.R.
Median Price (YTY% Chg.)
-20%
-15%
-10%
-5%
0%
5%
10%
15%
20%
25%
Jan-10 Mar-10 May-10 Jul-10 Sep-10 Nov-10 Jan-11 Mar-11 May-11 Jul-11
Non-Distressed Short Sale Bank Owned

How Much More Expensive Are Non-Distressed Sales to Short Sales?
SOURCE: C.A.R.
0%
10%
20%
30%
40%
50%
60%
Jan-09 Apr-09 Jul-09 Oct-09 Jan-10 Apr-10 Jul-10 Oct-10 Jan-11 Apr-11 Jul-11

How Much More Expensive Are Non-Distressed Sales to REO Sales?
SOURCE: C.A.R.
0%
20%
40%
60%
80%
100%
120%
140%
160%
Jan-09 Apr-09 Jul-09 Oct-09 Jan-10 Apr-10 Jul-10 Oct-10 Jan-11 Apr-11 Jul-11

How Much More Expensive Are Short Sales to REO Sales?
SOURCE: C.A.R.
0.0%
10.0%
20.0%
30.0%
40.0%
50.0%
60.0%
70.0%
80.0%
Jan-09 Apr-09 Jul-09 Oct-09 Jan-10 Apr-10 Jul-10 Oct-10 Jan-11 Apr-11 Jul-11

Types of Sale - Historical% REO, Short-Sale, Non-Distressed
SOURCE: C.A.R.
0%
10%
20%
30%
40%
50%
60%
Jan-09 Apr-09 Jul-09 Oct-09 Jan-10 Apr-10 Jul-10 Oct-10 Jan-11 Apr-11 Jul-11
Non-Distressed Short Sale Bank Owned


