
1
The Determinants of Shareholder Value inRetail Banking During Crisis Years: The Case
of Greece
Eleftherios Aggelopoulos*University of Patras, Greece
Antonios GeorgopoulosUniversity of Patras, Greece
This study examines the performance of retail banking focusing on the linkbetween shareholder value creation and operational value drivers. A uniquepanel data set is used, derived from the monthly Profit and Loss statements ofa branch network of a very large commercial bank operating in the Greekoligopolistic financial system for the period 2006–2010. Taking into account theexistence of important trade-offs between most factors of shareholder value, thevalue effects of the recent Greek crisis primarily characterized by the sovereigndebt factor are systematically incorporated in the analysis. The results show thatthe crisis reverses the generally positive value effect of income diversificationand reduces the value premium of lending spreads. Moreover, the crisissignificantly intensifies the value premium of efficient cost management, whilstsimultaneously accelerating the value destruction causing by credit risk. Thefindings have important managerial implications for bank managers andpolicymakers. (JEL: G21, G32, M41, C23)
Keywords: retail banking performance, shareholder value drivers, residualincome approach, Greek crisis
Article history: Received: 30 April 2014, Received in final revised form: 27February 2015, Accepted: 05 March 2015, Available online:13 May 2015
* The authors would like to thank participants of the Conference on Banking, Finance, Money and Institutions: The Post Crisis Era (2–3 November 2013, University of Surrey, UK) and the Multinational Finance Society Symposium (4–5 April 2014, Municipal Art Gallery, Larnaca, Cyprus), for very helpful comments.
(Multinational Finance Journal, 2015, vol. 19, no. 2, pp. 109–147)© Multinational Finance Society, a nonprofit corporation. All rights reserved. DOI: 10.17578/19-2-2
Multinational Finance Journal110
I. Introduction
Banking performance and its determinants is an interesting issue in thebanking management literature. A major part of the relevant literaturefocuses on productive efficiency, total factor productivity andprofitability of banking institutions (Athanasoglou, Brissimis and Delis,2008; Brissimis, Delis and Papanikolaou, 2008; Lepetit et al., 2008;Goddard, Molyneux and Wilson, 2004; Salas and Saurina, 2003).Unexpectedly, only few studies have ever used Shareholder Value(SHV) creation as bank performance indicator (Cipollini and Fiordelisi,2012, Fiordelisi and Molyneux, 2010, 2007; Fiordelisi, 2007; Gross,2006), despite its main strategic importance for banks over the lastdecade (Fiordelisi and Molyneux, 2010) and its positive impact on theirrisk reduction (Cipollini and Fiordelisi, 2012). The recent financialcrisis has made the banking performance analysis and the creationconditions of SHV, in particular, more interesting. This is because theinvolvement of banks in the crisis has differentiated considerably acrosscrisis countries.
From this point of view, the Greek crisis1, which originated from thesovereign debt crisis in the country, is investigated while the domesticbanking sector remained relatively sound since indigenous banksfocused on retail commercial activity and not on investment bankingwhich caused huge marked to market losses related to toxic assets. Inother words, the crisis did not hit the country because of a risky bankingsector (as, for example, in Ireland), but because of the sovereign factor.Therefore, this study explores the crisis effects on the SHV drivers ina turbulent economic environment in which banking institutions werenot the primary cause of the crisis.
The present study proposes that SHV creation is not astraightforward phenomenon and important trade-offs between mostfactors of SHV exist. In light of the occurrence of the crisis and itsunique features, the paper derives interesting implications for bankingmanagement itself, credit provision and the real economy, in the sensethat an efficient and well functioning banking system accelerates longterm economic growth (Kaufman, 2004). In particular, the SHVdeterminants are examined, concentrating on retail banking over the
1. The Greek debt crisis, being part of the Euro zone crisis, was triggered by the arrivalof the recent financial crisis. The financial crisis that started at the end of 2007 in thesubprime credit market led to a liquidity crisis in the short term money markets (Iqbal andKumel, 2014) and increased the domestic deposit rates in September 2008.

111The Determinants of Shareholder Value in Retail Banking During Crisis Years
period 2006-2010. Moreover, the total period is divided into the precrisis period (Period A: January 2006-August 2008) and the crisisperiod (Period B: September 2008- December 2010) in order to capturespecific crisis effects. An internal bank data set is utilized, derived fromthe monthly Profit and Loss (P&L) statements of homogeneous retailbranches of a very large domestic bank (one of the four largest systemicGreek commercial banks). In this way, the data set can ensure twocrucial conditions. Firstly, value driver analysis at the bottom-levelrequires a high degree of sample homogeneity. Secondly, a researchdesign in retail banking performance should be based on internal dataof bank branches of a specific banking institution and not be performedacross competing banking institutions (since the definition of the retailsegment considerably varies across banks). The oligopolistic andhomogeneous financial environment in which the case study bankoperates, with it’s specialization in commercial banking; mainly retailbanking, can guarantee, without doubt, a generalization of the results.
A fixed-effects model specification is applied to the panel of retailbranches which produces efficient estimates and different robustnesschecks are run (Generalized Method of Moments - GMM estimator,Two-Stage Least Squares - TSLS estimator) to account for persistenceof the dependent variable and potential endogeneity of regressors. Thecreation of SHV is measured by the Residual Income (thus, RI is ourdependent variable), which is an effective instrument of value creationmeasurement at the bottom level (Garvey and Milbourn, 2000), and asto the explanatory variables four branch specific operational valuedrivers are included such as income diversification, cost management,credit risk taking and lending spreads following other SHV studies(Cipollini and Fiordelisi, 2012; Fiordelisi and Molyneux, 2010).
The results suggest some interesting relationships between bankSHV creation and the four value drivers included in the analysis.Overall, the findings indicate that the current crisis effects might havean ambiguous impact on SHV. More specifically, the crisis reverses thepositive SHV effect of diversification in the expansion period to anegative effect. So an adoption of a diversified business mix strategyduring the crisis seems to destroy value. Likewise, the crisis reduces thepositive SHV impact on branches which lend with high margins,indicating excessive relaxation of lending standards during theexpansion period. Moreover, the crisis increases the positive valueeffect of operationally cost efficient branches, so the adoption of branchrationalization measures might help to create value in crisis years.Finally, loan loss impairments significantly increased during the crisis,

Multinational Finance Journal112
and this is reflected in the extra negative impact of credit risk taking onSHV during that period. The results confirm all the research hypotheses.
The main contributions of this study are as follows. First, the paperoffers new evidence on the bulk of the currently uninvestigated field ofSHV creation in a dynamic environment, as it is expressed from thepassage of the expansion period to the crisis period. Indeed, theon-going serious crisis in the Greek economy stimulates researchinterest as it is very likely that the crisis will reduce a generallyexpected value premium or even cause it’s disappearance, in turncausing value destruction. More specifically, the study provides usefulinformation about the quality of banking performance at the retail levelin the “bank-driven” crisis economy of Greece which is characterizedby sovereign debt and a relatively weak local financial market, as wellas other Mediterranean economies of the European region (e.g. Italy,Portugal, and Spain). In this way, this might offer useful lessons forthose specific countries as well. Second, the study sheds light on thesources of value creation in retail banking, which is largely unexploreddue to the lack of primary data at bank branch level. This becomes evenmore important since most of the research in retail banking performanceis applied to small branch populations, e.g., fewer than 50 branches, anddeals with branch efficiency and no value creation (Deville, 2009).Third, the bottom level field research that is applied, guarantees thatvalue creation and value destruction can be measured directly at theirsources by also capturing the direct crisis effects immediately. Finally,the utilization of a unique data set in the study allows fixed-effects to beused at the branch and month level and this covers a lot of ground interms of identification.
The results have various implications for both bank management andpolicymakers. Bank policy should be more flexible due to changingexternal conditions. Also, it should adopt a more proactive way of‘‘thinking’’ about the implications of an economic change, which aremanifested in the transition from the expansion to the crisis period andvice versa. Under such conditions bank policy should be different whenmoving from one economic period to another. The findings supportpost-crisis initiatives taken at the European level as regards themanaging of credit risk and the proactive and countercyclical policy.Also, they suggest specific actions that should be introduced, both at thebank and the institutional level in order to reduce exogenous shocks tothe banking industry.
The rest of the study is organized as follows. Section II reviews theexisting literature on SHV and presents the value creation process in

113The Determinants of Shareholder Value in Retail Banking During Crisis Years
retail banking along with the crisis effects. Section III defines RI,identifies the beginning of crisis and presents the data description.Section IV describes the methodology employed to construct the modeland the alternative models. Section V illustrates the empirical resultsand the last section discusses the main findings and proposes policyimplications.
II. Theoretical background and hypotheses
This section presents the relevant literature on SHV determinants andthe theoretical framework of value creation process in retail bankingalong with the development of research hypotheses.
A. Literature on determinants of shareholder value
There is a large amount of literature exploring how banks are able toincrease their performance and profitability. Studies like Dietrich andWanzenried (2011), Athanasoglou, Brissimis and Delis (2008),Brissimis, Delis and Papanikolaou (2008), Lepetit et. al. (2008), Bergerand Mester (2003), Salas and Saurina (2003) consider a wide range ofbank-, industry- and macro-specific variables that may have an impacton banking profitability. Their empirical results vary due to differencesin their panel datasets, time periods and sample countries. However theempirical literature on SHV determinants is relatively scarce. Inparticular, Fiordelisi (2007) and Beccalli, Casu and Girardone (2006)primarily connect a single value factor with SHV creation instead ofutilizing a set of different value SHV drivers. Fiordelisi and Molyneux(2010), examining several bank- and industry- andmacroeconomic-specific determinants of SHV creation for a largesample of European banks between 1998 and 2005, emphasize that suchvalue factors often have both positive and negative effects on SHVcreation. Their most important finding is that income diversification,cost and revenue efficiency are shown to have a positive relationship onSHV, whereas a corresponding positive relationship between credit risktaking and SHV confirms the good luck hypothesis – as banks take onmore credit risk they also boost their interest revenues. Similarly, Gross(2006) examines determinants of SHV creation such as incomediversification, cost management, credit risk taking and branchstructure, for a sample of 139 retail banks in Germany in the period1998-2003. The findings suggest that only cost management and credit
Multinational Finance Journal114
risk taking are significant drivers for SHV in banks in the sense that anincrease in credit risk taking destroys value while an increase in costefficiency creates it.
To the best of our knowledge, no previous study has investigated therecent crisis impact on SHV determinants although a few studiesinvestigate the crisis impact on bank profitability in general (Dietrichand Wanzenried, 2011; Xiao, 2009). More specifically, Dietrich andWanzenried (2011) analyze four profitability determinants (costefficiency, income diversification, growth of total loans and fundingcosts) of 372 commercial banks in Switzerland. They considerseparately the pre-crisis period (1999–2006) and the crisis years(2007–2009). They find that income diversification and cost efficiencyboost bank profitability in both periods, whereas the profitability effectof credit risk taking is negative and significant, only in the crisis period.
Finally, the literature on performance and profitability determinantsof the Greek banking sector is generally scarce (Athanasoglou,Brissimis and Delis, 2008; Eichengreen and Gibson, 2001). In animportant contribution, Athanasoglou, Brissimis and Delis (2008) testwhether bank-, industry- and sector-specific variables influence theprofitability of the Greek banking sector from 1985–2001. The authorsprovide inter alia evidence that credit risk taking and high operatingexpenses are both negatively and significantly related to bankprofitability. Eichengreen and Gibson (2001) state that the effect of staffexpenses is positive and significant, possibly due to quality effect(human capital). Thus, no study until now has analyzed the SHVdeterminants of the Greek retail banking and indeed in the recent crisisperiod.
B. The value creation process in retail banking
A bank creates value for its shareholders when the return on investedcapital is greater than its opportunity cost. A common measure of abank’s SHV creation is RI2. RI can be calculated for the bank as a whole(i.e. difference between bank’s net operating profit and cost of equityemployed) but when used as a basis to measure the performance ofretail branches, then the earnings and amount of equity allocated tothese branches must be identified, so their RI can be calculated. Thus,RI for each bank branch (Dermine, 2009; Feltham and Ohlson, 1995)
2. The RI model and other SHV models such as Economic Value Added (EVA) andEconomic Profit (EP) are identical in practice.
115The Determinants of Shareholder Value in Retail Banking During Crisis Years
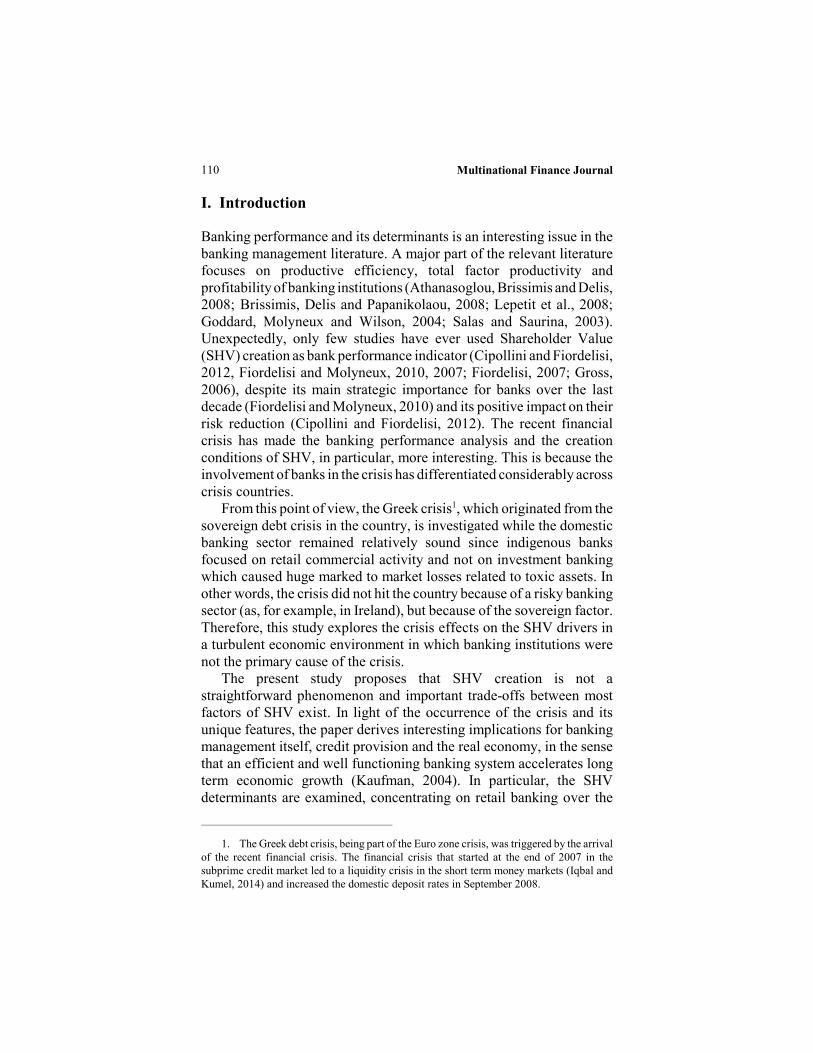
Operational value drivers
Income diversificationFee income/Total income
Cost managementOperating costs/allocated equity
Credit risk takingLoan loss impairments/Loan interest income
Lending spreadsLending interest rates minus cost of funding
FIGURE 1.— The relationship between RI and the different drivers(Fiordelisi and Molyneux 2010, Gross, 2006, own contribution). Note: Residual income (RI) for each branch is calculated as the difference between theallocated net operating profit and the opportunity cost of allocated equity, i.e. the product ofallocated equity and cost of equity. The bank management needs to put actions in place toincrease the operating profit and/or reduce the equity employed and the cost of equity. Theallocation of income to the branches is implemented through the concept of fund transferpricing that allows interest income from lending and deposit transactions to be calculated inisolation for each branch (Kimball, 1998). The operating profit is related to the income, costand risk structure of a branch. The income structure contains interest income from lendingand deposit transactions and fee income. The cost structure includes interest costs, fee costs,operating and non-operating expenses. The risk structure contains the expected loan losses(i.e. loan loss impairments). As regards the allocation of equity to each branch, this isobtained by applying the capital requirements for retail exposures, against credit andoperational risk (Basel II rules through risk weighted assets - RWA). Equity employed canbe reduced directly by decreasing loan balances or diversifying income, while the cost ofequity maybe reduced indirectly by reducing risk exposure or improving risk management.
is calculated as the difference between the allocated net operating profitand the cost of allocated equity, i.e. the product of allocated equity andcost of equity.
According to Fiordelisi and Molyneux (2010), the bank managementhas three buttons to push to affect the RI, which are; net operatingprofit, equity employed and the cost of equity. Specifically, a bankneeds to put actions in place to increase the net operating profit and/orreduce the equity employed and the cost of equity (i.e. reduce capitalcharges). These structures depend on branch specific value drivers. Therelationship between RI and the value drivers can be observed in figure
RI
Allocated operating profit
Income structure
Interest income
Fee income
Cost structure
Interest costs
Fee costs
Non operating costs
Operating costs
Risk structure
Expected loan losses -
Loan Loss Impairments
Opportunity cost of
allocated equity
Allocated Equity
employed
Cost of equity

Multinational Finance Journal116
1. From this value driver tree, different drivers can be evaluated. Basedon earlier profitability (Berger and Mester, 2003; Lepetit et al., 2008;Beccalli, Casu and Girardone, 2006) and shareholder value (Fiordelisiand Molyneux, 2010; Gross, 2006) literature, we suggest that actionssuch as income diversification, efficient operating expensesmanagement and credit risk taking are expected to have an interestingimpact on RI. Also, granting loans with a high spread is considered avaluable driver (Dermine, 2009) for the income structure of the branch.
The value created for shareholders is the final result of the processand it can be safely assessed by considering only two issues: Thetrade-off between the above value drivers in the sense that they mighthave both a positive and a negative effect on SHV (affecting at the sametime various components of it, such as the income, cost and riskstructure). It is the net effect that will determine whether any action isvalue enhancing. From this point of view, it is important to also examinethe crisis impact on SHV, as compared to the growth period. The crisismight hamper the dynamic of the SHV creation process. Hence, the netvalue effect will finally show the overall contribution of the valuedeterminants.
In the following section the research hypotheses are formed for eachvalue driver.
C. The impact of the crisis on the value creation process in retailbanking
Income diversification (ID, i.e. is the ratio of fee income to totalincome) may positively influence bank performance and SHV due toseveral reasons. In particular, income diversification provides morestability of income as service fees are uncorrelated with net interestincome. It also offers higher profitability since margins in fee incomeare usually higher than margins in interest operations. This reduces riskbecause there is no credit risk in fee income and implies less capitalcharges as there are no capital requirements for credit risk (justoperational risk). Empirical studies stress the expected benefits ofdiversification in the banking industry (Cipollini and Fiordelisi, 2012;Fiordelisi and Molyneux, 2010; Dietrich and Wanzenried, 2010).Nevertheless, a relatively high share of non-interest income can createless value through increased costs, as branches are charged withrelatively high operating costs related to the offering and monitoring of
117The Determinants of Shareholder Value in Retail Banking During Crisis Years
these services (Lepetit et al., 2008; Gross 2006; Demirguk-Kunt andHuizinga, 1999). Under these circumstances, branches might fail toachieve economies of specialization and probably waste valuableresources in peripheral activities. Hence, in the crisis period, bankbranches might focus on their main business activity due torationalization requirements (restructuring loan portfolio, increasecollection performance of loan accounts, etc.). Consequently a highdiversification policy may not be appropriate nor fully effective andcould destroy value during crisis years. Therefore, the hypothesis belowis formed:
H-1. The crisis reduces the generally expected value premium ofdiversification.
The level of operating expenses management (COST i.e. is the ratio ofcontrollable operating expenses to equity employed) in terms of relativehigh operating expenses (i.e. inefficient cost management) can benegatively related to SHV, in particular in the case, where personnelexpenses are affected by relatively low productivity (Athanasoglou,Brissimis and Delis, 2008). In such a case there is a lack of efficiencyin total controllable costs and branches try to pass part of the increasedcost to customers. Empirical evidence supports the theoretical premisethat improved management of these expenses will increase efficiencyand therefore create value (Fiordelisi and Molyneux, 2010; Dietrich andWanzenried, 2010; Athanasoglou, Brissimis and Delis, 2008; Gross2006). However, “aggressive” efficiency programs may lead to reducedcustomer satisfaction and staff quality (Fiordelisi and Molyneux, 2010).This policy may have an adverse impact on workforce motivation orincrease risk caused by substantial deterioration of service quality. Thismay be true since retail banking is a relatively labor-intensive industrywhere the physical contact with the customer constitutes an importantcompetition factor. In addition, excessive cost saving efforts maynegatively affect the ability of a bank to screen loans so that the ensuingloan losses outweigh the initial cost savings (Andreou, Philip andRobejsek, 2013). This argument is consistent with the “cost skimping”hypothesis which posits a trade-off between short term operating costsand future risk taking (Fiordelisi, Marquez-Ibanez and Molyneux, 2011;Berger and Young, 1997). All aforementioned factors may adverselyaffect value creation through reduced income or increased risk

Multinational Finance Journal118
(Fiordelisi and Molyneux, 2010, 2007; Garcia-Herrero, Gavila andSantabarbara, 2009). Especially in the crisis period, it is expected thatbranches are probably focused on reducing operating costs throughsalary freezes and staff retrenchments, thus accelerating branchrationalization to offset the decrease in profit due to falling demand fornew loans (Demirguk-Kunt, Detragiache and Gupta, 2006). Therefore,the hypothesis below is formed:
H-2: The crisis increases the generally expected value premium ofefficient cost management.
The effect of higher credit risk taking (CR, i.e. is the ratio of total loanloss impairments to net interest income on loans) on performance isexpected to be negative because of the relative rise of loan impairments,as reported on branch P & L statements. This negative effect issupported by empirical studies (Athanasoglou, Brissimis and Delis,2008; Brissimis, Delis and Papanikolaou, 2008; Gross, 2006; Miller andNoulas, 1997). In contrast, the “good luck” hypothesis (Fiordelisi,Marquez-Ibanez and Molyneux, 2011; Salas and Saurina, 2003)suggests that credit risk taking which involves lending to customers withlow credit score, at high rates of interest might increase the loanvolumes and thus the ability of the institution to generate interestincome through market share expansion. Fiordelisi and Molyneux(2010) provide empirical evidence of the “good luck” hypothesis.However, this policy might be more appropriate for the period ofeconomic growth, especially for followers in the market who try tocatch up with the market leader usually at the expense of the quality oflending standards. In the crisis period, the relative significant rise ofloan loss impairments is normally connected with lower credit riskcapabilities due to the unfavorable economic environment. Therefore,in this period, we expect an extra negative impact of credit risk takingon SHV. Taking into account the above considerations, the hypothesisbelow is formed:
H-3: The crisis increases the generally expected destructive valueeffect of credit risk taking.
Regarding the profitability spread derived from lending business(SPREAD, i.e. is the difference between contractual lending interestrates and cost of funding), it is expected that retail branches whichcharge higher lending spreads to their lending customers naturally

119The Determinants of Shareholder Value in Retail Banking During Crisis Years
TABL
E 1.
The
asso
ciat
ion
of sh
areh
olde
r va
lue
crea
tion
with
four
spec
ific
valu
e de
term
inan
ts
Expe
cted
effe
ctN
umbe
rV
alue
det
erm
inan
tD
efin
ition
Gen
eral
exp
ecta
tions
The
impa
ct o
f cris
is1
Div
ersif
icat
ion
of In
com
e (ID
)Fe
e in
com
e(+
) Div
ersif
icat
ion
may
pos
itive
ly(n
egat
ive
impa
ct) A
hig
h re
lativ
e to
tota
l in
fluen
ce R
I via
mor
e st
abili
ty o
f di
vers
ifica
tion
polic
y m
aybe
inco
me
(1).
inco
me,
low
er ri
sk a
nd le
ss c
apita
lno
t app
ropr
iate
or n
ot fu
llych
arge
s (no
cre
dit r
isk).
effe
ctiv
e du
e to
focu
s on
the
(-) D
iver
sific
atio
n m
ay n
egat
ivel
ym
ain
busin
ess a
ctiv
ity c
ause
d in
fluen
ce R
I by
: a. i
ncre
asin
g
by ra
tiona
lizat
ion
oper
atin
g co
sts re
late
d w
ith th
e re
quire
men
ts (re
med
ial r
iskof
ferin
g an
d m
onito
ring
of fe
e-ba
sed
man
agem
ent t
hrou
ghse
rvic
es a
nd b
. was
ting
valu
able
co
llect
ion
and
reco
very
NPL
re
sour
ces i
n pe
riphe
ral a
ctiv
ities
. ac
coun
ts).
2Co
st m
anag
emen
t (C
OST
)Co
ntro
llabl
e(+
) Effi
cien
t cos
t man
agem
ent m
ay(p
ositi
ve im
pact
) Red
uctio
n
oper
atin
g ex
pens
espo
sitiv
ely
influ
ence
RI t
hrou
gh
of o
pera
ting
costs
to o
ffset
pere
quity
em
ploy
edre
duce
d co
sts.
the
decr
ease
in p
rofit
due
to
(we e
xclu
de(-)
Effi
cien
t cos
t man
agem
ent m
ayfa
lling
dem
and
for n
ew lo
ans.
depr
ecia
tion
and
head
nega
tivel
y in
fluen
ce R
I thr
ough
over
head
cos
ts w
hich
redu
ced
custo
mer
satis
fact
ion
and
are
not t
he o
utco
me
ofw
orkf
orce
mot
ivat
ion,
and
incr
ease
dba
nk m
anag
emen
t)op
erat
iona
l risk
. Also
, exc
essiv
eco
st sa
ving
s effo
rts m
ay a
ffect
the
abili
ty to
scre
en lo
ans s
o th
e lo
anlo
sses
ove
r com
pens
ate
the
initi
alco
st sa
ving
s (co
st sk
impi
ng h
ypot
hesis
)( C
ontin
ued
)

Multinational Finance Journal120
TABL
E 1.
(Con
tinue
d)
Expe
cted
effe
ctN
umbe
rV
alue
det
erm
inan
tD
efin
ition
Gen
eral
exp
ecta
tions
The
impa
ct o
f cris
is3
Cred
it ris
k ta
king
(CR)
Tota
l loa
n lo
ss im
pairm
ents
(+) C
redi
t risk
taki
ng m
ay(n
egat
ive
impa
ct) T
he a
bilit
y (2
) to
net i
nter
est i
ncom
e on
loan
spo
sitiv
ely
influ
ence
RI t
hrou
ghto
man
age
cred
it ris
k is
incr
ease
d lo
an v
olum
es a
nd th
usre
duce
d du
e to
the
unfa
vora
ble
high
er in
tere
st in
com
e (g
ood
luck
econ
omic
env
ironm
ent
hypo
thes
is).
(acc
umul
atio
n of
loan
loss
(-)
Cre
dit r
isk m
ay n
egat
ivel
y pr
ovisi
ons m
ainl
y)in
fluen
ce R
I bec
ause
of t
he
rela
tive
rise
of lo
an lo
ssim
pairm
ents
4Le
ndin
g sp
read
sCo
ntra
ctua
l len
ding
inte
rest
rate
(+) H
ighe
r spr
ead
on lo
ans m
ay(n
egat
ive
impa
ct) T
he lo
w
(SPR
EAD
) m
inus
the c
ost o
f fun
ding
.po
sitiv
ely
influ
ence
RI t
hrou
ghqu
ality
of l
oan
portf
olio
gra
nded
incr
ease
d in
tere
st in
com
ein
the
expa
nsio
n pe
riod
can
be
(bef
ore p
rovi
sions
).re
veal
ed d
urin
g th
e cris
is pe
riod
(-) H
ighe
r spr
ead
on lo
ans m
ayA
lso, b
anks
dur
ing
the
crisi
s ne
gativ
ely
influ
ence
RI t
hrou
ghad
opt a
polic
y to
incr
ease
the
incr
ease
d cre
dit r
isk (l
ow qu
ality
cont
ract
ual r
ate
of e
xisti
ng lo
ans
of lo
an p
ortfo
lio).
in o
rder
to o
ffset
the
redu
ced
prof
its fr
om a
sset
del
ever
agin
g.H
owev
er,th
is m
ay r
educ
e th
ere
paym
ent
abili
ty
of
the
borro
wer
and
lea
d to
hig
her
cred
it ris
k du
eto
the u
nfav
orab
leec
onom
ic e
nviro
nmen
t.( C
ontin
ued
)

121The Determinants of Shareholder Value in Retail Banking During Crisis Years
TABL
E 1.
(Con
tinue
d)
Not
e: (1
) Tot
al in
com
e is c
alcu
late
d as
the s
um o
f net
inte
rest
inco
me (
inte
rest
reve
nue l
ess i
nter
est e
xpen
se) o
n de
posi
ts an
d loa
ns re
spec
tivel
yan
d th
e fe
e in
com
e, a
s the
se re
porte
d in
bra
nche
s P&
L st
atem
ents
. Net
inte
rest
inco
me
on d
epos
its is
def
ined
as t
he d
iffer
ence
bet
wee
n re
turn
on
depo
sits
(mar
ket p
rice –
one
mon
th E
urib
or) a
nd in
tere
st pa
id on
depo
sits
, mul
tiplie
d by t
he de
posi
ts ba
lanc
e. N
et in
tere
st in
com
e on
loan
s is d
efin
edas
the
diff
eren
ce b
etw
een
inte
rest
ear
ned
on lo
ans a
nd c
ost o
f fun
ding
(mar
ket p
rice
– on
e m
onth
Eur
ibor
), m
ultip
lied
by th
e lo
ans b
alan
ces.
(2) T
he lo
an lo
ss im
pairm
ents
are
cre
ated
on
a m
onth
ly p
ortfo
lio b
asis
(con
sum
er, s
mal
l bus
ines
s loa
ns a
nd m
ortg
ages
) usi
ng a
s obs
erva
ble
data
the
day’
s pay
men
ts lo
ans a
nd c
redi
t car
ds a
re o
verd
ue (I
nter
natio
nal A
ccou
ntin
g St
anda
rd -
IAS
39).
Spec
ific
prov
isio
n co
effic
ient
s are
app
lied
to lo
ans p
ortfo
lios,
taki
ng in
to a
ccou
nt th
e co
llate
ral o
f eac
h lo
an. I
t is w
orth
not
ing
that
the
crite
ria fo
r the
bra
nch
to c
reat
e a
loan
loss
pro
visi
ondi
dn’t
chan
ge d
urin
g th
e st
udy
perio
d.

Multinational Finance Journal122
present a higher value due to increased interest income (Dermine, 2010;2009). However, high interest margins maybe hide a relatively lowquality loan portfolio with negative impact on SHV creation since thecredit risk is priced and included in the contractual interest rate paid bythe borrower. In the period of crisis, such loan portfolios are usuallyrelated to higher credit risk, with destructive impact on SHV. Moreover,during crisis periods the bank management attempts to increase thecontractual rate of existing loans in terms of a repricing policy as anoffset to the asset deleveraging (that takes place in a crisis period)which leads to lower loan volumes and interest income. But, this policymight have side effects via the reduction of repayment ability of theborrower and the increase of loan loss impairments due to theunfavorable economic environment. Taking into account the aboveconsiderations, the hypothesis below is formed:
H-4: The crisis reduces the generally expected value premium oflending spreads.
Table 1 summarizes the association of SHV measured by RI with theaforementioned four determinants by analyzing the definition of eachdeterminant and the expected effect on RI.
III. Variables and data description
This section describes the definition of RI and presents the data itselfalong with the identification of crisis.
A. Definition of Residual Income
As described above, the RI is used as a proxy for the SHV creation ofthe sample retail branches. RI is defined as net operating profit less acapital charge for the equity employed. RI is calculated as follows(Gross, 2006):
(1), / 1 ,it it i t t e tRI NOPAT E c
where: RIit is the residual income of bank branch i in month t ; NOPATitis the net operating profit after taxes of branch i in month t; ce,t denotesthe cost of equity of bank in month t; Ei,t/t-1 denotes the average equityof bank branch i in month t and t–1.

123The Determinants of Shareholder Value in Retail Banking During Crisis Years
Net operating profit after taxes is calculated as the differencebetween the total income and the sum of total costs, total loan lossimpairments and taxes. The equity employed by each branch is obtainedby applying the capital requirements for retail exposures, against credit3 and operational risk4 (Basel II via Bank of Greece – BOG – Governor’sAct: No 2588 & No 2590, 20.08.2007). Regarding the cost of equity atthe retail branch, it is approximated with the overall cost of equity of thebank (Dermine, 2009; Gross, 2006). The bank’s cost of equity capitalis calculated looking at the shareholders expected rate of return that isestimated by using the Capital Asset Pricing Model (CAPM)framework, adjusted for default risk (Damodaran, 2012, 2010;Fernandez, Aquirreamalloa and Avendaρo, 2011). This method is themost widely theoretical approach in empirical research (Fiordelisi andMolyneux, 2010, 2007) and the preferred method in the context ofvaluing banks in most of the literature (Damodaran, 2009; Dermine,2009). The empirical results (listed below) were tested for theirrobustness and sensitivity to changes in the value of the cost of equity.
B. Data and Crisis identification
The original data set is derived from a branch network of a majorcommercial bank (370 branches in total) spread across Greece for theperiod January 2006 to December 2010. The end-month P&L statementsof these branches are used, obtained from the Management InformationSystem of the bank of the study. The unique data set is utilized in twoways: Firstly, the criterion of strict homogeneity of selected branches isapplied, in terms of: services provided (to individuals, micro andsmall-sized enterprises5); size (specific loan and deposit volumes6);
3. The capital requirement for credit risk is calculated by the sum of the risk weightedloans of each branch (weight 75% for mortgages, consumer, small business loans and creditcards), multiplied with the Basel capital ratio 8%.
4. The capital requirement for operational risk is calculated by multiplying theoperating income before taxes and loan provisions, with 12%
5. These entities are the most important clients for the Greek banks (pure retailbanking). In this category the total retail exposure of individuals, microenterprises andsmall-sized enterprises is less than 1 million Euros, whereas each enterprise has a maximumturnover of 2.5 million Euros.
6. The study focuses on branches that presented loan and deposit volumes in January2006 ranging between 20 million and 80 million and 20 million and 60 million respectively.

Multinational Finance Journal124
branch age establishment7 and branch location (branches placed inurban areas8). This leads to a wide, homogeneous sample of 117 retailbranches of the specific bank, symmetrically dispersed across Greece. Secondly, the criterion of strict homogeneity is relaxed and the totalbranch network is analyzed, taking into account some specific branchcharacteristics such as the branch size, the branch location and thebranch ability to use its own deposits to make loans. As regards thebranch size, three branch groups are formed given the deposit balances:small-sized branches with a 5 year average total deposit balancesbetween 5 to 20 million Euros (25 branches), medium-sized brancheswith a 5 year average total deposit balances between 20 to 60 millionEuros (121 branches) and large-sized branches with a 5 year averagedeposit balances of more than 60 million Euros (123 branches). Asregards the location of branches, the branches are separated into threecategories: branches operating in urban areas (102 branches), branchesoperating in rural areas (80 branches) and finally branches operating onislands (31 branches). Finally, as regards the ability of each branch touse its own deposits to make loans, according to its 5 year average loanto deposits ratio, three groups are analyzed: branches with a loan todeposit ratio of less than 90% (67 branches), branches with a loan todeposit ratio between 90% to 120% (59 branches) and finally brancheswith a loan to deposit ratio of more than 120% (95 branches). In allcases, the dataset includes branches that were in operation for more thantwo years (year of establishment before 2004) and that have achievedthe operational breakeven point (e.g. presenting a positive pre provisionprofit in January 2006).
Next the beginning of the crisis is determined, in order to contrastthe expansion period to crisis period. To identify the exact point atwhich the crisis begins, which is crucial for the validity of empiricalresults (Kenourgios, Christopoulos and Dimitriou, 2013), the interestrate of time deposits is used as an indicator. This is owing to the fact that they are substantial in volume and price sensitive, with the resultthat any liquidity shortage in the market is reflected directly in theircost. The average interest rates of time deposits for Greek banks
7. The study focuses on branches that have been operating for more than five years andless than fifteen years, using 2006 as a base year. This is crucial since the branch ageinfluences the calculation of loan loss impairments and by extension the quality of branchloans portfolio.
8. Branches that operate in rural areas and on islands are affected by seasonality.

125The Determinants of Shareholder Value in Retail Banking During Crisis Years
FIGURE 2.— The development of monthly average spread of timedeposits (difference between return on time deposits and interest paidon them) for the total branch network, over January 2006 to December2010.Note: A notably change can be observed in the trend after mid September 2008. Moreover,this structural point is econometrically derived from the time series of the specific depositsover the total period of the study, by applying the minimum Lagrange Multiplier (LM) unitroot test proposed by Lee and Strazicich (2003).
increased markedly in September 2008 (BOG, 2009) from 4.99%(August 2008) to 5.11% with an increasing trend until the end ofDecember 2008, where the month rate was 5.36%. Also, the beginningof the financial crisis at the same point of time is endogenouslyconfirmed, based on the total branch network. Figure 2 illustrates thedevelopment of the monthly average spread of time deposits (differencebetween return on time deposits and interest paid on them) for the retailbranches, over the period from January 2006 to December 2010. Anotable change can be observed in the trend after mid September 2008.Moreover, this structural point is econometrically derived from the timeseries of the specific deposits over the total period of the study, byapplying the minimum Lagrange Multiplier (LM) unit root test proposedby Lee and Strazicich (2003). Lee and Strazicich’s model shows that thestructural break point in the trend of the specific deposits takes place inSeptember 2008 (minimized LM unit root t-statistic: –16.707 computedby using the Gauss programming codes).
Given that the dependent variable is directly linked to a ‘‘value’’measure, some evidence concerning the economic significance of the
Multinational Finance Journal126
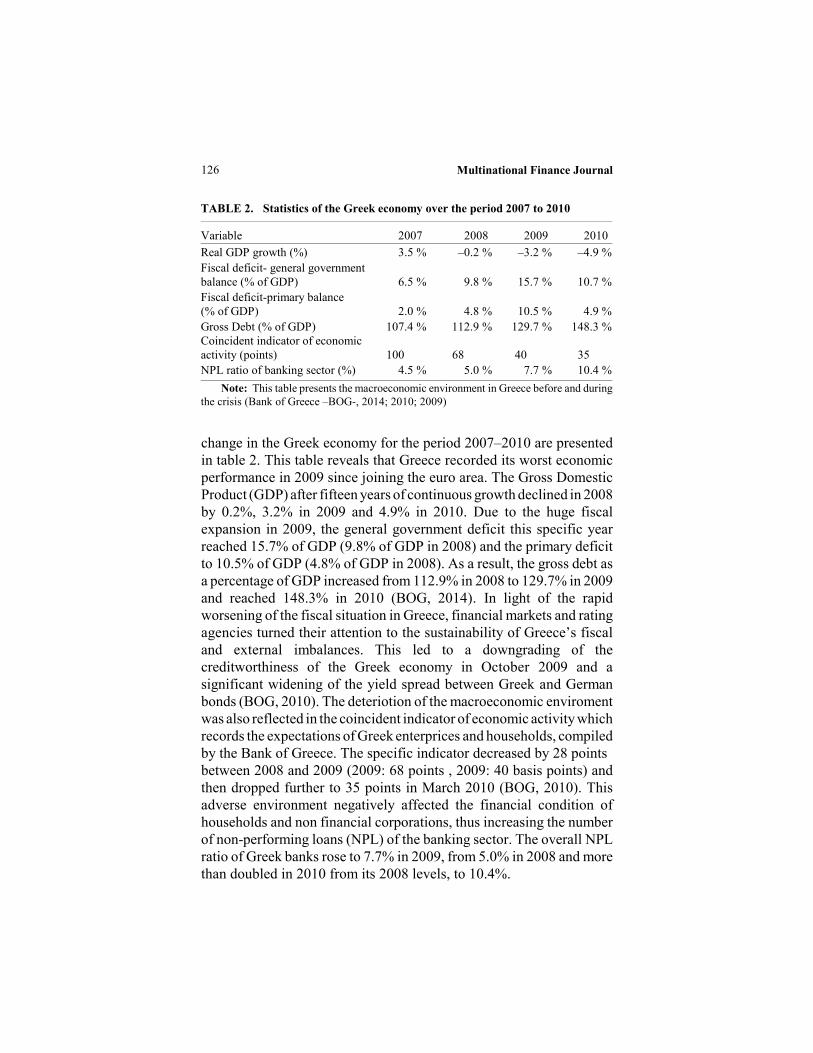
change in the Greek economy for the period 2007–2010 are presentedin table 2. This table reveals that Greece recorded its worst economicperformance in 2009 since joining the euro area. The Gross DomesticProduct (GDP) after fifteen years of continuous growth declined in 2008by 0.2%, 3.2% in 2009 and 4.9% in 2010. Due to the huge fiscalexpansion in 2009, the general government deficit this specific yearreached 15.7% of GDP (9.8% of GDP in 2008) and the primary deficitto 10.5% of GDP (4.8% of GDP in 2008). As a result, the gross debt asa percentage of GDP increased from 112.9% in 2008 to 129.7% in 2009and reached 148.3% in 2010 (BOG, 2014). In light of the rapidworsening of the fiscal situation in Greece, financial markets and ratingagencies turned their attention to the sustainability of Greece’s fiscaland external imbalances. This led to a downgrading of thecreditworthiness of the Greek economy in October 2009 and asignificant widening of the yield spread between Greek and Germanbonds (BOG, 2010). The deteriotion of the macroeconomic enviromentwas also reflected in the coincident indicator of economic activity which records the expectations of Greek enterprices and households, compiledby the Bank of Greece. The specific indicator decreased by 28 points between 2008 and 2009 (2009: 68 points , 2009: 40 basis points) andthen dropped further to 35 points in March 2010 (BOG, 2010). Thisadverse environment negatively affected the financial condition ofhouseholds and non financial corporations, thus increasing the numberof non-performing loans (NPL) of the banking sector. The overall NPLratio of Greek banks rose to 7.7% in 2009, from 5.0% in 2008 and morethan doubled in 2010 from its 2008 levels, to 10.4%.
TABLE 2. Statistics of the Greek economy over the period 2007 to 2010
Variable 2007 2008 2009 2010 Real GDP growth (%) 3.5 % –0.2 % –3.2 % –4.9 %Fiscal deficit- general governmentbalance (% of GDP) 6.5 % 9.8 % 15.7 % 10.7 %Fiscal deficit-primary balance (% of GDP) 2.0 % 4.8 % 10.5 % 4.9 %Gross Debt (% of GDP) 107.4 % 112.9 % 129.7 % 148.3 %Coincident indicator of economicactivity (points) 100 68 40 35NPL ratio of banking sector (%) 4.5 % 5.0 % 7.7 % 10.4 %
Note: This table presents the macroeconomic environment in Greece before and duringthe crisis (Bank of Greece –BOG-, 2014; 2010; 2009)

127The Determinants of Shareholder Value in Retail Banking During Crisis Years
TABL
E 3.
Des
crip
tive
stat
istic
s of d
epen
dent
, ind
epen
dent
and
oth
er v
aria
bles
for
the
tota
l per
iod
and
sepa
rate
ly fo
r th
e pe
riod
befo
re (P
erio
d A
) and
dur
ing
(Per
iod
B) th
e cr
isis.
Tota
l per
iod
mea
nm
edS.
DM
inm
axRI
OE
0.01
40.
022
0.02
9–0
.179
0.11
9C
OST
0.01
40.
013
0.00
40.
001
0.13
3C
R0.
614
0.40
00.
490
0.00
03.
922
ID0.
064
0.05
30.
041
0.00
60.
559
SPRE
AD0.
046
0.04
40.
016
0.00
10.
238
Tota
l cos
ts (e
xcl.
bank
ov
erhe
ad c
osts
and
depr
ecia
tion,
eur
o)61
594
5924
016
897
2405
012
3900
Loan
loss
impa
irmen
ts(e
uro)
1518
8611
2500
1252
970,
0011
0901
0N
et in
tere
st in
com
e fro
m
loan
s(be
fore
pro
visio
ns,
euro
)25
8038
2433
7011
0696
4670
1219
000
Fee
inco
me
(eur
o)19
373
1560
015
827
200
2663
00To
tal b
ranc
h in
com
e(e
uro)
3115
6129
4230
1169
0461
720
1278
900
Loan
s bal
ance
(in m
illio
n, E
uro)
67,4
9466
,031
19,3
1823
,145
125,
210
( Con
tinue
d )

Multinational Finance Journal128
TABL
E 3.
(Con
tinue
d)
Perio
d A
Perio
d B
mea
nM
edS.
Dm
inm
axM
ean
med
S.D
min
max
RIO
E0.
032
0.03
00.
012
–0.0
800.
110
–0.0
060.
004
0.03
0–0
.180
0.12
4C
OST
0.
015
0.01
00.
005
0.00
00.
130
0.01
330.
010
0.00
40.
001
0.06
0C
R0.
384
0.37
00.
123
0.00
03.
060
0.87
80.
750
0.60
60.
003.
920
ID0.
066
0.05
20.
044
0.01
00.
410
0.06
20.
050
0.03
70.
010
0.56
0SP
READ
0.04
80.
050
0.01
70.
001
0.24
00.
044
0.04
00.
0156
0.01
80.
220
Tota
l cos
ts (e
xcl.
bank
ove
rhea
d co
sts a
nd
depr
ecia
tion,
eur
o)
6150
158
870
1767
021
000
1239
0061
701
5985
015
971
1689
711
5000
Loan
loss
impa
irmen
ts(e
uro)
95
620
8673
061
095
0,00
1250
7921
6191
1888
0014
7000
0,0
011
0901
0N
et in
tere
st in
com
e fro
m lo
ans(
befo
re
prov
ision
s, eu
ro)
2470
7323
5780
1064
6746
7010
7070
027
0569
2518
8011
4072
4530
012
1900
0Fe
e in
com
e (e
uro)
21
678
1700
018
839
3100
2428
0016
739
1426
010
873
2000
2663
00To
tal b
ranc
h in
com
e(e
uro)
33
3184
3202
2411
8819
6172
011
8460
028
6849
2707
8010
9587
6400
012
7890
0Lo
ans b
alan
ce(in
mill
ion,
Eur
o)
62,4
8060
,060
18,9
9023
,140
123,
135
73,2
2472
,220
18,0
4938
,097
125,
212
( Con
tinue
d )
129The Determinants of Shareholder Value in Retail Banking During Crisis Years
TABL
E 3.
(Con
tinue
d)
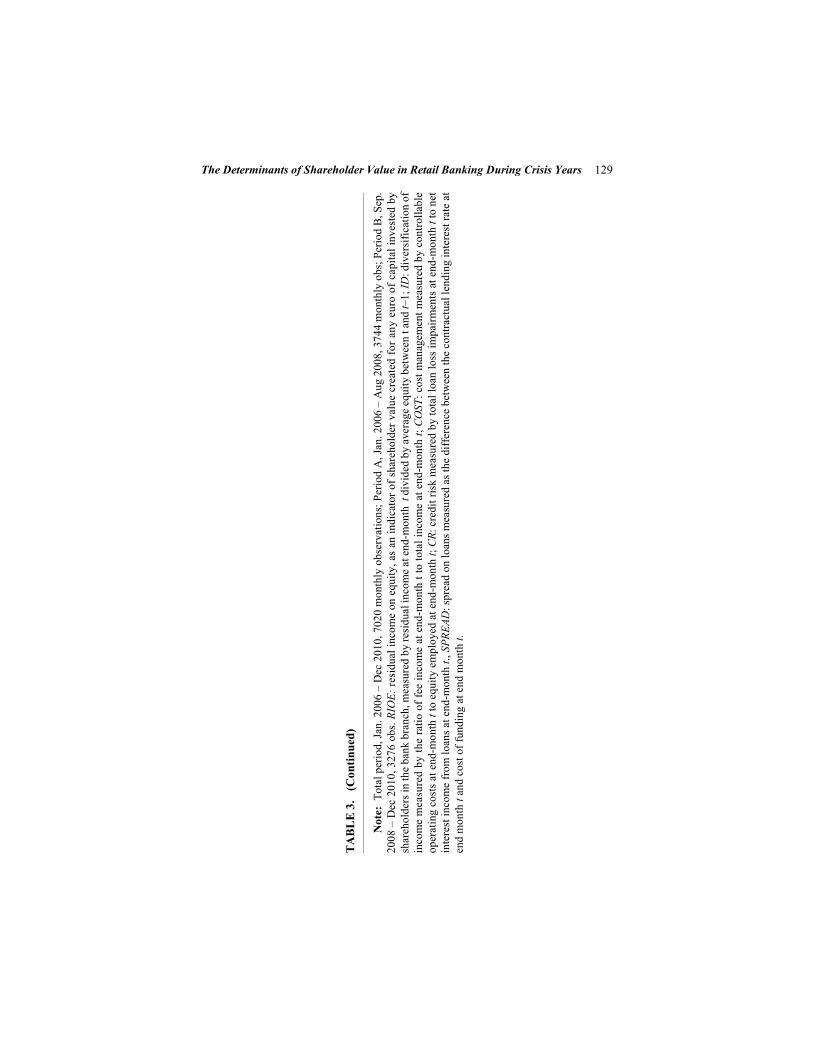
Not
e: T
otal
per
iod,
Jan.
200
6 –
Dec
201
0, 7
020
mon
thly
obs
erva
tions
; Per
iod
A, J
an. 2
006
– A
ug 2
008,
374
4 m
onth
ly o
bs; P
erio
d B,
Sep
.20
08 –
Dec
201
0, 3
276
obs.
RIO
E: re
sidu
al in
com
e on
equ
ity, a
s an
indi
cato
r of s
hare
hold
er v
alue
cre
ated
for a
ny e
uro
of c
apita
l inv
este
d by
shar
ehol
ders
in th
e ba
nk b
ranc
h, m
easu
red
by re
sidu
al in
com
e at
end
-mon
th t
div
ided
by
aver
age
equi
ty b
etw
een
t and
t–1;
ID: d
iver
sific
atio
n of
inco
me
mea
sure
d by
the
ratio
of f
ee in
com
e at
end
-mon
th t
to to
tal i
ncom
e at
end
-mon
th t;
CO
ST: c
ost m
anag
emen
t mea
sure
d by
con
trolla
ble
oper
atin
g co
sts a
t end
-mon
th t
to e
quity
em
ploy
ed a
t end
-mon
th t;
CR:
cre
dit r
isk
mea
sure
d by
tota
l loa
n lo
ss im
pairm
ents
at e
nd-m
onth
t to
net
inte
rest
inco
me
from
loan
s at e
nd-m
onth
t., S
PREA
D: s
prea
d on
loan
s mea
sure
d as
the
diff
eren
ce b
etw
een
the
cont
ract
ual l
endi
ng in
tere
st ra
te a
ten
d m
onth
t an
d co
st o
f fun
ding
at e
nd m
onth
t.

Multinational Finance Journal130
The descriptive statistics of the estimated dependent, independentand other variables for the homogenous sample of 117 branches,focusing initially in the total period of the analysis and separately beforethe financial crisis (Period A: January 2006–August 2008) and duringthe crisis (Period B: September 2008–December 2010), are presented intable 3. In summary, significant differences in SHV creation for oursample retail branches are observed when comparing the two periods.
Finally, as shown in table 4 the magnitude of the estimatedcorrelation coefficients between the independent variables is usuallysmaller than 15% (except in two cases where the coefficients are around34% and 26%), suggesting that the model do not suffer frommulticollinearity problems.
IV. Methology
A. Model Specification
The SHV creation in retail branches, measured by RI (dependentvariable), is linked to four potential value drivers (independentvariables). In order to control for size effects and minimizeheteroscedasticity in the model, the RI is standardized by Equity (RIOE)
TABLE 4. Pearson correlation coefficients of variables used in the shareholdervalue driver analysis
Variables RIOE D CR C S RIOE 1ID –0.0010
(–0.08) 1CR –0.8887 –0.0034
(–1.62)*** (–0.29) 1COST 0.0613 0.1052 –0.1302
(5.14)*** (8.86)*** (–1.10)*** 1SPREAD 0.4229 –0.3461 –0.2628 0.0106
(3.91)*** (–3.09) *** (–2.21)*** (0.88) 1Note: The variables are as follows: RIOE: residual income on equity; ID: diversification
of income measured by the ratio of fee income at end-month t to total income at end-montht; COST: cost management measured by controllable operating costs at end-month t to equityemployed at end-month t; CR: credit risk measured by total loan loss impairments atend-month t to net interest income from loans at end-month t., SPREAD: Spread on loansmeasured as the difference between the contractual lending interest rate at end month t andcost of funding at end month t. Also, *** , ** , and * represent statistical significance of thecoefficients at 1%, 5% and 10% levels, respectively.

131The Determinants of Shareholder Value in Retail Banking During Crisis Years
so that this ratio expresses the shareholder value created for any euro ofcapital invested by shareholders in the bank branch. As independentvariables are incorporated into the model the income diversification(ID), the cost management (COST), the credit risk (CR) and the lendingspreads (SPREAD). For capturing the effect of value drivers on RI,given that the crisis occurred, a crisis dummy variable (CD) isintroduced taking on the value of 1 in the period of the financial crisisand 0 otherwise (Iqbal and Kumel, 2014). This dummy variable ismultiplied separately with each of the four independent variables andthus four interaction variables included in the model, the coefficients ofwhich show the supplementary impact of each independent variable onthe RI in periods of credit crunch. It is worth noting that are notincorporated into the model macro or regional economic determinantsas control variables, such as the disposable income per capita or theunemployment rate, since these variables were found to be fixed overmonthly periods.
A fixed-effects panel data regression model is specified to accountfor the individuality of each branch as well as time effects. Thefixed-effects model specification is illustrated assuming constant slopecoefficients but intercepts that vary over time or individual branches(Baltagi, 2005). Because extremes in the values of the dependent andindependent variables might distort the true picture of the relationshipbetween these variables, before running the regression the dependentand independent variables are winsorized at 5% in both tails (the lowerand upper five percent of the observations of the variables are replacedwith the next value inwards from these extreme tails):
1 2 3 4it i t it it it itRIOE b ID b COST b CR b SPREAD
(2)5 6 7it it itb CD ID b CD COST b CD CR
8 it itb CD SPREAD u
The definition of each independent variable is given above on table 1.Also: i denotes the number of retail branches (1 to 117 for thehomogeneous sample of branches); t denotes the corresponding months(1 to 60); CD is the crisis dummy indicator variable as described aboveand uit denotes the disturbance term which varies with branches andtime. The differences across branches are captured in differences in theconstant term µi and differences over time in the constant term of λt. Thebranch specific effects and period specific effects are assumed fixedparameters to be estimated as coefficients of branch dummies andperiod dummies for each retail branch and for each period in the samplerespectively. The estimations of the above fixed-effects specification are

Multinational Finance Journal132
corrected for heteroscedasticity by using the White (diagonal) robustcoefficient variance method (Arellano, 1987; White, 1980).
Β. Fit of model specification
In order to test the fit of the above fixed-effects model to the data set,several tests are performed (the results are presented below at table 5 –Panel B). Initially the stationarity of the panel is tested since the use ofrelatively large periods T as in our study (T=60) may indicatenon-stationarity of the panel. The Fisher unit-root test is employed forthe identification of stationarity in variables. The null hypothesis ofnon-stationarity is rejected at the 1% level for the dependent andindependent variables.
Then a basic F-test is run for joint parameter insignificance. With anF-statistic of 2752.21 (with 4 and 6,836 degrees of freedom), the nullhypothesis that coefficients are jointly insignificant at the 1% level isrejected and thus does not show a misspecification of the model. Thenext step is to test that branch specific effects exist and that thefixed-effects model is preferred over the pooled regression model whichassumes omission of the bank and time variant effects. With an F-statistic of 15.95 (with 116 and 6,836 degrees of freedom), the nullhypothesis that coefficients of branch dummies are redundant and equalto zero at the 1% level is rejected. Also, the null hypothesis (F-statisticof 122.94 with 59 and 6,836 degrees of freedom) that all the coefficientsof time-dummies are jointly equal to zero is rejected as well as all thecoefficients of branch dummies and time dummies are jointly equal tozero (F-statistic of 54.98 with 175 and 6836 degrees of freedom).Results therefore suggest that individual branch specific effects andtime period effects exist and the appropriate model is the fixed-effectsmodel.
The final test is to examine that the effects are fixed and not random.The nature of the data indicates that the branch-specific effects arecorrelated with the independent variables (for example some branchmanagers with an experience-managerial skills effect-have thediscretion to charge lower spreads on loans). The Hausman test statistic(Hausman, 1978) with a value of 138.88 rejects the null hypothesis thatindependent variables are not correlated with the branch specific effect.In summary, the results of the above tests conducted suggest that thefixed-effects model produces efficient coefficient estimates.
C. Alternative models
In order to further confirm the fit of the fixed-effects model to the data

133The Determinants of Shareholder Value in Retail Banking During Crisis Years
set, different robustness checks are run. As Garcia-Herrero, Gavila andSantabarbara (2009) outline, when estimating bank performance theresearcher faces three challenges: One is the risk of omitted variables,the second is endogeneity and the last is the potential persistence of thedependent variable.
As regards the first challenge, the use of fixed-effects at the branchand month level effectively reduces the omitted variable bias. Withrespect to endogeneity problems the results are expected to not sufferfrom it, since the study explores crisis effects on the SHV determinantsin the retail banking where there is an exogenous shock to the bankingindustry. To econometrically confirm this, a Two-Stage Least Squarespanel model (TSLS) is applied, often employed in the context ofendogeneity (Wooldridge, 2009). The first lag of all independentvariables which could potentially suffer from endogeneity, is used asinstrumental variables. The last challenge is the persistence of thedependent variable RIOE. The economic rationale is that bank netoperating income shows a tendency to persist over time and there is alsoa need to account for the autoregressive process in the data regardingthe behavior of RI. Therefore a dynamic specification of the model isadopted by including a lagged dependant variable (first lag of RIOE)among the independent variables as various studies applied (Fiordelisiand Molyneux, 2010; Athanasoglou, Brissimis and Delis, 2008). Thesystem Generalized Method of Moments (GMM) estimators, developedfor dynamic panels by Arellano and Bond (1991), is used to assess therelationship between SHV and its determinants. Also, this methodologyaccounts for endogeneity, so the lagged values (first lag) of all theindependent variables are used as instruments. Arrelano and Bond(1991) proposed the one and two-step estimators. The one–step GMMestimator9 is employed, corrected for serial correlation and time varyingvariances in the disturbances by using the White period robustcoefficient variance method.
V. Empiricial findings
This section describes the econometric results for the homogenous
9. Monte Carlo studies have found that this estimator outperforms the two-stepestimator both in terms of producing a smaller bias and a smaller standard deviation of theestimates (Judson and Owen, 1999). Also, the panel data of this study is characterized by alarge T (T=60), coping with the argument that Arrellano and Bond estimators are inefficientwhen applied to panel with very small T.

Multinational Finance Journal134
TABLE 5. Panel data regression results for different models and the redundantfixed-effects tests.
A. regression results
RIOE Ratio FE model TSLS model GMM model Intercept 0.0311*** 0.0244*** –RIOEt–1 – – –0.0013ID 0.0518*** 0.0624*** 0.0538***COST –0.7486*** –0.2785*** –1.8390***CR –0.0417*** –0.0444*** –0.0642***SPREAD 0.7178*** 0.8364*** 0.7659***CD*ID –0.0935*** –0.1151*** –0.1630***CD*COST –0.4772*** –0.6111*** –1.6590***CD*CR –0.0089*** –0.0078*** 0.0168***CD*SPREAD –0.4234*** –0.5745*** –0.8125***R2 0.9663 0.9643 –J-statistic – – 5,913
B. redundant FE model tests
Effects test Statistic ProbabilityJoint coefficient insignificance F 2752.21 0.000Cross – section F 15.95 0.000Period F 122.94 0.000Cross- section/period F 54.98 0.000Fisher panel unit root for dependent and independent variablesVariables RIOE ID COST CR SPREADTest statistic 319.38 602.25 1439.20 765.23 1088.74Probability 0.000 0.000 0.000 0.000 0.000
Note: This table reports the panel data regressions results (Panel A) using equation (2)for the Fixed-Effects (FE) model specification, the Two-Stage Least Squares (TSLS) modelspecification and the Generalized Method of Moments (GMM) model specificationrespectively and also the redundant fixed-effects tests (Panel B). The variables are as follows:RIOE: residual income on equity, as an indicator of shareholder value created for any euroof capital invested by shareholders in the bank branch, measured by residual income atend-month t divided by average equity between t and t–1; ID: diversification of incomemeasured by the ratio of fee income at end-month t to total income at end-month t; COST:cost management measured by controllable operating costs at end-month t to equity employedat end-month t; CR: credit risk measured by total loan loss impairments at end-month t to netinterest income from loans at end-month t. SPREAD: Spread on loans measured as thedifference between the contractual lending interest rate at end month t and cost of funding atend month t; CD: a crisis dummy variable taking on the value of 1 in the period of thefinancial crisis and 0 otherwise; CD*ID,CD*COST,CD*CR,CD*SPREAD: the coefficientsof these variables measure the supplementary impact of each independent variable on theRIOE given the crisis occurred. For the fixed-effects specification the estimates are correctedfor heteroscedasticity by using the White (diagonal) robust coefficient variance method.

135The Determinants of Shareholder Value in Retail Banking During Crisis Years
sample branches and the three branch network samples respectively.
A. Econometric results for the homogeneous sample branches
In table 5 the efficient coefficient estimates of the fixed-effects model,the TSLS model, the one-step GMM specification (Panel A) and theredundant fixed-effects tests (Panel B) are presented. As regards theone-step GMM specification, the lagged dependent variable, whichmeasures the degree of persistence of the dependent variable RIOE, isnot statistically significant, so the use of a dynamic model is notjustified. Also, the efficient coefficient estimates of the TSLS model arevery similar to the estimates of fixed-effects model specification.
Looking at the impact of diversification of income on SHV, it isobserved that the specific diversification creates value as shown by thepositive and statistically significant coefficient (+ 0.0518) at the 1%level. This finding therefore strongly suggests that branches with a highshare of fee income relative to total income create more value. Thisresult stands in line with the results of Cipollini and Fiordelisi (2012)and Fiordelisi and Molyneux (2010). However this positive relationshipbetween SHV and income diversification doesn’t hold anymore duringcrisis years. The crisis causes a reduction of the value of the coefficientby – 0.0935 (statistically significant at the 1%), bringing the total effectto a negative coefficient –0.0417 (0.0518–0.00935). This negativeimpact of diversification on SHV indicates that a diversified businessmix is not appropriate during the crisis (taking into account also thedecreased fee operation volumes that are recorded that period) and thebank management should focus on the efficient allocation of theresources to operations that are related with the remedial management
TABLE 5. (Continued)
Note: The reported R-squared (estimated by e-views which is based on the differencebetween the residual sums of squares form the estimated model and the sums of squares froma single constant only specification, not from a fixed-effects only specification) describes theexplanatory power of the entire specification including the estimated fixed-effects. For theTSLS model specification, we use lagged values (first lag) of all the independent variablesas instruments which could potentially suffer from endogeneity. Finally, for the GMM modelspecification, we include a lagged dependant variable (first lag of RIOE) among theindependent variables to account for persistence. Also, we use lagged values (first lag) of allthe independent variables as instruments, which could potentially suffer from endogeneity.We employ the one–step GMM estimator (corrected for serial correlation and time varyingvariances in the disturbances by using the White period robust coefficient variance method).Also, *** , ** , and * represent statistical significance of the coefficients at 1%, 5% and10% levels, respectively. Finally: number of cross-sections used 117; number of time- periods60; total panel balanced observations 7,020. (See equation 2)

Multinational Finance Journal136
of loan portfolio. This result verifies the research hypothesis (H1) andstands in contrast to the findings of Dietrich and Wanzenried (2010),who point out a positive relationship between income diversificationand bank profitability for the Swiss banking sector during the crisisperiod. This different finding is attributed to the different structure ofboth the Greek and the Swiss commercial banking that leads to adifferentiated approach of fee income in the two industries. This impliesa different research design and findings. Specifically, this studyexamines pure retail banking operations of branch networks where feeincome is related to network commissions. In turn, Dietrich andWanzenried (2010) explore different types of commercial bankingoperations (cantonal banks, regional and saving banks, Raiffeisen banks,other banks specializing in the stock exchange, securities and assetmanagement) where the non interest income includes also and tradingoperations. So they conclude a positive profitability effect of incomediversification reflected in a positive development of the stock marketand a higher stock exchange turnover.
Furthermore, the study reveals that inefficient cost managementdestroys value as shown by the negative and statistically significantcoefficient (–0.7486) at the 1% level. The more efficient a branch is thehigher is its SHV creation. This result supports the findings of theexisting SHV literature (Fiordelisi and Molyneux, 2010; Gross, 2006).Accordingly, the “cost skimping” hypothesis – as branches becomemore cost efficient they also this increases their non-performing loans-is not supported by the study findings. The crisis destroys value more,increasing the value of the coefficient by –0.4772 (statisticallysignificant at the 1%), bringing the total effect to – 1.2259 ((–0.7486 +(–0.4772)). This result supports the research hypothesis (H2) and isrelevant to the finding of Dietrich and Wanzenried (2010) who suggestthat an increase in cost efficiency during the crisis can offset thedecrease in profits due to falling demand for new loans and thus createvalue.
Regarding the impact of credit risk taking on value creation, it isobserved that higher credit risk destroys value as shown by the negativeand statistically significant coefficient (–0.0417) at the 1% level. Thisfinding therefore strongly suggests that branches with higher riskcapabilities create more value than other branches. This result stands inline with the results of Fiordelisi and Molyneux (2010) and Gross(2006). Accordingly, the “good luck” hypothesis – as branches take onmore credit risks they also boost their interest revenues – is notsupported by the results. The crisis period destroys value more,increasing the value of that specific coefficient by – 0.0089 (statisticallysignificant at the 1%), bringing the total effect to – 0.0506 ((–0.0417 +(–0.0089)). The reason for this extra negative impact on SHV is that
137The Determinants of Shareholder Value in Retail Banking During Crisis Years
loan loss impairments have significantly increased during the crisis.This result verifies the relevant research hypothesis (H3) and stands inline with the findings of Dietrich and Wanzenried (2010), who report anegative impact of credit risk taking on profitability during crisis years.
Finally, an increase on lending spreads creates SHV as shown by thepositive and statistically significant coefficient (+0.7178) at the 1%level. This finding suggests that branches which charge higher lendingmargins to their loan customers create more value than other branches.Also, the effect of higher interest income seems to over compensate therisk that high interest margins may lead to a decrease in credit quality.This result is in line with the results of Dermine (2010, 2009). However,things look different for the crisis years, which is quite interesting. Thefinancial crisis reduces the value of that coefficient by –0.4234(statistically significant at the 1%), bringing the total effect to + 0.2944(0.7178 – 0.4234). This result supports the research hypothesis (H4) andprovides empirical evidence of the increased risk that entered intobranch loan portfolio during the expansion period and revealed in thecrisis years.
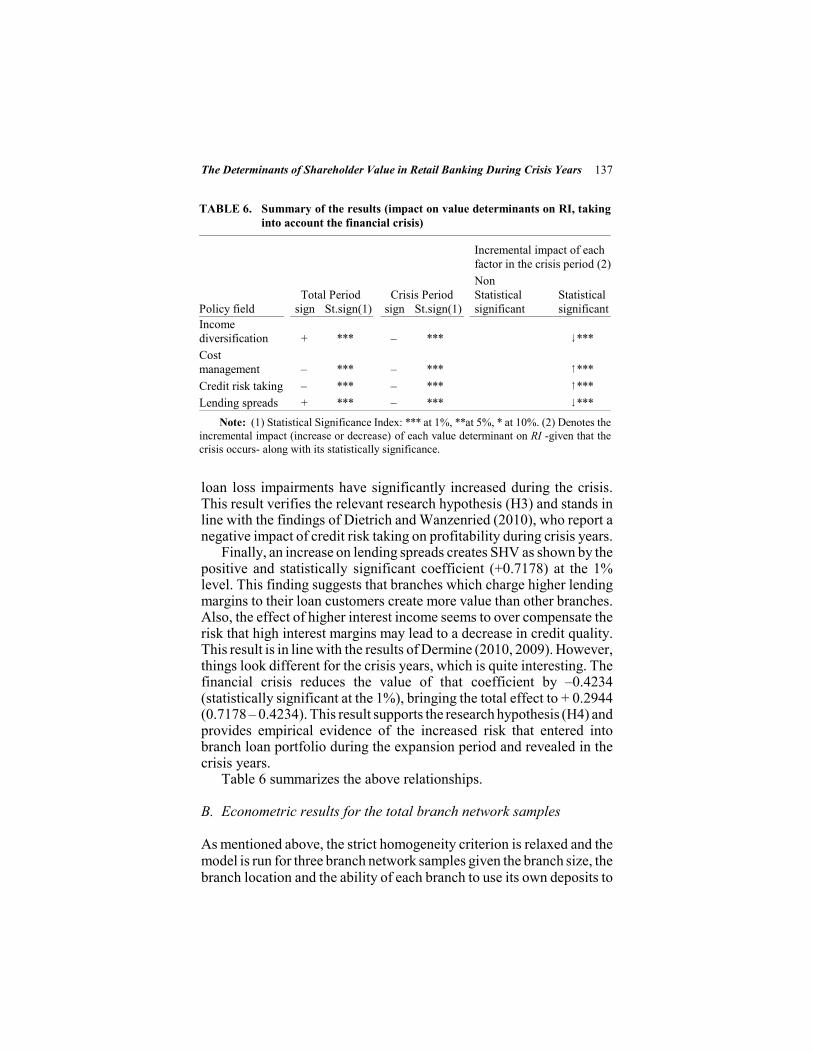
Table 6 summarizes the above relationships.
B. Econometric results for the total branch network samples
As mentioned above, the strict homogeneity criterion is relaxed and themodel is run for three branch network samples given the branch size, thebranch location and the ability of each branch to use its own deposits to
TABLE 6. Summary of the results (impact on value determinants on RI, takinginto account the financial crisis)
Incremental impact of eachfactor in the crisis period (2) Non
Total Period Crisis Period Statistical StatisticalPolicy field sign St.sign(1) sign St.sign(1) significant significantIncome diversification + *** – *** 9***Costmanagement – *** – *** 8***Credit risk taking – *** – *** 8***Lending spreads + *** – *** 9***
Note: (1) Statistical Significance Index: *** at 1%, **at 5%, * at 10%. (2) Denotes theincremental impact (increase or decrease) of each value determinant on RI -given that thecrisis occurs- along with its statistically significance.

Multinational Finance Journal138
TABL
E 7.
Pane
l dat
a re
gres
sion
resu
lts (f
ixed
-effe
cts m
odel
) for
bra
nch
netw
ork
sam
ples
Bran
ch si
zeBr
anch
loca
tion
RIO
EBa
sic m
odel
Smal
l M
ediu
mLa
rge
Urb
anRu
ral
islan
dIn
terc
ept
0.03
11**
*0.
0406
***
0.02
85**
*0.
0537
***
0.02
78**
*0.
0324
***
0.03
14**
*ID
0.05
18**
*–0
.006
10.
0616
***
0.05
37**
*0.
0564
***
0.05
49**
*0.
0569
**C
OST
–0.7
486*
**–0
.978
9***
–0.8
347*
**–0
.789
7***
–0.8
949*
**–0
.785
3***
–0.7
260*
**C
R–0
.041
7***
–0.0
342*
**–0
.039
7***
–0.0
436*
**–0
.036
8***
–0.0
446*
**–0
.058
7***
SPRE
AD 0
.717
8***
0.63
50**
*0.
7207
***
0.71
33**
*0.
7981
***
0.69
56**
*0.
7460
***
CD
* ID
–0.0
935*
**0.
0064
–0.0
461*
**–0
.062
8***
–0.0
698*
**–0
.081
0***
–0.0
841*
**C
D*C
OST
–0.4
772*
**–0
.015
6–0
.331
1***
–0.6
033*
**–0
.481
2***
–0.3
900*
**–0
.449
9***
CD
*CR
–0.0
089*
**–0
.026
4***
–0.0
121*
**–0
.006
1***
–0.0
113*
**–0
.010
1***
0.00
43C
D*S
PREA
D–0
.423
4***
–0.4
306*
**–0
.403
7***
–0.2
958*
**–0
.302
2***
–0.3
875*
**–0
.361
3***
R2 0
.966
00.
9300
0.95
600.
9562
0.92
030.
9650
0.95
20O
bser
vatio
ns
7020
1500
7260
7380
6120
4800
1860
(117
br.)
(25
br.)
(121
br.)
(123
br.)
(102
br.)
(80
br.)
(31
br.)
( Con
tinue
d )

139The Determinants of Shareholder Value in Retail Banking During Crisis Years
TABL
E 7.
(Con
tinue
d)
Loan
to D
epos
it ra
tioRI
OE
Basic
mod
elLD
< 9
0%90
%<L
D<1
20%
LD>1
20%
Inte
rcep
t0.
0311
***
0.02
38**
*0.
0317
***
0.02
87**
*ID
0.05
18**
*0.
0990
***
0.05
46**
*0.
0669
***
COST
–0.7
486*
**–0
.834
0***
–1.0
805*
**–0
.948
7***
CR–0
.041
7***
–0.0
433*
**–0
.044
2***
–0.0
444*
**SP
REA
D0.
7178
***
0.78
15**
*0.
7078
***
0.72
05**
*CD
*ID
–0.0
935*
**–0
.097
6***
–0.0
398*
**–0
.043
2***
CD*C
OST
–0.4
772*
**–0
.024
6–0
.119
6–0
.074
3CD
*CR
–0.0
089*
**–0
.005
5***
–0.0
074*
**–0
.008
6***
CD*S
PREA
D–0
.423
4***
–0.2
342*
**–0
.366
4***
–0.4
074*
**R2
0.96
600.
9390
0.96
560.
9684
Obs
erva
tions
7020
4020
3540
5700
(117
br.)
(67
br.)
(59
br.)
(95
br.)
Not
e: T
his
tabl
e re
ports
the
pane
l dat
a re
gres
sion
s re
sults
(Fix
ed-e
ffec
ts m
odel
spe
cific
atio
n) u
sing
equ
atio
n (2
) for
our
bas
ic m
odel
(117
bran
ches
) and
the
thre
e br
anch
net
wor
k sa
mpl
es a
ccor
ding
to: t
he b
ranc
h si
ze g
iven
the
depo
sit b
alan
ces (
smal
l-siz
ed, m
ediu
m-s
ized
and
larg
ebr
anch
es);
the
busi
ness
env
ironm
ent t
hat b
ranc
hes o
pera
te (u
rban
, rur
al a
nd is
land
pla
ced
bran
ches
); th
eir l
oan
to d
epos
it ra
tio (L
/D ra
tio <
90%
,90
%<L
/D r
atio
<120
%, L
/D r
atio
>12
0%).
The
equa
tion
and
the
used
var
iabl
es a
re t
he s
ame
as t
able
4. T
he e
stim
ates
of
the
fixed
-eff
ects
spec
ifica
tion
are
corr
ecte
d fo
r he
tero
sced
astic
ity b
y us
ing
the
Whi
te (
diag
onal
) ro
bust
coe
ffic
ient
var
ianc
e m
etho
d. T
he r
epor
ted
R-sq
uare
d(e
stim
ated
by
e-vi
ews w
hich
is b
ased
on
the d
iffer
ence
bet
wee
n th
e res
idua
l sum
s of s
quar
es fo
rm th
e est
imat
ed m
odel
and
the s
ums o
f squ
ares
from
a sin
gle c
onst
ant o
nly s
peci
ficat
ion,
not f
rom
a fix
ed-e
ffec
ts on
ly sp
ecifi
catio
n) de
scrib
es th
e exp
lana
tory
pow
er of
the e
ntire
spec
ifica
tion i
nclu
ding
the
estim
ated
fixe
d-ef
fect
s. A
lso,
***
, **
, an
d *
repr
esen
t sta
tistic
al si
gnifi
canc
e of
the
coef
ficie
nts a
t 1%
, 5%
and
10%
leve
ls, r
espe
ctiv
ely.

Multinational Finance Journal140
make loans. In table 7 the efficient coefficient estimates of the fixed-effects
model are presented, for both the basic model (results of table 5 for the117 branches) and the three branch network samples models. As regardsthe branch size criterion, the results of the basic model are confirmed insign and significance in the medium-sized and large-sized branchessamples. Some different results are found when we look at thesmall-sized branches sample, where the income diversification variablehas a negative sign but with no statistical significance (–0.0061). Duringthe crisis the value of that coefficient is positive (+ 0.0064), but with nostatistical significance. So, the competitive advantage of a diversifiedbusiness mix doesn’t seem to be significant for the small-sizedbranches. Also, for the variable of operating expenses management thenegative sign during the crisis (–0.0156) is confirmed but with nostatistical significance. As regarding the business environment thatbranches are operating, the results for the branches operating in urbanand rural areas respectively are the same and confirm those of the basicmodel. Some different results are found in the sample composed ofbranches operating on islands, for which the credit risk variable has apositive sign during the crisis (+0.0043), but with no statisticalsignificance. Finally as regarding the criterion of loan to deposits ratio,the results of the basic model are confirmed in sign and significance forall three samples. Some variations are found for the variable of costmanagement - for all models- during the crisis, where although the signis negative such as the basic model, there is no statistical significance.
Thus, the results do not depend on the different size of branches,except for small-sized branches as regarding the impact of incomediversification; results do not change based on the location of branches,except for branches operating on islands as regarding the impact ofcredit risk in the crisis period; results do not change based on the abilityof a branch to finance loans by its own deposits.
VI. Discussion and conclusions
This section summarizes our main findings and presents some policyimplications.
A. Main findings
This paper examines the recent crisis effects on branch bank

141The Determinants of Shareholder Value in Retail Banking During Crisis Years
performance in terms of SHV of one of the four largest Greekcommercial banks over the period 2006–2010. This unique data set ofunpublished monthly P&L statements of retail branches is ideally suitedto investigate the SHV process as Greece, being part of the Euro zonecrisis, offers a unique environment (sovereign debt) to analyze factorsof value creation and destruction. A fixed-effects model specificationis used which produces efficient estimates according to the differentestimation methods that the study employed. This study finds thatdiversification, cost management, credit risk, and lending spreads are allsignificantly associated with the RI, but with a different statistical sign.In particular, the findings reveal that diversified income, efficient costmanagement and high lending spreads in general, all increase SHVsignificantly. Taking into account the branch network samples, theincome diversification variable doesn’t seem to be significant forsmall-sized branches. In contrast, high credit risk expressed inaccumulated loan impairments destroys value substantially. SHVliterature supports the findings as regards diversified income (Cipolliniand Fiordelisi, 2012; Fiordelisi and Molyneux, 2010), credit risk (Gross,2006) and cost management (Fiordelisi and Molyneux, 2010; Gross,2006). The result for the impact of income diversification is somewhatdifferent from the findings of Dietrich and Wanzenried (2010) due todifferences in the commercial banking structure of Greece andSwitzerland. Also, the findings for credit risk and cost management arein line with the results of Athanasoglou, Brissimis and Delis (2008) whoinvestigated profitability determinants for the Greek banking sector.
In the period of the financial crisis, important and statisticallysignificant changes in the SHV effect of the independent variables areobserved. In particular, income diversification and lending spreads losetheir dynamic causing a statistically significant reduction in SHV. Forincome diversification the impact of the crisis is substantial in reversingthe value effect from a value premium to value destruction. At the sametime, cost management increases its positive value effect with astatistical significance. Moreover, (in the crisis period) the enormousincrease of loan loss impairments relative to the income of loans (creditrisk) exercises an extra negative impact on SHV thus furtheraccelerating shareholder value destruction, excluding the branchesoperating on islands due to positive effects of international tourism.This finding provides evidence for loan portfolio segmentation acrossseveral geographical areas in order to implement different resolutionprocesses.
Multinational Finance Journal142
To sum up, this study sheds light on the issue of retail bankingperformance exhibiting the specific challenges for the bank managementin contrasting periods. Thus, it refreshes the conventional bankperformance discussion through the analysis of SHV creation anddestruction at bottom bank level. Furthermore, it enriches the specificdiscussion through the investigation of the impact of an exogenousshock in terms of crisis effects to the banking industry.
B. Policy implications
The study findings have some important management implications:Firstly, in the crisis period, it appears that the strategic priority for thebank management should be the reorganization of loan portfolios giventhe negative value impact of credit risk and the reduction of valuepremium of lending spreads. In this case, a revised credit policy ofcovering unsecured loans with collateral and lowering simultaneouslythe loan rate as an incentive to borrowers to provide collateral, mighthelp to increase SHV. This would be achieved by recording interestincome in the case of NPL and lowering the provision coefficient ratesof secured loans. Also, the destructive value effect of lending spreadsduring the crisis indicates that the adoption of a repricing policy to theloan’s portfolio is not appropriate and seems to reduce the repaymentability of lenders. Secondly, our findings indicate the requirement fora pro-active credit policy in the growth period and they provide arationale for countercyclical loan loss impairments. Consequently,banks should make provisions during good times for the increased riskthat enters into their portfolios. Thirdly, the crisis stresses theimportance of concentration of banking activity on core business andmainly on remedial and NPL management, instead of fee-based bankingproducts. Remedial management can be implemented by providingrestructuring solutions to lenders and improving the collectionperformance and the collaterals of loan accounts, while NPLmanagement should focus on NPL recoveries through enhancing nonperforming customer’s general divisions and units. Finally, an efficientbranch management of operational expenses encouraged by theintensification of branch rationalization measures (premisesrationalization, salary freezes, staff retrenchments etc.), streamlining ofadministration functions and processes and the application of newtechnologies (e.g., internal electronic systems) might help to create SHVin the crisis years. It is worth noting that efficiency gain actions such as

143The Determinants of Shareholder Value in Retail Banking During Crisis Years
retail network rationalization, voluntary exit schemes and centralizationof supporting functions were incorporated to strategic transformationprograms of all the Greek systemic banks during crisis years.
Overall, the empirical findings can have important implications forthe Greek economy itself given the crucial role of Greek banks tofinance the real economy. More specifically, the location of significantsources of value creation and destruction at the bottom-level of bankinginstitutions provide important implications for the assessment of thequality of bank performance and the change of its dynamic in theturbulent crisis environment, for both the bank managers and thepolicymakers. In addition, the empirical results offer useful lessons toother EU peripheral crisis economies such as Italy, Spain, and Portugalwith similar banking operations (e.g. pure retail banking) revealing theimportant role of crisis in the total value creation process.
This study has practical relevance due to the following reasons: Thepaper indicates an acceleration of SHV destruction caused by credit riskin the crisis years. This finding stresses the importance of setting rulesto manage credit risk, hence supporting the post-crisis initiatives takenby policymakers in the EU (European Banking Authority -EBA-,2014)10 for the effective management of NPL and arrears, attempting toachieve a single evaluation approach of credit portfolios by Europeanbanks. In addition, the results support specific SHV enhancing creditpolicies related with collateral management, repricing of existing loansand loan portfolio segmentation which might enrich EBA technicalstandards. Also, this study suggests a proactive and countercyclicalpolicy for the avoidance of SHV destruction of credit risk. This providesfurther support to banking regulation11 in terms of capital requirementsnecessary to absorb losses related to credit risk. The findings havepractical implications for bank management. In the crisis years bankmanagement should exhibit much more flexibility in restructuring loanportfolios through the establishment of an independent, organizational,division of managing arrears and NPL at institution level, and the
10. EBA published on 20/2/2014 a final draft: Implementing of technical standards onSupervisory reporting on forbearance and non performing exposures under article 99(4) ofRegulation (EU) No 575/2013. These technical standards were incorporated into Bank’s ofGreece supervisory practices through the Bank of Greece Executive Committee’s Act No42/30.05.2014.
11. EBA published on 23/12/2014 a final draft: Regulatory technical standards ondisclosure of information in relation to the compliance of institutions with the requirementfor a countercyclical capital buffer under Article 440 of Regulation (EU) No 575/2013.

Multinational Finance Journal144
concentration of branch networks solely on credit provision. The analysis was based on the fact that the banking crisis in Greece
originated primarily from the sovereign debt crisis in the country andthat domestic institutions were not the primary cause of the crisis.Therefore, special policy measures and regulatory advancements areneeded to weaken the links between sovereigns and banks and thusreduce exogenous shocks to the banking industry. The recentannouncement by the ECB to buy substantial amounts of governmentbonds each month from across the Euro zone, is expected to infusevaluable liquidity in the banking system with important positiveimplications for credit provision and risk as well as bankingperformance and stability in general.
Further investigation is required with alternative SHV models indifferent crisis countries and an extended set of value drivers which cancross validate the present research, thus enriching relevant discussion.
Accepted by: P.C. Andreou, PhD, Editor-in-Chief (Pro-Tem), March 2015
References
Andreou, P.; Philip, D.; and Robejsek, P. 2013. Shareholder value efficiency:Methods and evidence from the US banking industry. Available at SSRN:http://ssrn.com/abstract=2489014.
Arellano, M. 1987. Computing robust standard errors for within-groupsestimators. Oxford Bulletin of Economics and Statistics, Department ofEconomics, University of Oxford 49: 431-434.
Arellano, M., and Bond, S. 1991. Some tests of specification for panel data:Monte Carlo Evidence and an Application to Employment Equations.Review of Economic Studies 58: 277–297.
Athanasoglou, P.; Brissimis, S.; and Delis, M. 2008. Bank specific, industryspecific and macroeconomic determinants of bank profitability. Journal ofInternational Financial Markets, Institutions and Money, 18:121-136.
Baltagi, B. 2005. Econometric Analysis of Panel Data. New York: JohnWiley&Sons.
Bank of Greece, 2014. The time of the great depression: The Bank of Greece2008-2013, Bank of Greece, Athens.
Bank of Greece, December 2009. Financial Stability Report, Bank of Greece,Athens. Available at: http:// www. bankofgreece. gr/Bog Ekdoseis/ fstability200912_en.pdf.
Bank of Greece, July 2010, Financial Stability Report, Bank of Greece, Athens.Available at: http:// www. bankofgreece. gr/ BogEkdoseis /fstability201007_en.pdf.

145The Determinants of Shareholder Value in Retail Banking During Crisis Years
Bank of Greece, Governor’s Acts No 2588, 2589, 2590, 20.08.2007. Bank ofGreece, Athens
Bank of Greece, Executive Committee’s Act No 42/30.05.2014. Bank ofGreece, Athens.
Beccalli, E.; Casu, B.; and Girardone, C. 2006. Efficiency and stockperformance in European banking. Journal of Business Finance andAccounting, 33: 218–235.
Berger, A., and Mester, L. 2003. Explaining the dramatic changes inperformance of US banks: technological change, deregulation and dynamicchanges in competition. Journal of Financial Intermediation 12: 57-95.
Berger, A., and De Young, R. 1997. Problem loans and cost efficiency incommercial banking, Journal of Banking and Finance 21: 849-870.
Brissimis, S.; Delis, M.; and Papanikolaou, N. 2008. Exploring the nexusbetween banking sector reform and performance: Evidence from newlyacceded EU countries. Journal of Banking and Finance 32: 2674- 2683.
Cipollini A., and Fiordelisi F. 2012. Economic value, competition and financialdistress in the European banking system, Journal of Banking and Finance36: 3101-3109.
Damodaran, A. 2012. Equity Risk Premiums (ERP): Determinants, Estimationand Implications – The 2012 Edition. Available at SSRN: http ://ssrn .com/abstract=2027211 .
Damodaran, A. 2010. Into the Abyss: What If Nothing is Risk Free? Availableat SSRN: http://ssrn.com/abstract=1648164.
Damodaran, A. 2009. Valuing Financial Service Firms. Working paper. Stern Business School: New York University. Available at: http:// people. stern .nyu. edu/adamodar/pdfiles/papers/finfirm09.pdf
Demirguk-Kunt, A.; Detragiache, E.; and Gupta, P. 2006. Inside the Crises: Anempirical Analysis of Banking Systems in Distress. Journal of InternationalMoney and Finance 25: 702-718.
Demirguk-Kunt, A., and Huizinga, H. 1999. Determinants of commercial bankinterest margins and profitability: Some international evidence. World BankPolicy Research Working Papers. Available at: http:// elibrary .worldbank.org/doi/book/10.1596/1813-9450-1900.
Dermine, J. 2010. Bank valuation with an application to the implicit durationof non-maturing deposits. International Journal of Banking, Accounting andFinance 2: 1-30.
Dermine, J. 2009. Bank Valuation and Value – Based Management. New York:McGraw – Hill
Deville, A. 2009. Branch banking network assessment using DEA: Abenchmarking analysis – A note. Management Accounting Research 20:252-261.
Dietrich, A., and Wanzenried, G. 2011. Determinants of bank profitabilitybefore and during the crisis: Evidence from Switzerland, Journal ofInternational Financial Markets, Institutions and Money 21: 307-327.

Multinational Finance Journal146
European Banking Authority –EBA-, February 2014. A final draft:Implementing of technical standards on Supervisory reporting onforbearance and non performing exposures under article 99(4) of Regulation(EU) No 575/2013.Availabe at: https :// www. eba. europa. eu/documents/10180/449824/EBA-ITS-2013-03+Final+draft+ITS+on+Forbearance+and+Non-performing+exposures.pdf
European Banking Authority –EBA-, December 2014. A final draft; Regulatorytechnical standards on disclosure of information in relation to thecompliance of institutions with the requirement for a countercyclical capitalbuffer under Article 440 of Regulation (EU) No 575/2013. Available at:https://www.eba.europa.eu/documents/10180/937795/EBA+RTS+2014+17+%28Final+Draft+RTS+on+CCB+Disclosure%29.pdf
Eichengreen, B., and Gibson, H. 2001. Greek banking at the dawn of the newmillennium. CERP Discussion paper No 2791. Available at SSRN:http://ssrn.com/abstract=269391.
Feltham, G., and Ohlson, J. 1995. Valuation and Clean Surplus Accounting forOperating and Financial Activities. Contemporary Accounting Research 11:689-731.
Fernandez, P.; Aguirreamalloa, J.; and Avendaρo, L. 2011 Market RiskPremium Used in 56 Countries in 2011: A Survey with 6,014 Answers.Available at SSRN: http://ssrn.com/abstract=1822182.
Fiordelisi, F.; Marquez – Ibanez, D.; and Molyneux, P. 2011. Efficiency andrisk-taking in European banking. Journal of Banking and Finance 35:1315-1326.
Fiordelisi, F., and Molyneux P. 2010. The determinants of shareholder value inEuropean banking. Journal of Banking and Finance 35: 1189-1200.
Fiordelisi, F. 2007. Shareholder value efficiency in European banking. Journalof Banking and Finance 31: 2151-2171.
Fiordelisi, F., and Molyneux, P. 2007. Value Creation in Banking. EFA 2007Ljubljana Meetings paper. Available at SSRN: http: //ssrn .com /abstract=965441.
Garcia-Herrero, A.; Gavila, S.; and Santabarbara, D. 2009. What explains thelow profitability of Chinese banks? Journal of Banking and Finance 33:2080-2092.
Garvey, G., and Milbourn, T. 2000. EVA versus Earnings: does it matter whichis more highly correlated with stock returns? Journal of AccountingResearch 38: 209-245.
Goddard, J.; Molyneux, P.; and Wilson, J. 2004. The profitability of EuropeanBanks: a cross sectional and dynamic panel analysis, Manchester School 72:363-381.
Gross, S. 2006. Banks and Shareholder Value. An overview of Bank Valuationand Empirical Evidence on Shareholder value for Banks. Frankfurt: DUVGabler Edition Wissenschaft.
Hausman, J. 1978. Specification Tests in Econometrics. Econometrica 46: 1251
147The Determinants of Shareholder Value in Retail Banking During Crisis Years
-71.Iqbal, A., and Kumel, O. 2014. Impact of financial crisis on firms’ capital
structure in UK, France, and Germany, Multinational Finance Journal 18:249-280.
Judson, R., and Owen, A. 1999. Estimating dynamic panel data models: A guidefor Macroeconomics. Economic Letters 65: 9-15.
Kaufman, G. 2004. Macroeconomic stability, bank soundness and designingoptimum regulatory structures. Multinational Finance Journal 8: 141-171.
Kenourgios, D.; Christopoulos, A.; and Dimitriou, D. 2013. Asset marketscontagion and the global financial crisis. Multinational Finance Journal 17:49-76.
Kimball, R. 1998. Economic profit and performance measurement in banking.New England Economic Review, Federal Reserve of Boston issue July:35-53.
Lee, J., and Strazicich, M. 2003. Minimum Lagrange Multiplier Unit Root Testwith Two Structural Breaks. The Review of Economics and Statistics 85:1082-1089.
Lepetit, L.; Nys, E.; Rous, P.; and Tarazi, A. 2008. Bank income structure andrisk: an empirical analysis of European Banks. Journal of Banking andFinance 32: 1452-1467.
Miller, S., and Noulas, A., 1997. Portfolio mix and large-bank profitability inthe USA. Applied Economics 29:505-512.
Salas, V., and Saurina, J. 2003. Deregulation, market power and risk behaviorin Spanish Banks, European Economic Review 47: 1061-1075.
Xiao, Y. 2009. French banks amid the global financial crisis. InternationalJournal of Banking and Finance 8: 1-19.
White, H., 1980. A Heteroskedasticity- Consistent covariance matrix estimatorand a direct test for heteroscedasticity. Econometrica 48: 817-38.
Wooldridge, J. 2009. Introductory econometrics: A modern approach: Canada:South Western Cengage Learning.


