The Economic Impact of Wal-Mart
PREPARED BY:
Business Planning Solutions
Global Insight Advisory Services Division
November 2, 2005
Table of Contents
I. EXECUTIVE SUMMARY ..................................................................................... 1 ABSTRACT ....................................................................................................................... 1 STUDY BACKGROUND...................................................................................................... 2 NATIONAL IMPACT RESULTS ........................................................................................... 3 MSA IMPACT................................................................................................................... 6 COUNTY IMPACT.............................................................................................................. 6
II. INTRODUCTION.................................................................................................... 8 BACKGROUND.................................................................................................................. 8 OBJECTIVE ....................................................................................................................... 9 DATA DESCRIPTION ......................................................................................................... 9 ORGANIZATION OF REPORT ........................................................................................... 10
III. NATIONAL IMPACT ANALYSIS...................................................................... 11 BASIS FOR SIMULATION ASSUMPTIONS.......................................................................... 11 SIMULATION RESULTS ................................................................................................... 17
IV. MSA IMPACT ANALYSIS .................................................................................. 21 OBJECTIVE ..................................................................................................................... 21 STUDY AREA ................................................................................................................. 21 METHODOLOGY ............................................................................................................. 23 MODEL RESULTS ........................................................................................................... 26
V. COUNTY IMPACT ANALYSIS.......................................................................... 29 OBJECTIVE ..................................................................................................................... 29 DATA DESCRIPTION ....................................................................................................... 29 MODEL SPECIFICATION.................................................................................................. 33 MODEL RESULTS ........................................................................................................... 35 ENDOGENEITY ............................................................................................................... 37
VI. TECHNICAL APPENDIX.................................................................................... 39 APPENDIX A. GLOBAL INSIGHT PRICE IMPACT REPORT................................................. 39 APPENDIX B. COUNTY LEVEL DETAIL ........................................................................... 59 APPENDIX C. DETERMINING REGIONAL ECONOMIC IMPACTS OF WAL-MART STORES .. 60
The Economic Impact of Wal-Mart
I. EXECUTIVE SUMMARY
Abstract Global Insight analyzed a set of data provided by Wal-Mart concerning its sales, purchases, employment, and payroll to answer two questions. The first was "How would the economies of the United States and Dallas-Ft. Worth have been different in 2004 if Wal-Mart had not existed?" The second was "How has the level and composition of retail employment at the county level typically been affected by the entry and expansion of Wal-Mart Stores and Supercenters?" Previous studies have shown that Wal-Mart has contributed to lower consumer prices. Global Insight conducted a statistical analysis that supports these findings. We found that the expansion of Wal-Mart over the 1985-2004 period can be associated with a cumulative decline of 9.1% in food-at-home prices, a 4.2% decline in commodities (goods) prices, and a 3.1% decline in overall consumer prices as measured by the Consumer Price Index - All Items, which includes both goods and services. These estimates are in line with other researchers' estimates of Wal-Mart's price effects. This impact amounts to consumer savings of $263 billion by 2004, which is the equivalent of $895 per person or $ 2,329 per household. These results are based on empirically derived estimates from the CPI as it is measured by the Bureau of Labor Statistics and do not include any additional cost savings that might come from capturing the effects of measurement bias in the CPI itself. These savings have been generated through Wal-Mart's higher levels of capital investment in distribution and inventory control assets, lower import prices, and greater efficiency in its whole supply chain. We did not conduct a thorough, comparative analysis of Wal-Mart's wages, benefits, and working conditions relative to a fair and comparable benchmark. The limited analysis we did undertake, based on an analysis of a large sample of employee wage data, did not find evidence to conclude that Wal-Mart pays its workers below-market wages. A full accounting of Wal-Mart's impact using Global Insight's modeling framework finds that Wal-Mart has generated a positive net economic impact on the U.S. economy. By 2004, it is responsible for 210,000 net jobs, a level of total factor productivity (general economic efficiency of the economy) that is 0.75% higher by 2004 than it would have been. Nominal wages are 2.2% lower, but given that consumer prices are 3.1% lower, real disposable income is 0.9% higher than it would have been in a world without Wal-Mart. To acknowledge those who argue that Wal-Mart has led to real wage compression in the U.S. economy, we conducted analysis to determine how sensitive our results were to our assumption that there has been no real wage compression. We showed that assuming wage compression rather than total factor productivity growth is behind the
The Economic Impact of Wal-Mart 1
price decline. Furthermore, the impact on total real disposable income is still significant and positive. Similar results are provided for the Dallas-Ft. Worth-Arlington MSA. Due to increased market penetration the consumer cost savings are estimated to have been a cumulative 4.0% by 2004. This impact in conjunction with other direct, indirect, and induced impacts has led to 6,300 more jobs and a 2.6% increase in real disposable income in the Dallas-Ft. Worth area. In an analysis of county-level impact results, Global Insight has largely confirmed previous research on how the entry and expansion of Wal-Mart affects the structure of county-level retail employment. With the opening of a typical 150-350 person store in a county, retail employment tends to increase by 137 jobs over the short term and levels off to a 97 job increase over the longer term. It also leads to net job declines in food stores and apparel & accessory stores, but to net job increases in building materials & garden supplies stores and general merchandise stores. This indicates that Wal-Mart seems to displace other retail establishments, but also serves to stimulate the overall development of the retail sector that leads to an overall positive impact (in terms of retail employment) for the counties in which Wal-Mart has expanded.
Study Background An active debate has built up around the issue of Wal-Mart's impact on the United States. This debate has been taking place on a range of issues at the national, state, county, metro area, and neighborhood levels. With an objective of making a positive contribution to this debate, Wal-Mart commissioned Global Insight to undertake an independent assessment of Wal-Mart's economic impact on the U.S. economy. This analysis has taken advantage of Global Insight's core strengths:
Global Insight's 42-years of experience1 in providing rigorous, fact-based forecasts and analyses of the U.S. economy at the national, state, metro area, and county levels.
Global Insight's reputation for providing independent, objective analyses on the economic impact of a wide variety of policies and economic forces, across a broad range of industries in the United States as well as many other countries.
Global Insight's set of national, state, and metro area-level models provide an independent framework for taking into account the many interrelationships in today's complex economy in order to depict a comprehensive assessment of net economic benefits.
1 Through its precursor companies Data Resources, Inc. (DRI) and Wharton Econometric Forecasting Associates (WEFA). WEFA was founded in 1963 and DRI was founded in 1968 both on the basis of deploying large scale databases with econometric forecasting models to understand and forecast economic performance. These two companies where joined to form Global Insight in May 2001.
The Economic Impact of Wal-Mart 2
Global Insight began the project by requesting and receiving a large set of detailed data from Wal-Mart concerning its sales and employment at Wal-Mart Stores and Wal-Mart Supercenters going back to the mid-1980s.2 Global Insight also received detailed data on Wal-Mart's purchases from its suppliers in 2004, as well as a sample of employee wage data by store and job category that was taken in October 2004. In addition, we interviewed a variety of Wal-Mart staff to gain a deeper understanding of Wal-Mart's view on how they actually decide where to open new stores, how they set prices, how they hire workers, and how they decide how much pay to offer them. This information was then further supplemented by a thorough review of all existing studies and analyses concerning Wal-Mart's economic impact. Our study is structured to determine the net economic impact of Wal-Mart at the national, metropolitan, and county levels. The structure of the analysis is as follows:
A national impact analysis to estimate the overall impact of Wal-Mart as measured by commonly used metrics of national economic performance.
A metropolitan-level impact analysis to characterize how the impact could be measured in a specific metropolitan statistical area (MSA), Dallas-Fort Worth, and to serve as an example for how Wal-Mart's economic impact should be estimated in other metro areas.
A county-level impact analysis to look at the specific dynamics associated with the impact of Wal-Mart's entry and expansion at the local (county) level.
National Impact Results Global Insight has found evidence that Wal-Mart has directly raised the economy's potential to produce by investing in more capital, by using all its factors of production more efficiently, and by helping suppliers operate more efficiently. The higher supply potential raises productivity, lowers consumer prices, and increases real consumer purchasing power. Previous studies have shown that Wal-Mart has contributed to lower consumer prices. Global Insight conducted a statistical analysis that supports these findings. We found that the expansion of Wal-Mart over the 1985-2004 period can be associated with a cumulative decline of 9.1% in food-at-home prices, a 4.2% decline in commodities (goods) prices, and a 3.1% decline in overall consumer prices as measured by the Consumer Price Index - All Items, which includes both goods and services. These estimates are in line with other researchers' estimates of Wal-Mart's price effects (see Tables 19 and 20 in Appendix A. The 3.1% estimate is a cumulative total over the 1985-2004 period and corresponds to a 0.1-0.2% reduction in the annual inflation rate over this period. These results were generated through a statistical analysis of the variation in consumer prices across a set
2 Sam's Club sales and employment as well as employment at distribution centers, transportation and miscellaneous operations were not covered in this analysis.
The Economic Impact of Wal-Mart 3
of MSAs over time in relation to changes in Wal-Mart's market penetration and other (non-Wal-Mart) drivers of price variation. Jerry Hausman of M.I.T. has presented an analysis that the official CPI actually incorporates a bias that excludes some of Wal-Mart's direct cost savings.3 Global Insight's analysis only focused on the CPI "as measured" and did not add any additional cost savings that might be generated by this hypothesized measurement bias. The reduction in the price level due to the presence of Wal-Mart translates directly into savings for consumers amounting to $263 billion by 2004, which amounts to $895 per person and $2,329 per household. Once Global Insight established this benefit to the economy we needed to understand how these cost savings were generated. These savings could have come from either lower wages, increased capital investment, lower import prices, or greater total factor productivity.
Wal-Mart does not appear to be paying below-market wages. In impact studies of this nature, it is important to acknowledge that even if there are broad positive net benefits identified, there can be specific segments of the population that lose out. Many external observers have held that the cost of Wal-Mart's success in offering lower prices has come at the expense of its workers. Coming to a comprehensive position on this issue is beyond the scope of this study. It would require a thorough, comparative analysis of Wal-Mart's wages, working conditions, and benefits relative to a fair and comparable benchmark. However, for the purposes of this study, we did analyze a large sample of employee wage data provided to us, broken down by job position and store. We selected a sample set of job positions from this data that we were able to validly compare to standard Bureau of Labor Statistics (BLS) employment occupational categories. We analyzed the data to make them as comparable as possible, and the methodology we used is fully documented in the body of the report. The results indicate that there is no evidence that Wal-Mart significantly pays lower than the retail industry averages for the job positions that we analyzed. In fact, the analysis shows the weighted average Wal-Mart wage rate for the group of job positions we sampled is actually modestly higher than the comparable weighted average BLS wage rate. For a number of reasons expressed in the body of the report, we do not consider this a definitive finding, but it has led us to make an assumption in our impact analysis that Wal-Mart pays the market wage that fairly reflects the skills, experience, and education it requires in its workers.
Wal-Mart is more capital intensive. We found evidence that Wal-Mart is more capital intensive than its competitors. Therefore, we apportioned some of the cost savings as having come from Wal-Mart's investment in capital related to increasing their distribution and inventory control efficiencies.
3 Hausman, Jerry & Leibtag, Ephraim. "CPI Bias from Supercenters: Does the BLS know that Wal-mart exists?" NBER Working Paper Series Aug 2004:2.
The Economic Impact of Wal-Mart 4
Wal-Mart has contributed modestly to lower import prices. While we did not have sufficient data to make a definitive conclusion in this regard, we have assumed that some of the cost savings have come about through lower import prices. For this analysis, we assumed that Wal-Mart is able to purchase imported goods for 5% less than traditional retailers due to its high volume and distribution efficiencies.
Wal-Mart's innovations in distribution and inventory control efficiencies have generated an increase in the economy's total factor productivity. Accounting for the above three forces does not allow us to fully explain the cost savings we have observed. Therefore, the only way that these cost savings could have been generated is through a Wal-Mart induced increase in the economy's total factor productivity (TFP) of about 0.75%. In simple terms, TFP is a measure of technical progress, or could also be considered a measure of the general efficiency of the economy. It addresses improvements in output not explained by additional inputs of capital or labor. Typically, this arises from deploying technology or process improvements to more efficiently make use of the specific mix of capital and labor deployed.
Through its productivity gains, Wal-Mart has also impacted the national labor market. Demand for labor is keyed to the level of output in the economy, the real wage, and the productivity of factors of productions. Higher output levels in the economy with Wal-Mart drive up demand for labor while higher productivity levels mute the employment gains. By incorporating the above findings into the Global Insight Model of the U.S. Economy we estimate that the existence of Wal-Mart has led to there being some 210,000 more jobs by 2004 that would otherwise not have existed. This corresponds to a 0.15% increase in jobs, significantly less than the 0.9% gain in the economy's output. The unemployment rate is estimated to have been 0.14 percentage point lower by 2004 due to Wal-Mart.
These 210,000 additional jobs are a plus, but what is Wal-Mart's effect on the rest of the labor force? Are they better off? As noted above, lower inflation levels in the economy with Wal-Mart put downward pressure on nominal wages, while higher labor demand and productivity levels put upward pressure on wages. Rather than declining in line with the 3.1% decrease in consumer prices, wage rates are only 2.2% lower overall. This implies that real wages were 0.9% higher by 2004 than they would have been in an economy without Wal-Mart. The nominally lower income levels were more than offset by lower price levels, leading to a rise in real disposable income. Consumers earned less in nominal dollars, but their income bought them more in the economy with Wal-Mart.
Wage Sensitivity Analysis To acknowledge those who argue that Wal-Mart has led to real wage compression in the U.S. economy, Global Insight conducted an analysis to determine how sensitive our results were to our assumption that there has been no real wage compression. In this analysis we assumed that the lower prices we attributed to Wal-Mart are due to lower
The Economic Impact of Wal-Mart 5
wages rather than to higher productivity. Hence we decreased the national average wage rate by an additional 1% (implying a 25% decline in nominal general merchandise and grocery store wage rates), which completely removes the increase we introduced to total factor productivity. With lower productivity levels, employment rises by 870,000 jobs. The higher employment levels achieve a comparable rise in real disposable income as under the no wage compression simulation.
MSA Impact The purpose of the analysis at the MSA level is to determine "How different would the economy of Dallas-Fort Worth-Arlington MSA have been in 2004 if Wal-Mart had not existed?" To answer this question, Global Insight focused primarily on estimating the differences in the levels of economic activity in the Dallas-Fort Worth-Arlington MSA between the Baseline Scenario, which includes Wal-Mart, and the alternative No Wal-Mart Scenario. The divergence that exists in 2004 is due to the cumulative effects of Wal-Mart’s increasing presence in the MSA since the first Dallas-Fort Worth-Arlington-area Wal-Mart store was established in 1978. The main impact of Wal-Mart's presence in the Dallas-Fort Worth-Arlington MSA is a price level by 2004 that is 4% lower because of Wal-Mart. This driver influences the rest of the local economy. Through direct, indirect and induced effects, Wal-Mart's presence has resulted in real disposable income gains of 2.6% by 2004 and has added 6,300 jobs to the Dallas-Fort Worth area that otherwise would not have been there.
County Impact While Wal-Mart is a national retail chain, a majority of the current debate concerning Wal-Mart's impact occurs at the local level. Citizens, lawmakers, and businesses in counties and municipalities are concerned about the hypothesized harmful effects that a potential Wal-Mart entrant could have on the local economy. The county-level analysis strives to determine the impact of the opening and further expansion of a typical Wal-Mart store in a given county. An econometric analysis was performed using economic and Wal-Mart square-footage data for 3,101 counties for the period 1985 to 1997. The goal of the analysis was to isolate the effect of the Wal-Mart square-footage variable and translate it into an impact on retail employment at the county level. The model looked at Wal-Mart's impact in the context of a 100,000-square-foot Wal-Mart being placed in an average county of the dataset in the year in 1985. Over the period 1985 to 1997, the impact is as follows: in the first three years, with the opening of a typical 150-350 person store in a county, there is a gain of 137 retail employment jobs in the county; in the subsequent years, as competitors adjust, there is a loss of 40 retail jobs. The net impact of the entry of the Wal-Mart store is 97 retail jobs. It also leads to net job declines in food stores and apparel & accessory stores, but net job increases in building materials & garden supplies stores and general merchandise stores (which is where Wal-Mart is classified). This indicates that Wal-Mart does displace other retail establishments, but also serves to stimulate the overall development of the retail sector in a county. Wal-Mart has an overall positive impact (in terms of retail
The Economic Impact of Wal-Mart 6

employment) for the counties in which it has expanded. As this analysis summarizes the impact for an "average" county, the actual results would vary from county to county, depending on factors such as industry mix within the county and number of competitors.
The Economic Impact of Wal-Mart 7
II. INTRODUCTION
Background Wal-Mart's growth in the U.S. market has sparked increasing debate about the economic impact of its expansion. As a contribution to this debate, Wal-Mart commissioned Global Insight to undertake an independent research effort to analyze this issue. The goal of this research was to independently and credibly document the national- and local-area impacts in terms of jobs, wages, prices, consumer buying power, productivity, and gross domestic product (GDP). Global Insight assembled a team of data analysts, econometricians, and economic modelers to conduct a series of defined study elements that were integrated to answer the question "What Is Wal-Mart's Net Economic Impact in the United States?" Global Insight requested and received a large set of Wal-Mart data. These included data on Wal-Mart's purchases from vendors and payments to employees in 2004. Global Insight also received data on store square footage going back to 1980 and on sales and employment by store going back to 1992. The focus of the analysis was limited to Wal-Mart Stores and Wal-Mart Supercenters. These data were processed and used for the research. The structure of the study as commissioned was as follows:
A national impact analysis to estimate the overall impact of Wal-Mart as measured by commonly used metrics of national economic performance.
A metropolitan-level impact analysis to characterize how the impact could be measured in a specific metropolitan area and to serve as an example for how Wal-Mart's economic impact should be estimated in other metro areas.
A county-level impact analysis to look at the specific dynamics associated with the impact of Wal-Mart's entry and expansion at the local (county) level.
Key elements of the study scope are as follows:
Consider only quantifiable economic factors such as consumer savings, taxes, and wages.
Consider both local impact and national impact. Consider secondary and tertiary effects (e.g., spending by employees, suppliers).
In standard economic impact terms, these are the direct, indirect, and induced impacts.
For local impact, identify the effects of Wal-Mart both entering a new market and adding additional stores in established markets.
The scope of this project did not extend to address the following issues:
Social and qualitative urban planning issues. Impact on federal and state government assistance funds and programs.
The Economic Impact of Wal-Mart 8
Impact on specific segments of the population (e.g., lower income vs. higher income consumers, unionized vs. non-unionized workers, etc.).
Objective This study seeks to answer three key questions:
How would the U.S. economy in 2004 have been different if Wal-Mart had not existed?
How would the economy of the Dallas-Ft. Worth-Arlington MSA in 2004 have been different if Wal-Mart had not existed?
What has been the county-level impact of Wal-Mart store openings and expansions?
The focus of the National Impact Analysis is to answer the first question, regarding Wal-Mart's national-level impact. The analysis measures the impact that Wal-Mart has had on the U.S. economy in terms of a broad set of national economic indicators. The study looked at the impact on consumer prices, wages, the level of capital stock, productivity, and other indicators. These effects are translated, when relevant, into more meaningful per capita and per household results. The focus of the MSA Impact Analysis is to answer the second question. The analysis measures the impact that Wal-Mart has had on the Dallas-Fort Worth-Arlington metropolitan statistical area (MSA) in terms of a broad set of regional economic indicators. These effects are translated, when relevant, into more meaningful per capita and per household results. While Wal-Mart is a national retail chain, a majority of the current debate concerning Wal-Mart's impact occurs at the local level. Thus, the third section, County Impact Analysis, addresses the final question posed. Citizens, lawmakers, and businesses in counties and municipalities are concerned about the hypothesized harmful effects a potential Wal-Mart could have on their local economy. There has been an abundance of contradictory information concerning the effect that Wal-Mart stores have at the local level. Thus, Global Insight has endeavored to construct a rigorous and objective empirical econometric model to help shed light on the bottom-line impact, in terms of retail jobs per capita that Wal-Mart has on local economies.
Data Description Historical data for the study were obtained from U.S. government agencies, Standard & Poor's Compustat, Wal-Mart, and Global Insight's economic databases. Global Insight obtained data from the Bureau of Labor Statistics for personal income, unemployment, and nominal and real wage and salary disbursements. Population data were acquired from the U.S. Census Bureau. The Bureau's County Business Patterns provided county-level employment data. Net assets and value-added data were obtained from Compustat.
The Economic Impact of Wal-Mart 9
Wal-Mart provided Global Insight with 2004 data for 3,066 stores. The dataset included hourly wage data by employee, number of employees, square footage, sales by department, and vendor purchases by department and country. The wage data were for a three-week period in October of 2004.
Organization of Report This report is organized into four sections:
National Impact Analysis MSA Impact Analysis County Impact Analysis Technical Appendix
The first section details the methodology, model, simulation assumptions, and simulation results of the national impact analysis. The second section features a full assessment of the analysis conducted for the Dallas-Fort Worth-Arlington MSA. The third section enumerates the research conducted at the county level. The final section constitutes a technical appendix.
The Economic Impact of Wal-Mart 10
III. NATIONAL IMPACT ANALYSIS The national impact analysis summarizes how Wal-Mart altered the 2004 U.S. economy in terms of a broad set of national economic indicators. Specially, it quantifies Wal-Mart's impact on national productivity, consumer price and wage inflation, consumers' purchasing power, employment, and inflation-adjusted income levels. Any attempt to assess Wal-Mart's overarching effects on the national economy requires the use of an economic model detailed enough to provide the wide range of variables needed to present a complete picture, yet flexible enough to withstand the rigorous changes required to completely capture Wal-Mart's impact on the national economy. To accomplish this task, Global Insight utilized its macroeconomic model. This model (The Global Insight Quarterly Model of the U.S. Economy) is the same one used to generate the economic forecasts behind the company’s monthly assessment of the U.S. economy. It captures the full simultaneity of the economy, forecasting more than 1,400 concepts spanning final demands, aggregate supply, prices, incomes, international trade, industrial detail, interest rates, and financial flows. Using Global Insight's macroeconomic model, a "tracking" scenario was created that exactly simulates history for the model's 1,400 plus economic concepts. An alternative scenario was then formulated to reflect the hypothetical U.S. economy without Wal-Mart. In summary, the alternative scenario without Wal-Mart reflects higher consumer goods prices as a result of lower capital investment, lower total factor productivity, and higher import prices. Global Insight did not find compelling evidence to suggest that wage rates should be adjusted upward (in addition to model simulated changes) in an economy without Wal-Mart. The analysis compares the alternative simulations with actual history and the results suggest that Wal-Mart's presence in the economy has increased consumers' purchasing power and raised employment levels. The assumptions supporting the model simulations are detailed below, followed by a discussion of the model's interactions and the simulation results.
Basis for Simulation Assumptions
CPI Assumption The Bureau of Labor Statistics publishes consumer price indexes for 27 MSAs. Of these MSAs, 24 have historical data back to at least 1985.4 In the Price Impact Report5, Global Insight utilized these data to quantify the impact that Wal-Mart has had on
4Anchorage, Atlanta-Sandy Springs-Marietta, Boston-Cambridge-Quincy, Chicago-Naperville-Joliet, Cincinnati-Middletown, Cleveland-Elyria-Mentor, Dallas-Fort Worth-Arlington, Denver, Detroit-Warren-Livonia, Honolulu, Houston-Baytown-Sugar Land, Kansas City, Los Angeles-Long Beach-Santa Ana, Miami-Fort Lauderdale-Miami Beach, Milwaukee-Waukesha-West Allis, Minneapolis-St. Paul-Bloomington, New York-Northern New Jersey-Long Island, Philadelphia-Camden-Wilmington, Pittsburgh, Portland-Vancouver-Beaverton, San Diego-Carlsbad-San Marcos, Seattle-Tacoma-Bellevue, San Francisco-Oakland-Fremont, and St. Louis. 5 The Economic Impact of Wal-Mart, Price Impact Report, Global Insight (See appendix A).
The Economic Impact of Wal-Mart 11
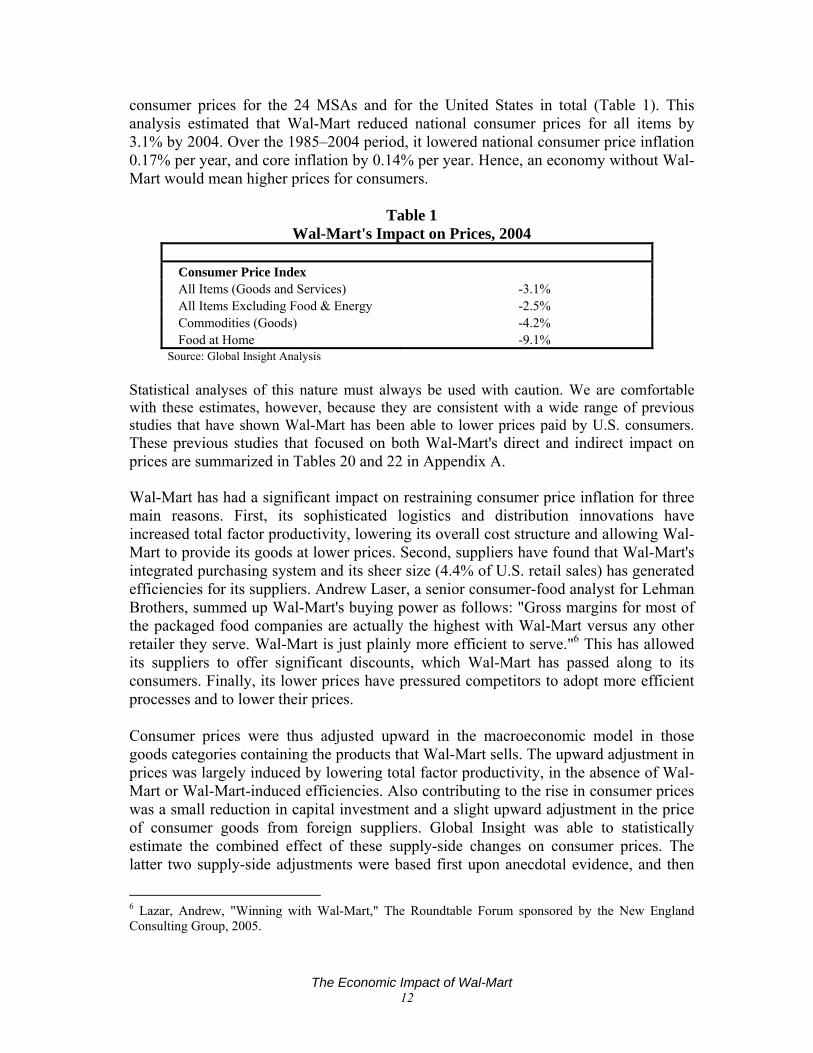
consumer prices for the 24 MSAs and for the United States in total (Table 1). This analysis estimated that Wal-Mart reduced national consumer prices for all items by 3.1% by 2004. Over the 1985–2004 period, it lowered national consumer price inflation 0.17% per year, and core inflation by 0.14% per year. Hence, an economy without Wal-Mart would mean higher prices for consumers.
Table 1 Wal-Mart's Impact on Prices, 2004
Consumer Price Index All Items (Goods and Services) -3.1% All Items Excluding Food & Energy -2.5% Commodities (Goods) -4.2% Food at Home -9.1%
Source: Global Insight Analysis Statistical analyses of this nature must always be used with caution. We are comfortable with these estimates, however, because they are consistent with a wide range of previous studies that have shown Wal-Mart has been able to lower prices paid by U.S. consumers. These previous studies that focused on both Wal-Mart's direct and indirect impact on prices are summarized in Tables 20 and 22 in Appendix A. Wal-Mart has had a significant impact on restraining consumer price inflation for three main reasons. First, its sophisticated logistics and distribution innovations have increased total factor productivity, lowering its overall cost structure and allowing Wal-Mart to provide its goods at lower prices. Second, suppliers have found that Wal-Mart's integrated purchasing system and its sheer size (4.4% of U.S. retail sales) has generated efficiencies for its suppliers. Andrew Laser, a senior consumer-food analyst for Lehman Brothers, summed up Wal-Mart's buying power as follows: "Gross margins for most of the packaged food companies are actually the highest with Wal-Mart versus any other retailer they serve. Wal-Mart is just plainly more efficient to serve."6 This has allowed its suppliers to offer significant discounts, which Wal-Mart has passed along to its consumers. Finally, its lower prices have pressured competitors to adopt more efficient processes and to lower their prices. Consumer prices were thus adjusted upward in the macroeconomic model in those goods categories containing the products that Wal-Mart sells. The upward adjustment in prices was largely induced by lowering total factor productivity, in the absence of Wal-Mart or Wal-Mart-induced efficiencies. Also contributing to the rise in consumer prices was a small reduction in capital investment and a slight upward adjustment in the price of consumer goods from foreign suppliers. Global Insight was able to statistically estimate the combined effect of these supply-side changes on consumer prices. The latter two supply-side adjustments were based first upon anecdotal evidence, and then
6 Lazar, Andrew, "Winning with Wal-Mart," The Roundtable Forum sponsored by the New England Consulting Group, 2005.
The Economic Impact of Wal-Mart 12
total factor productivity was adjusted so as to generate the targeted rise in consumer prices. Reasonable shifts among the three supply factors would not alter the conclusions of the study.7
Capital Stock Adjustment Global Insight compared Wal-Mart's net asset-to-value-added ratio with the similar ratio for Wal-Mart's chief competitors.8 Wal-Mart was slightly more capital-intensive than its competitors in 2004. Based upon the difference in net asset/value-added ratios, Global Insight estimated that Wal-Mart's operations were supported by $6 billion more in net assets than alternative retailers would have had. In the alternative scenario, $6 billion was removed from the net effective capital stock. This change by itself raises consumer prices only 0.09% by 2004.
Import Price Assumption For this analysis, we assumed that Wal-Mart is able to purchase imported goods for 5.0% less than traditional retailers. With Wal-Mart's imports accounting for 9.4% of consumer goods imports, this implied an upward adjustment of less than 0.5% in consumer import prices in the alternative scenario. This change by itself raises consumer prices only 0.05% by 2004.
Productivity Calculation The remainder of the 3.1% increase in consumer prices was generated by reducing total factor productivity in the model's aggregate production function. Total factor productivity for the entire economy's value-added production was reduced 0.75% by 2004 in the absence of the contributions from Wal-Mart over the 1985-2004 period. This implies a 0.04-percentage point average annual reduction in total factor productivity growth over the 1985–2004 period. Retail value-added corresponded to 7% of the economy's total value-added by 2004. The 0.75% adjustment to the economy's total factor productivity, therefore, translates to an 11% reduction in the retail industry's total factor productivity as of 2004 in the absence of Wal-Mart. This implies an average
7 The first principle of the market economy is that prices and output are determined simultaneously by the factors underlying both demand and supply. In the Global Insight Model, aggregate supply (or potential GDP excluding the energy sector) is estimated by a Cobb-Douglas production function that combines factor input growth and improvements in total factor productivity. Factor input equals a weighted average of labor, business fixed capital, public infrastructure, and energy provided by the energy sector. Based upon each factor's historical share of total input costs, the elasticity of potential output with respect to labor is 0.65 (i.e., a 1% increase in the labor supply increases potential GDP 0.65%); the business capital elasticity is 0.26; the infrastructure elasticity is 0.02; and the energy elasticity is 0.07. Factor supplies are defined by estimates of the full employment labor force, the full employment capital stock, end-use energy demand, and the stock of infrastructure. Total factor productivity depends upon the stock of research and development capital and trend technological change. The energy sector employs its own capital and labor. Potential GDP is the sum of the energy and non-energy sector outputs less energy imports. 8Albertsons Inc, BJ'S Wholesale Club Inc, Costco Wholesale Corp, CVS Corp, Home Depot Inc, Kohl's Corp, Kroger Co, Lowe's Companies Inc, Safeway Inc, Sears Holdings Corp, Sears Roebuck & Co, Target Corp, and Walgreen Co.
The Economic Impact of Wal-Mart 13
annual reduction of 0.6-percentage-point in total factor productivity growth in the retail sector over the 1985–2004 period. In the wage sensitivity analysis, discussed later, higher wages are assumed to generate the 3.1% increase in consumer prices. Total factor productivity was not reduced, but economy-wide wages were raised by 1% by 2004 in the absence of Wal-Mart in order to target the same 3.1% increase in consumer prices.
Wage Assumption Global Insight does not explicitly adjust the wage rate in the model during the core simulation of the removal of Wal-Mart from the U.S. economy. As a result of economic factors brought on by the interaction of the agents in the model, namely higher inflation, the nominal wage rate does rise, but this is an outcome of the simulation and not an explicit input. In impact studies of this nature, it is important to acknowledge that even if there are broad positive net benefits identified, there can be specific segments of the population that lose out. Many external observers have held that the cost of Wal-Mart's success in offering lower prices has come at the expense of its workers. Coming to a comprehensive position on this issue is beyond the scope of this study. It would require a thorough, comparative analysis of Wal-Mart's wages, working conditions, and benefits relative to a fair and comparable benchmark. However, with regard to the specific issue of wage rates, the evidence in favor of explicitly adjusting the wage rate in the economy when Wal-Mart is removed is inconclusive. Global Insight was given wage information from a representative sample of Wal-Mart workers for a three-week period in October 2004. Global Insight compared the wages of employees in the sample from specific Wal-Mart stores in MSAs across the country with the average wages being earned by all employees for similar occupations in the same MSAs. Seven job categories were chosen as a representative set of positions found in Wal-Mart Stores and Supercenters: bakers, tire changers and repairers, staff at Wal-Mart Radio Grill, cashiers, stockers, and maintenance workers. These positions were compared with similar occupations contained in the Bureau of Labor Statistics' (BLS) May 2004 Metropolitan Area Occupational Employment and Wage Estimates. The BLS estimates are calculated with survey data collected from employers in all industry sectors in the particular MSA.9 The Wal-Mart dataset contains hourly wage rates by employee by store. This dataset was then merged with a corresponding listing of MSAs. An average of hourly wages by position for full-time employees was constructed by MSA. Nearly 75% of Wal-Mart employees work full-time, and the seven positions above account for over 47% of Wal-
9 For information on the how the BLS survey is conducted and how the BLS estimates are calculated, go to http://www.bls.gov/oes/current/oes_tec.htm.
The Economic Impact of Wal-Mart 14
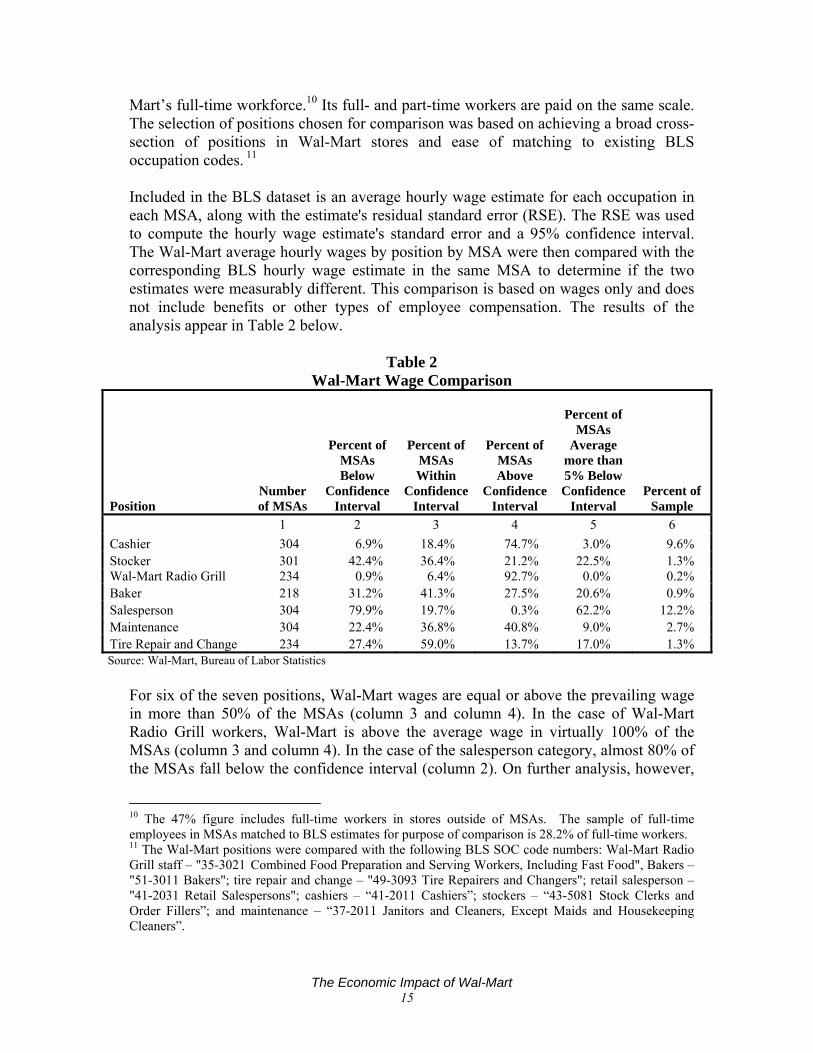
Mart’s full-time workforce.10 Its full- and part-time workers are paid on the same scale. The selection of positions chosen for comparison was based on achieving a broad cross-section of positions in Wal-Mart stores and ease of matching to existing BLS occupation codes. 11 Included in the BLS dataset is an average hourly wage estimate for each occupation in each MSA, along with the estimate's residual standard error (RSE). The RSE was used to compute the hourly wage estimate's standard error and a 95% confidence interval. The Wal-Mart average hourly wages by position by MSA were then compared with the corresponding BLS hourly wage estimate in the same MSA to determine if the two estimates were measurably different. This comparison is based on wages only and does not include benefits or other types of employee compensation. The results of the analysis appear in Table 2 below.
Table 2 Wal-Mart Wage Comparison
Position Number of MSAs
Percent of MSAs Below
Confidence Interval
Percent of MSAs Within
Confidence Interval
Percent of MSAs Above
Confidence Interval
Percent of
MSAs Average
more than 5% Below Confidence
Interval
Percent of
Sample 1 2 3 4 5 6 Cashier 304 6.9% 18.4% 74.7% 3.0% 9.6% Stocker 301 42.4% 36.4% 21.2% 22.5% 1.3% Wal-Mart Radio Grill 234 0.9% 6.4% 92.7% 0.0% 0.2% Baker 218 31.2% 41.3% 27.5% 20.6% 0.9% Salesperson 304 79.9% 19.7% 0.3% 62.2% 12.2% Maintenance 304 22.4% 36.8% 40.8% 9.0% 2.7% Tire Repair and Change 234 27.4% 59.0% 13.7% 17.0% 1.3% Source: Wal-Mart, Bureau of Labor Statistics
For six of the seven positions, Wal-Mart wages are equal or above the prevailing wage in more than 50% of the MSAs (column 3 and column 4). In the case of Wal-Mart Radio Grill workers, Wal-Mart is above the average wage in virtually 100% of the MSAs (column 3 and column 4). In the case of the salesperson category, almost 80% of the MSAs fall below the confidence interval (column 2). On further analysis, however,
10 The 47% figure includes full-time workers in stores outside of MSAs. The sample of full-time employees in MSAs matched to BLS estimates for purpose of comparison is 28.2% of full-time workers. 11 The Wal-Mart positions were compared with the following BLS SOC code numbers: Wal-Mart Radio Grill staff – "35-3021 Combined Food Preparation and Serving Workers, Including Fast Food", Bakers – "51-3011 Bakers"; tire repair and change – "49-3093 Tire Repairers and Changers"; retail salesperson – "41-2031 Retail Salespersons"; cashiers – “41-2011 Cashiers”; stockers – “43-5081 Stock Clerks and Order Fillers”; and maintenance – “37-2011 Janitors and Cleaners, Except Maids and Housekeeping Cleaners”.
The Economic Impact of Wal-Mart 15
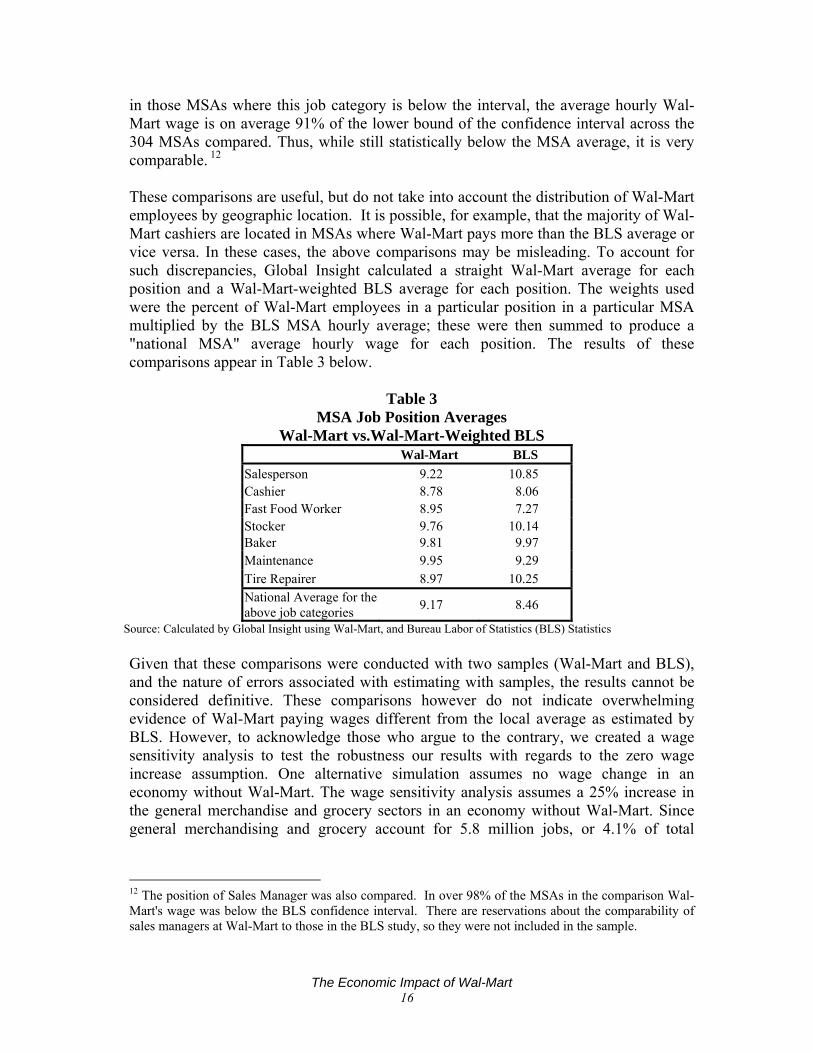
in those MSAs where this job category is below the interval, the average hourly Wal-Mart wage is on average 91% of the lower bound of the confidence interval across the 304 MSAs compared. Thus, while still statistically below the MSA average, it is very comparable. 12 These comparisons are useful, but do not take into account the distribution of Wal-Mart employees by geographic location. It is possible, for example, that the majority of Wal-Mart cashiers are located in MSAs where Wal-Mart pays more than the BLS average or vice versa. In these cases, the above comparisons may be misleading. To account for such discrepancies, Global Insight calculated a straight Wal-Mart average for each position and a Wal-Mart-weighted BLS average for each position. The weights used were the percent of Wal-Mart employees in a particular position in a particular MSA multiplied by the BLS MSA hourly average; these were then summed to produce a "national MSA" average hourly wage for each position. The results of these comparisons appear in Table 3 below.
Table 3
MSA Job Position Averages Wal-Mart vs.Wal-Mart-Weighted BLS
Wal-Mart BLS Salesperson 9.22 10.85 Cashier 8.78 8.06 Fast Food Worker 8.95 7.27 Stocker 9.76 10.14 Baker 9.81 9.97 Maintenance 9.95 9.29 Tire Repairer 8.97 10.25 National Average for the above job categories 9.17 8.46
Source: Calculated by Global Insight using Wal-Mart, and Bureau Labor of Statistics (BLS) Statistics Given that these comparisons were conducted with two samples (Wal-Mart and BLS), and the nature of errors associated with estimating with samples, the results cannot be considered definitive. These comparisons however do not indicate overwhelming evidence of Wal-Mart paying wages different from the local average as estimated by BLS. However, to acknowledge those who argue to the contrary, we created a wage sensitivity analysis to test the robustness our results with regards to the zero wage increase assumption. One alternative simulation assumes no wage change in an economy without Wal-Mart. The wage sensitivity analysis assumes a 25% increase in the general merchandise and grocery sectors in an economy without Wal-Mart. Since general merchandising and grocery account for 5.8 million jobs, or 4.1% of total
12 The position of Sales Manager was also compared. In over 98% of the MSAs in the comparison Wal-Mart's wage was below the BLS confidence interval. There are reservations about the comparability of sales managers at Wal-Mart to those in the BLS study, so they were not included in the sample.
The Economic Impact of Wal-Mart 16
employment, a 25% increase in wages in these sectors would imply an approximate 1.0% increase in the U.S. wage rate.
Simulation Results Simulation of the Global Insight Model of the U.S. Economy, under the assumption of higher prices induced largely by efficiency gains, allows us to quantify the impact that Wal-Mart has had on consumers' purchasing power, employment, and the distribution of income among consumer, business, and government sectors of the economy. In the macroeconomic model, total factor productivity (technical progress), the labor force, and the capital stock determine the productive potential of an economy. Hence, Wal-Mart directly raised the economy's potential to produce by investing in more capital, by using all its factors of production more efficiently, and by helping suppliers operate more efficiently as well. The higher supply potential raises productivity and lowers consumer prices. Global Insight estimates that prices are 3.1% lower as a result of Wal-Mart, which corresponds to a 0.1–0.2 percentage-point reduction in the annual inflation rate over the last 19 years. The reduction in the price level due to the presence of Wal-Mart directly translates into savings for consumers. Table 4 summarizes these savings on a per capita and a per household basis. Global Insight estimates that Wal-Mart's lower prices plus its impact on other retailers' prices saved consumers an estimated $263 billion by 2004.13 This calculation only takes into account changes in prices. It must be noted that within the Global Insight macroeconomic model, inflation is modeled as a carefully controlled, interactive process involving wages, prices, and market conditions. Equations embodying a near accelerationist point of view produce substantial secondary wage and price effects after the initial impetus from the efficiency, capital, and import price changes. Thus, nominal wage inflation also declines as a result of lower consumer price inflation. Partially offsetting the decline in wage inflation, however, are higher productivity gains and lower unemployment rates that are also attributed to Wal-Mart (see below). As a result, wage rates do not decline as much as consumer prices. Wal-Mart's presence in the economy, therefore, has led to an increase in the inflation-adjusted or real wage rate. The higher real wage rate, combined with higher employment levels, increased consumers' purchasing power by $118 billion in 2004 dollars.
13 Consumer expenditures in 2004 totaled $8.230 trillion. Without 3.1% lower prices due to Wal-Mart, these same purchases would cost consumers $8.493 trillion, or $263 billion more.
The Economic Impact of Wal-Mart 17
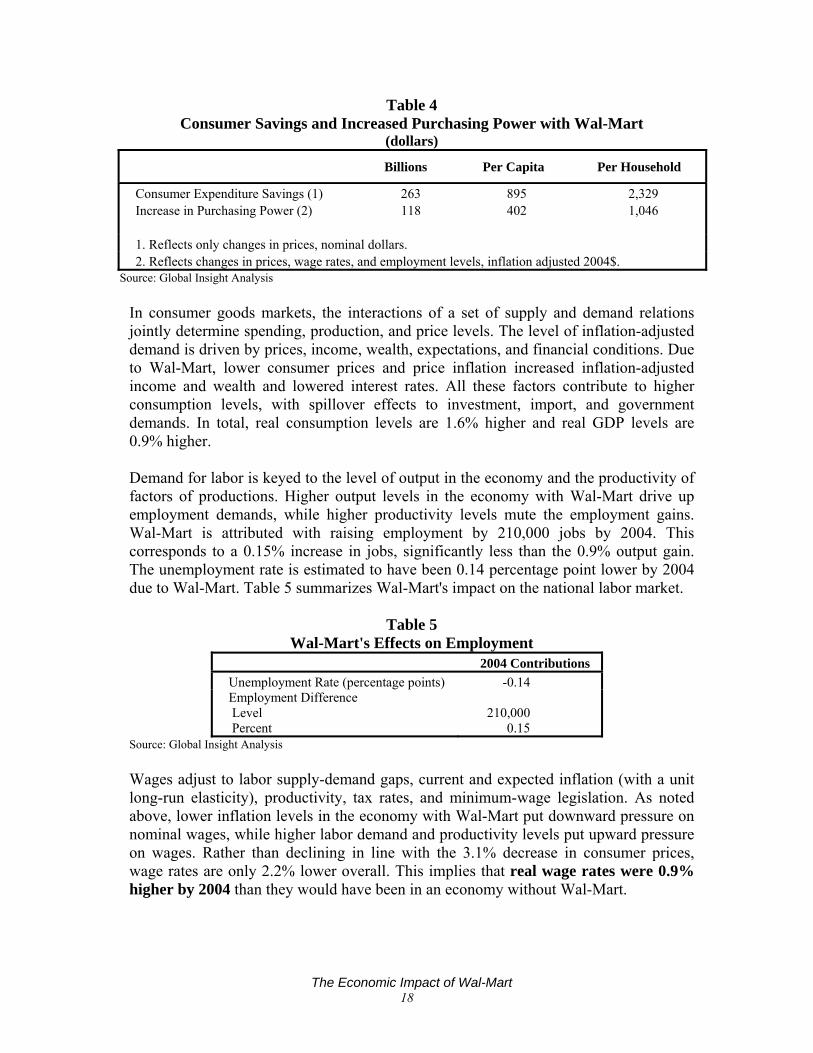
Table 4 Consumer Savings and Increased Purchasing Power with Wal-Mart
(dollars)
Billions Per Capita Per Household
Consumer Expenditure Savings (1) 263 895 2,329 Increase in Purchasing Power (2) 118 402 1,046 1. Reflects only changes in prices, nominal dollars. 2. Reflects changes in prices, wage rates, and employment levels, inflation adjusted 2004$.
Source: Global Insight Analysis In consumer goods markets, the interactions of a set of supply and demand relations jointly determine spending, production, and price levels. The level of inflation-adjusted demand is driven by prices, income, wealth, expectations, and financial conditions. Due to Wal-Mart, lower consumer prices and price inflation increased inflation-adjusted income and wealth and lowered interest rates. All these factors contribute to higher consumption levels, with spillover effects to investment, import, and government demands. In total, real consumption levels are 1.6% higher and real GDP levels are 0.9% higher. Demand for labor is keyed to the level of output in the economy and the productivity of factors of productions. Higher output levels in the economy with Wal-Mart drive up employment demands, while higher productivity levels mute the employment gains. Wal-Mart is attributed with raising employment by 210,000 jobs by 2004. This corresponds to a 0.15% increase in jobs, significantly less than the 0.9% output gain. The unemployment rate is estimated to have been 0.14 percentage point lower by 2004 due to Wal-Mart. Table 5 summarizes Wal-Mart's impact on the national labor market.
Table 5 Wal-Mart's Effects on Employment
2004 Contributions Unemployment Rate (percentage points) -0.14 Employment Difference Level Percent
210,000 0.15
Source: Global Insight Analysis Wages adjust to labor supply-demand gaps, current and expected inflation (with a unit long-run elasticity), productivity, tax rates, and minimum-wage legislation. As noted above, lower inflation levels in the economy with Wal-Mart put downward pressure on nominal wages, while higher labor demand and productivity levels put upward pressure on wages. Rather than declining in line with the 3.1% decrease in consumer prices, wage rates are only 2.2% lower overall. This implies that real wage rates were 0.9% higher by 2004 than they would have been in an economy without Wal-Mart.
The Economic Impact of Wal-Mart 18
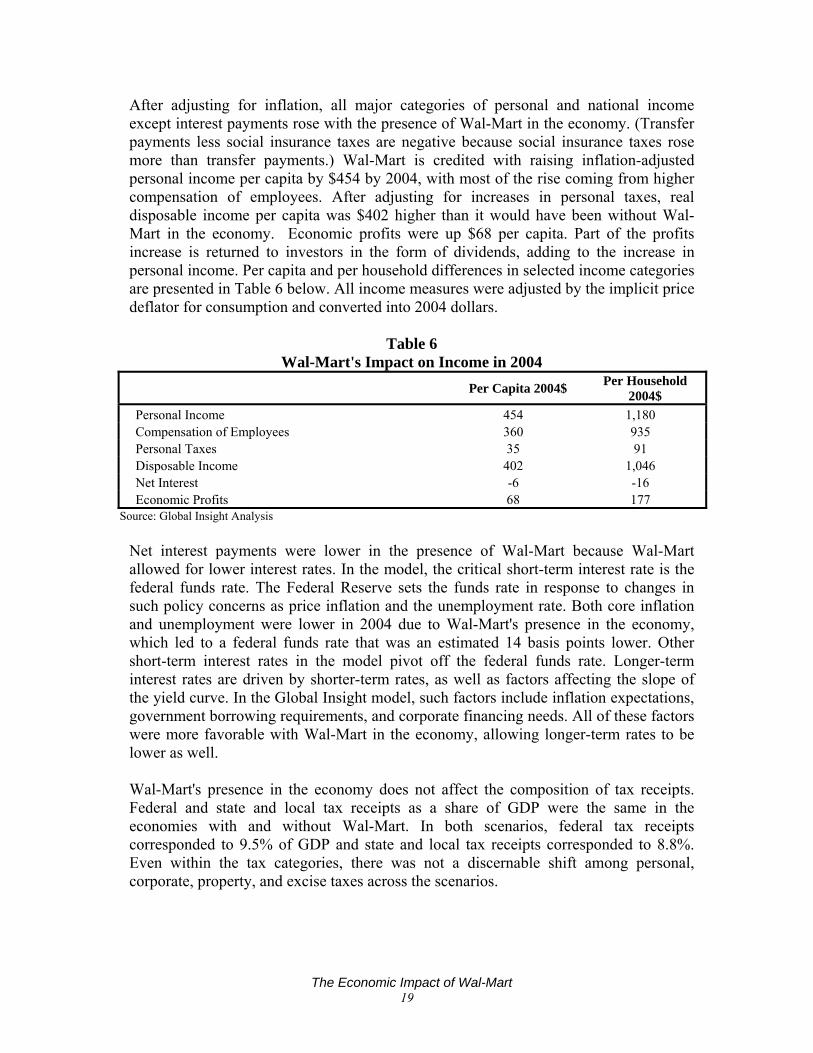
After adjusting for inflation, all major categories of personal and national income except interest payments rose with the presence of Wal-Mart in the economy. (Transfer payments less social insurance taxes are negative because social insurance taxes rose more than transfer payments.) Wal-Mart is credited with raising inflation-adjusted personal income per capita by $454 by 2004, with most of the rise coming from higher compensation of employees. After adjusting for increases in personal taxes, real disposable income per capita was $402 higher than it would have been without Wal-Mart in the economy. Economic profits were up $68 per capita. Part of the profits increase is returned to investors in the form of dividends, adding to the increase in personal income. Per capita and per household differences in selected income categories are presented in Table 6 below. All income measures were adjusted by the implicit price deflator for consumption and converted into 2004 dollars.
Table 6 Wal-Mart's Impact on Income in 2004
Per Capita 2004$ Per Household 2004$
Personal Income 454 1,180 Compensation of Employees 360 935 Personal Taxes 35 91 Disposable Income 402 1,046 Net Interest -6 -16 Economic Profits 68 177
Source: Global Insight Analysis Net interest payments were lower in the presence of Wal-Mart because Wal-Mart allowed for lower interest rates. In the model, the critical short-term interest rate is the federal funds rate. The Federal Reserve sets the funds rate in response to changes in such policy concerns as price inflation and the unemployment rate. Both core inflation and unemployment were lower in 2004 due to Wal-Mart's presence in the economy, which led to a federal funds rate that was an estimated 14 basis points lower. Other short-term interest rates in the model pivot off the federal funds rate. Longer-term interest rates are driven by shorter-term rates, as well as factors affecting the slope of the yield curve. In the Global Insight model, such factors include inflation expectations, government borrowing requirements, and corporate financing needs. All of these factors were more favorable with Wal-Mart in the economy, allowing longer-term rates to be lower as well. Wal-Mart's presence in the economy does not affect the composition of tax receipts. Federal and state and local tax receipts as a share of GDP were the same in the economies with and without Wal-Mart. In both scenarios, federal tax receipts corresponded to 9.5% of GDP and state and local tax receipts corresponded to 8.8%. Even within the tax categories, there was not a discernable shift among personal, corporate, property, and excise taxes across the scenarios.
The Economic Impact of Wal-Mart 19
Wage Sensitivity Analysis We test the robustness of these results with an alternative wage level assumption. In this alternative scenario, we speculate that the cumulative 3.1% reduction in the CPI level, in the economy with Wal-Mart, is achieved with lower wages rather than higher productivity. Removing Wal-Mart from the economy, we raise wage levels economy-wide by approximately 1% in the hypothetical economy. This increase is achieved by raising wages in the general merchandise and grocery sectors by 25%. Employment in general merchandise and grocery is approximately 4.1% of total employment. Under this scenario, by 2004 Wal-Mart is responsible for 870,000 net jobs and a comparable rise in real disposable income as under the no wage compression simulation.
The Economic Impact of Wal-Mart 20
IV. MSA IMPACT ANALYSIS
Objective The purpose of this analysis is to illustrate the methodology utilized to answer the question "How different would the economy of the Dallas-Fort Worth-Arlington MSA have been in 2004 if Wal-Mart had not existed?" To answer this question, Global Insight focused primarily on estimating the differences in the levels of economic activity in the Dallas-Fort Worth-Arlington MSA between the Baseline Scenario, which includes Wal-Mart, and the alternative No Wal-Mart Scenario. In the No Wal-Mart Scenario, the differences in variables such as total employment, employment by major economic sector, total income, and per capita personal income, among others, are measured. The divergence that exists in 2004 is due to the cumulative effects of Wal-Mart’s increasing presence in the MSA since the first Dallas-Fort Worth-area store was established in 1978. The economic impacts are presented in comprehensible measures such as per capita or per household results when feasible.
Study Area The Dallas-Fort Worth-Arlington MSA, as defined by the Office of Management and Budget (OMB), consists of the following 12 Texas counties: Collin, Dallas, Delta, Denton, Ellis, Hunt, Johnson, Kaufman, Parker, Rockwall, Tarrant, and Wise. The MSA has also been further subdivided into two metropolitan divisions (MD), Dallas and Fort Worth. All data and analyses presented in this section of the study are for the MSA, unless otherwise noted.
Selection of the Dallas MSA as the Study Area The Dallas-Fort Worth-Arlington MSA was selected for this analysis for three specific reasons. First, it is one of 27 MSAs for which the Bureau of Labor Statistics reports the consumer price index (CPI). It was important to analyze a metro area with this data so as to facilitate the measurement of Wal-Mart’s effect on the MSA's prices and compare them with the national-level price effects detailed above. Second, Wal-Mart was already well established in the Dallas-Fort Worth area prior to the start of the 1990s. The substantial length of the analysis period and the availability of explanatory data allowed for superior measurement of Wal-Mart's cumulative effects on the local economy. Furthermore, it allowed for more statistically robust results. It would be more difficult to capture Wal-Mart’s effects in metro areas where it began entering the retail market in the late 1990s. Finally, Dallas-Fort Worth’s economic structure embodies the characteristics of a representative U.S. metropolitan area. Levels of per capita income and average household income are slightly above average U.S. levels, and rates of employment and wage growth are similar to the nation. The selection of the Dallas-Forth Worth-Arlington MSA was largely due to the fact that the effects of Wal-Mart on this regional
The Economic Impact of Wal-Mart 21
economy were likely to be similar to those that have occurred or are occurring in other large MSAs.
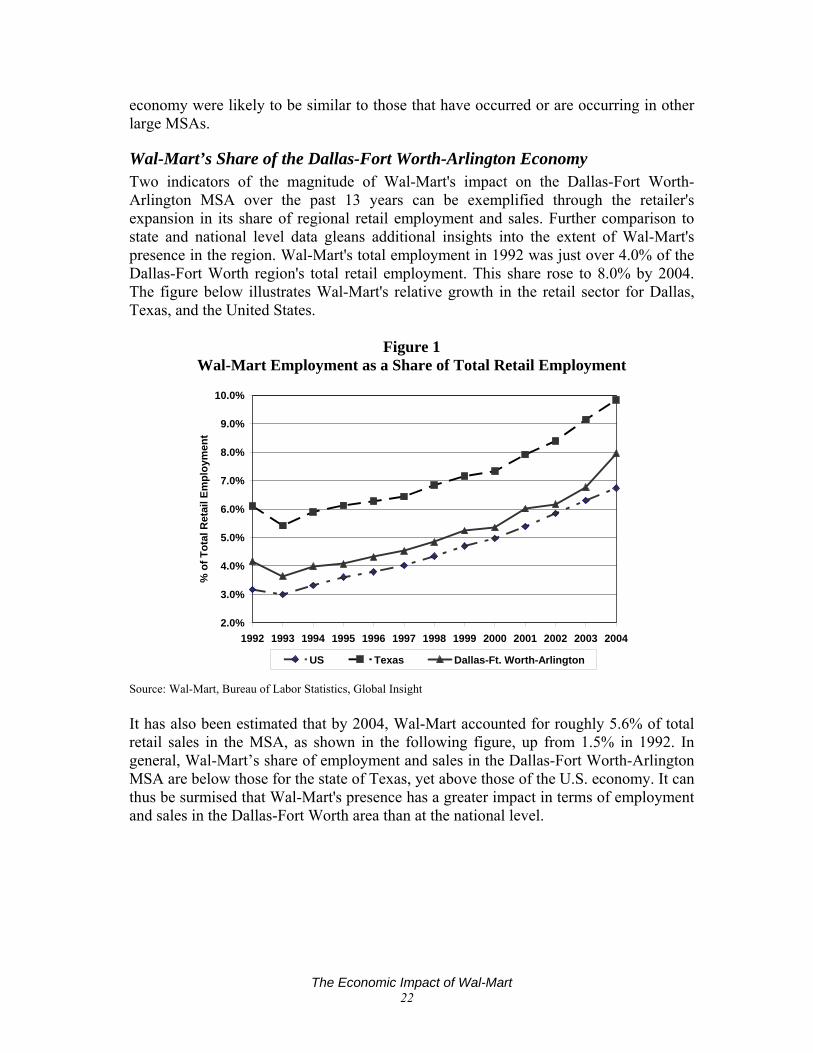
Wal-Mart’s Share of the Dallas-Fort Worth-Arlington Economy Two indicators of the magnitude of Wal-Mart's impact on the Dallas-Fort Worth-Arlington MSA over the past 13 years can be exemplified through the retailer's expansion in its share of regional retail employment and sales. Further comparison to state and national level data gleans additional insights into the extent of Wal-Mart's presence in the region. Wal-Mart's total employment in 1992 was just over 4.0% of the Dallas-Fort Worth region's total retail employment. This share rose to 8.0% by 2004. The figure below illustrates Wal-Mart's relative growth in the retail sector for Dallas, Texas, and the United States.
Figure 1 Wal-Mart Employment as a Share of Total Retail Employment
2.0%
3.0%
4.0%
5.0%
6.0%
7.0%
8.0%
9.0%
10.0%
1992 1993 1994 1995 1996 1997 1998 1999 2000 2001 2002 2003 2004
% o
f Tot
al R
etai
l Em
ploy
men
t
US Texas Dallas-Ft. Worth-Arlington
Source: Wal-Mart, Bureau of Labor Statistics, Global Insight It has also been estimated that by 2004, Wal-Mart accounted for roughly 5.6% of total retail sales in the MSA, as shown in the following figure, up from 1.5% in 1992. In general, Wal-Mart’s share of employment and sales in the Dallas-Fort Worth-Arlington MSA are below those for the state of Texas, yet above those of the U.S. economy. It can thus be surmised that Wal-Mart's presence has a greater impact in terms of employment and sales in the Dallas-Fort Worth area than at the national level.
The Economic Impact of Wal-Mart 22
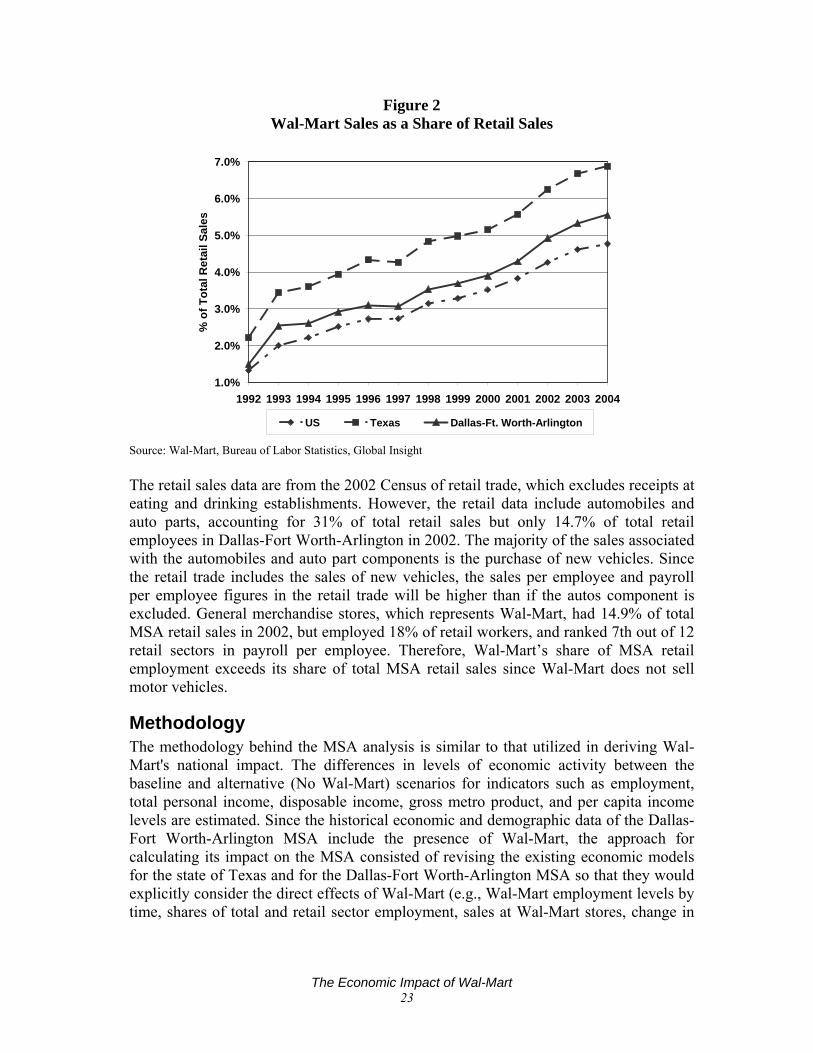
Figure 2 Wal-Mart Sales as a Share of Retail Sales
1.0%
2.0%
3.0%
4.0%
5.0%
6.0%
7.0%
1992 1993 1994 1995 1996 1997 1998 1999 2000 2001 2002 2003 2004Year
% o
f Tot
al R
etai
l Sal
es
US Texas Dallas-Ft. Worth-Arlington
Source: Wal-Mart, Bureau of Labor Statistics, Global Insight The retail sales data are from the 2002 Census of retail trade, which excludes receipts at eating and drinking establishments. However, the retail data include automobiles and auto parts, accounting for 31% of total retail sales but only 14.7% of total retail employees in Dallas-Fort Worth-Arlington in 2002. The majority of the sales associated with the automobiles and auto part components is the purchase of new vehicles. Since the retail trade includes the sales of new vehicles, the sales per employee and payroll per employee figures in the retail trade will be higher than if the autos component is excluded. General merchandise stores, which represents Wal-Mart, had 14.9% of total MSA retail sales in 2002, but employed 18% of retail workers, and ranked 7th out of 12 retail sectors in payroll per employee. Therefore, Wal-Mart’s share of MSA retail employment exceeds its share of total MSA retail sales since Wal-Mart does not sell motor vehicles.
Methodology The methodology behind the MSA analysis is similar to that utilized in deriving Wal-Mart's national impact. The differences in levels of economic activity between the baseline and alternative (No Wal-Mart) scenarios for indicators such as employment, total personal income, disposable income, gross metro product, and per capita income levels are estimated. Since the historical economic and demographic data of the Dallas-Fort Worth-Arlington MSA include the presence of Wal-Mart, the approach for calculating its impact on the MSA consisted of revising the existing economic models for the state of Texas and for the Dallas-Fort Worth-Arlington MSA so that they would explicitly consider the direct effects of Wal-Mart (e.g., Wal-Mart employment levels by time, shares of total and retail sector employment, sales at Wal-Mart stores, change in
The Economic Impact of Wal-Mart 23
CPI levels, etc.). The results of the national macroeconomic No Wal-Mart Scenario were then applied to the revised state and MSA models, resulting in the alternative 2004 regional forecast. The following discussion enumerates the details of this approach, including specific changes in the models.
Structure of Global Insight’s State and MSA Models In forecasting economic activity for states and MSAs, Global Insight constructs individual, stand-alone economic models for the 51 states (including the District of Columbia) and 361 MSAs (including 29 MDs) that are then linked into the national macroeconomic model. The state models do not forecast regional growth as simple proportions of U.S. totals. Instead, they explicitly consider the characteristics of the economy being modeled, including:
Historical economic performance by sector relative to that for the U.S. economy. Structure (i.e., distribution of employment and output shares by economic sector). Internal growth dynamics such as high-growth and low-growth sectors. Differential business cycle response.
This approach is referred to as "top-down/bottom-up," and contrasts sharply with both pure share (top-down) models and those that are not linked to a national macroeconomic model (bottom-up). Instead, it embodies the best of both approaches. The objective while constructing the state and MSA models is to project how regional activity varies, given a national economic environment. This environment is provided by the forecast outputs of a number of Global Insight’s national-level forecasts, primarily the U.S. macroeconomic forecast, but also including results from the Industry, Energy, and Agricultural forecasts. In order to do this, it is necessary to explain two key phenomena:
Why do states and MSAs react differently over the business cycle? Why do state and MSA economies grow or decline relative to each other over
the long run? These issues are addressed through the use of information about detailed industrial mix, inter-industry and inter-regional relationships, productivity and relative costs, and migration trends. As noted above, each state and MSA is modeled individually, with different model structures specified according to the characteristics of the state. The comparative advantage of one state over another is explicitly modeled using relative wage and cost variables. Each econometric state and MSA model is able to capture the full business-cycle behavior of the economy, including the timing and amplitude of the turning points. This is feasible through the use of exogenous variables that are the outcomes of Global Insight's U.S.-level forecasts. The regional models are also policy sensitive in that they respond to changes in U.S. macroeconomic policy (i.e., interest rates, tax rates, level and composition of federal spending, etc.) as well as to variables at the state level, such as tax rates and utility costs.
The Economic Impact of Wal-Mart 24
Through the “top-down” approach described above, the state and MSA models use roughly 80 exogenous variables produced by Global Insight's U.S. macroeconomic forecasts. As a result, when performing an analysis of the effects of a No Wal-Mart Scenario at the MSA level, a major determinant of the impacts will be the characteristics of the changes at the national level and the extent to which they affect the regional economy. For example, the national-level analysis concluded that, with Wal-Mart, by 2004 the level of the U.S. CPI was 3.1% lower, total U.S. employment was 210,000 jobs greater. The key issues considered in the Dallas-Fort Worth-Arlington MSA analysis were:
The extent to which the composition and size of the national-level economic impacts would also occur in the regional economy.
The characteristics and historical economic performance of the regional economy as considered in the revised models, which includes Wal-Mart's direct effects in the region that results in economic impacts that are different than those at the U.S. level.
As noted above, Wal-Mart’s shares of retail employment, total employment, and retail sales are larger in the MSA than in the nation. In addition, the CPI by 2004 was 4% lower due to the presence of Wal-Mart. Thus, the working hypothesis at the outset of the MSA analysis was that the economic impacts of Wal-Mart would be more significant in the Dallas-Fort Worth-Arlington MSA than at the national level. For this analysis, the results of the two national macroeconomic simulations were utilized to first estimate the impacts for the state of Texas, and then for the Dallas-Fort Worth-Arlington MSA. This sequential approach is required since state models are driven by exogenous variables obtained from the national macroeconomic models, and the MSA models in turn use the results of the state forecasts as exogenous variables.
Specification of the MSA Model The first step in the MSA analysis was to apply the results of the two national macroeconomic analyses to the Texas and Dallas-Fort Worth-Arlington models in order to determine the extent to which the national effects were influencing the region. Based on the experiences in similar impact studies, some revision to the models is generally necessary. In order to ensure that the models fully capture the direct economic effects at the MSA level, there is generally a need to revise any number of the equations by using the direct effects (e.g., Wal-Mart’s employment and retail sales levels and shares in the MSA over time) as independent or right-hand variables in the equations. In other cases it is necessary to estimate new equations. The degree to which the state and MSA models responded to the national macroeconomic effects enabled us to first identify the economic sectors where noticeable changes occurred, and then ascertain which model equations required revision. The following direct effects of Wal-Mart were considered in revising our MSA model.
The Economic Impact of Wal-Mart 25
The change in the levels of the consumer price index (CPI) for the Dallas-Fort
Worth-Arlington MSA was determined based on the U.S. CPI analysis previously described. The analysis showed that by 2004 the level of the CPI for "all urban consumers for all items" in the MSA was 4% lower with Wal-Mart. The corresponding difference for the CPI for core inflation, which excludes food and energy, was 2.5% lower. A comparison was made for the 24 MSAs for which detailed CPI time series data existed. Both of the percent differences were the second-highest among the 24 MSAs analyzed, exceeded only by Anchorage, Alaska. This suggests that the price effects of Wal-Mart in the Dallas-Fort Worth-Arlington MSA were likely to be measurable.
Wal-Mart’s total sales by year from 1992 through 2004. Wal-Mart’s total employment, shares of MSA retail employment, and total
employment by year for the 1992–2004 period. As previously noted, this analysis revealed that Wal-Mart’s market and employment shares in the Dallas-Fort Worth-Arlington MSA were lower than those in Texas, but higher than those in the United States.
Wal-Mart's total cost of goods sold failed to result in any statistical significance despite the attempts to utilize the variable in a number of equation estimations.
Subsequently, equations were re-specified, re-estimated, and then analyzed until the equations were econometrically defensible. All modified equations met the following criteria:
Statistical significance. Acceptable r-squared values. Correct signs on the coefficients as indicated by economic theory. Statistically significant coefficients. No unacceptably high levels of auto-correlation.
The equations were estimated using 48 periods of quarterly data from the first quarter of 1992 to the fourth quarter of 2003.
Model Results The analysis' results for the cumulative effects of Wal-Mart on the Dallas-Fort Worth-Arlington MSA economy are generally consistent with those found in the national impact analysis. Price effects generate increases in the real income variables under the baseline scenario (With Wal-Mart). However, the percentage increases in real income attributable to Wal-Mart’s activities are larger than those at the national level for two reasons:
Wal-Mart’s shares of MSA employment and retail sales are larger than its shares of the U.S. economy.
The level of the MSA’s CPI by 2004 was 4.0% lower with Wal-Mart, compared with only 3.1% lower for the U.S. economy.
The Economic Impact of Wal-Mart 26
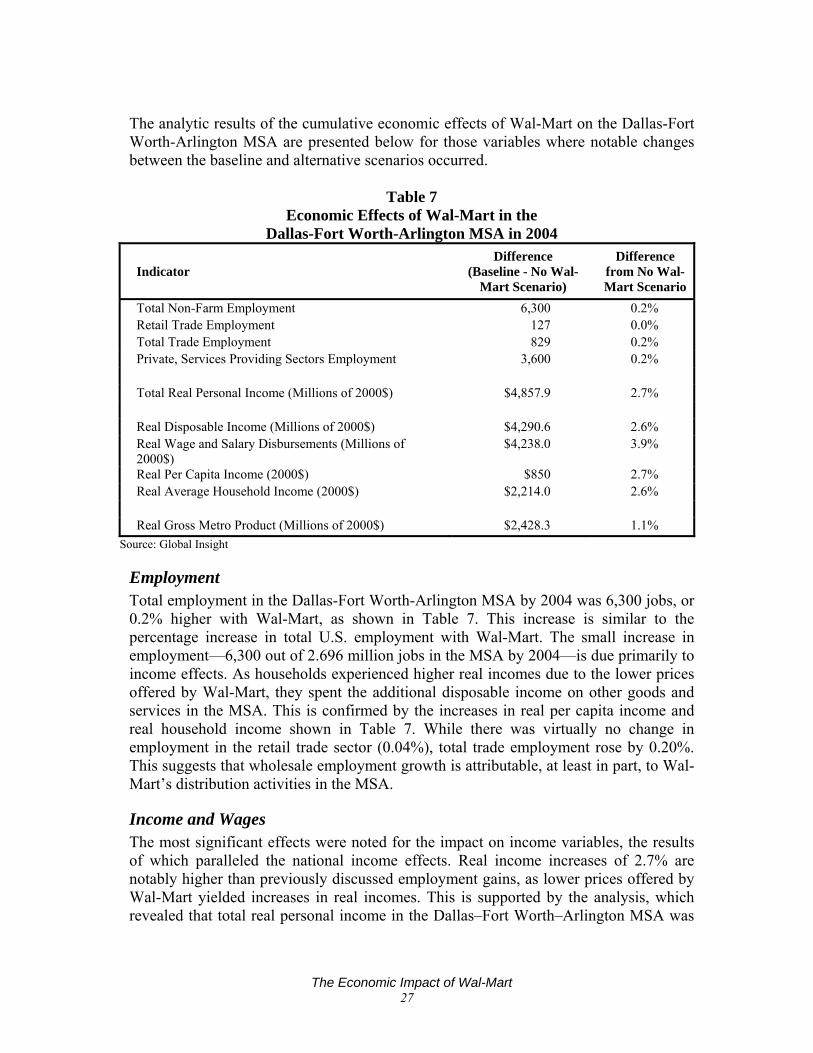
The analytic results of the cumulative economic effects of Wal-Mart on the Dallas-Fort Worth-Arlington MSA are presented below for those variables where notable changes between the baseline and alternative scenarios occurred.
Table 7 Economic Effects of Wal-Mart in the
Dallas-Fort Worth-Arlington MSA in 2004
Indicator Difference
(Baseline - No Wal-Mart Scenario)
Difference from No Wal-Mart Scenario
Total Non-Farm Employment 6,300 0.2% Retail Trade Employment 127 0.0% Total Trade Employment 829 0.2% Private, Services Providing Sectors Employment 3,600 0.2% Total Real Personal Income (Millions of 2000$) $4,857.9 2.7% Real Disposable Income (Millions of 2000$) $4,290.6 2.6% Real Wage and Salary Disbursements (Millions of 2000$)
$4,238.0 3.9%
Real Per Capita Income (2000$) $850 2.7% Real Average Household Income (2000$) $2,214.0 2.6% Real Gross Metro Product (Millions of 2000$) $2,428.3 1.1%
Source: Global Insight
Employment Total employment in the Dallas-Fort Worth-Arlington MSA by 2004 was 6,300 jobs, or 0.2% higher with Wal-Mart, as shown in Table 7. This increase is similar to the percentage increase in total U.S. employment with Wal-Mart. The small increase in employment—6,300 out of 2.696 million jobs in the MSA by 2004—is due primarily to income effects. As households experienced higher real incomes due to the lower prices offered by Wal-Mart, they spent the additional disposable income on other goods and services in the MSA. This is confirmed by the increases in real per capita income and real household income shown in Table 7. While there was virtually no change in employment in the retail trade sector (0.04%), total trade employment rose by 0.20%. This suggests that wholesale employment growth is attributable, at least in part, to Wal-Mart’s distribution activities in the MSA.
Income and Wages The most significant effects were noted for the impact on income variables, the results of which paralleled the national income effects. Real income increases of 2.7% are notably higher than previously discussed employment gains, as lower prices offered by Wal-Mart yielded increases in real incomes. This is supported by the analysis, which revealed that total real personal income in the Dallas–Fort Worth–Arlington MSA was
The Economic Impact of Wal-Mart 27
roughly $4.857 billion higher by 2004 with Wal-Mart. The effects on wages and salary earnings are also worth noting. Our analysis showed that real wage and salary earnings were 3.9% greater because of the presence of Wal-Mart. The combination of slightly higher nominal wages and 4% lower consumer prices in the MSA with Wal-Mart (i.e., more goods can be bought with the same level of nominal income) results in the noticeable increase in real wage and salary earnings.
Gross Metro Product Similar to the national findings, the MSA-level analysis determined that real gross metro product (GMP—the metro-level equivalent of GDP) in the Dallas-Fort Worth-Arlington MSA by 2004 was 1.1% higher, or $2.428 billion greater, due to the presence of Wal-Mart. The real value of goods and services produced in the MSA by 2004 was higher once the lower prices and increased productivity attributable to Wal-Mart are considered. The 1.1% increase in real GMP is slightly higher than the corresponding 0.9% increase in real GDP for the national economy for two main reasons:
Wal-Mart’s shares of economic activity in the MSA in 2004, as measured by employment and retail sales, were higher than its shares of the U.S. economy
The presence of Wal-Mart resulted in a 4% lower CPI by 2004.
Other Variables Changes to a number of other variables considered in this study were minimal. For instance, the region's average unemployment rate of 5.9% by 2004 was roughly 0.1 percentage point lower than it would have been under the No Wal-Mart Scenario. There was also a small percentage increase in the labor force. For other variables, such as population growth, household growth, and housing starts, there was no difference between the 2004 levels under the two scenarios. It appears that the presence of Wal-Mart stores in an MSA is not a factor in attracting households to move into a region. However, once a household is established in the region, its members benefit from the lower prices and higher real incomes that result from the retailer's presence.
The Economic Impact of Wal-Mart 28
V. COUNTY IMPACT ANALYSIS
Objective While Wal-Mart is a national retail chain, a majority of the current debate concerning Wal-Mart's impact occurs at the local level. Citizens, lawmakers, and businesses in counties and municipalities are concerned about the hypothesized harmful effects a potential Wal-Mart entrant could have on the local economy. There has been an abundance of contradictory information concerning the effects that Wal-Mart stores have at the local level. The focus of this part of the study is to shed light on Wal-Mart's bottom-line county-level impact in terms of retail jobs. Global Insight has constructed a rigorous and objective empirical econometric model to quantify this impact. The analysis includes the initial impact of Wal-Mart's entrance into a county and its further expansion. There are three potential impacts Wal-Mart entry and expansion could have on a county's retail employment. First, Wal-Mart increases local retail employment as a result of lower prices, more choices of products, and stronger overall retail activity. Second, Wal-Mart has no impact on retail employment; Wal-Mart simply absorbs resources from other retail establishments in the county. Third, Wal-Mart decreases retail employment in the county as a result of greater competition and higher productivity, so that the same level of retail activity requires fewer workers. Global Insight finds that the establishment of an average Wal-Mart store14 in an average county increases retail employment by an average of 137 jobs, or 3.7%, within the first three years. It should be noted that a typical Wal-Mart store employs 150-350 individuals for Discount Stores and 400-500 individuals for Supercenters, and that this observed increase in retail employment is less than the amount needed to staff even the smallest store. Global Insight also finds that in subsequent years, an average of 40 jobs is lost. Anticipatory and reactionary market actions such as local competitors leaving the market or becoming leaner to compete more effectively and efficiently with Wal-Mart may be the cause of this lower net increase. The average long-run impact of a Wal-Mart store on county retail employment is a net gain of 97 jobs, or 2.3%. Additional analysis was done on the subsectors of retail employment and other sectors with mixed results ranging from a statistically significant positive impact on general merchandise employment to negative impacts on food and apparel employment. The sections herein review the data used, model specification, and model results.
Data Description
Overview Historical data for the county-level impact analysis was derived from five main sources: the Bureau of Economic Analysis, Bureau of Labor Statistics, U.S. Census Bureau,
14 The typical Wal-Mart store is 100,000-150,000 square feet.
The Economic Impact of Wal-Mart 29
Global Insight, and Wal-Mart. The following economic data series were gathered for 3,101 of the 3,142 U.S. counties for the 1985 to 1997 period.15
Personal Income Annual personal income data were collected from the Bureau of Economic Analysis and Global Insight. The data are measured in dollars.
Population Annual county population data for the entire study period were gathered from the U.S. Census Bureau and are measured in persons.
Employment The annual county two-digit SIC employment data utilized in this study were acquired from the Census Bureau's County Business Patterns.16 In order to obtain a more accurate measure of Wal-Mart's impact, the data were then adjusted by Global Insight to account for self-employed individuals.17 A retail employment variable was then created that consists of the following two-digit sectors:18
Building materials and garden supplies General merchandise Food stores Apparel and accessories Furniture and furnishings Miscellaneous retail
A total county employment variable excluding retail was also created for the analysis. County tourism employment was constructed as an aggregate of the following:
Transportation services Hotel and other lodging places Amusement and recreation services Museums, botanical, zoological gardens
15 Some counties were not included because of data availability problems. The time period of the analysis ends at 1997 because of the switch from SIC to NAICS. 16 CBP data are only available through 1997 on an SIC basis. The applicable SIC codes are: Building Materials and Garden Supplies (52), General Merchandise (53), Food Stores (54), Apparel and Accessories (56), Furniture and Furnishings (57), Miscellaneous Retail (59), Automotive Dealers and Service Stations (55), Eating and Drinking Places (58), Transportation Services (47), Hotel and Other Lodging Places (70), Amusement and Recreation Services (79), Museums, Botanical, Zoological Gardens (84), and Wholesale Trade (50 & 51). 17 CBP series excludes data on self-employed individuals. 18 Eating and drinking places and automotive dealers and service stations were eliminated from the total because Wal-Mart did not provide a significant amount of these services over the time period studied. (Basker, Emek. "Job Creation or Destruction? Labor Market Effects of Wal-Mart Expansion," The Review of Economics and Statistics. February, 2005.)
The Economic Impact of Wal-Mart 30
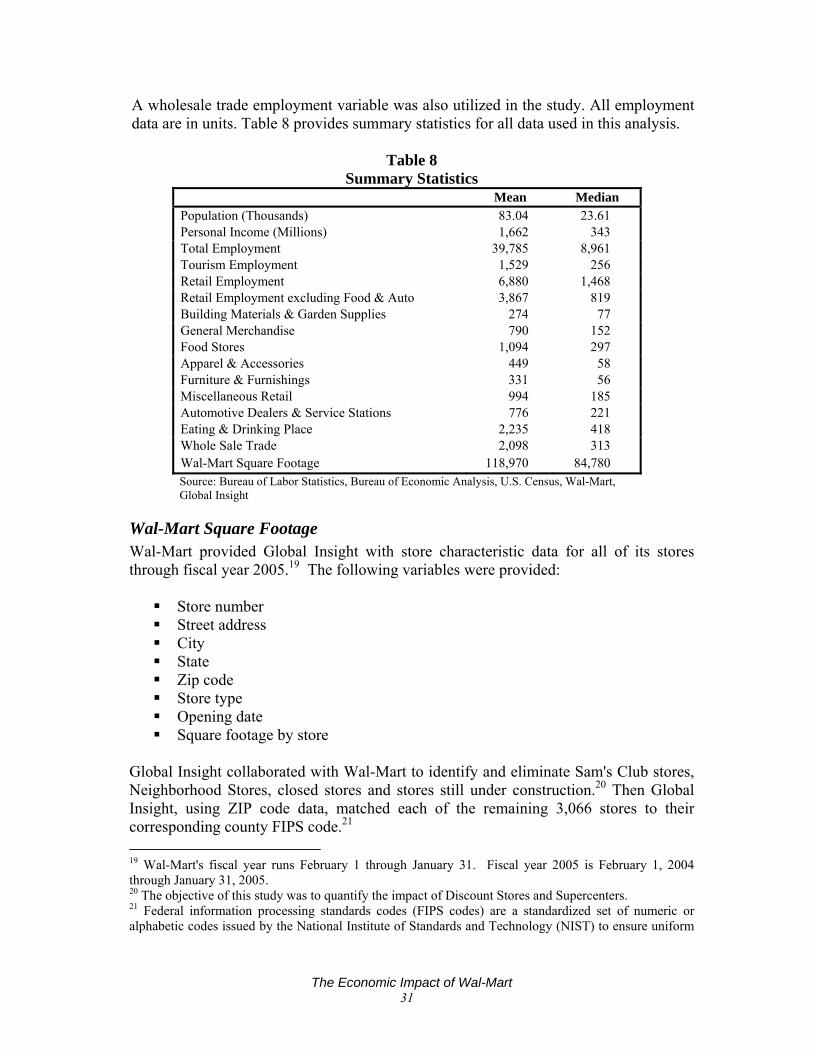
A wholesale trade employment variable was also utilized in the study. All employment data are in units. Table 8 provides summary statistics for all data used in this analysis.
Table 8 Summary Statistics
Mean Median Population (Thousands) 83.04 23.61 Personal Income (Millions) 1,662 343 Total Employment 39,785 8,961 Tourism Employment 1,529 256 Retail Employment 6,880 1,468 Retail Employment excluding Food & Auto 3,867 819 Building Materials & Garden Supplies 274 77 General Merchandise 790 152 Food Stores 1,094 297 Apparel & Accessories 449 58 Furniture & Furnishings 331 56 Miscellaneous Retail 994 185 Automotive Dealers & Service Stations 776 221 Eating & Drinking Place 2,235 418 Whole Sale Trade 2,098 313 Wal-Mart Square Footage 118,970 84,780 Source: Bureau of Labor Statistics, Bureau of Economic Analysis, U.S. Census, Wal-Mart, Global Insight
Wal-Mart Square Footage Wal-Mart provided Global Insight with store characteristic data for all of its stores through fiscal year 2005.19 The following variables were provided:
Store number Street address City State Zip code Store type Opening date Square footage by store
Global Insight collaborated with Wal-Mart to identify and eliminate Sam's Club stores, Neighborhood Stores, closed stores and stores still under construction.20 Then Global Insight, using ZIP code data, matched each of the remaining 3,066 stores to their corresponding county FIPS code.21 19 Wal-Mart's fiscal year runs February 1 through January 31. Fiscal year 2005 is February 1, 2004 through January 31, 2005. 20 The objective of this study was to quantify the impact of Discount Stores and Supercenters. 21 Federal information processing standards codes (FIPS codes) are a standardized set of numeric or alphabetic codes issued by the National Institute of Standards and Technology (NIST) to ensure uniform
The Economic Impact of Wal-Mart 31
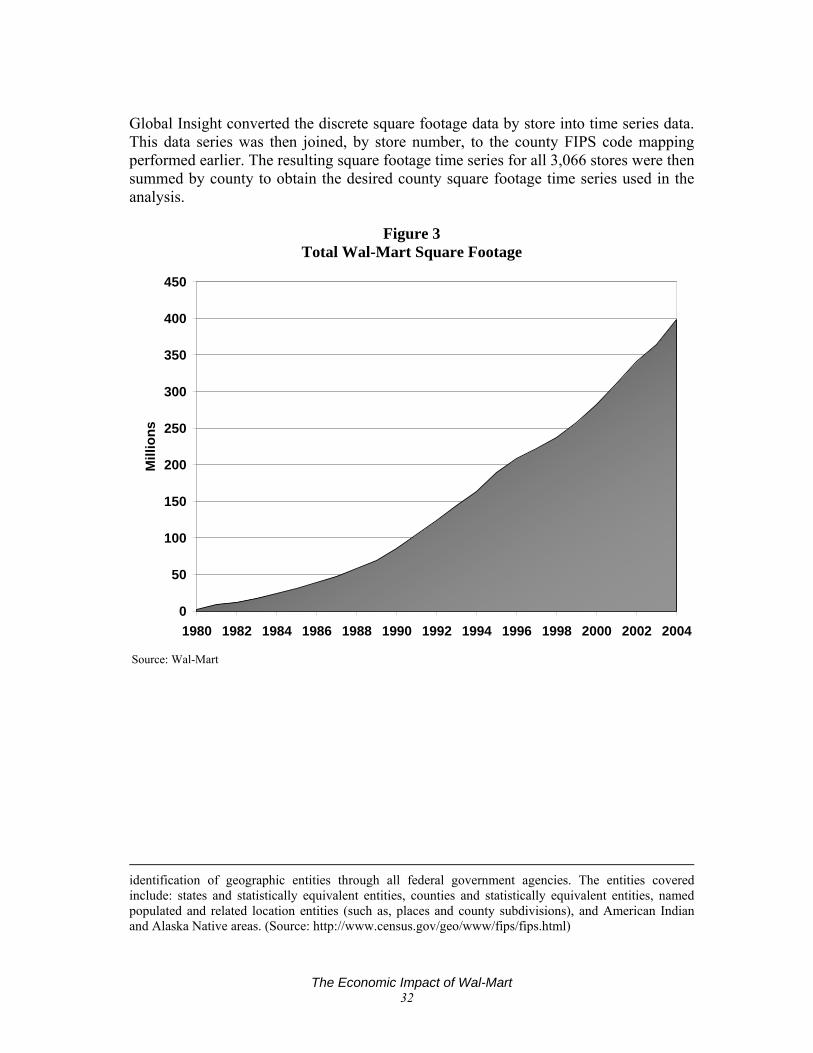
Global Insight converted the discrete square footage data by store into time series data. This data series was then joined, by store number, to the county FIPS code mapping performed earlier. The resulting square footage time series for all 3,066 stores were then summed by county to obtain the desired county square footage time series used in the analysis.
Figure 3 Total Wal-Mart Square Footage
0
50
100
150
200
250
300
350
400
450
1980 1982 1984 1986 1988 1990 1992 1994 1996 1998 2000 2002 2004
Mill
ions
Source: Wal-Mart
identification of geographic entities through all federal government agencies. The entities covered include: states and statistically equivalent entities, counties and statistically equivalent entities, named populated and related location entities (such as, places and county subdivisions), and American Indian and Alaska Native areas. (Source: http://www.census.gov/geo/www/fips/fips.html)
The Economic Impact of Wal-Mart 32
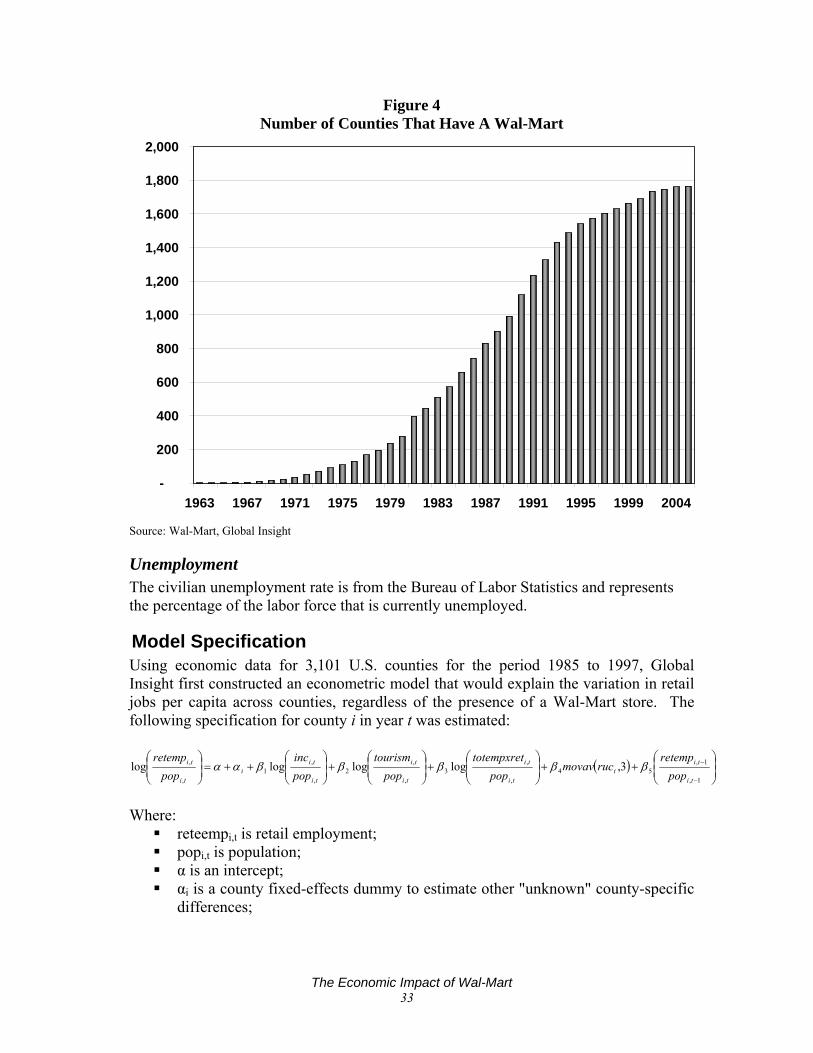
Figure 4 Number of Counties That Have A Wal-Mart
-
200
400
600
800
1,000
1,200
1,400
1,600
1,800
2,000
1963 1967 1971 1975 1979 1983 1987 1991 1995 1999 2004
Source: Wal-Mart, Global Insight
Unemployment The civilian unemployment rate is from the Bureau of Labor Statistics and represents the percentage of the labor force that is currently unemployed.
Model Specification Using economic data for 3,101 U.S. counties for the period 1985 to 1997, Global Insight first constructed an econometric model that would explain the variation in retail jobs per capita across counties, regardless of the presence of a Wal-Mart store. The following specification for county i in year t was estimated:
( ) ⎟⎟⎠
⎞⎜⎜⎝
⎛++⎟
⎟⎠
⎞⎜⎜⎝
⎛+⎟
⎟⎠
⎞⎜⎜⎝
⎛+⎟
⎟⎠
⎞⎜⎜⎝
⎛++=⎟
⎟⎠
⎞⎜⎜⎝
⎛
−
−
1,
1,54
,
,3
,
,2
,
,1
,
, 3,loglogloglogti
tit
ti
ti
ti
ti
ti
tii
ti
ti
popretemp
rucmovavpop
totempxretpop
tourismpopinc
popretemp
βββββαα
Where:
reteempi,t is retail employment; popi,t is population; α is an intercept; αi is a county fixed-effects dummy to estimate other "unknown" county-specific
differences;
The Economic Impact of Wal-Mart 33
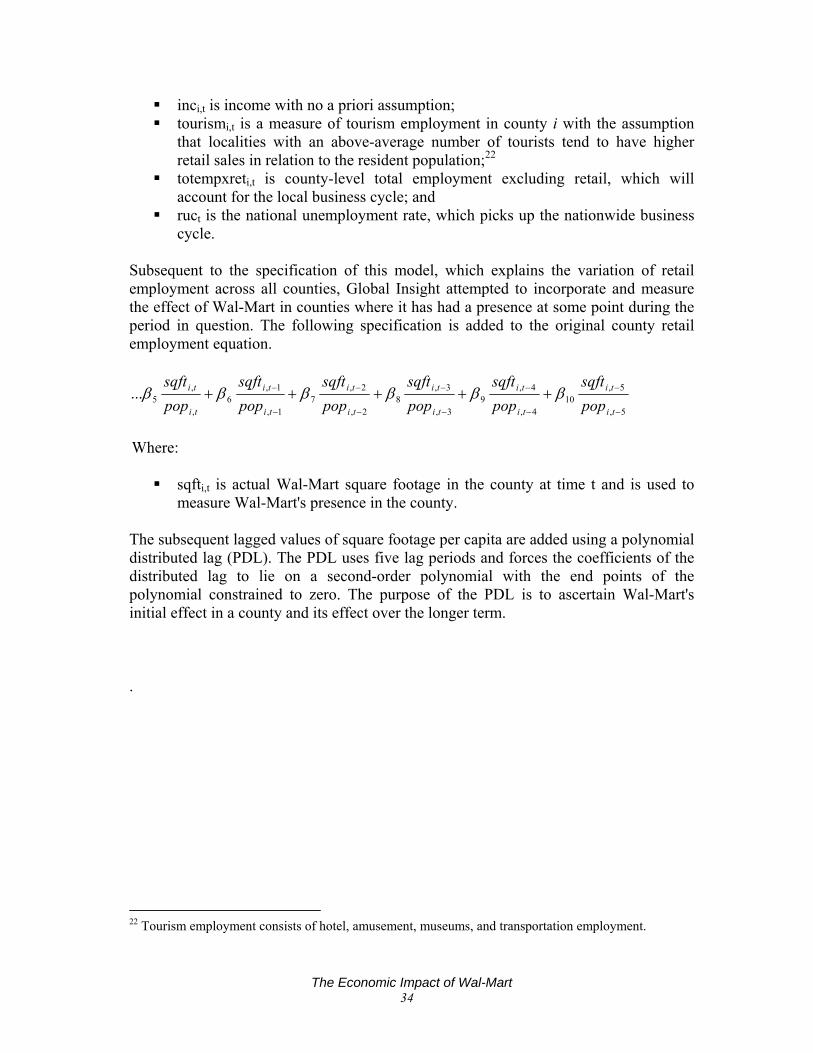
inci,t is income with no a priori assumption; tourismi,t is a measure of tourism employment in county i with the assumption
that localities with an above-average number of tourists tend to have higher retail sales in relation to the resident population;22
totempxreti,t is county-level total employment excluding retail, which will account for the local business cycle; and
ruct is the national unemployment rate, which picks up the nationwide business cycle.
Subsequent to the specification of this model, which explains the variation of retail employment across all counties, Global Insight attempted to incorporate and measure the effect of Wal-Mart in counties where it has had a presence at some point during the period in question. The following specification is added to the original county retail employment equation.
5,
5,10
4,
4,9
3,
3,8
2,
2,7
1,
1,6
,
,5...
−
−
−
−
−
−
−
−
−
− +++++ti
ti
ti
ti
ti
ti
ti
ti
ti
ti
ti
ti
popsqft
popsqft
popsqft
popsqft
popsqft
popsqft
ββββββ
Where:
sqfti,t is actual Wal-Mart square footage in the county at time t and is used to measure Wal-Mart's presence in the county.
The subsequent lagged values of square footage per capita are added using a polynomial distributed lag (PDL). The PDL uses five lag periods and forces the coefficients of the distributed lag to lie on a second-order polynomial with the end points of the polynomial constrained to zero. The purpose of the PDL is to ascertain Wal-Mart's initial effect in a county and its effect over the longer term. .
22 Tourism employment consists of hotel, amusement, museums, and transportation employment.
The Economic Impact of Wal-Mart 34
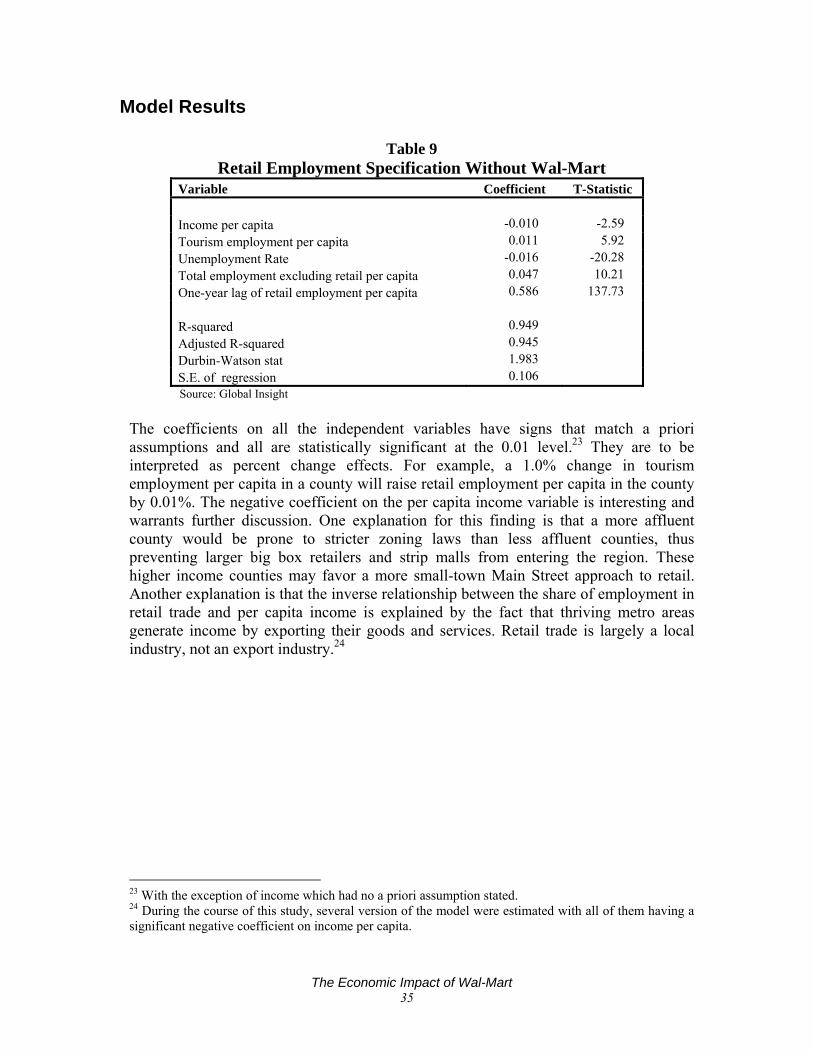
Model Results
Table 9 Retail Employment Specification Without Wal-Mart
Variable Coefficient T-Statistic
Income per capita -0.010 -2.59 Tourism employment per capita 0.011 5.92 Unemployment Rate -0.016 -20.28 Total employment excluding retail per capita 0.047 10.21 One-year lag of retail employment per capita 0.586 137.73 R-squared 0.949 Adjusted R-squared 0.945 Durbin-Watson stat 1.983 S.E. of regression 0.106 Source: Global Insight
The coefficients on all the independent variables have signs that match a priori assumptions and all are statistically significant at the 0.01 level.23 They are to be interpreted as percent change effects. For example, a 1.0% change in tourism employment per capita in a county will raise retail employment per capita in the county by 0.01%. The negative coefficient on the per capita income variable is interesting and warrants further discussion. One explanation for this finding is that a more affluent county would be prone to stricter zoning laws than less affluent counties, thus preventing larger big box retailers and strip malls from entering the region. These higher income counties may favor a more small-town Main Street approach to retail. Another explanation is that the inverse relationship between the share of employment in retail trade and per capita income is explained by the fact that thriving metro areas generate income by exporting their goods and services. Retail trade is largely a local industry, not an export industry.24
23 With the exception of income which had no a priori assumption stated. 24 During the course of this study, several version of the model were estimated with all of them having a significant negative coefficient on income per capita.
The Economic Impact of Wal-Mart 35
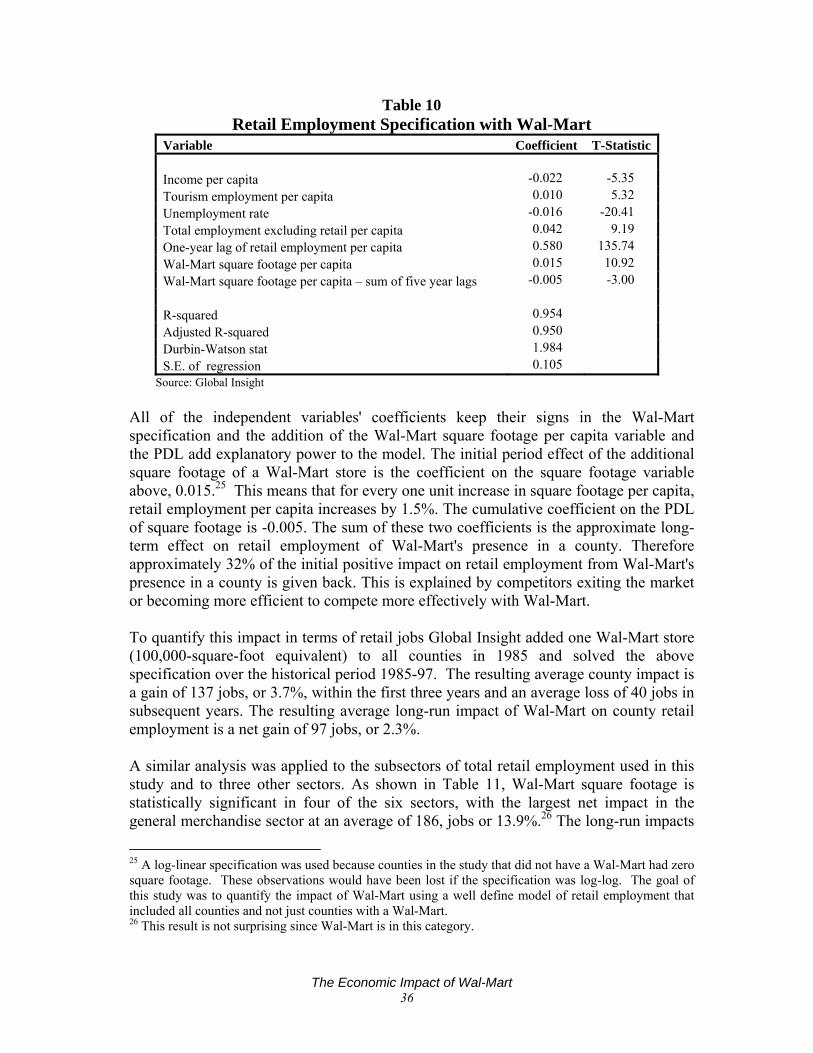
Table 10 Retail Employment Specification with Wal-Mart
Variable Coefficient T-Statistic Income per capita -0.022 -5.35 Tourism employment per capita 0.010 5.32 Unemployment rate -0.016 -20.41 Total employment excluding retail per capita 0.042 9.19 One-year lag of retail employment per capita 0.580 135.74 Wal-Mart square footage per capita 0.015 10.92 Wal-Mart square footage per capita – sum of five year lags -0.005 -3.00 R-squared 0.954 Adjusted R-squared 0.950 Durbin-Watson stat 1.984 S.E. of regression 0.105
Source: Global Insight All of the independent variables' coefficients keep their signs in the Wal-Mart specification and the addition of the Wal-Mart square footage per capita variable and the PDL add explanatory power to the model. The initial period effect of the additional square footage of a Wal-Mart store is the coefficient on the square footage variable above, 0.015.25 This means that for every one unit increase in square footage per capita, retail employment per capita increases by 1.5%. The cumulative coefficient on the PDL of square footage is -0.005. The sum of these two coefficients is the approximate long-term effect on retail employment of Wal-Mart's presence in a county. Therefore approximately 32% of the initial positive impact on retail employment from Wal-Mart's presence in a county is given back. This is explained by competitors exiting the market or becoming more efficient to compete more effectively with Wal-Mart. To quantify this impact in terms of retail jobs Global Insight added one Wal-Mart store (100,000-square-foot equivalent) to all counties in 1985 and solved the above specification over the historical period 1985-97. The resulting average county impact is a gain of 137 jobs, or 3.7%, within the first three years and an average loss of 40 jobs in subsequent years. The resulting average long-run impact of Wal-Mart on county retail employment is a net gain of 97 jobs, or 2.3%. A similar analysis was applied to the subsectors of total retail employment used in this study and to three other sectors. As shown in Table 11, Wal-Mart square footage is statistically significant in four of the six sectors, with the largest net impact in the general merchandise sector at an average of 186, jobs or 13.9%.26 The long-run impacts
25 A log-linear specification was used because counties in the study that did not have a Wal-Mart had zero square footage. These observations would have been lost if the specification was log-log. The goal of this study was to quantify the impact of Wal-Mart using a well define model of retail employment that included all counties and not just counties with a Wal-Mart. 26 This result is not surprising since Wal-Mart is in this category.
The Economic Impact of Wal-Mart 36
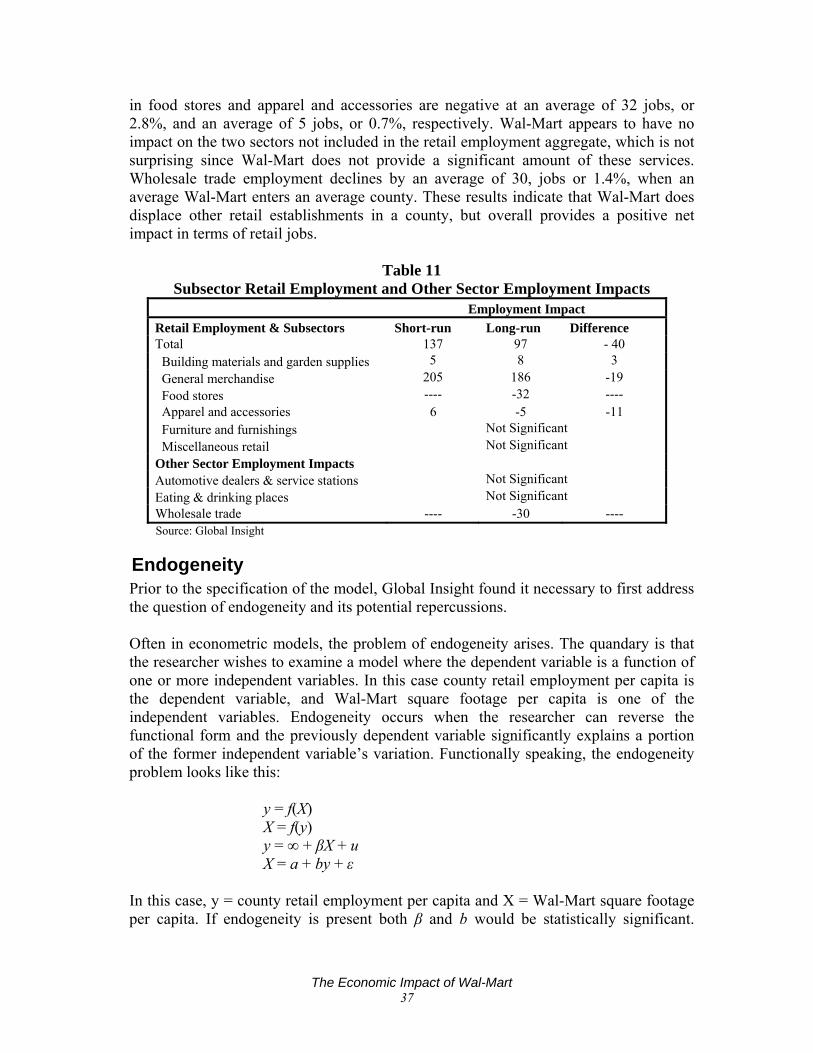
in food stores and apparel and accessories are negative at an average of 32 jobs, or 2.8%, and an average of 5 jobs, or 0.7%, respectively. Wal-Mart appears to have no impact on the two sectors not included in the retail employment aggregate, which is not surprising since Wal-Mart does not provide a significant amount of these services. Wholesale trade employment declines by an average of 30, jobs or 1.4%, when an average Wal-Mart enters an average county. These results indicate that Wal-Mart does displace other retail establishments in a county, but overall provides a positive net impact in terms of retail jobs.
Table 11
Subsector Retail Employment and Other Sector Employment Impacts Employment Impact Retail Employment & Subsectors Short-run Long-run Difference Total 137 97 - 40 Building materials and garden supplies 5 8 3 General merchandise 205 186 -19 Food stores ---- -32 ---- Apparel and accessories 6 -5 -11 Furniture and furnishings Not Significant Miscellaneous retail Not Significant Other Sector Employment Impacts Automotive dealers & service stations Not Significant Eating & drinking places Not Significant Wholesale trade ---- -30 ---- Source: Global Insight
Endogeneity Prior to the specification of the model, Global Insight found it necessary to first address the question of endogeneity and its potential repercussions. Often in econometric models, the problem of endogeneity arises. The quandary is that the researcher wishes to examine a model where the dependent variable is a function of one or more independent variables. In this case county retail employment per capita is the dependent variable, and Wal-Mart square footage per capita is one of the independent variables. Endogeneity occurs when the researcher can reverse the functional form and the previously dependent variable significantly explains a portion of the former independent variable’s variation. Functionally speaking, the endogeneity problem looks like this: y = f(X)
X = f(y) y = ∞ + βX + u X = a + by + ε
In this case, y = county retail employment per capita and X = Wal-Mart square footage per capita. If endogeneity is present both β and b would be statistically significant.
The Economic Impact of Wal-Mart 37
Alternatively, endogeneity would be present if Wal-Mart chose to situate a store in a county dependent upon an observable pattern or phenomenon occurring in retail employment per capita in that county around the same time that the Wal-Mart store opened. The movements of retail employment per capita would “predict” where a Wal-Mart store would open. To examine whether such a pattern in retail employment per capita existed during the time series, the growth rate of retail employment per capita in Wal-Mart counties was calculated for the period immediately preceding the Wal-Mart store opening. Specifically, a five-year compound annual growth rate (CAGR) of retail employment per capita in the county was calculated for the immediate period preceding the Wal-Mart store opening in the county and was compared with the CAGR of national retail employment per capita. For the 1,370 counties with a Wal-Mart store opening the results are as follows:
617 counties (45%) were growing faster at the county level than nationally. 753 counties (55%) were growing slower.
This near 50/50 split suggests that a county’s retail employment per capita growth in the years preceding Wal-Mart’s entrance in the county has no bearing on the decision to locate there. Wal-Mart is just as likely to enter into a county with above-average growth in retail employment as they are to locate in a county with below-average growth.27 These calculations suggest that the presence of endogeneity between county retail employment per capita and a Wal-Mart store opening does not exist. A similar analysis was done looking at just population growth with 562 Counties (41%) growing faster than national average and 808 Counties (59%) growing slower than national average. These results suggest that endogeneity is also not a concern when considering overall growth in a county that Wal-Mart entered.
27 In fact, a discussion with Wal-Mart about store location criteria provided Global Insight with additional information that endogeneity for this model specification was not a concern.
The Economic Impact of Wal-Mart 38
VI. TECHNICAL APPENDIX
Appendix A. Global Insight Price Impact Report
Introduction
Background Anecdotal evidence suggests that when Wal-Mart enters a market, its everyday low prices are anywhere from 5% to 25% lower for identical goods. In addition, Wal-Mart's presence in a market has led its competitors to lower their prices. Wal-Mart's lower prices represent a direct effect on consumer prices, while Wal-Mart's impact on its competitors' prices represents an indirect price effect. The Bureau of Labor Statistics (BLS) creates and publishes consumer price indexes (CPI) to quantify changes in consumer prices over time. The BLS has a sample of stores in a market from which it collects prices. When a new retail outlet enters the market, it may replace an existing outlet in the BLS sample. The replacement occurs, however, through a "linking procedure" that ignores differences in the overall level of prices between the two outlets. The BLS assumes that the "quality-adjusted" prices at the new outlet are the same as at the outlet that it is replacing. This "quality adjustment" argument is applied to all items, including identical brand items. Thus, the BLS measuring technique ignores the direct price effect of a lower price outlet such as Wal-Mart in its CPI measurement when the outlet first enters the sample. What it does capture, however, is the indirect effect that the lower price outlet has on the prices of competitors that are in the sample and the direct price effects of the lower price outlet going forward.
Objective The objective of this report is to quantify the impact that Wal-Mart has had on the measured CPI. Because of the technique that the BLS uses to create its CPI, this falls short of Wal-Mart's total impact on consumer prices. Global Insight will quantify the measured impact that Wal-Mart has had on consumer prices for 24 MSAs and for the U.S. in total.
Scope In a comprehensive model of the economy, prices are determined in combination with demand, supply and financial conditions. In specific goods markets, the interactions of a set of supply and demand relations jointly determine spending, production, and price levels. Typically, the level of inflation-adjusted demand is driven by prices, income, wealth, expectations, and financial conditions. The capacity to supply goods and services is keyed to a production function combining the basic inputs of labor, capital, and energy with “total factor productivity." In the overall economy, labor inputs represent approximately 65% of production costs, capital represents 30%, and energy represents 5%.
The Economic Impact of Wal-Mart 39
Prices adjust in response to gaps between demand and supply potential and to changes in the cost of inputs. Wages adjust to labor supply-demand gaps, current and expected inflation, productivity, tax rates, and minimum wage legislation. The supply of labor positively responds to the perceived availability of jobs, to the after-tax wage level, and to the growth and age-sex mix of the population. Demand for labor is keyed to the level of output in the economy and the productivity of labor, capital, and energy. Tempering the whole process of wage and price determination is the exchange rate; a rise signals prospective losses of jobs and markets unless costs and prices are reduced. This study attempts to explain the variation in consumer price growth across MSAs. The variation to be explained is the difference in the MSA CPI growth relative to U.S. CPI growth. Therefore, the question we need to ask is which of the factors that determine price inflation are likely to vary significantly across regions. We would expect that the impact of financial markets on capital costs and the effect of exchange rates to be relatively uniform across the country. On the other hand, we would expect labor, energy and goods market conditions to vary significantly across U.S. regions. This in turn can lead to significant variations in regional wage and energy cost inflation and in demand pressures. In addition, we would also like to test whether or not Wal-Mart has had a significant impact on price inflation across the MSAs. This is possible because Wal-Mart's concentration varies significantly by MSA. The BLS creates and publishes consumer price indexes for 24 MSAs. This study attempts to explain the variation in consumer price growth from 1985 to 2004 for the 24 MSAs. This analysis tests for the statistical significance of the following factors in explaining variation in consumer price growth using pooled-cross section regression analysis:
Labor market impacts o Change in unemployment rates (measures demand/supply gap)
Energy markets impacts o Energy cost growth
Goods and services markets o Population growth (demand pressures)
Wal-Mart impacts o Change in Wal-Mart square footage
MSA unemployment rates were considered to explain the variation in MSA CPI inflation rates because they summarize labor market disequilibrium across MSAs, and this supply/demand balance is a key determinant of wage rates. Low (high) unemployment rates put upward (downward) pressures on wage rates, and wage inflation in turn drives price inflation. We choose to measure labor market pressures through the unemployment rate rather than wage rates because of the strong simultaneity between wages and prices. We want to capture only the labor market pressures on wage rates and not the effect of prices themselves on wage rates.
The Economic Impact of Wal-Mart 40
Energy costs were considered in the analysis because they were highly volatile over the 1985-2004 analysis period, and this volatility was not uniform across states and MSAs. The variation in energy price inflation was largely due to variation in each area's fuel mix and its ability to change its mix in response to changing costs. This ability, in turn, depended upon its existing infrastructure, state and local regulations, and its access to alternative fuel sources. Energy was considered in the analysis since it is the production cost (outside of labor) that varies the most across regions, and it is a cost to all commercial and industrial sectors. Areas with high population growth could experience higher price inflation if the population's product demand is outpacing product supply. Variation in population growth was thus considered as a possible factor affecting the variation in price inflation across the regions. Wal-Mart is likely to have had a significant impact on price inflation across the MSAs largely for three main reasons. First, its sophisticated logistics and distribution innovations have increased total factor productivity, lowering its overall cost structure and allowing Wal-Mart to provide its goods at lower prices. Second, Wal-Mart's integrated purchasing system and its sheer size (4.4% of retail in the U.S.) has led its suppliers to offer significant volume discounts, which Wal-Mart in turn has passed along to its consumers. And third, its lower prices have pressured its competitors to adopt more efficient processes and to lower their prices.
The Analysis The data source and the rationale for each of the explanatory variables in the statistical analysis of Wal-Mart's impact on competitors' prices are reported. The structure of the regression equation estimated in the analysis is outlined, and the statistical results are presented. A model is developed from the regression equations and used to quantify the measured impact of Wal-Mart on consumer prices by MSA and for the U.S.
Data Description
MSA Consumer Prices The BLS publishes consumer prices indexes for about 30 MSAs. Twenty-four of these MSAs have historical data back to at least 1985 and could be used in our statistical analysis to explain variation in price changes for all items over the 1985-2004 period. The MSAs include:
1. Anchorage 2. Atlanta-Sandy Springs-Marietta 3. Boston-Cambridge-Quincy 4. Chicago-Naperville-Joliet 5. Cincinnati-Middletown 6. Cleveland-Elyria-Mentor 7. Dallas-Fort Worth-Arlington
The Economic Impact of Wal-Mart 41
8. Denver 9. Detroit-Warren-Livonia 10. Honolulu 11. Houston-Baytown-Sugar Land 12. Kansas City 13. Los Angeles-Long Beach-Santa Ana 14. Miami-Fort Lauderdale-Miami Beach 15. Milwaukee-Waukesha-West Allis 16. Minneapolis-St. Paul-Bloomington 17. New York-Northern New Jersey-Long Island 18. Philadelphia-Camden-Wilmington 19. Pittsburgh 20. Portland-Vancouver-Beaverton 21. San Diego-Carlsbad-San Marcos 22. Seattle-Tacoma-Bellevue 23. San Francisco-Oakland-Fremont 24. St. Louis
Our objective is to determine if Wal-Mart's presence has had an impact on measured consumer prices for urban consumers over the past 20 years. The CPI includes three broad categories: durable goods (11%), non-durable goods (29%), and services (60%). If Wal-Mart has an impact on consumer prices, it would be on the first two categories. Consumer prices for services are dominated by rents, imputed rents, utilities, medical services, and transportation -- all areas outside of Wal-Mart's product offerings. The impact of service prices in the overall analysis is netted out by including the CPI for services as an explanatory variable in the regression analysis.28 Hence, the remaining explanatory variables in the regression need only explain the variation in the non-service prices. We also statistically analyzed the impact of Wal-Mart on the measurement of the CPI for food items, on all items excluding food and energy and commodities. All of these additional price indexes by MSA were obtained from the BLS. Figure 5 illustrates the variation in consumer price inflation for the 24 MSAs over the 1985-2004 period. The San Diego and Boston MSAs experienced the highest consumer price inflation over the period, averaging 3.5% per year. Anchorage and Houston experienced the lowest price inflation at an average 2.4-2.6% annually. The average compound annual growth in consumer prices for the 24 MSAs was 3.0%, with a standard deviation of 0.3%.
28 Alternatively, we could have constrained the coefficient on the services CPI to its weight in the overall consumer price index. Since the estimated coefficient on the services CPI was close to its weight in the overall price index, and the coefficients associated with the remaining explanatory variables were not significantly different with and without the constraint, we left the coefficient on the services CPI unconstrained.
The Economic Impact of Wal-Mart 42
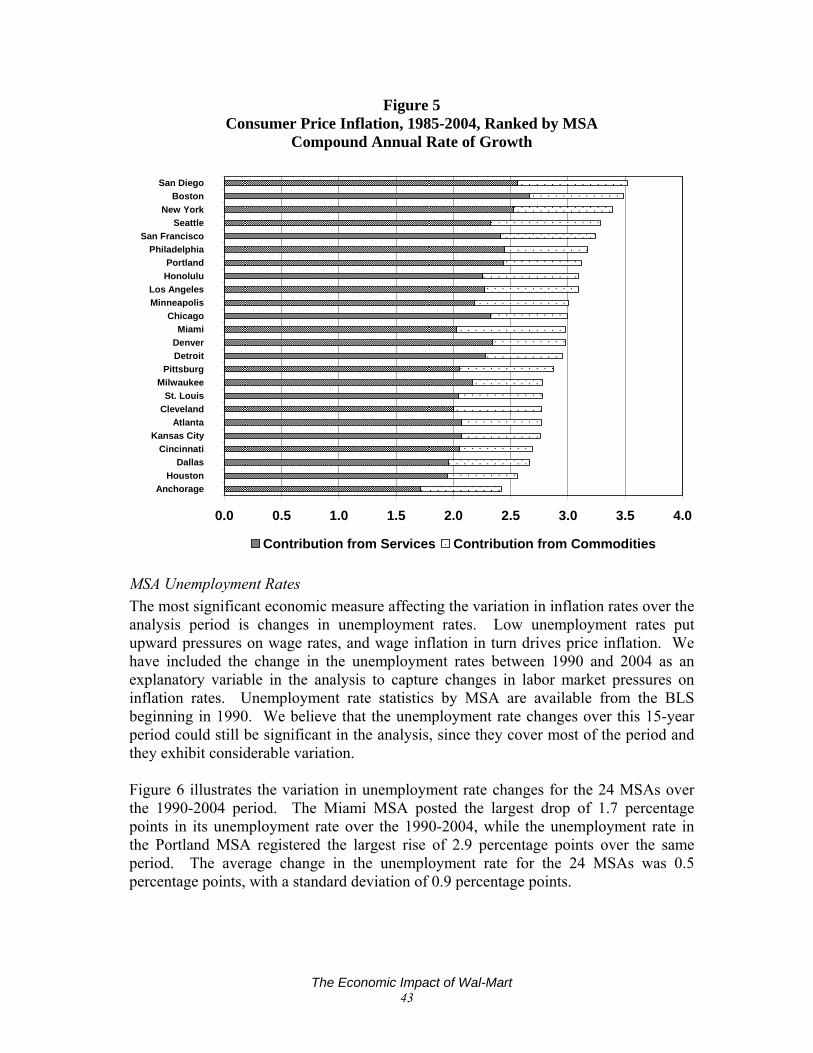
Figure 5 Consumer Price Inflation, 1985-2004, Ranked by MSA
Compound Annual Rate of Growth
0.0 0.5 1.0 1.5 2.0 2.5 3.0 3.5 4.0
Anchorage Houston
Dallas Cincinnati
Kansas City Atlanta
Cleveland St. Louis
Milwaukee Pittsburg
Detroit Denver Miami
Chicago Minneapolis Los Angeles
Honolulu Portland
Philadelphia San Francisco
Seattle New York
Boston San Diego
Contribution from Services Contribution from Commodities
MSA Unemployment Rates The most significant economic measure affecting the variation in inflation rates over the analysis period is changes in unemployment rates. Low unemployment rates put upward pressures on wage rates, and wage inflation in turn drives price inflation. We have included the change in the unemployment rates between 1990 and 2004 as an explanatory variable in the analysis to capture changes in labor market pressures on inflation rates. Unemployment rate statistics by MSA are available from the BLS beginning in 1990. We believe that the unemployment rate changes over this 15-year period could still be significant in the analysis, since they cover most of the period and they exhibit considerable variation. Figure 6 illustrates the variation in unemployment rate changes for the 24 MSAs over the 1990-2004 period. The Miami MSA posted the largest drop of 1.7 percentage points in its unemployment rate over the 1990-2004, while the unemployment rate in the Portland MSA registered the largest rise of 2.9 percentage points over the same period. The average change in the unemployment rate for the 24 MSAs was 0.5 percentage points, with a standard deviation of 0.9 percentage points.
The Economic Impact of Wal-Mart 43
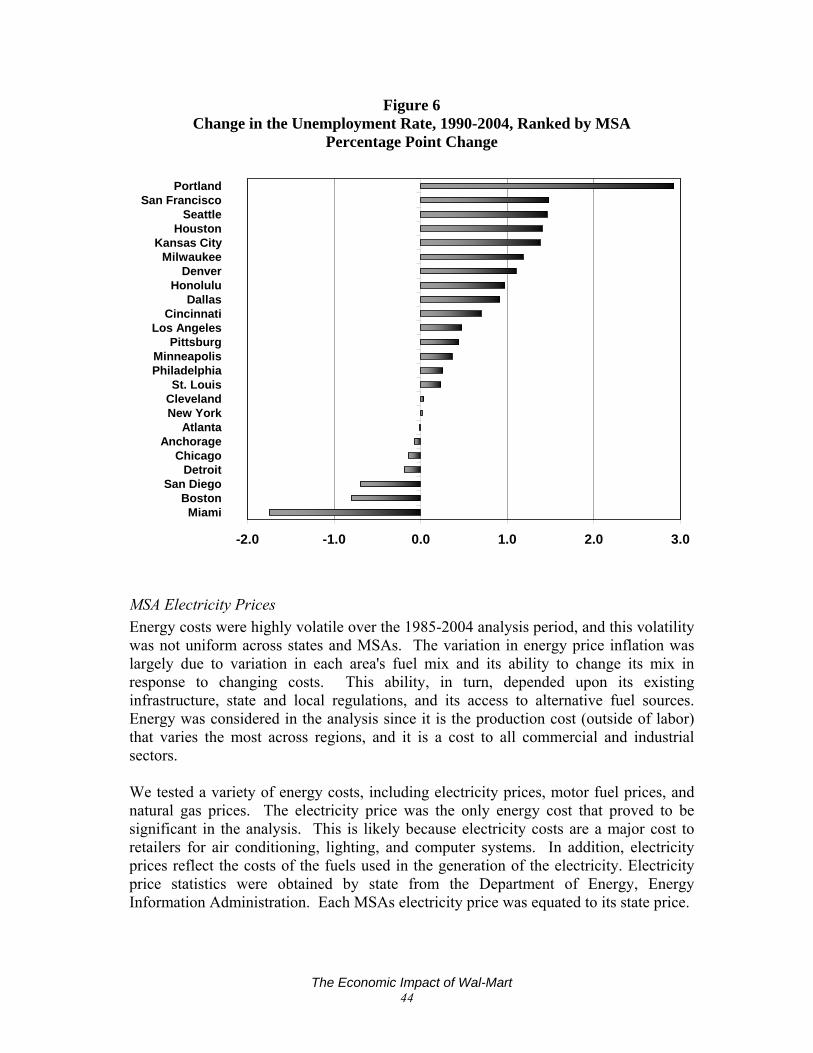
Figure 6 Change in the Unemployment Rate, 1990-2004, Ranked by MSA
Percentage Point Change
-2.0 -1.0 0.0 1.0 2.0 3.0
Miami Boston
San Diego Detroit
Chicago Anchorage
Atlanta New York Cleveland St. Louis
Philadelphia Minneapolis
Pittsburg Los Angeles
Cincinnati Dallas
Honolulu Denver
Milwaukee Kansas City
Houston Seattle
San Francisco Portland
MSA Electricity Prices Energy costs were highly volatile over the 1985-2004 analysis period, and this volatility was not uniform across states and MSAs. The variation in energy price inflation was largely due to variation in each area's fuel mix and its ability to change its mix in response to changing costs. This ability, in turn, depended upon its existing infrastructure, state and local regulations, and its access to alternative fuel sources. Energy was considered in the analysis since it is the production cost (outside of labor) that varies the most across regions, and it is a cost to all commercial and industrial sectors. We tested a variety of energy costs, including electricity prices, motor fuel prices, and natural gas prices. The electricity price was the only energy cost that proved to be significant in the analysis. This is likely because electricity costs are a major cost to retailers for air conditioning, lighting, and computer systems. In addition, electricity prices reflect the costs of the fuels used in the generation of the electricity. Electricity price statistics were obtained by state from the Department of Energy, Energy Information Administration. Each MSAs electricity price was equated to its state price.
The Economic Impact of Wal-Mart 44
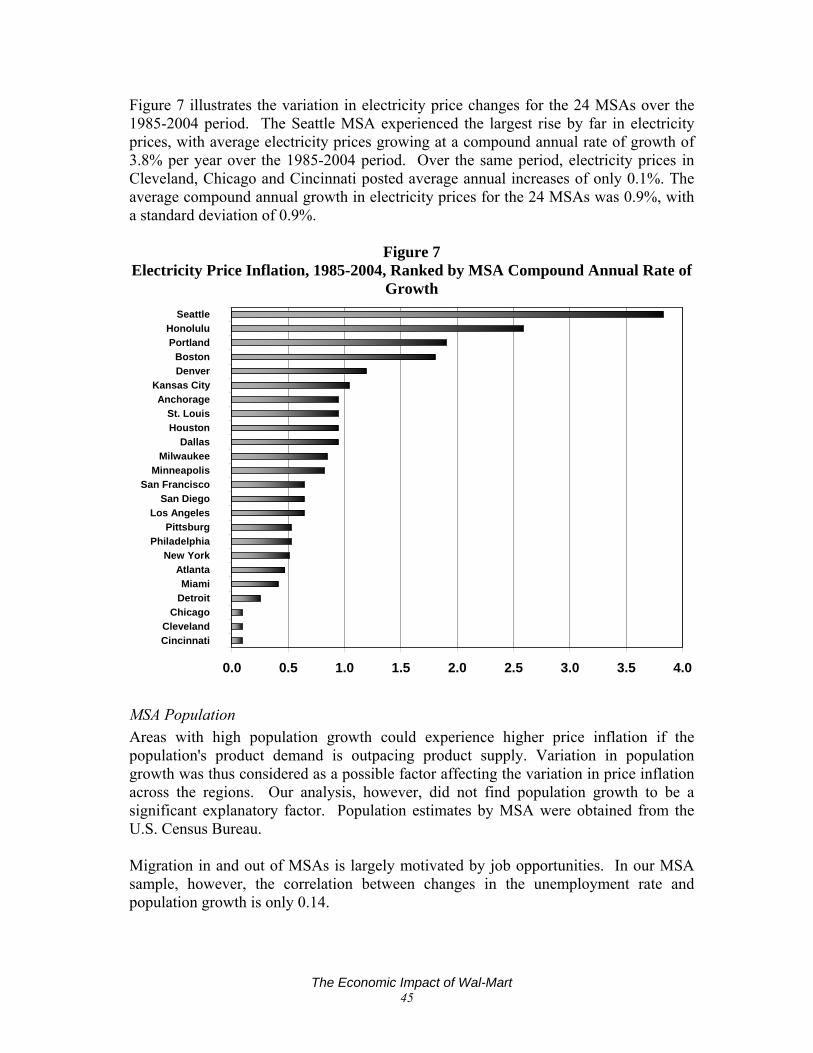
Figure 7 illustrates the variation in electricity price changes for the 24 MSAs over the 1985-2004 period. The Seattle MSA experienced the largest rise by far in electricity prices, with average electricity prices growing at a compound annual rate of growth of 3.8% per year over the 1985-2004 period. Over the same period, electricity prices in Cleveland, Chicago and Cincinnati posted average annual increases of only 0.1%. The average compound annual growth in electricity prices for the 24 MSAs was 0.9%, with a standard deviation of 0.9%.
Figure 7 Electricity Price Inflation, 1985-2004, Ranked by MSA Compound Annual Rate of
Growth
0.0 0.5 1.0 1.5 2.0 2.5 3.0 3.5 4.0
Cincinnati Cleveland
Chicago Detroit Miami
Atlanta New York
Philadelphia Pittsburg
Los Angeles San Diego
San Francisco Minneapolis
Milwaukee Dallas
Houston St. Louis
Anchorage Kansas City
Denver Boston
Portland Honolulu
Seattle
MSA Population Areas with high population growth could experience higher price inflation if the population's product demand is outpacing product supply. Variation in population growth was thus considered as a possible factor affecting the variation in price inflation across the regions. Our analysis, however, did not find population growth to be a significant explanatory factor. Population estimates by MSA were obtained from the U.S. Census Bureau. Migration in and out of MSAs is largely motivated by job opportunities. In our MSA sample, however, the correlation between changes in the unemployment rate and population growth is only 0.14.
The Economic Impact of Wal-Mart 45
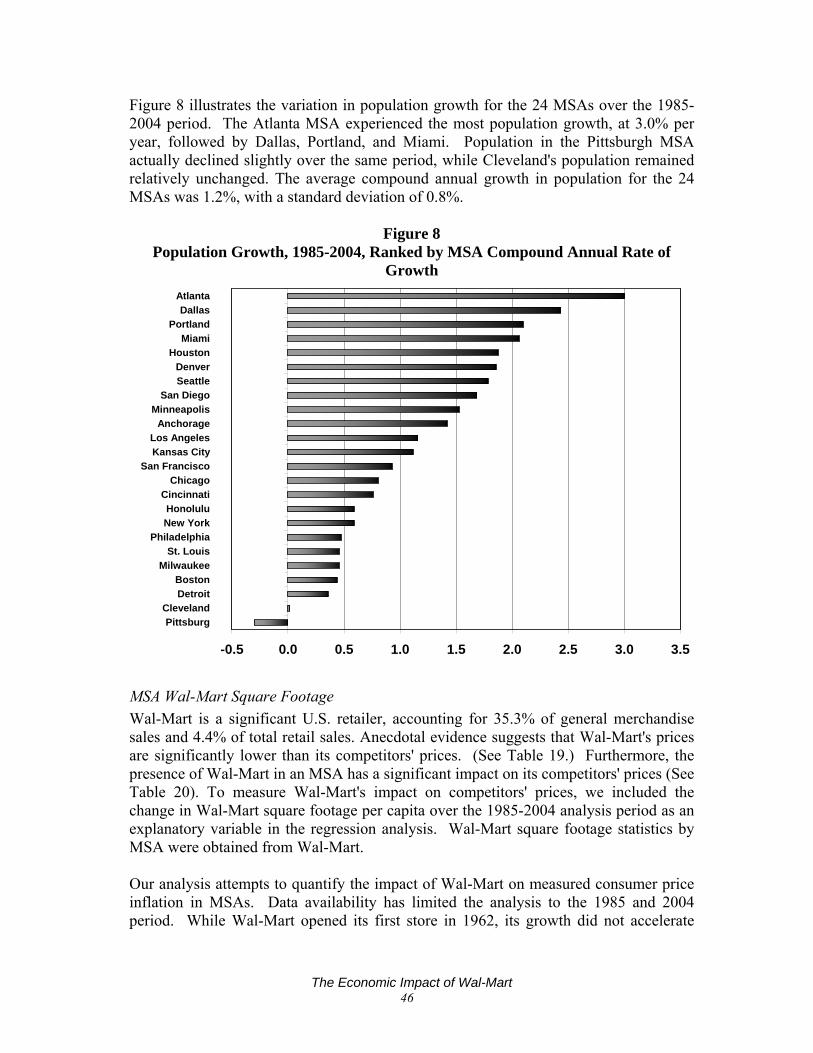
Figure 8 illustrates the variation in population growth for the 24 MSAs over the 1985-2004 period. The Atlanta MSA experienced the most population growth, at 3.0% per year, followed by Dallas, Portland, and Miami. Population in the Pittsburgh MSA actually declined slightly over the same period, while Cleveland's population remained relatively unchanged. The average compound annual growth in population for the 24 MSAs was 1.2%, with a standard deviation of 0.8%.
Figure 8 Population Growth, 1985-2004, Ranked by MSA Compound Annual Rate of
Growth
-0.5 0.0 0.5 1.0 1.5 2.0 2.5 3.0 3.5
Pittsburg Cleveland
Detroit Boston
Milwaukee St. Louis
Philadelphia New York Honolulu
Cincinnati Chicago
San Francisco Kansas City Los Angeles
Anchorage Minneapolis
San Diego Seattle Denver
Houston Miami
Portland Dallas
Atlanta
MSA Wal-Mart Square Footage Wal-Mart is a significant U.S. retailer, accounting for 35.3% of general merchandise sales and 4.4% of total retail sales. Anecdotal evidence suggests that Wal-Mart's prices are significantly lower than its competitors' prices. (See Table 19.) Furthermore, the presence of Wal-Mart in an MSA has a significant impact on its competitors' prices (See Table 20). To measure Wal-Mart's impact on competitors' prices, we included the change in Wal-Mart square footage per capita over the 1985-2004 analysis period as an explanatory variable in the regression analysis. Wal-Mart square footage statistics by MSA were obtained from Wal-Mart. Our analysis attempts to quantify the impact of Wal-Mart on measured consumer price inflation in MSAs. Data availability has limited the analysis to the 1985 and 2004 period. While Wal-Mart opened its first store in 1962, its growth did not accelerate
The Economic Impact of Wal-Mart 46
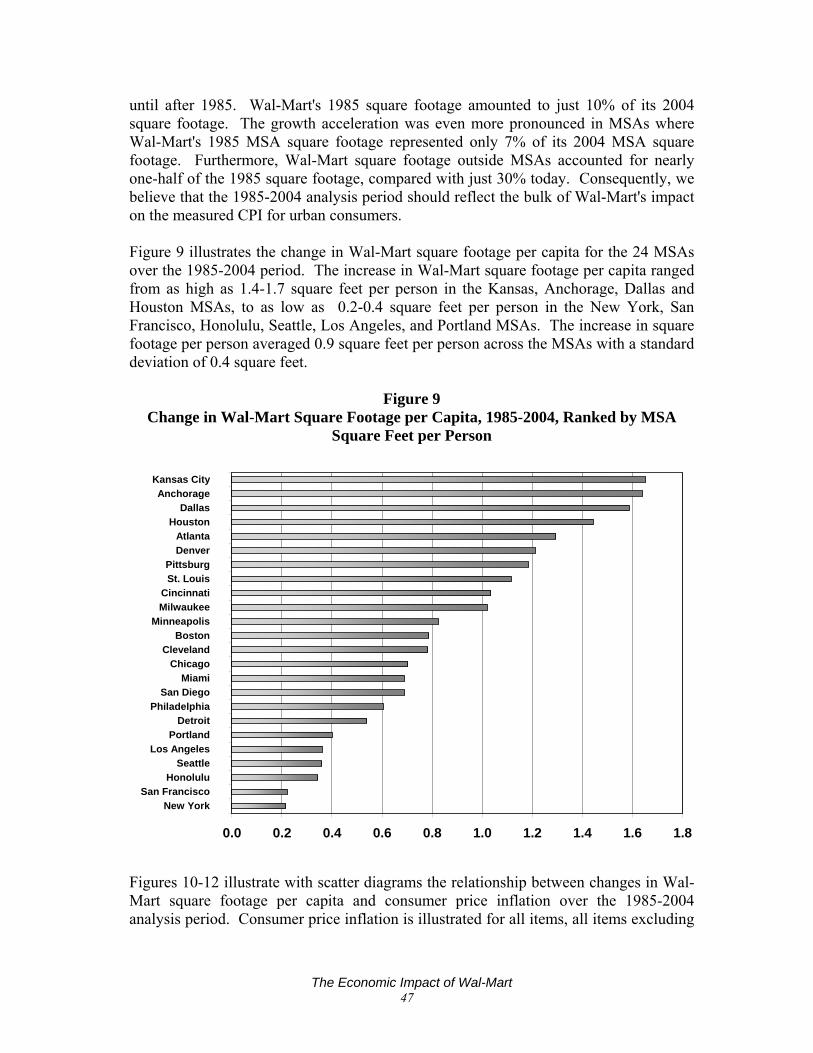
until after 1985. Wal-Mart's 1985 square footage amounted to just 10% of its 2004 square footage. The growth acceleration was even more pronounced in MSAs where Wal-Mart's 1985 MSA square footage represented only 7% of its 2004 MSA square footage. Furthermore, Wal-Mart square footage outside MSAs accounted for nearly one-half of the 1985 square footage, compared with just 30% today. Consequently, we believe that the 1985-2004 analysis period should reflect the bulk of Wal-Mart's impact on the measured CPI for urban consumers. Figure 9 illustrates the change in Wal-Mart square footage per capita for the 24 MSAs over the 1985-2004 period. The increase in Wal-Mart square footage per capita ranged from as high as 1.4-1.7 square feet per person in the Kansas, Anchorage, Dallas and Houston MSAs, to as low as 0.2-0.4 square feet per person in the New York, San Francisco, Honolulu, Seattle, Los Angeles, and Portland MSAs. The increase in square footage per person averaged 0.9 square feet per person across the MSAs with a standard deviation of 0.4 square feet.
Figure 9
Change in Wal-Mart Square Footage per Capita, 1985-2004, Ranked by MSA Square Feet per Person
0.0 0.2 0.4 0.6 0.8 1.0 1.2 1.4 1.6 1.8
New York San Francisco
Honolulu Seattle
Los Angeles Portland
Detroit Philadelphia
San Diego Miami
Chicago Cleveland
Boston Minneapolis
Milwaukee Cincinnati
St. Louis Pittsburg
Denver Atlanta
Houston Dallas
Anchorage Kansas City
Figures 10-12 illustrate with scatter diagrams the relationship between changes in Wal-Mart square footage per capita and consumer price inflation over the 1985-2004 analysis period. Consumer price inflation is illustrated for all items, all items excluding
The Economic Impact of Wal-Mart 47
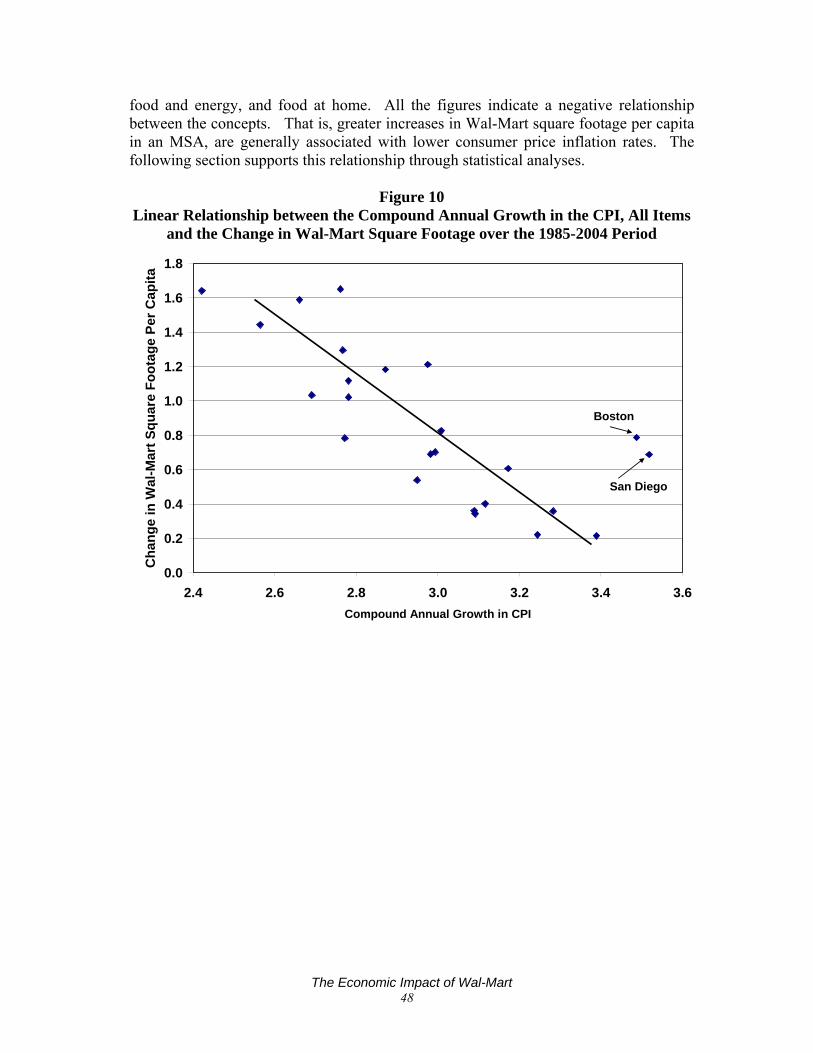
food and energy, and food at home. All the figures indicate a negative relationship between the concepts. That is, greater increases in Wal-Mart square footage per capita in an MSA, are generally associated with lower consumer price inflation rates. The following section supports this relationship through statistical analyses.
Figure 10 Linear Relationship between the Compound Annual Growth in the CPI, All Items
and the Change in Wal-Mart Square Footage over the 1985-2004 Period
0.0
0.2
0.4
0.6
0.8
1.0
1.2
1.4
1.6
1.8
2.4 2.6 2.8 3.0 3.2 3.4 3.6Compound Annual Growth in CPI
Cha
nge
in W
al-M
art S
quar
e Fo
otag
e Pe
r Cap
ita
Boston
San Diego
The Economic Impact of Wal-Mart 48
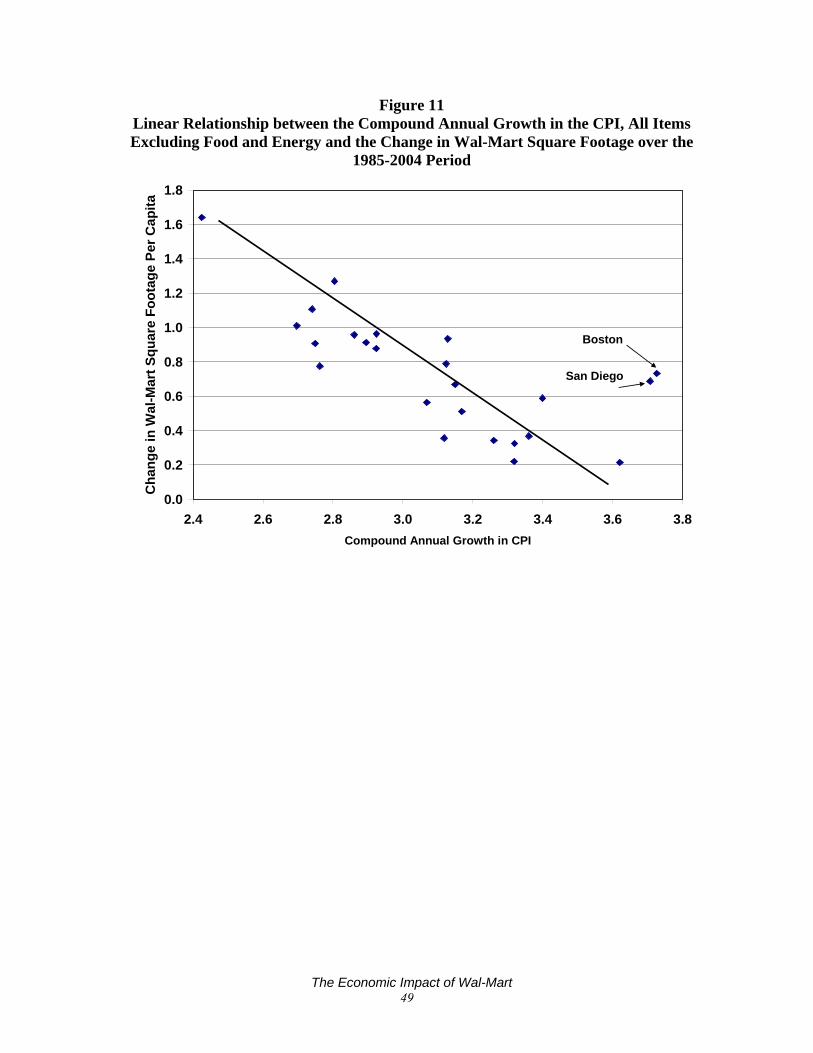
Figure 11 Linear Relationship between the Compound Annual Growth in the CPI, All Items Excluding Food and Energy and the Change in Wal-Mart Square Footage over the
1985-2004 Period
0.0
0.2
0.4
0.6
0.8
1.0
1.2
1.4
1.6
1.8
2.4 2.6 2.8 3.0 3.2 3.4 3.6 3Compound Annual Growth in CPI
Cha
nge
in W
al-M
art S
quar
e Fo
otag
e Pe
r Cap
ita
.8
San Diego
Boston
The Economic Impact of Wal-Mart 49
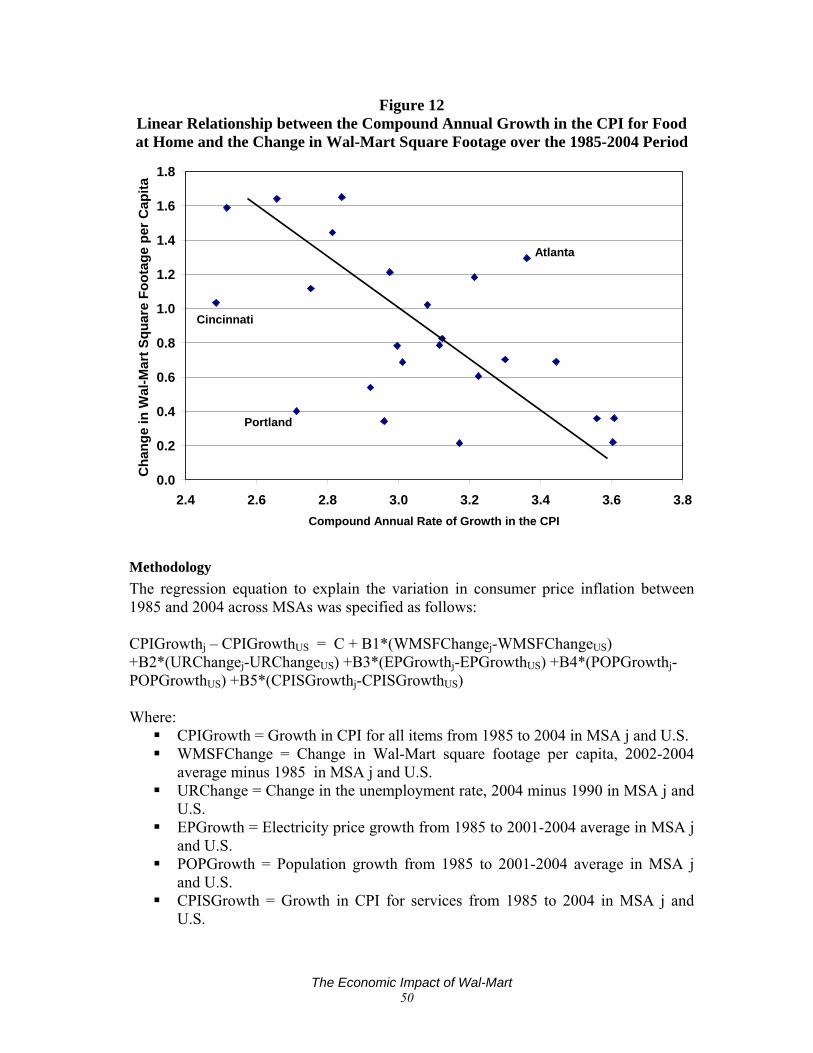
Figure 12 Linear Relationship between the Compound Annual Growth in the CPI for Food at Home and the Change in Wal-Mart Square Footage over the 1985-2004 Period
0.0
0.2
0.4
0.6
0.8
1.0
1.2
1.4
1.6
1.8
2.4 2.6 2.8 3.0 3.2 3.4 3.6 3Compound Annual Rate of Growth in the CPI
Cha
nge
in W
al-M
art S
quar
e Fo
otag
e pe
r Cap
ita
.8
Portland
Cincinnati
Atlanta
Methodology The regression equation to explain the variation in consumer price inflation between 1985 and 2004 across MSAs was specified as follows: CPIGrowthj – CPIGrowthUS = C + B1*(WMSFChangej-WMSFChangeUS) +B2*(URChangej-URChangeUS) +B3*(EPGrowthj-EPGrowthUS) +B4*(POPGrowthj-POPGrowthUS) +B5*(CPISGrowthj-CPISGrowthUS) Where:
CPIGrowth = Growth in CPI for all items from 1985 to 2004 in MSA j and U.S. WMSFChange = Change in Wal-Mart square footage per capita, 2002-2004
average minus 1985 in MSA j and U.S. URChange = Change in the unemployment rate, 2004 minus 1990 in MSA j and
U.S. EPGrowth = Electricity price growth from 1985 to 2001-2004 average in MSA j
and U.S. POPGrowth = Population growth from 1985 to 2001-2004 average in MSA j
and U.S. CPISGrowth = Growth in CPI for services from 1985 to 2004 in MSA j and
U.S.
The Economic Impact of Wal-Mart 50
Since the identical U.S. factors are subtracted from each MSA, the U.S. data can be collapsed into the constant term of the regression. CPIGrowthj = C' + B1*WMSFChangej +B2*URChangeij +B3*EPGrowthj +B4*POPGrowthj+B5*CPISGrowthj
Regression Results and Implications The regression results are presented in Table 12 for the CPI for all items before including the Wal-Mart effect. The coefficient associated with population growth by MSA was not significantly different from zero and was dropped from the regression. All other explanatory variables are significantly different from zero at the 5% level. Once differences in consumer service prices are accounted for, we are able to explain nearly 93% of the variation in consumer price inflation across the MSAs by considering the variation in unemployment rate changes and electricity price growth. Table 13 presents the same regression with the added variable – changes in Wal-Mart square footage per capita. The Wal-Mart effect is significant at the 5% level and increases the explanatory power of the regression to over 95%. The regression coefficients tell us that each 1% increase in consumer service inflation contributes 0.5% to consumer price inflation as measured by the CPI for all items. This compares with a relative importance of 0.6 for services in the CPI. Electricity is one of the services represented in the CPI for services. Our analysis shows an additional impact on consumer price inflation from growth in electricity prices. Each 1% increase in electricity prices adds another 0.08% to consumer price inflation. This additional impact suggests that changes in retailers' electricity prices are passed along to the consumers, giving electricity a larger weight than its relative importance in the services CPI. The regression also tells us that each one point increase in the unemployment rate lowers consumer price inflation 1.4%, and each unit increase in Wal-Mart square footage per capita lowers the CPI by 2.6%.
The Economic Impact of Wal-Mart 51
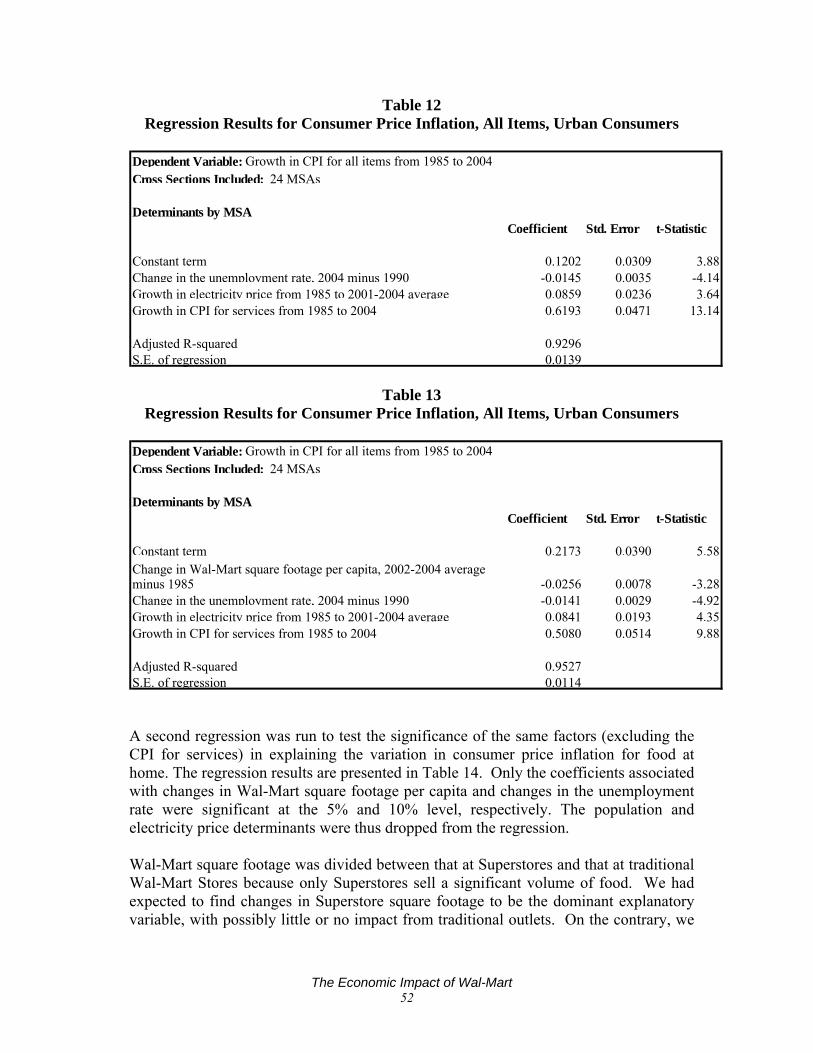
Table 12 Regression Results for Consumer Price Inflation, All Items, Urban Consumers
Cross Sections Included: 24 MSAs
Determinants by MSACoefficient Std. Error t-Statistic
Constant term 0.1202 0.0309 3.88Change in the unemployment rate, 2004 minus 1990 -0.0145 0.0035 -4.14Growth in electricity price from 1985 to 2001-2004 average 0.0859 0.0236 3.64Growth in CPI for services from 1985 to 2004 0.6193 0.0471 13.14
Adjusted R-squared 0.9296S.E. of regression 0.0139
Dependent Variable: Growth in CPI for all items from 1985 to 2004
Table 13
Regression Results for Consumer Price Inflation, All Items, Urban Consumers
Cross Sections Included: 24 MSAs
Determinants by MSACoefficient Std. Error t-Statistic
Constant term 0.2173 0.0390 5.58Change in Wal-Mart square footage per capita, 2002-2004 average minus 1985 -0.0256 0.0078 -3.28Change in the unemployment rate, 2004 minus 1990 -0.0141 0.0029 -4.92Growth in electricity price from 1985 to 2001-2004 average 0.0841 0.0193 4.35Growth in CPI for services from 1985 to 2004 0.5080 0.0514 9.88
Adjusted R-squared 0.9527S.E. of regression 0.0114
Dependent Variable: Growth in CPI for all items from 1985 to 2004
A second regression was run to test the significance of the same factors (excluding the CPI for services) in explaining the variation in consumer price inflation for food at home. The regression results are presented in Table 14. Only the coefficients associated with changes in Wal-Mart square footage per capita and changes in the unemployment rate were significant at the 5% and 10% level, respectively. The population and electricity price determinants were thus dropped from the regression. Wal-Mart square footage was divided between that at Superstores and that at traditional Wal-Mart Stores because only Superstores sell a significant volume of food. We had expected to find changes in Superstore square footage to be the dominant explanatory variable, with possibly little or no impact from traditional outlets. On the contrary, we
The Economic Impact of Wal-Mart 52
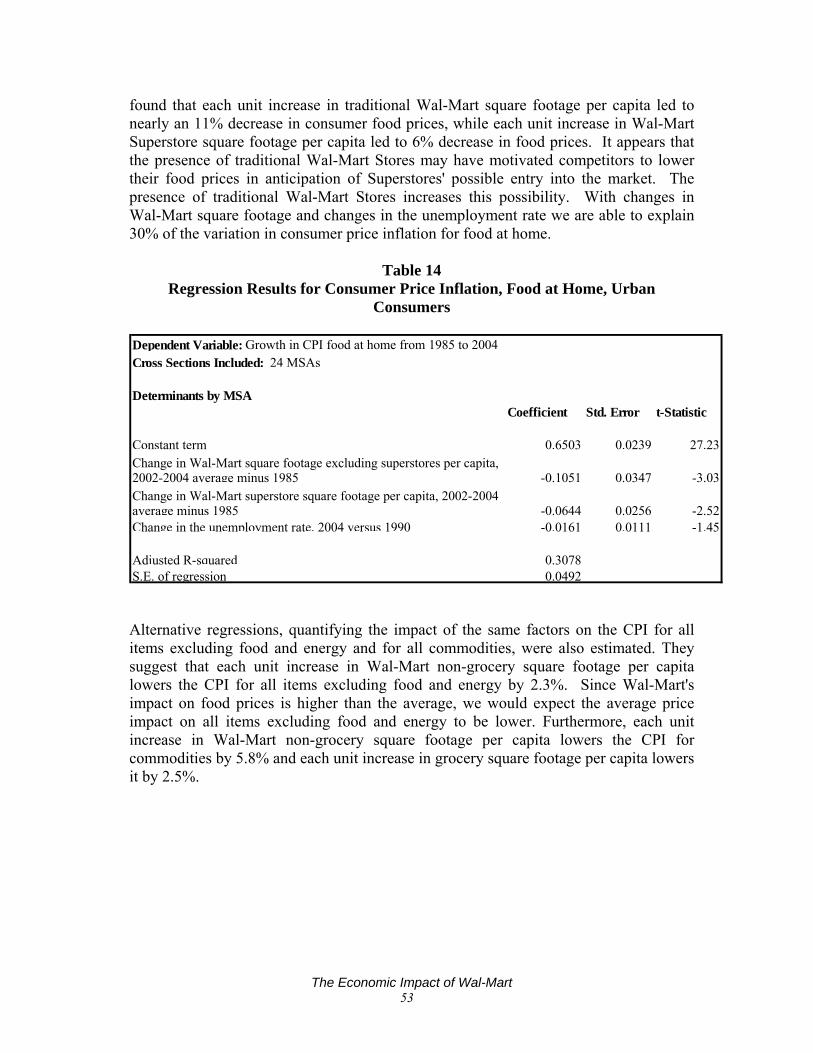
found that each unit increase in traditional Wal-Mart square footage per capita led to nearly an 11% decrease in consumer food prices, while each unit increase in Wal-Mart Superstore square footage per capita led to 6% decrease in food prices. It appears that the presence of traditional Wal-Mart Stores may have motivated competitors to lower their food prices in anticipation of Superstores' possible entry into the market. The presence of traditional Wal-Mart Stores increases this possibility. With changes in Wal-Mart square footage and changes in the unemployment rate we are able to explain 30% of the variation in consumer price inflation for food at home.
Table 14 Regression Results for Consumer Price Inflation, Food at Home, Urban
Consumers
Cross Sections Included: 24 MSAs
Determinants by MSACoefficient Std. Error t-Statistic
Constant term 0.6503 0.0239 27.23Change in Wal-Mart square footage excluding superstores per capita, 2002-2004 average minus 1985 -0.1051 0.0347 -3.03Change in Wal-Mart superstore square footage per capita, 2002-2004 average minus 1985 -0.0644 0.0256 -2.52Change in the unemployment rate, 2004 versus 1990 -0.0161 0.0111 -1.45
Adjusted R-squared 0.3078S.E. of regression 0.0492
Dependent Variable: Growth in CPI food at home from 1985 to 2004
Alternative regressions, quantifying the impact of the same factors on the CPI for all items excluding food and energy and for all commodities, were also estimated. They suggest that each unit increase in Wal-Mart non-grocery square footage per capita lowers the CPI for all items excluding food and energy by 2.3%. Since Wal-Mart's impact on food prices is higher than the average, we would expect the average price impact on all items excluding food and energy to be lower. Furthermore, each unit increase in Wal-Mart non-grocery square footage per capita lowers the CPI for commodities by 5.8% and each unit increase in grocery square footage per capita lowers it by 2.5%.
The Economic Impact of Wal-Mart 53
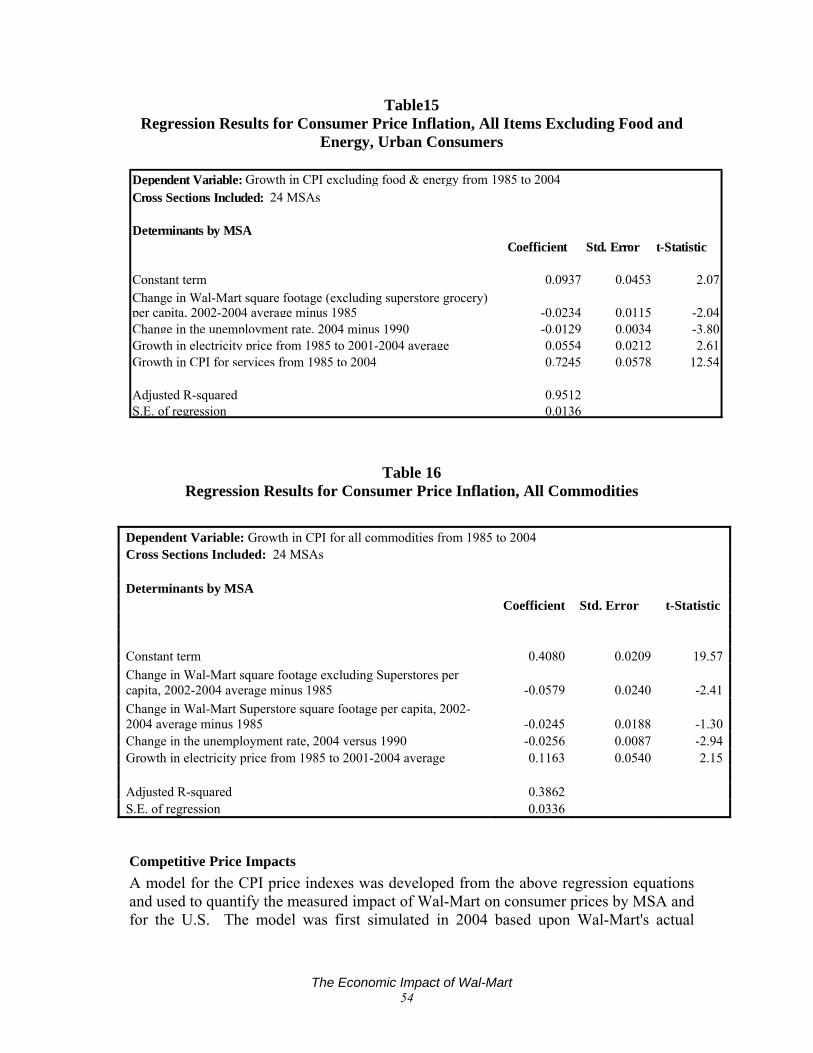
Table15 Regression Results for Consumer Price Inflation, All Items Excluding Food and
Energy, Urban Consumers
Cross Sections Included: 24 MSAs
Determinants by MSACoefficient Std. Error t-Statistic
Constant term 0.0937 0.0453 2.07Change in Wal-Mart square footage (excluding superstore grocery) per capita, 2002-2004 average minus 1985 -0.0234 0.0115 -2.04Change in the unemployment rate, 2004 minus 1990 -0.0129 0.0034 -3.80Growth in electricity price from 1985 to 2001-2004 average 0.0554 0.0212 2.61Growth in CPI for services from 1985 to 2004 0.7245 0.0578 12.54
Adjusted R-squared 0.9512S.E. of regression 0.0136
Dependent Variable: Growth in CPI excluding food & energy from 1985 to 2004
Table 16 Regression Results for Consumer Price Inflation, All Commodities
Dependent Variable: Growth in CPI for all commodities from 1985 to 2004 Cross Sections Included: 24 MSAs Determinants by MSA Coefficient Std. Error t-Statistic Constant term 0.4080 0.0209 19.57Change in Wal-Mart square footage excluding Superstores per capita, 2002-2004 average minus 1985 -0.0579 0.0240 -2.41Change in Wal-Mart Superstore square footage per capita, 2002-2004 average minus 1985 -0.0245 0.0188 -1.30Change in the unemployment rate, 2004 versus 1990 -0.0256 0.0087 -2.94Growth in electricity price from 1985 to 2001-2004 average 0.1163 0.0540 2.15 Adjusted R-squared 0.3862 S.E. of regression 0.0336
Competitive Price Impacts A model for the CPI price indexes was developed from the above regression equations and used to quantify the measured impact of Wal-Mart on consumer prices by MSA and for the U.S. The model was first simulated in 2004 based upon Wal-Mart's actual
The Economic Impact of Wal-Mart 54
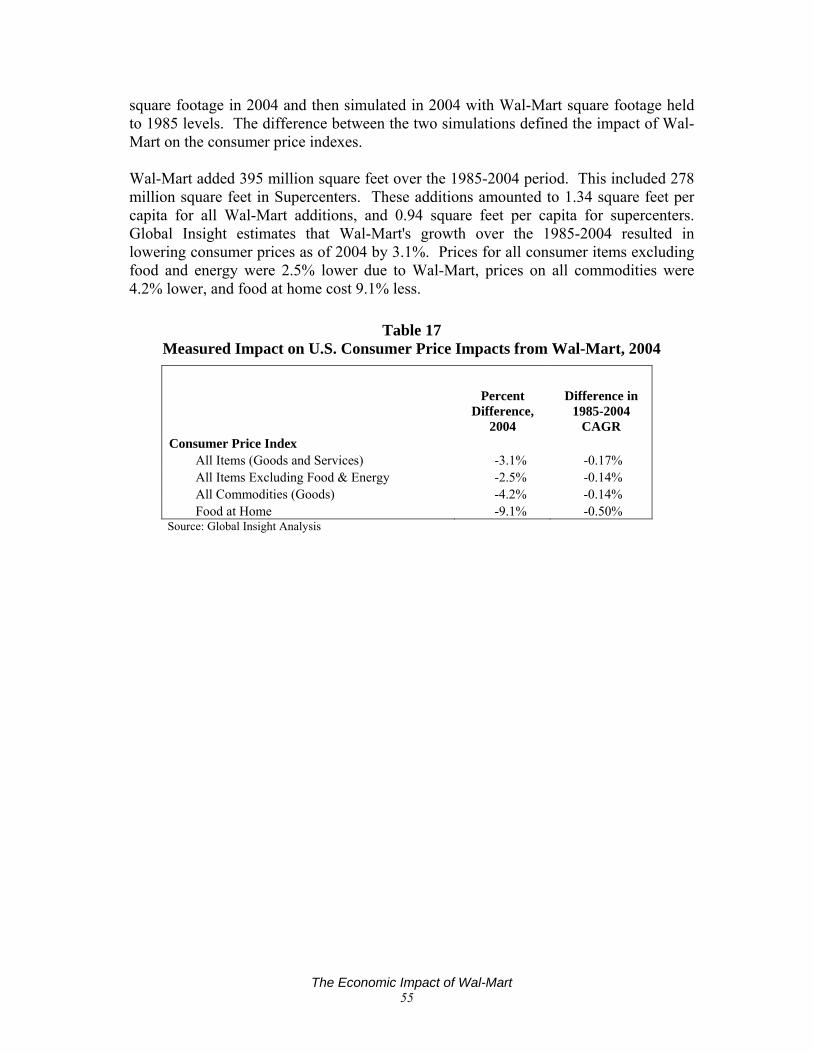
square footage in 2004 and then simulated in 2004 with Wal-Mart square footage held to 1985 levels. The difference between the two simulations defined the impact of Wal-Mart on the consumer price indexes. Wal-Mart added 395 million square feet over the 1985-2004 period. This included 278 million square feet in Supercenters. These additions amounted to 1.34 square feet per capita for all Wal-Mart additions, and 0.94 square feet per capita for supercenters. Global Insight estimates that Wal-Mart's growth over the 1985-2004 resulted in lowering consumer prices as of 2004 by 3.1%. Prices for all consumer items excluding food and energy were 2.5% lower due to Wal-Mart, prices on all commodities were 4.2% lower, and food at home cost 9.1% less.
Table 17 Measured Impact on U.S. Consumer Price Impacts from Wal-Mart, 2004
Percent Difference,
2004
Difference in 1985-2004
CAGR Consumer Price Index
All Items (Goods and Services) -3.1% -0.17% All Items Excluding Food & Energy -2.5% -0.14% All Commodities (Goods) -4.2% -0.14% Food at Home -9.1% -0.50%
Source: Global Insight Analysis
The Economic Impact of Wal-Mart 55
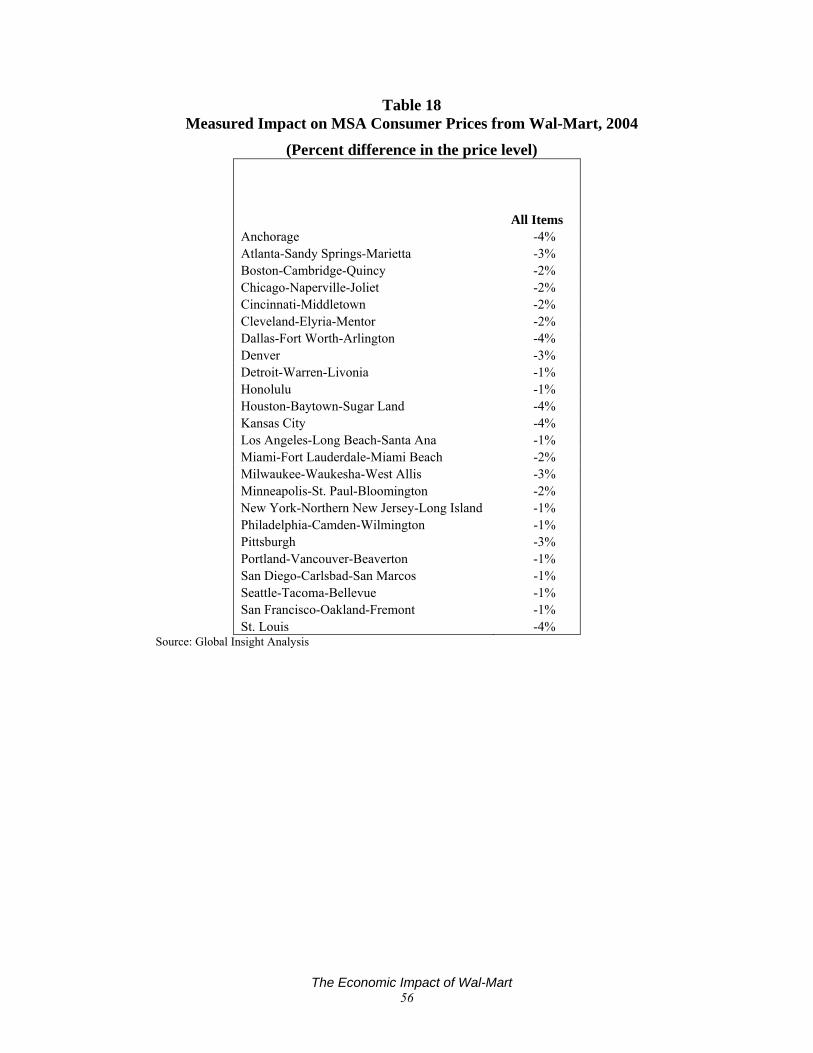
Table 18 Measured Impact on MSA Consumer Prices from Wal-Mart, 2004
(Percent difference in the price level)
All Items Anchorage -4% Atlanta-Sandy Springs-Marietta -3% Boston-Cambridge-Quincy -2% Chicago-Naperville-Joliet -2% Cincinnati-Middletown -2% Cleveland-Elyria-Mentor -2% Dallas-Fort Worth-Arlington -4% Denver -3% Detroit-Warren-Livonia -1% Honolulu -1% Houston-Baytown-Sugar Land -4% Kansas City -4% Los Angeles-Long Beach-Santa Ana -1% Miami-Fort Lauderdale-Miami Beach -2% Milwaukee-Waukesha-West Allis -3% Minneapolis-St. Paul-Bloomington -2% New York-Northern New Jersey-Long Island -1% Philadelphia-Camden-Wilmington -1% Pittsburgh -3% Portland-Vancouver-Beaverton -1% San Diego-Carlsbad-San Marcos -1% Seattle-Tacoma-Bellevue -1% San Francisco-Oakland-Fremont -1% St. Louis -4%
Source: Global Insight Analysis
The Economic Impact of Wal-Mart 56
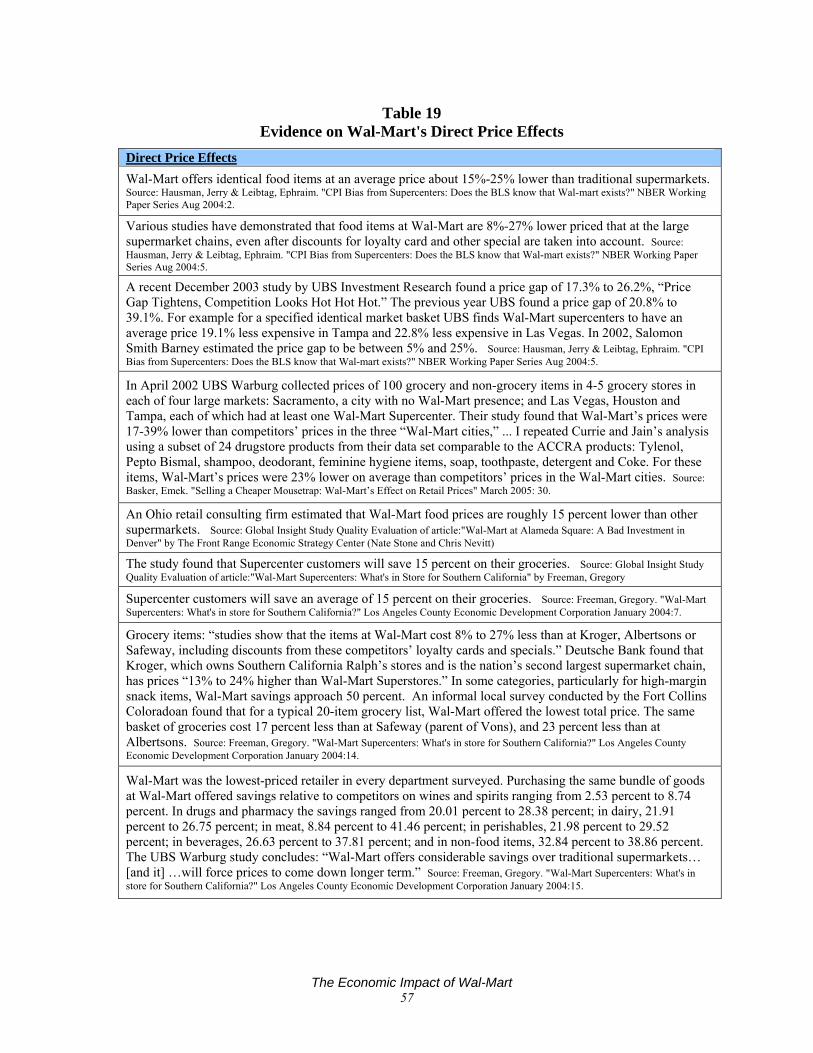
Table 19 Evidence on Wal-Mart's Direct Price Effects
Direct Price Effects Wal-Mart offers identical food items at an average price about 15%-25% lower than traditional supermarkets. Source: Hausman, Jerry & Leibtag, Ephraim. "CPI Bias from Supercenters: Does the BLS know that Wal-mart exists?" NBER Working Paper Series Aug 2004:2.
Various studies have demonstrated that food items at Wal-Mart are 8%-27% lower priced that at the large supermarket chains, even after discounts for loyalty card and other special are taken into account. Source: Hausman, Jerry & Leibtag, Ephraim. "CPI Bias from Supercenters: Does the BLS know that Wal-mart exists?" NBER Working Paper Series Aug 2004:5. A recent December 2003 study by UBS Investment Research found a price gap of 17.3% to 26.2%, “Price Gap Tightens, Competition Looks Hot Hot Hot.” The previous year UBS found a price gap of 20.8% to 39.1%. For example for a specified identical market basket UBS finds Wal-Mart supercenters to have an average price 19.1% less expensive in Tampa and 22.8% less expensive in Las Vegas. In 2002, Salomon Smith Barney estimated the price gap to be between 5% and 25%. Source: Hausman, Jerry & Leibtag, Ephraim. "CPI Bias from Supercenters: Does the BLS know that Wal-mart exists?" NBER Working Paper Series Aug 2004:5.
In April 2002 UBS Warburg collected prices of 100 grocery and non-grocery items in 4-5 grocery stores in each of four large markets: Sacramento, a city with no Wal-Mart presence; and Las Vegas, Houston and Tampa, each of which had at least one Wal-Mart Supercenter. Their study found that Wal-Mart’s prices were 17-39% lower than competitors’ prices in the three “Wal-Mart cities,” ... I repeated Currie and Jain’s analysis using a subset of 24 drugstore products from their data set comparable to the ACCRA products: Tylenol, Pepto Bismal, shampoo, deodorant, feminine hygiene items, soap, toothpaste, detergent and Coke. For these items, Wal-Mart’s prices were 23% lower on average than competitors’ prices in the Wal-Mart cities. Source: Basker, Emek. "Selling a Cheaper Mousetrap: Wal-Mart’s Effect on Retail Prices" March 2005: 30.
An Ohio retail consulting firm estimated that Wal-Mart food prices are roughly 15 percent lower than other supermarkets. Source: Global Insight Study Quality Evaluation of article:"Wal-Mart at Alameda Square: A Bad Investment in Denver" by The Front Range Economic Strategy Center (Nate Stone and Chris Nevitt) The study found that Supercenter customers will save 15 percent on their groceries. Source: Global Insight Study Quality Evaluation of article:"Wal-Mart Supercenters: What's in Store for Southern California" by Freeman, Gregory
Supercenter customers will save an average of 15 percent on their groceries. Source: Freeman, Gregory. "Wal-Mart Supercenters: What's in store for Southern California?" Los Angeles County Economic Development Corporation January 2004:7.
Grocery items: “studies show that the items at Wal-Mart cost 8% to 27% less than at Kroger, Albertsons or Safeway, including discounts from these competitors’ loyalty cards and specials.” Deutsche Bank found that Kroger, which owns Southern California Ralph’s stores and is the nation’s second largest supermarket chain, has prices “13% to 24% higher than Wal-Mart Superstores.” In some categories, particularly for high-margin snack items, Wal-Mart savings approach 50 percent. An informal local survey conducted by the Fort Collins Coloradoan found that for a typical 20-item grocery list, Wal-Mart offered the lowest total price. The same basket of groceries cost 17 percent less than at Safeway (parent of Vons), and 23 percent less than at Albertsons. Source: Freeman, Gregory. "Wal-Mart Supercenters: What's in store for Southern California?" Los Angeles County Economic Development Corporation January 2004:14.
Wal-Mart was the lowest-priced retailer in every department surveyed. Purchasing the same bundle of goods at Wal-Mart offered savings relative to competitors on wines and spirits ranging from 2.53 percent to 8.74 percent. In drugs and pharmacy the savings ranged from 20.01 percent to 28.38 percent; in dairy, 21.91 percent to 26.75 percent; in meat, 8.84 percent to 41.46 percent; in perishables, 21.98 percent to 29.52 percent; in beverages, 26.63 percent to 37.81 percent; and in non-food items, 32.84 percent to 38.86 percent. The UBS Warburg study concludes: “Wal-Mart offers considerable savings over traditional supermarkets… [and it] …will force prices to come down longer term.” Source: Freeman, Gregory. "Wal-Mart Supercenters: What's in store for Southern California?" Los Angeles County Economic Development Corporation January 2004:15.
The Economic Impact of Wal-Mart 57
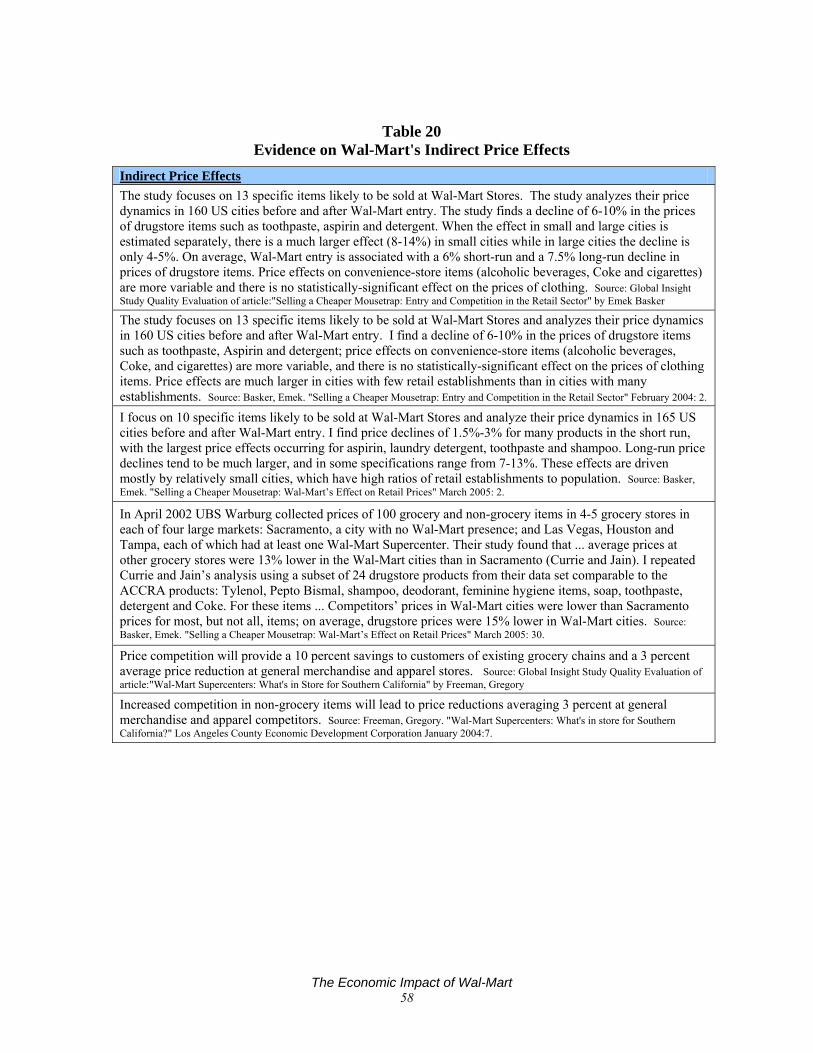
Table 20 Evidence on Wal-Mart's Indirect Price Effects
Indirect Price Effects The study focuses on 13 specific items likely to be sold at Wal-Mart Stores. The study analyzes their price dynamics in 160 US cities before and after Wal-Mart entry. The study finds a decline of 6-10% in the prices of drugstore items such as toothpaste, aspirin and detergent. When the effect in small and large cities is estimated separately, there is a much larger effect (8-14%) in small cities while in large cities the decline is only 4-5%. On average, Wal-Mart entry is associated with a 6% short-run and a 7.5% long-run decline in prices of drugstore items. Price effects on convenience-store items (alcoholic beverages, Coke and cigarettes) are more variable and there is no statistically-significant effect on the prices of clothing. Source: Global Insight Study Quality Evaluation of article:"Selling a Cheaper Mousetrap: Entry and Competition in the Retail Sector" by Emek Basker The study focuses on 13 specific items likely to be sold at Wal-Mart Stores and analyzes their price dynamics in 160 US cities before and after Wal-Mart entry. I find a decline of 6-10% in the prices of drugstore items such as toothpaste, Aspirin and detergent; price effects on convenience-store items (alcoholic beverages, Coke, and cigarettes) are more variable, and there is no statistically-significant effect on the prices of clothing items. Price effects are much larger in cities with few retail establishments than in cities with many establishments. Source: Basker, Emek. "Selling a Cheaper Mousetrap: Entry and Competition in the Retail Sector" February 2004: 2. I focus on 10 specific items likely to be sold at Wal-Mart Stores and analyze their price dynamics in 165 US cities before and after Wal-Mart entry. I find price declines of 1.5%-3% for many products in the short run, with the largest price effects occurring for aspirin, laundry detergent, toothpaste and shampoo. Long-run price declines tend to be much larger, and in some specifications range from 7-13%. These effects are driven mostly by relatively small cities, which have high ratios of retail establishments to population. Source: Basker, Emek. "Selling a Cheaper Mousetrap: Wal-Mart’s Effect on Retail Prices" March 2005: 2.
In April 2002 UBS Warburg collected prices of 100 grocery and non-grocery items in 4-5 grocery stores in each of four large markets: Sacramento, a city with no Wal-Mart presence; and Las Vegas, Houston and Tampa, each of which had at least one Wal-Mart Supercenter. Their study found that ... average prices at other grocery stores were 13% lower in the Wal-Mart cities than in Sacramento (Currie and Jain). I repeated Currie and Jain’s analysis using a subset of 24 drugstore products from their data set comparable to the ACCRA products: Tylenol, Pepto Bismal, shampoo, deodorant, feminine hygiene items, soap, toothpaste, detergent and Coke. For these items ... Competitors’ prices in Wal-Mart cities were lower than Sacramento prices for most, but not all, items; on average, drugstore prices were 15% lower in Wal-Mart cities. Source: Basker, Emek. "Selling a Cheaper Mousetrap: Wal-Mart’s Effect on Retail Prices" March 2005: 30.
Price competition will provide a 10 percent savings to customers of existing grocery chains and a 3 percent average price reduction at general merchandise and apparel stores. Source: Global Insight Study Quality Evaluation of article:"Wal-Mart Supercenters: What's in Store for Southern California" by Freeman, Gregory Increased competition in non-grocery items will lead to price reductions averaging 3 percent at general merchandise and apparel competitors. Source: Freeman, Gregory. "Wal-Mart Supercenters: What's in store for Southern California?" Los Angeles County Economic Development Corporation January 2004:7.
The Economic Impact of Wal-Mart 58

Appendix B. County Level Detail County Business Patterns is an annual series that provides subnational economic data by industry. The series is useful for studying the economic activity of small areas; analyzing economic changes over time; and as a benchmark for statistical series, surveys, and databases between economic censuses. Businesses use the data for analyzing market potential, measuring the effectiveness of sales and advertising programs, setting sales quotas, and developing budgets. Government agencies use the data for administration and planning. County Business Patterns covers most of the country's economic activity. The series excludes data on self-employed individuals, employees of private households, railroad employees, agricultural production employees, and most government employees. The County Business Patterns program has been tabulated on a North American Industry Classification System (NAICS) basis since 1998. Data for 1997 and earlier years are based on the Standard Industrial Classification (SIC) System. This series has been published annually since 1964 and at irregular intervals dating back to 1946. The comparability of data over time may be affected by definitional changes in establishments, activity status, and industrial classifications.29
29 http://www.census.gov/epcd/cbp/view/cbpview.html
The Economic Impact of Wal-Mart 59
Appendix C. Determining Regional Economic Impacts of Wal-Mart Stores This section presents a general method for estimating the regional economic impacts produced by the presence of Wal-Mart stores, and related facilities such as distribution centers, in a Metropolitan Statistical Area (MSA). Global Insight used this approach to estimate the economic impacts of Wal-Mart on the Dallas-Fort Worth-Arlington MSA, and its existing economic models for the U.S., Texas, and Dallas-Fort Worth-Arlington MSA economies. We will identify the types of data needed to conduct an impact assessment, identify the important economic indicators, and also present some material applicable to the use of the other methods such as input/output (I/O) models.
Identify the Study Area The first step in assessing Wal-Mart impacts is to define the study area, which will consist of the host county, and the adjacent counties where: 1) most of the shoppers will come from; and 2) Wal-Mart employees will reside. Since one of the primary benefits from Wal-Mart is generated by its lower prices, there is a major advantage to using one of the 24 MSAs for which Consumer Price Index (CPI) data has been published for at least 10 years. Based on the criteria used to define them, MSAs are integrated market areas that make excellent study areas. Finally, there is more detailed, and more current, economic data available at a higher frequency (i.e., monthly and quarterly as opposed to annually) published for MSAs than for counties, which enables more detailed and more accurate impact assessments to be performed at the MSA level.
Describe the Direct Economic Effects The next step in the analysis is to measure the direct economic effects in both absolute and relative terms in the study area, and to show how they have changed over time. The direct effects generated by Wal-Mart include:
The number of stores and other facilities such as distribution centers Annual sales at all stores; if a detailed I/O model such as IMPLAN or RIMS II
will be used, the annual sales should be disaggregated by major merchandise category.
The number of employees at all stores and facilities, disaggregated by full-time and part-time workers.
Total wage and salary earnings of all employees. The value and types of local purchases of goods and services made from within
the study area needed to maintain stores (e.g., utility costs, maintenance and transportation contracts, etc.)
The cost of goods sold, and if possible, the value of wholesale purchases made from suppliers located in the study area. Output from a local manufacturer who
The Economic Impact of Wal-Mart 60
is a Wal-Mart supplier will be sold at many stores, and will not necessarily be concentrated in the stores in the study area.
The information listed above should be obtained for at least 10 years for several reasons: 1) to show how Wal-Mart’s share of MSA economic activity have changed over time; and 2) provide the times series data needed if an econometric approach will be used and equations have to be estimated. Next, Wal-Mart’s percent shares of MSA retail sales, total employment, and retail sector employment should be estimated over the time period to capture the trends, and the shares should be compared to those for the host state and US economies to determine the extent to which Wal-Mart’s presence in the study area is greater than or lesser than its presence in the state and U.S. economies.
Measure Direct Price Effects In addition to the direct economic effects listed above, a major economic benefit of Wal-Mart in an MSA will be generated by the lower prices it provides, which in turn reduces inflation as reflected in a lower CPI, increases disposable income and wages in real terms, and frees up disposable income to be spent on other locally produced goods and services. This suggests that a major step in any regional impact study is to calculate the reduction in retail prices that can be attributed to Wal-Mart. Because Global Insight had existing economic models for the U.S. and the 24 MSAs with sufficient CPI data, we used a statistical analysis to estimate the percent reduction in the Dallas-Fort Worth-Arlington CPI in 2004. As noted above, Global Insight determined that the level of CPI in the Dallas MSA in 2004 was 4% lower due to the presence of Wal-Mart. If an econometric approach is not feasible, the reduction in prices will have to be estimated using local survey data that track the trends in price levels for key goods from the time that Wal-Mart started to become a significant presence in the study area.
Estimate the Total Economic Impacts Once the direct economic effects have been described, including the price effects, they need to be introduced into an economic model to determine the total, net economic impacts in the study area. Global Insight used the results of our U.S. level analysis, along with revisions to our Dallas MSA model designed to fully capture the direct economic effects, to estimate the total economic impacts in the MSA. The direct effects, notably employment by sector, local purchases for store operation, local payments of wages and salaries, and if known, local purchases from suppliers, can also be entered into the appropriate final demand sectors if an I/O model such as IMPLAN is being used. Based on our experience in performing the analysis of the Dallas-Fort Worth-Arlington MSAs, the following factors are likely to be the major determinants of the level and composition of the economic impacts of Wal-Mart on a metropolitan economy:
The absolute levels and shares of Wal-Mart’s direct economic activity in the study area, including total employment, number of stores and other facilities; total retail sales, the level of wages, and total wages and salaries paid.
The Economic Impact of Wal-Mart 61
The value of local purchases made to operate the Wal-Mart stores and facilities such as utilities and business services.
The value of goods sold by local manufacturers to Wal-Mart The types of Wal-Mart facilities present within the MSA, while the price effects
from retail stores can be significant, other facilities such as distribution centers can also have positive economic impacts.
The length of time that Wal-Mart has been a significant presence in a metropolitan economy, in large part because the price effects of Wal-Mart are cumulative over time and it takes a number of year’s worth of data to capture the full effects.
The income levels of the residents, and the extent to which they will benefit from the lower prices offered by Wal-Mart.
The level of competition from other big-box retailers such as Target, Costco, and Home Depot. This includes whether a Wal-Mart store is one of the first large retailers in a county and also if it is sited so as to attract shoppers from adjacent counties. In this instance, the Wal-Mart store, in the short-run, acts as an “export” retailer.
The Economic Impact of Wal-Mart 62


