Virtual Reality (1995) Vot. 1, No. 1, 3-16 3
HUMAN FACTORS
The Effect of Update Rate on the Sense of Presence within Virtual Environments
Woodrow Barfield and Claudia Hendrix
Sensory Engineering Laboratory Department of lndustn'al Engineering, FU-20 University of Washington Seattle, WA 98195, USA
Keywords: immersion, presence, update rate, virtual environments
Abstract: The current study was done to investigate the effect of varying the update rate of a computer-generated simulation (5, 10, 15, 20, 25 Hz) on the sense of presence within stereoscopic virtual environ- ments. Thirteen subjects navigated a virtual representation of Stone- henge and were asked to search for a rune, inscribed upon the wall of one of Stonehenge's edifices. After performing the search task, subjects completed a questionnaire designed to assess their level of presence within the virtual environment. The results indicated that the subjective report of presence within the virtual environment was significantly less using an update rate of 5 and 10 Hz when compared to update rates of 20 and 25 Hz. Furthermore, the reported level of presence using a 15 Hz update rate was similar to the reported level of presence using update rates of 20 and 25 Hz thus indicating that computational resources could be saved using a slower update rate while maintaining a given level of presence. In addition, a factor analysis procedure indicated that the 13 questions designed to assess the subjects sense of presence within virtual Stonehenge could be grouped into three factors: (1) virtual presence, (2) navigation within the virtual environment, and (3) knowl- edge of real world surroundings while in the virtual world. Finally, comments on a descriptive model of presence within virtual environ- ments are presented.
1 Introduction
One aspect of experiencing a virtual environment simulation is that the participants feel as if they are actually present in the environment generated by the computer, this experience is commonly referred to as virtual presence (Sheridan, t 992b; Barfield, Sheridan, Zeltzer, and Slater, 1995). In the case of teleopera- tion, the participants feel as if they are actually p r e s - ent in a remote environment, this experience is com- monly referred to as telepresence. According to Slater and Usoh (1993) virtual presence occurs when one feels that he/she inhabits a world other than the one in which their real body is located. In this case, sensory information to the participant within the virtual environment is based on input from computer- ~generated displays. Furthermore, according to Sheri- dan (1992a, b) telepresence occurs when one feels that he/she inhabits a remote actual environment based on input received from displays. ~ Note that the characteri- zation of virtual presence proposed by Slater and Usoh and telepresence by Sheridan imply a sensory
presence in an environment other than the one within which they are physically present, thus in a previous paper Hendrix and Barfield (1995a) categorized both virtual presence and telepresence as "ego-presence". That is, ego-presence occurs when, based on com- puter-generated input, the participant believes that he/she inhabits the virtual world as place. Ego- presence is enhanced to the degree that the spatial information within the virtual world is transformed in a similar manner to how spatial information in the real world is transformed as one moves through it. In contrast, "object presence" can be thought of as occurring when one experiences a virtual object projected into the real world, such an application is represented by augmented reality (Barfield, Rosen- berg, and Lotens, 1995).
Of interest to the research community is to deter- mine which factors lead to the sense of presence within a virtual environment. This is an important goal for virtual world designers for several reasons. First, not all applications using virtual environments will require the highest level of presence. For
@ Virtual Press
4 Woodrow Barfield and-Claudia Hendrix
example, when controlling a remote manipulator performing a physically demanding task, certainly one would not want all the forces experienced by the robot to be transferred back to the human (Zeltzer, 1992). In this case, a high level of kinesthetic feedback might be unrealistic and thus would detract from presence. In addition, knowing which factors con- tribute to or detract from presence will tell designers how to allocate computational resources when build- ing virtual worlds. For example, if an update rate of t0 Hz is sufficient to maintain the desired level of presence, then allocating computational resources to maintain an update rate of 30 Hz or higher would be wasted and could be used for other tasks. This last point illustrates that there will be tradeoffs to consider when designing virtual worlds, and how these trade- otis affect the sense of presence within virtual envi- ronments is an important topic for investigation. For example, with current helmet mounted displays (HMDs) there is a tradeoff between resolution and field of view (FOV). The general case is that higher resolution is achieved at the expense of a wider FOV. Thus, for this case, it is important to determine what combination of FOV and resolution is sufficient to maintain a given level of presence and a given level of performance within virtual environments.
This paper first discusses display factors which we propose affect the sense of presence within virtual environments, this discussion is followed by the results of an exploratory study which examined the relationship between five update rates (i.e., speed of the simulation) and the subjective report of presence within virtual environments. Finally, in the last section of the paper, comments on a descriptive model of presence within virtual environments are presented.
2 Display variables and Virtual Presence
Several researchers have shown that the display variables which are used to design the virtual envi- ronment influence the sense of presence within that environment (Barfield and Weghorst, 1993; Barfield, Sheridan, Zeltzer and Slater, 1995; Hendrix and Barfield, 1995b). These variables include whether the visual scene is monoscopic or stereoscopic, the reso- lution of the display, the field of view, the update rate, and other display variables. Recently, Hendrix and Barfield (1995a) performed several studies to deter- mine the relationship between display variables and the sense of presence within virtual environments. Specifically, they investigated whether monoscopic versus stereoscopic cues, the geometric field of view (GFOV) used to design the visual display (scene magnification or minification), and the presence or absence of head tracking influenced the sense of presence within virtual environments. They found that presence within a virtual environment was highly correlated with two factors: (1) the spatial realism of the virtual environment as opposed to the
"photorealism" of the visual scene, and (2) the fidelity of the interaction between the virtual environment participant and the virtual world. An example of the latter point is allowing the virtual environment par- ticipant to grasp a virtual object with his hands (e.g., using a dataglove) compared to manipulating an object using a joystick.
Furthermore, Barfield and Weghorst (1993) and Slater and Usoh (1994) have postulated that both display factors and subject factors influence the sense of presence within virtual environments. Specifically, Slater and Usoh suggested that presence is related to what they termed "external" and "internal" factors. External factors are those that result from the tech- nology which is used to create the virtual environment experience. As noted above, such factors include hardware components, peripherals, and the software and models used to create the virtual environment. In contrast, internal factors are those which are typically termed subject variables. These include whether the person has the physical capability for binocular vision, and various psychological aspects of the virtual environment participant, such as their prefer- ence for processing sensory data. For the latter point, using a questionnaire designed to measure presence as the response variable, Slater and Usoh (1994) found a strong positive and significant correlation between presence and the participant's preference for sensory information processing. For example, when the virtual environment was primarily visual, the higher the visual score the higher the presence, and the higher the auditory score the lower the presence.
3 Speed of the simulation
One variable not manipulated in previous studies focusing on display variables and presence, is the update rate of the simulation. The update rate is the rate at which new images are presented to the viewer, whereas the refresh rate is the number of times per second that an image is redrawn, it is typically 60 per second or higher for raster displays (Foley et al., 1994). As an example of the update rate, if the work- station uses a refresh rate of 60 Hz, but updates the scene at only 4 Hz, then the system will present 15 consecutive identical images of a scene before the elements in the scene change. Thus, this system would present only four new images to the viewer each second. One aspect of slow update rates is that com- puter-generated worlds do not appear to move smoothly in response to the viewer's head movements. This leads to perceptual distortions that impair the viewer's ability to use motion parallax as a depth cue and to discriminate self movement from object move- ment (Piantanida, Boman, and Gille, 1992). The update rate is controlled by two variables: (I) the computational time necessary to update or modify the displayed image (McKenna and Zeltzer, 1992), this is referred to as computational delay, and (2) the time
The Effect of Update Rate on the Sense of Presence within VEs 5
required for the sensor system to determine that the viewer has made a movement that requires updating the display (Piantanida, Boman, and Gille, 1992), this is referred to as sensor delay.
In computer graphics, a general rule of thumb says that when the update rate drops below about 10-15 Hz, motion will appear discontinuous and become distracting (McKenna and Zeltzer, 1992). Similar observations were made by Airey, Rohlf, and Brooks (1990) who observed that update rates of 20 Hz resulted in realistic levels of interaction, at 6 Hz were just beginning to be acceptable, while update rates of 1 Hz were totally unacceptable in terms of navigating a virtual building. Furthermore, the update rate has been shown to influence the performance of tracking tasks (Tharp, Liu, French and Stark, 1992; Lampton, Knerr, and Goldberg, 1994). For example, Tharp et al., found that tracking performance decreased as the update rate decreased. Their results indicated that for manual tracking experienced subjects required an update rate of only 2 Hz and inexperienced subjects required an update rate of 10 Hz. They also found that increasing the update rate beyond 10 Hz produced only a small increase in performance.
To summarize, the relationship between the update rate and presence within virtual environments has not been evaluated in previous studies. Since the attain- ment of presence is considered a desirable outcome for virtual environment participants, it was of interest in the current study to determine whether the sense of presence within a virtual environment was affected by the update rate and whether a similar plateau in performance found for manual tracking would also occur for presence. Based on the results of Tharp, Liu, French and Stark (1992) using manual tracking as the experiment task, it was predicted that there would be no additional increase in presence within the virtual environment using an update rate faster than 10-15 Hz. If so, such a finding would indicate that a given level of presence could be obtained for less computa- tional resources, allowing computational resources to be used to create a more complex scene or possibly to allow more realistic interaction to occur between the user and objects within the virtual environment.
4 Framework for the study
4.1 Methodology
There were five update rates used in the study which consisted of 5, 10, 15, 20 and 25 Hz. In order to control the update rate of the simulation, a function was written to increase the number of calculations required to render and display the images. First, the number of times it took to run 500,000 iterations of the function was determined?From that a number was derived which measured the number of iterations of the function per tick, the smallest time unit obtainable
from the Silicon Graphics Indigo Extreme 2 worksta- tion. Once the update rate was determined for a particular trial, a calculation was made as to the number of iterations of the function needed to delay the program to achieve the desired update rate. Fi- nally, every 40 frames a comparison was made be- tween the amount of time which passed and the time which should have passed, then the amount of delay, if necessary, was adjusted. Before a frame was ren- dered, previously requested position information from the Polhemus tracker was read, the virtual world was updated and a message was sent to the tracker asking for the next position. The virtual world representing Stonehenge was then rendered and the position in- formation from the tracker was read. If position information from the tracker was not available, the program would stall (i.e., go through the above loop) until it was available. Exactly how old the informa- tion from the tracker was (i.e., the lag) was less than the time between frames. Thus, the greater the lag the smaller the number of iterations of the iterative function. Position information was read once a frame and so the recency of this information differed by the difference in how long the frame was held up for different frame rates. To test the effect of the tracker on the above procedure for determining the update rate, during debugging the program was run with and without the Polhemus tracker and the results indicated that the tracker had no measurable effect on the speed of the simulation.
Essentially, as the update rate increases the speed of the simulation increases. At 5 Hz, movement through the virtual world is noticeably jerky, at 10-15 Hz, movement in the computer-generated world begins to appear continuous. The update rate is an important parameter as it affects the speed at which the virtual environment participant navigates within the virtual world. Navigation or movement through a virtual environment is an essential task to induce presence as it produces a sense of self-motion which: (1) is used to detect the direction of motion of self and other objects within the environment, (2) is used to determine the three-dimensional structure of the virtual world, and (3) is used to guide the speed of self-locomotion. The range of update rates selected for study was motivated by several factors. First, when navigating a virtual building, Airey, Rohlf, and Brooks (1990) observed that update rates of 20 Hz were realistic, and that 6 Hz was just beginning to be acceptable. Furthermore, the computer graphics community has observed that when the update rate drops below about 10-15 Hz, motion appears discon- tinuous and becomes distracting (McKenna and Zeltzer, 1992). Finally in a study focusing on presence using immersive virtual environments, Slater, Usoh and Steed (1994) was able to present update rates which ranged between 7-16 Hz. Thus, the range of update rates used in the current study was chosen to bracket the values listed above and are representative
6 Woodrow Barfield and Claudia Hendrix
of update rates obtainable using current computing platforms to create virtual environments.
Thirteen subjects, some with experience in com- puter graphics and virtual environments but all naive as to the purpose of the experiment, volunteered to participate in the study. The group consisted of 9 males and 4 females with a mean age of 25.3 years. All subjects had normal or corrected-to-normal visual acuity. Subjects first completed 10 practice trials in which they performed the search task in virtual Stonehenge. The I0 practice trials consisted of each update rate presented twice, based on two iterations of one random order of 5 trials. After subjects completed each practice trial, they were told the actual update rate of that trial. After completing the 10 practice trials they then viewed the 15 Hz condition and were informed that this represented the "middle" condition in terms of the speed of the simulation. Subjects were given feedback during each of the practice trials for several reasons. First, pilot studies indicated that subjects could not distinguish between, or identify, differences in update rates without a certain degree of practice and feedback from the experimenter. Second, since it was of interest to determine the subjects' level of presence as a function of update rates, it was important to determine that subjects could distinguish between updates rates independent of the levels of presence experienced by subjects.
During the study, subjects saw two presentations of each update rate, with the I0 virtual environments
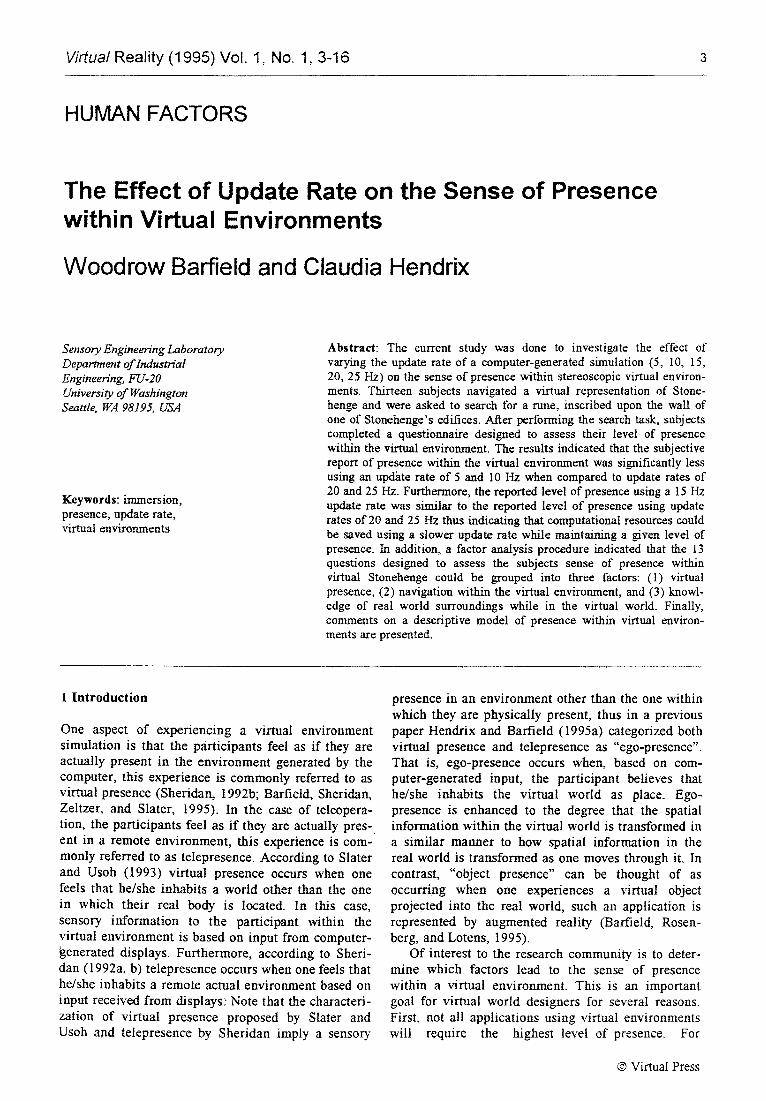
presented in a random order. The task which the subjects were required to perform, consisted of navi- gation and search. That is, subjects were instructed to navigate, ad-lib, a computer-generated representation of Stonehenge and to find an ancient writing (rune) embedded upon one of the walls of a Stonehenge edifice (Figure 1). Each subject was allowed two minutes to navigate within each virtual world. Sub- jects navigated through the environment using a flight stick located on a small table in front of them. The input device had 3 degrees of freedom; for- ward/backward, rotate left/fight, and translate left/right. All objects within the virtual world were Lambertian shaded, and were designed using four sided polygons (no curved surfaces) of different shapes and sizes; this simplistic virtual environment allowed a reasonably fast update rate for the high end of the simulation while still maintaining a visually interesting environment to navigate and explore. In terms of the color of objects within the virtual envi- ronment, the ground was green, the sky was navy blue with stars, and Stonehenge edifices were beige.
4.2 Presence questionnaire
In addition to identifying the update rate, the depend- ent variables also represented responses to questions evaluating the sense of presence within the virtual world (Table I). With the exception of question one, the responses to the survey questions were obtained
Figure 1 Photograph representing virtual Stonehenge.
The Effect of Update Rate on the Sense of Presence within VEs 7
using a likert, i.e., ordinal scale (1-5), For question one, the responses were anchored to the real world and represented an interval scale of-measurement. Essentially, with an interval scale, the differences in the subject's reported levels of presence as a function of the update rates are assumed to be meaningful. As an example, the difference in presence between judg- ments of 80 and 60 for the 25 and 20 Hz conditions is assumed to be the same as the difference in presence between judgments of 60 and 40 for the 20 and 15 Hz conditions. However, since this scale lacks a true zero point, one cannot say that a reported level of presence of 80 is twice as much as a value of 40, ff this were the case, responses would represent a ratio scale.
Hendrix and Barfield (1995a) previously stated that developing a metric of presence is an important goal to achieve for virtual world designers for several reasons. First, a measure of presence will aid virtual world designers in evaluating the effectiveness of different display parameters, input devices, and software algorithms used to design and manipulate virtual worlds. Second, the development of a metric for presence will help establish empirical data relating presence to task performance in virtual environments. Such information would be valuable to virtual world designers in that it may not be necessary to always induce the highest level of presence for a given task. Finally, the development of a metric of presence will help establish a conceptual and analytical framework in which to focus the research on virtual environ- ments.
Several of the questionnaire items in the current study were used previously by Hendrix and Barfield (1995a) in similar studies evaluating display factors and presence and are also similar to questions used by Slater and Usoh (1993) in studies focusing on pres- ence. Thus, one purpose of the current study was to evaluate the reliability of the subjective measure of
Table 1 Summary of each question
presence using a different display variable (i.e. update rate) than manipulated in previous studies. Further- more, repeating questions across studies using different subjects and different independent variables allows the validity of the subjective metric to be evaluated. The questionnaire was organized into two sections: (1) questions relating directly to presence, and, (2) questions which related to the fidelity of the interaction between the user and the virtual environ- ment. Questions relating to presence were designed primarily to evaluate the subject's sense of "being there" in the virtual environment. This is an aspect of the virtual environment experience that several authors have indicated is essential for achieving presence (Barfield and Weghorst, 1993; Slater, Steed, and Usoh, 1993). The second set of questions were designed to assess the fidelity of the interaction between the participant and the virtual environment. These questions were included because previous studies by Weghorst and Billinghurst (1993) and Hendrix and Barfield (1995a, b) found that the fidel- ity of the interaction between the subject and the virtual environment strongly influenced the level of presence experienced by the participant. Since the update rate affects the speed of the simulation, these questions focused mainly on the ease in which the subject navigated within the virtual environment. Table 1 presents the questions which were used to access presence and the fidelity of the interaction between the participant and the virtual environment.
4.3 Designing virtual Stonehenge
The virtual representations of Stonehenge were gen- erated using in-house imaging software and a Silicon Graphics Indigo Extreme z computer workstation. The images were viewed on a 6' x 8' rear projection screen using a GE 610 projection system. The stereoscopic
used in the current study by category
Category Question
Presence (1) If your level of presence in the real world is "I 00", and your level of presence is "I" if you lack presence, rate your level of presence in this virtual world.
(2) How strong was your sense of presence, in the virtual environment? (3) How strong was your sense of "being there", in the virtual environment? (4) How strong was your sense of inclusion in the virtual environment? (5) How aware were you of the real world surroundings while navigating in the virtual world
(i.e., sounds, room temperature, other people, etc.)? (6) Did the speed of the simulation affect your sense of presence in the virtual environment?
Fidelity of Interaction
(7) (8) (9)
(10) ( l l ) (12) (13)
In general, how realistic did the virtual world appear to you? How realistically did you move throughout the virtual world? With what degree of ease were you able to navigate within the virtual environment? Do you feel that you could have reached into the virtual world and grasped an object? How interactive was the virtual environment? What was your overall comfort level in navigating throughout this environment? What was your overall enjoyment level in navigating throughout this environment?
8 Woodrow Barfield and Claudia Hendrix
condition was displayed using a time multiplexed shutter technique (StereoGraphics Corporation) with 1280 x 512 pixel resolution. Subjects were seated in front of the projection screen such that their position subtended a 90 ° FOV with the display screen. The standard viewing condition for the virtual worlds was a stereoscopic mode with a 50 ° GFOV and with headtracking. The headtracking algorithm allowed lateral (x-axis), height (y-axis), and depth (z-axis) head movements to transform the visual scene. Headtracking was added to the display using a Polhe- mus 3Space Fastrak magnetic tracking device. The headtracking device had three degrees of freedom; front / back, lateral left / right, and up / down. Rota- tion was not incorporated into the device given that a fixed-location screen was used to display the virtual environments. In addition, the subject was surrounded by a floor-to-ceiling black curtain drawn behind the subject to the sides of the projection screen which had the effect of blocking any visual stimulation except that provided by the virtual environment. Subjects indicated that this, along with the large FOV display, created a sense of immersion within the computer- generated simulation. The camera eyepoint elevation was set at I 10 cm.
5 Results and discussion
Some cautions should be applied when interpreting the results of the analysis. First, the sample size is small, only 13 subjects were used in the study. Thus, it is possible that the results could change if subjects with different characteristics were used. However, we should point out that the results are very consistent with the findings reported in previous studies by Hendrix and Barfield (1995a, b) using different display variables and different subjects. Finally, the nature of the task performed within the virtual envi- ronment may influence the results. For example, a task requiring excessive attentional resources may result in higher levels of presence than a task requir- ing little concentration. In addition, there should be a logical relationship between the task and the vari- able(s) manipulated. For example, the task selected for the current study was to search for a writing hidden in Stonehenge, since this task requires move- ment through the virtual environment, it was pre- dicted that the task would be influenced by the update rate of the simulation. Finally, given the points above the study should be viewed as exploratory, we propose that additional work should be done using a more interactive task such as direct object manipulation.
,Furthermore, in future studies a larger range-of update rates should be used in order to determine if the results presented here can be generalizable to faster simulations and to more fully explore the relationship between update rates and presence.
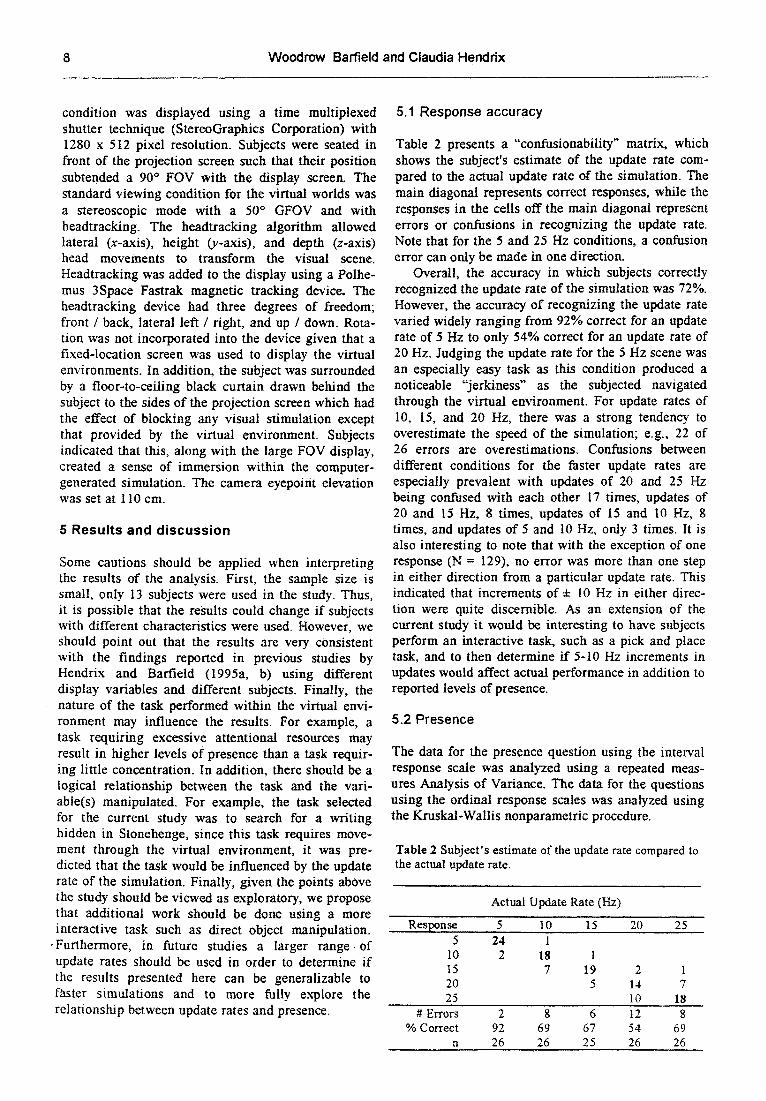
5.1 Response accuracy
Table 2 presents a "confusionability" matrix, which shows the subject's estimate of the update rate com- pared to the actual update rate of the simulation. The main diagonal represents correct responses, while the responses in the cells off the main diagonal represent errors or confusions in recognizing the update rate. Note that for the 5 and 25 Hz conditions, a confusion error can only be made in one direction.
Overall, the accuracy in which subjects correctly recognized the update rate of the simulation was 72%. However, the accuracy of recognizing the update rate varied widely ranging from 92% correct for an update rate of 5 Hz to only 54% correct for an update rate of 20 Hz. Judging the update rate for the 5 Hz scene was an especially easy task as this condition produced a noticeable "jerkiness" as the subjected navigated through the virtual environment. For update rates of 10, 15, and 20 Hz, there was a strong tendency to overestimate the speed of the simulation; e.g., 22 of 26 errors are overestimations. Confusions between different conditions for the faster update rates are especially prevalent with updates of 20 and 25 Hz being confused with each other 17 times, updates of 20 and 15 Hz, 8 times, updates of 15 and I0 Hz, 8 times, and updates of 5 and 10 Hz, only 3 times. It is also interesting to note that with the exception of one response (N = 129), no error was more than one step in either direction from a particular update rate. This indicated that increments of ± 10 Hz in either direc- tion were quite discernible. As an extension of the current study it would be interesting to have subjects perform an interactive task, such as a pick and place task, and to then determine if 5-10 Hz increments in updates would affect actual performance in addition to reported levels of presence.
5.2 Presence
The data for the presence question using the interval response scale was analyzed using a repeated meas- ures Analysis of Variance. The data for the questions using the ordinal response scales was analyzed using the Kruskal-Wallis nonparametric procedure.
Table 2 Subject's estimate of the update rate compared to the actual update rate.
Actual Update Rate (Hz)
Response 5 10 ....... 15 20 25 5 24 1
10 2 18 1 15 7 19 2 1 20 5 14 7 25 10 18
# Errors 2 8 6 t 2 8 % Correct 92 69 67 54 69
n 26 26 25 26 26
The Effect of Update Rate on the Sense of Presence within YEs 9
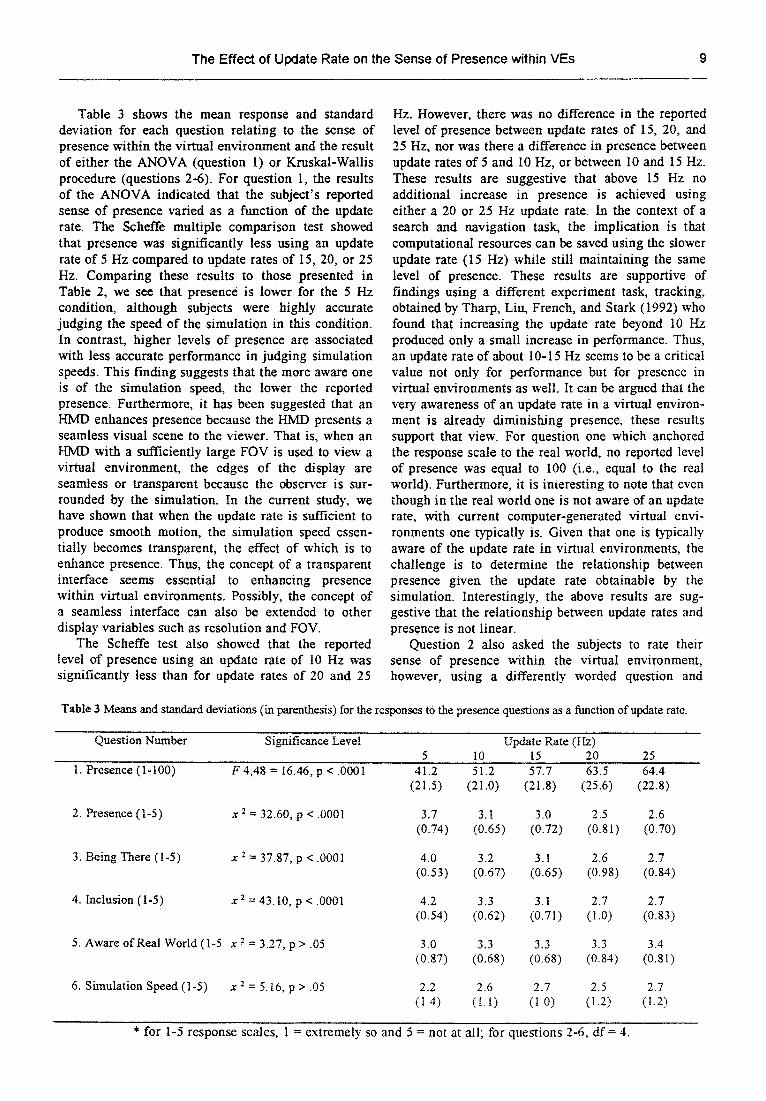
Table 3 shows the mean response and standard deviation for each question relating to the sense of presence within the virtual environment and the result of either the ANOVA (question 1) or Kruskal-Wallis procedure (questions 2-6). For question 1, the results of the ANOVA indicated that the subject's reported sense o f presence varied as a function of the update rate. The Scheffe multiple comparison test showed that presence was significantly less using an update rate of 5 Hz compared to update rates of 15, 20, or 25 Hz. Comparing these results to those presented in Table 2, we see that presence is lower for the 5 Hz condition, although subjects were highly accurate judging the speed of the simulation in this condition. In contrast, higher levels of presence are associated with less accurate performance in judging simulation speeds. This finding suggests that the more aware one is of the simulation speed, the lower the reported presence. Furthermore, it has been suggested that an HMD enhances presence because the HMJ) presents a seamless visual scene to the viewer. That is, when an HMD with a sufficiently large FOV is used to view a virtual environment, the edges of the display are seamless or transparent because the observer is sur- rounded by the simulation. In the current study, we have shown that when the update rate is sufficient to produce smooth motion, the simulation speed essen- tially becomes transparent, the effect of which is to enhance presence. Thus, the concept of a transparent interface seems essential to enhancing presence within virtual environments. Possibly, the concept of a seamless interface can also be extended to other display variables such as resolution and FOV.
The Scheffe test also showed that the reported level of presence using an update rate of t0 Hz was significantly less than for update rates of 20 and 25
Hz. However, there was no difference in the reported level of presence between update rates of 15, 20, and 25 Hz, nor was there a difference in presence between update rates of 5 and 10 Hz, or between 10 and 15 Hz. These results are suggestive that above 15 Hz no additional increase in presence is achieved using either a 20 or 25 Hz update rate. In the context of a search and navigation task, the implication is that computational resources can be saved using the slower update rate (15 Hz) while still maintaining the same level of presence. These results are supportive of findings using a different experiment task, tracking, obtained by Tharp, Liu, French, and Stark (1992) who found that increasing the update rate beyond I0 Hz produced only a small increase in performance. Thus, an update rate of about 10-15 Hz seems to be a critical value not only for performance but for presence in virtual environments as well. It can be argued that the very awareness of an update rate in a virtual environ- ment is already diminishing presence, these results support that view. For question one which anchored the response scale to the real world, no reported level of presence was equal to I00 (i.e., equal to the real world). Furthermore, it is interesting to note that even though in the real world one is not aware of an update rate, with current computer-generated virtual envi- ronments one typically is. Given that one is typically aware of the update rate in virtual environments, the challenge is to determine the relationship between presence given the update rate obtainable by the simulation. Interestingly, the above results are sug- gestive that the relationship between update rates and presence is not linear.
Question 2 also asked the subjects to rate their sense of presence within the virtual environment, however, using a differently worded question and
Table 3 Means and standard deviations (in parenthesis) for the responses to the presence questions as a function of update rate.
Question Number Significance Level Update Rate (I-Lz) 5 I0 15 20 25
1. Presence (1-100) F 4,48 = 16.46, p < .0001 41.2 51.2 57.7 63.5 64.4 (21.5) (21.0) (21.8) (25.6) (22.8)
2. Presence (1-5) x 2 = 32.60, p < .0001 3.7 3.1 3.0 2.5 2.6 (0.74) (0.65) (0.72) (0.8t) (0.70)
3. Being There (1-5) x z = 37.87, p < .0001 4.0 3.2 3.1 2.6 2.7 (0.53) (0.67) (0.65) (0.98) (0.84)
4. Inclusion (1-5) x 2 = 43.10, p < .0001 4.2 3.3 3.1 2.7 2.7 (0.54) (0.62) (0.71) (I.0) (0.83)
5. Aware of Real World (1-5 x 2 = 3.27, p > .05
6. Simulation Speed (1-5) x 2 = 5.16, p > .05
3.0 3.3 3.3 3.3 3.4 (0.87) (0.68) (0.68) (0.84) (0.81)
2.2 2.6 2.7 2.5 2.7 (1.4) (i.I) (I.0) (1.2) (1.2)
* for I-5 response scales, 1 = extremely so and 5 = not at all; for questions 2-6, df = 4.
i U V V U U U I U W O;"'mlll~lU ~tl IU ~,I~IUUI¢I I - I t ~ I I U I I A
response scale than the previous question. The results for both questions were quite similar, generally, more presence was associated with faster update rates with 15 Hz again serving as a critical value in that above or below this value the reported presence was either higher or lower respectively. In addition, the sense of "being there" and the sense of "inclusion" within virtual Stonehenge were also affected by the update rate. For both questions, the reported level of presence was higher with update rates of 20 and 25 Hz and quite low for the 5 Hz simulation. The responses to the above questions are similar to responses that were obtained by Hendrix and Barfield (1995a) using the same questions to study presence but evaluated with different display technologies. Such findings provide supportive evidence that the presence questions presented in the current study are reliable, that is, produce a similar response when the same question is asked again under similar circumstances. In fact, quite remarkably, in three previous studies Hendrix and Barfield (1995) showed that the answer to a question evaluating presence using different subjects but with similar virtual environments, produced a mean reported level of presence that varied by no more than 1 point using a 1-100 scale. In addition, similar findings between studies focusing on the same construct, but which evaluated the construct as a function of different display technologies, provides evidence that the presence questions have construct validity.
Interestingly, the subject's response to the question asking whether they were aware of the real world surroundings while navigating within the virtual environment, did not vary as a function of the update rate. In terms of real world surroundings, the survey question focused on the ambient room temperature, ambient noise in the experiment room, and an aware- ness of other people in the laboratory. Generally, for each update rate, subjects responded that they were moderately to not aware of the real world surround- ings while navigating the virtual environment. This indicates that subjects found the task and virtual environment to be of sufficient interest that they were aware mainly of the virtual environment and less aware of the real world surroundings. In addition, these results can be interpreted in the context of attentional resources allocated to real and virtual environments. In a previous paper Barfield, Sheridan, Zeltzer, and Slater, (1995) argued that for presence to occur within an environment, attentional resources must be allocated to stimuli in that environment. These results are suggestive that even with the low fidelity visual scene used in the current study, suffi- cient attentional resources were allocated to the virtual world to create a sense of presence in that world. In a future study, it would be interesting to compare these results to those obtained using an immersive virtual environment, i.e., to determine if a more immersive environment would lead to even less
awareness of the real world. Finally, it was also of interest to determine if a question relating directly to the speed of the simulation would affect the reported sense of presence within the virtual environment. The Kruskal-Wallis procedure indicated that responses to this question were similar across the five update rates. In general, for each case, subjects indicated that the speed of the simulation "moderately to quite so" influenced their sense of presence.
To summarize the performance across questions for the presence section of the questionnaire, perform- ance for the 20, and 25 Hz cases were quite similar and both lead to higher reported levels of presence than the 5 and 10 Hz simulations. Furthermore, the 5 Hz condition was consistently rated as being undesir- able in terms of interactivity, navigation, and pres- ence.
5.3 Fidelity of interaction
Table 4 shows the mean response and standard devia- tion to the survey questions relating to the subject's interaction or perceived ability to interact with the virtual environment. Based on the Kruskal-Wallis procedure, the data indicated that responses to each question varied as a function of the update rate. For example, using update rates of 20 and 25 Hz, subjects responded that the virtual environment was only moderately realistic (recall that the environment was a low polygon world with no curved surfaces, and with Lambertian shading), whereas, with a 5 Hz update rate, subjects responded that the virtual world was not very realistic. Typically, in computer graph- ics, the realism of a computer-generated scene is judged based on how "photorealistic" the scene ap- pears to the viewer. Since, in the current study, the visual scene remained the same in each simulation, we conclude that the subject's impression of the realism of the virtual environment is affected not only by the visual scene itself, but also by the update rate of the simulation. Furthermore, because the update rate for a particular simulation determines the rate of optical flow in the virtual environment and the sub- ject's ability to use motion parallax to determine the relative depth of objects, we conclude that the spatial realism of the environment is an important factor in determining the amount of presence experienced by the virtual environment participant.
As predicted, the speed of the simulation affected the subject's perception of how realistically they moved within the virtual environment, a 5 Hz update rate lead to a mean response of not very realistic movement; whereas 20 and 25 Hz conditions resulted in mean responses between moderately to quite real- istic movement. The question relating to the subject's ability to navigate within the virtual environment found that update rates of 20 and 25 Hz were evalu- ated as quite easy in terms of navigation, whereas a virtual world with only a 5 Hz update rate was evaluated
The Effect of Update Rate on the Sense of Presence within VEs 11
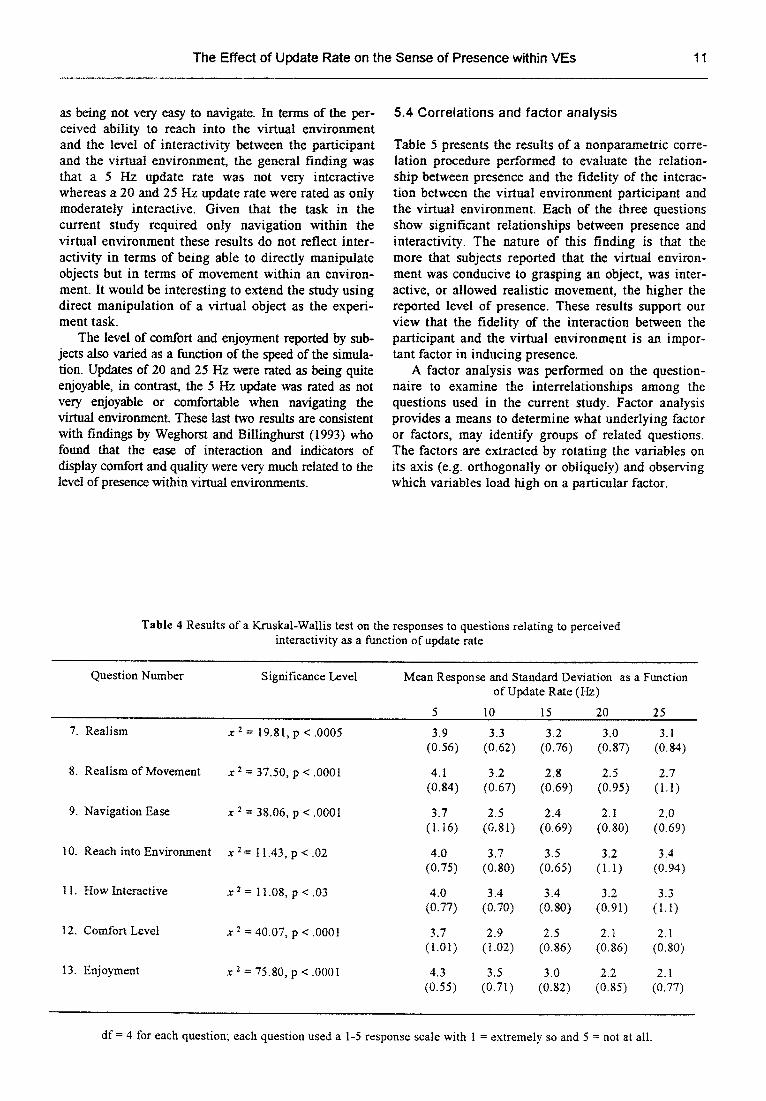
as being not very easy to navigate. In terms of the per- ceived ability to reach into the virtual environment and the level o f interactivity between the participant and the virtual environment, the general finding was that a 5 Hz update rate was not very interactive whereas a 20 and 25 Hz update rate were rated as only moderately interactive. Given that the task in the current study required only navigation within the virtual environment these results do not reflect inter- activity in terms of being able to directly manipulate objects but in terms of movement within an environ- ment. It would be interesting to extend the study using direct manipulation of a virtual object as the experi- ment task.
The level of comfort and enjoyment reported by sub- jects also varied as a function of the speed of the simula- tion. Updates of 20 and 25 Hz were rated as being quite enjoyable, in contrast, the 5 Hz update was rated as not very enjoyable or comfortable when navigating the virtual environment. These last two results are consistent with findings by Weghorst and Billinghurst (1993) who found that the ease of interaction and indicators of display comfort and quality were very much related to the level of presence within virtual environments.
5.4 Correlations and factor analysis
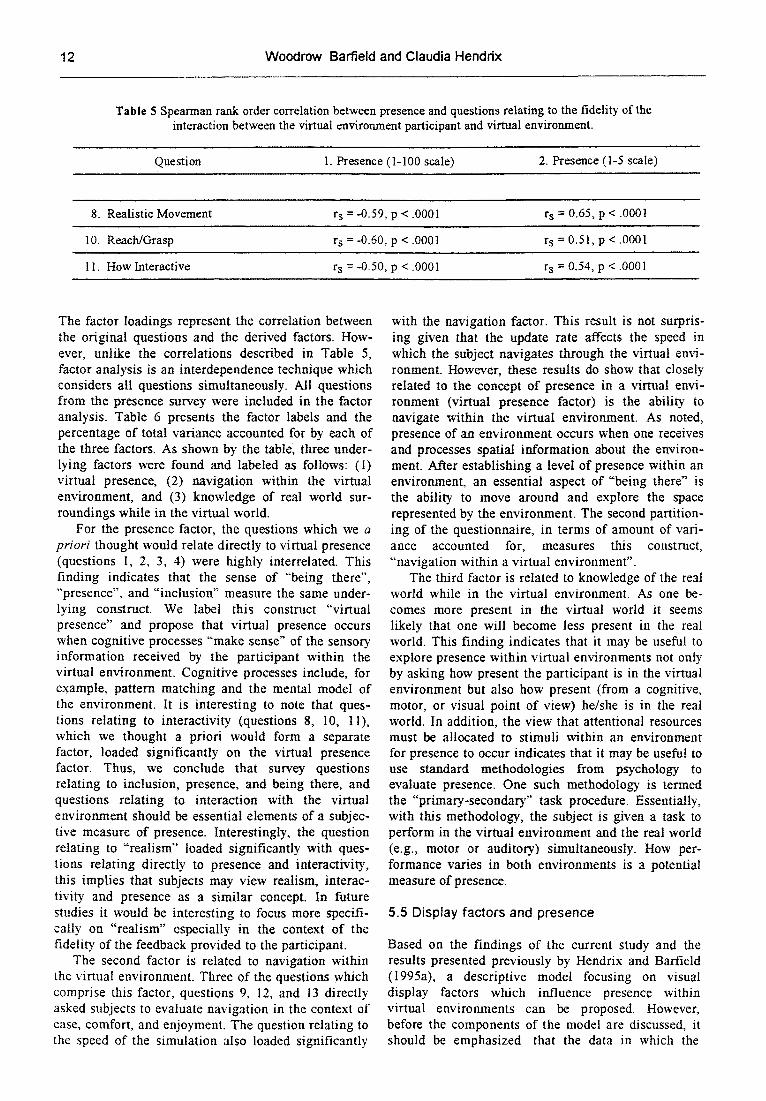
Table 5 presents the results o f a nonparametric corre- lation procedure performed to evaluate the relation- ship between presence and the fidelity of the interac- tion between the virtual environment participant and the virtual environment. Each of the three questions show significant relationships between presence and interactivity. The nature of this finding is that the more that subjects reported that the virtual environ- ment was conducive to grasping an object, was inter- active, or allowed realistic movement, the higher the reported level of presence. These results support our view that the fidelity of the interaction between the participant and the virtual environment is an impor- tant factor in inducing presence.
A factor analysis was performed on the question- naire to examine the interrelationships among the questions used in the current study. Factor analysis provides a means to determine what underlying factor or factors, may identify groups of related questions. The factors are extracted by rotating the variables on its axis (e.g. orthogonally or obliquely) and observing which variables load high on a particular factor.
Table 4 Results of a Kruskal-Wallis test on the responses to questions relating to perceived interactivity as a function of update rate.
Question Number Significance Level Mean Response and Standard Deviation as a Function of Update Rate (Hz)
5 I0 15 20 25
7. Realism
8. Realism of Movement
9. Navigation Ease
10. Reach into Environment
11. How Interactive
12. Comfort Level
13. Enjoyment
x 2 = 19.81, p < .0005 3.9 3.3 3.2 3.0 3.1 (0.56) (0.62) (0.76) (0.87) (0.84)
x 2 = 37.50, p < .0001 4.1 3.2 2.8 2.5 2.7 (0.84) (0.67) (0.69) (0.95) (1.1)
x z = 38.06, p < .000t 3.7 2.5 2.4 2.1 2.0 (1.16) (0.81) (0.69) (0.80) (0.69)
x 2 = 11.43, p < .02 4.0 3.7 3.5 3.2 3.4 (0.75) (0.80) (0.65) (1.1) (0.94)
x ~ = 11.08, p < .03 4.0 3.4 3.4 3.2 3.3 (0.77) (0.70) (0.80) (0.91) (1. t)
x 2 = 40.07, p < .000I 3.7 2.9 2.5 2.1 2.1 (l.01) (1.02) (0.86) (0.86) (0.80)
x ~ = 75.80, p < .0001 4.3 3.5 3.0 2.2 2.1 (0.55) (0.71) (0.82) (0.85) (0.77)
df = 4 for each question; each question used a 1-5 response scale with 1 = extremely so and 5 = not at all.
12 Woodrow Barfield and Claudia Henddx
Table 5 Spearman rank order correlation between presence and questions relating to the fidelity of the interaction between the virtual environment participant and virtual environment.
Question 1. Presence (1-100 scale) 2. Presence (1-5 scale)
8. Realistic Movement r s = -0.59, p < .0001 rs = 0.65, p < .0001
10. Reach/Grasp r s = -0.60, p < .0001 r s = 0.51, p < .0001
I t. How Interactive r s = -0.50, p < .0001 rs = 0.54, p < .000t
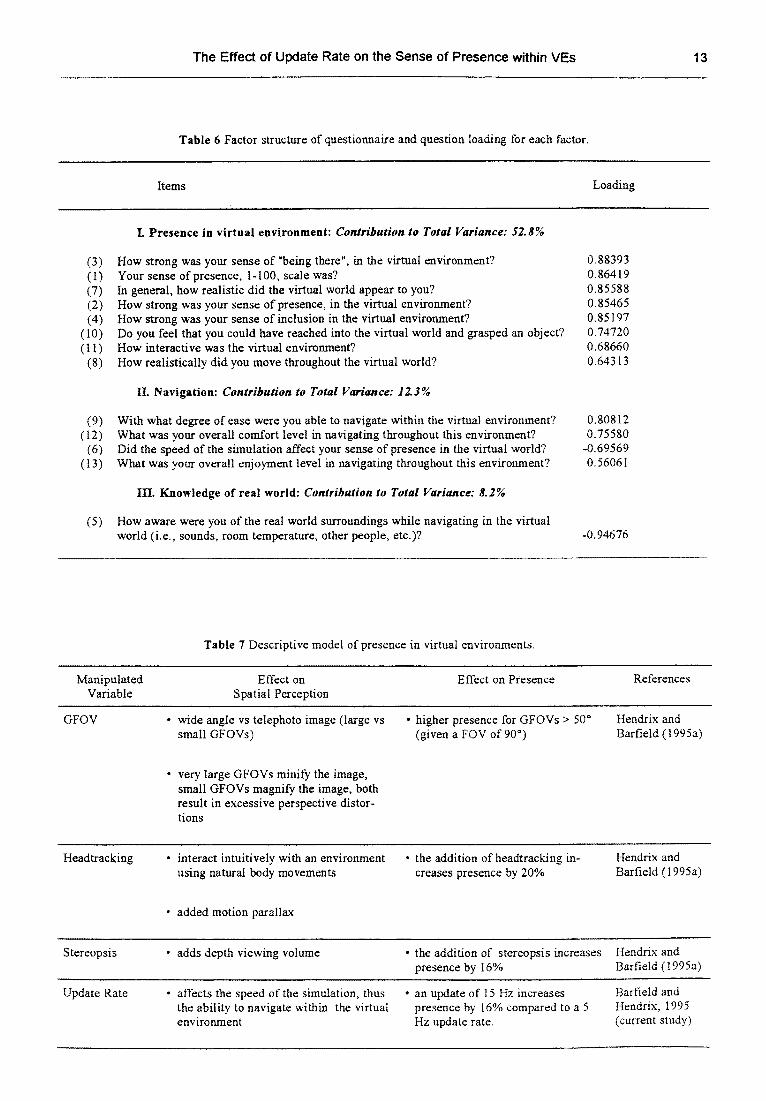
The factor loadings represent the correlation between the original questions and the derived factors. How- ever, unlike the correlations described in Table 5, factor analysis is an interdependence technique which considers all questions simultaneously. All questions from the presence survey were included in the factor analysis. Table 6 presents the factor labels and the percentage of total variance accounted for by each of the three factors. As shown by the table~ three under- lying factors were found and labeled as follows: (I) virtual presence, (2) navigation within the virtual environment, and (3) knowledge of real world sur- roundings while in the virtual world.
For the presence factor, the questions which we a priori thought would relate directly to virtual presence (questions 1, 2, 3, 4) were highly interrelated. This finding indicates that the sense of "being there", "presence", and "inclusion" measure the same under- lying construct. We label this construct "virtual presence" and propose that virtual presence occurs when cognitive processes "make sense" of the sensory information received by the participant within the virtual environment. Cognitive processes include, for example, pattern matching and the mental model of the environment. It is interesting to note that ques- tions relating to interactivity (questions 8, 10, 1 I), which we thought a priori would form a separate factor, loaded significantly on the virtual presence factor. Thus, we conclude that survey questions relating to inclusion, presence, and being there, and questions relating to interaction with the virtual environment should be essential elements of a subjec- tive measure of presence. Interestingly, the question relating to "realism" loaded significantly with ques- tions relating directly to presence and interactivity, this implies that subjects may view realism, interac- tivity and presence as a similar concept. In future studies it would be interesting to focus more specifi- cally on "realism" especially in the context of the fidelity of the feedback provided to the participant.
The second factor is related to navigation within the virtual environment. Three of the questions which comprise this factor, questions 9, 12, and 13 directly asked subjects to evaluate navigation in the context of ease, comfort, and enjoyment. The question relating to the speed of the simulation also loaded significantly
with the navigation factor. This result is not surpris- ing given that the update rate affects the speed in which the subject navigates through the virtual envi- ronment. However, these results do show that closely related to the concept of presence in a virtual envi- ronment (virtual presence factor) is the ability to navigate within the virtual environment. As noted, presence of an environment occurs when one receives and processes spatial information about the environ- ment. After establishing a level of presence within an environment, an essential aspect of "being there" is the ability to move around and explore the space represented by the environment. The second partition- ing of the questionnaire, in terms of amount of vari- ance accounted for, measures this construct, "navigation within a virtual environment".
The third factor is related to knowledge of the real world while in the virtual environment. As one be- comes more present in the virtual world it seems likely that one will become less present in the real world. This finding indicates that it may be useful to explore presence within virtual environments not only by asking how present the participant is in the virtual environment but also how present (from a cognitive, motor, or visual point of view) he/she is in the real world. In addition, the view that attentional resources must be allocated to stimuli within an environment for presence to occur indicates that it may be useful to use standard methodologies from psychology to evaluate presence. One such methodology is termed the "primar3'-secondary" task procedure. Essentially, with this methodology, the subject is given a task to perform in the virtual environment and the real world (e.g., motor or auditory) simultaneously. How per- formance varies in both environments is a potential measure of presence.
5.5 Display factors and presence
Based on the findings of the current study and the results presented previously by Hendrix and Barfield (1995a), a descriptive model focusing on visual display factors which influence presence within virtual environments can be proposed. However, before the components of the model are discussed, it should be emphasized that the data in which the
The Effect of Update Rate on the Sense of Presence within VEs 13
Table 6 Factor structure of questionnaire and question loading for each factor.
Items Loading
I. Presence in virtual environment: Contribution to Total Variance: 52.8%
(3) How strong was your sense of "being there", in the virtual environment? (1) Your sense of presence, 1-100, scale was? (7) In general, how realistic did the virtual world appear to you? (2) How strong was your sense of presence, in the virtual environment? (4) How strong was your sense of inclusion in the virtual environment?
(10) Do you feel that you could have reached into the virtual world and grasped an object? (1 I) How interactive was the virtual environment?
(8) How realistically did you move throughout the virtual world?
IL Navigation: Contribution to Total Variance: 12.3%
(9) With what degree of ease were you able to navigate within the virtual environment? (12) What was your overall comfort level in navigating throughout this environment?
(6) Did the speed of the simulation affect your sense of presence in the virtual world? (13) What was your overall enjoyment level in navigating throughout this environment?
(s)
III. Knowledge of real world: Contribution to Total Variance: 8.2%
How aware were you of the real world surroundings while navigating in the virtual world (i.e., sounds, room temperature, other people, etc.)?
0.88393 0.86419 0.85588 0.85465 0.85197 0.74720 0.68660 0.64313
0.80812 0.75580
-0.69569 0.56061
-0.94676
Table 7 Descriptive model of presence in virtual environments.
Manipulated Effect on Effect on Presence References Variable Spatial Perception
GFOV • wide angle vs telephoto image (large vs ° higher presence for GFOVs > 50 ° Hendrix and small GFOVs) (given a FOV of 90 °) Barfield (1995a)
very large GFOVs minify the image, small GFOVs magnify the image, both result in excessive perspective distor- tions
Headtracking • interact intuitively with an environment • the addition of headtracking in- using natural body movements creases presence by 20%
Hendrix and Barfield (I 995a)
• added motion parallax
Stereopsis • adds depth viewing volume ° the addition of stereopsis increases Hendrix and presence by 16% Barfield (1995a)
Update Rate - affects the speed of the simulation, thus the ability to navigate within the virtual environment
• an update of 15 Hz increases presence by 16% compared to a 5 Hz update rate.
Barfield and Hendrix, 1995 (current study)
14 Woodrow Barfield and Claudia Hendrix
model is based were derived using navigation as the ex'periment task and the stereoscopic display used to present the virtual environment was not immersive. In addition, the information in Table 7 does not repre- sent a comprehensive discussion of display variables and presence, but is meant only to summarize the display variables which, based on empirical data from our laboratory, should be included in a descriptive model of presence. These variables include the GFOV, the presence or absence of headtracking, the presence or absence of stereopsis, and the update rate of the simulation.
• Head Tracking: The ability to track the viewer's head in order to show the correct viewpoint of the world is an important aspect of spatial perception in real and virtual environments. Changing the view- point allows the virtual environment participant to use motion parallax as a depth cue and to determine the three-dimensional structure of the world. However, given complex scenes, slower update rates (e.g., 1-5 Hz) result in lag as the viewer moves his head. Such an effect should interfere with the participant's ability to suspend disbelief that they are inhabiting the virtual environment as place and thus to experience a sense of presence within the virtual environment. Our results suggest that head tracking greatly increases the reported level of presence, compared to a scene viewed without head tracking.
• GFOV: We have found that the GFOV used to design the visual display influences the level of presence experienced by the virtual environment participant. Specifically, GFOVs using telephoto lens compress the depth dimension of the virtual scene and detract from the observer's ability to suspend disbe- lief. We have found the effect of scene compression to be quite pronounced as subjects consistently report that they run into objects while navigating a virtual room. Given a 90 ° viewing FOV, we tentatively conclude that a GFOV of at least 50 ° is necessary to mitigate this effect.
• Stereopsis: We have shown that the addition of stereopsis increases the reported level of presence (by approximately 16%) compared to a monoscopic display. However, ghosting, resolution, and crosstalk, for time multiplexed display systems; and resolution and FOV for HMDs are factors, if not implemented properly, can detract from presence.
• Update Rate: Lastly, updates of at least 10 Hz are necessary to induce at least a moderate level of pres- ence. Interestingly, for a search and navigation task, there is no difference in the reported level of presence as one increases the update rate from 15 Hz to 20 or 25 Hz, thus indicating that for a given level of pres- ence computational resources can be saved by using the 15 Hz update rate.
Acknowledgments
This work was supported by the Air Force Office of Scientific Research (contract # 92-NL-225 and INST PROP NO:78216), and the National Science Founda- tion (DMC-8857851, CDA-8806866). We thank Paul Schwartz for developing the in-house software pro- gram "Precept", which was used to design the virtual worlds, Karen Bolt for assistance in running subjects and Boris Kogon for assistance in running subjects and in designing virtual Stonehenge.
References
Airey, J.M., Rohlf, J.H. and Brooks, F., (1990). Towards Image Realism with Interactive Update Rates in Complex Virtual Building Environments, Com- puter Graphics, 24:41-50.
Barfield, W. and Weghorst, S., (1993). The Sense of Presence Within Virtual Environments: A Conceptual Framework, in Human Computer Interaction: Soft- ware and Hardware Interfaces, (Eds.) G. Salvendy and M. Smith, Elsevier Publisher, 699-704.
Barfield, W., Sheridan, T., Zeltzer, D. and Slater, M., (1995). Presence and Performance within Virtual Environments, in Virtual Environments and Advanced Interface Design, (Eds.) W. Barfield and T. Furness III, Oxford University Press.
Barfield, W., Rosenberg, C. and Lotens, W., (1995). Augmented-Reality Displays, in Virtual Environments and Advanced Interface Design, (Eds.) W. Barfield and T. Furness III, Oxford University Press.
Foley, J., Van Dam, A., Feiner, S.K., Hughes, J.F. and Phillips, R.L., (1994). Introduction to Computer Graphics, Addison-Wesley.
Hendrix, C. and Barfield, W., (1995a). Ego-presence within Virtual Environments as a function of Visual Display Parameters, accepted for publication Pres- ence: Teleoperators and Virtual Environments.
Hendrix, C. and Barfield, W., (1995b). Presence as a Function of Auditory Cues, accepted for publication Presence: Teleoperators and Virtual Environments.
Lampton, D.R., Knerr, B.W. and Goldberg, S.L., (1994). The Virtual Environment Performance As- sessment Battery (VEPAB): Development and Evaluation, Presence: Teleoperators and Virtual Environments, 3(2): 145-157.
McKenna, M.D. and Zeltzer, D., (1992). Three Di- mensional Visual Display Systems for Virtual Envi- ronments, Presence: Teleoperators and Virtual Environments, 1(4): 421-458.
The Effect of Update Rate on the Sense of Presence within YEs 15
Piantanida, T., Boman, D.K. and Gille, L, (1993). Human Perceptual Issues and Virtual Reality, Virtual Reality Systems, Applications and Research, 1(1): 43- 52, March.
Sheridan, T.B., (1992a). Musings on Telepresence and Virtual Presence, Presence: Teleoperators and Virtual Environments, 1(1): 120-125.
Sheridan, T.B., (1992b). Defining our Terms, Pres- ence: Teleoperators and Virtual Environments, 1(2): 272 -274.
Slater, M. and Usoh, M., (1994). Representations Systems, Perceptual Position, and Presence in Im- mersive Virtual Environments, Presence: Teleopera- tors and Virtual Environments, 2(3): 221-233.
Slater, M. and Usoh, M., (1993). Presence in Immer- sive Virtual Environments, 1EEE Virtual Reality International Symposium, 90-96.
Slater, M., Usoh, M., and Steed, A., (1994). Depth of Presence in Virtual Environments, Presence: Teleop- erators and Virtual Environments, 3(2): 130-144. Slater M., Steed, A. and Usoh, M., (1993). The Virtual Treadmill: A Naturalistic Metaphor for Navi- gating in Immersive Virtual Environments, in M. Goebel (Ed.), Proceedings o f the Eurographics Work- shop on Virtual Reality, Barcelona, September.
Tharp, G. and Liu, A., (1993). Timing Considerations- of Helmet Mounted Display Performance, SPIE Vol. 1666, Human Vision, Visual Processing, and Digital Display 111, 570-576.
Weghorst, S. and Billinghurst, M., (!993). Spatial Perception of Immersive Virtual Environments, HIT Lab Technical Report, University of Washington.
Zeltzer, D., (1992). Autonomy, Interaction, and Presence, Presence: Teleoperators and Virtual Envi- ronments, 1(1): 127-132.


