Download - The Elderly Population in Maryland

The Elderly Population in Maryland
Data from the 2000 Census
and Projections
MACo Summer Conference, August 14th, 2003
Maryland Department of Planning

Elderly Population in Maryland
• Elderly Population Totals & Shares by County
• Socioeconomic Characteristics from the 2000 Census
• Projections

Percent of Population Ages 65+ in 2000
12.4%11.3%
0%
3%
6%
8%
11%
14%
U.S. Maryland(Ranked 41st)
Prepared by the Maryland Department of Planning, from U.S. Census Data

12.9%
13.2%
13.5%
14.2%
14.2%
14.6%
14.9%
17.7%
17.9%
19.3%
20.1%
20.4%
0% 5% 10% 15% 20% 25%
Queen Anne's
Baltimore city
Caroline
Somerset
Washington
Baltimore Co
Garrett
Dorchester
Allegany
Kent
Worcester
Talbot
Percent Age 65+ by Jurisdiction – 2000
Prepared by the Maryland Department of Planning, from U.S. Census data

7.5%
7.7%
7.8%
8.9%
9.1%
9.6%
10.0%
10.1%
10.5%
10.8%
11.2%
12.8%
0% 5% 10% 15% 20% 25%
Howard
Prince George's
Charles
Calvert
St. Mary's
Frederick
Anne Arundel
Harford
Cecil
Carroll
Montgomery
Wicomico
Percent Age 65+ by Jurisdiction – 2000
Prepared by the Maryland Department of Planning, from U.S. Census data
continued

Percent Persons Over the Age of 65 For Maryland’s Jurisdictions - 2000
Garrett 14.9%
Allegany 17.9% Washington
14.2%
Frederick 9.6%
Carroll 10.8%
Baltimore 14.6%
Montgomery 11.2%
Harford 10.1%
Cecil 10.5%
Charles 7.8%
Prince George’s
7.7%
St. Mary’s 9.1%
Howard 7.5%
Anne Arundel 10.0%
Kent 19.3%
Balto. City 13.2%
Talbot 20.4%
Calvert 8.9%
Dorchester 17.7%
Caroline 13 5%
Queen Anne’s 12.9%
Wicomico 12.8%
Somerset 14.2%
Worcester 20.1%
Source: U.S. Census Bureau, SF1. Maryland Department of Planning, Planning Data Services.
Percent Persons Over 65
7.5% - 10.4%
17.5% - 20.4%
10.5% - 13.4%
13.5% - 17.4%

10,823
13,429
16,267
18,468
18,690
18,836
22,160
48,820
61,951
85,921
98,157
110,335
0 20,000 40,000 60,000 80,000 100,000 120,000
Wicomico
Allegany
Carroll
Howard
Washington
Frederick
Harford
Anne Arundel
Prince George's
Baltimore City
Montgomery
Baltimore Co
Population, Ages 65+, by Jurisdiction – 2000
Prepared by the Maryland Department of Planning, from U.S. Census data

3,503
3,708
4,031
4,461
5,227
5,423
6,627
6,897
7,825
8,995
9,351
9,402
0 20,000 40,000 60,000 80,000 100,000 120,000
Somerset
Kent
Caroline
Garrett
Queen Anne's
Dorchester
Calvert
Talbot
St. Mary's
Cecil
Worcester
Charles
Population, Ages 65+, by Jurisdiction – 2000
Prepared by the Maryland Department of Planning, from U.S. Census data
continued
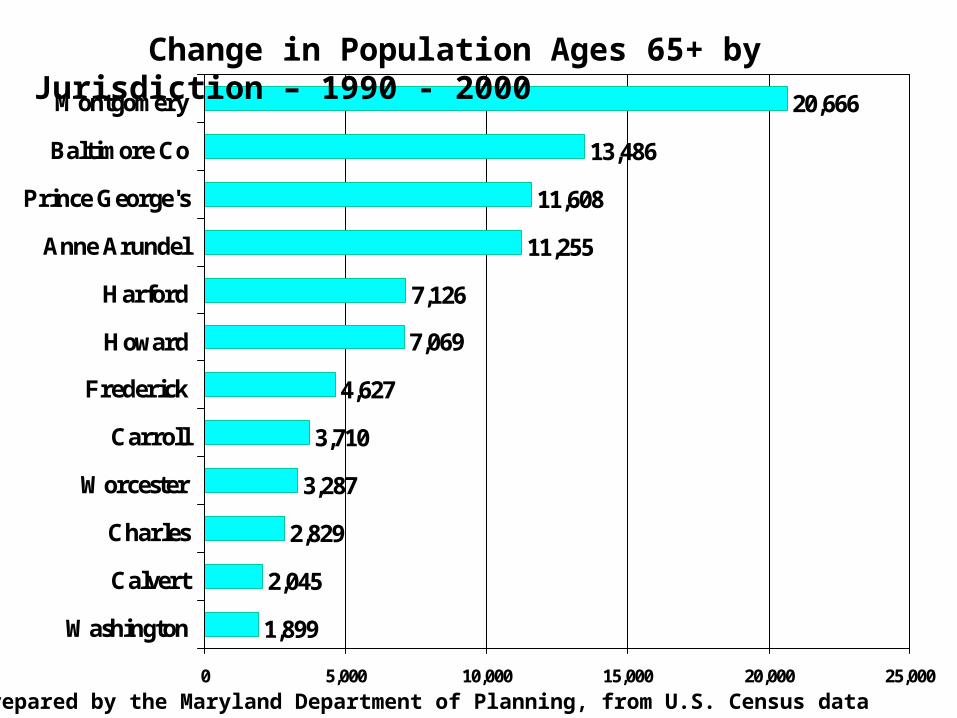
1,899
2,045
2,829
3,287
3,710
4,627
7,069
7,126
11,255
11,608
13,486
20,666
0 5,000 10,000 15,000 20,000 25,000
Washington
Calvert
Charles
Worcester
Carroll
Frederick
Howard
Harford
Anne Arundel
Prince George's
Baltimore Co
Montgomery
Change in Population Ages 65+ by Jurisdiction – 1990 - 2000
Prepared by the Maryland Department of Planning, from U.S. Census data

-14,995
-451
-1
141
197
594
689
769
856
1,264
1,525
1,630
-20,000 -15,000 -10,000 -5,000 0 5,000 10,000 15,000 20,000 25,000
Baltimore City
Allegany
Somerset
Caroline
Dorchester
Garrett
Kent
Talbot
Queen Anne's
Wicomico
St. Mary's
Cecil
Change in Population Ages 65+ by Jurisdiction – 1990 - 2000
Prepared by the Maryland Department of Planning, from U.S. Census data
continued

17.8%
18.0%
18.0%
19.5%
21.7%
23.6%
28.5%
34.8%
45.0%
50.8%
0% 10% 20% 30% 40% 50% 60%
Montgomery
Anne Arundel
Washington
Harford
Baltimore Co
Talbot
Worcester
Garrett
Dorchester
Kent
Elderly Change as a Pct of Total Pop Change, 1990 - 2000
Prepared by the Maryland Department of Planning, from U.S. Census data

0.0%
5.2%
8.8%
10.3%
11.2%
11.7%
12.3%
13.0%
13.5%
14.6%
0% 10% 20% 30% 40% 50% 60%
Somerset
Caroline
Calvert
Frederick
Cecil
Howard
Wicomico
Queen Anne's
Carroll
Charles
Elderly Change as a Pct of Total Pop Change, 1990 - 2000
Prepared by the Maryland Department of Planning, from U.S. Census data
continued

Characteristics of the Elderly
• Median Household Income & Poverty
• Percent of Income Spent on Housing
• Vehicle Availability
• Ability to Speak English
• Disability Status

Median Household Income (1999)by Age of Household Head - Maryland
$27,015
$48,851
$61,027
$68,364
$60,585
$38,607
$27,246
0
10,000
20,000
30,000
40,000
50,000
60,000
70,000
< 25 25-34 35-44 45-54 55-64 65-74 75+
Prepared by the Maryland Department of Planning, from U.S. Census Data

Poverty Rates in 1999 by Age Group in Maryland
8.5% 8.5%7.4%
10.0%
11.7%10.7%
0%
2%
4%
6%
8%
10%
12%
Total 65+ 65-74 75+ <5 < 18
Prepared by the Maryland Department of Planning, from U.S. Census Data

7.9%
8.5%
8.6%
8.8%
8.9%
9.5%
9.5%
12.3%
13.9%
14.2%
18.0%
19.1%
0% 5% 10% 15% 20% 25%
Talbot
Kent
Charles
Wicomico
St. Mary's
Washington
Allegany
Caroline
Garrett
Dorchester
Baltimore city
Somerset
Percent Age 65+ in Poverty by Jurisdiction – 1999
Prepared by the Maryland Department of Planning, from U.S. Census data

4.9%
5.7%
5.8%
5.9%
6.0%
6.4%
6.5%
6.7%
6.9%
6.9%
7.3%
7.7%
0% 5% 10% 15% 20% 25%
Carroll
Calvert
Anne Arundel
Montgomery
Frederick
Worcester
Baltimore Co
Harford
Prince George's
Howard
Queen Anne's
Cecil
Percent Age 65+ in Poverty by Jurisdiction – 1999
Prepared by the Maryland Department of Planning, from U.S. Census data
continued

2.7%
3.1%
3.2%
3.2%
3.4%
4.9%
7.1%
8.5%
9.2%
9.6%
10.9%
13.1%
-4% -2% 0% 2% 4% 6% 8% 10% 12% 14%
Prince George's
Caroline
Talbot
Garrett
Washington
Dorchester
Wicomico
Allegany
Kent
Somerset
Worcester
Baltimore city
Pct Pt Diff Between Child Poverty & Elderly Poverty – 1999
Prepared by the Maryland Department of Planning, from U.S. Census data
Child poverty > elderly poverty
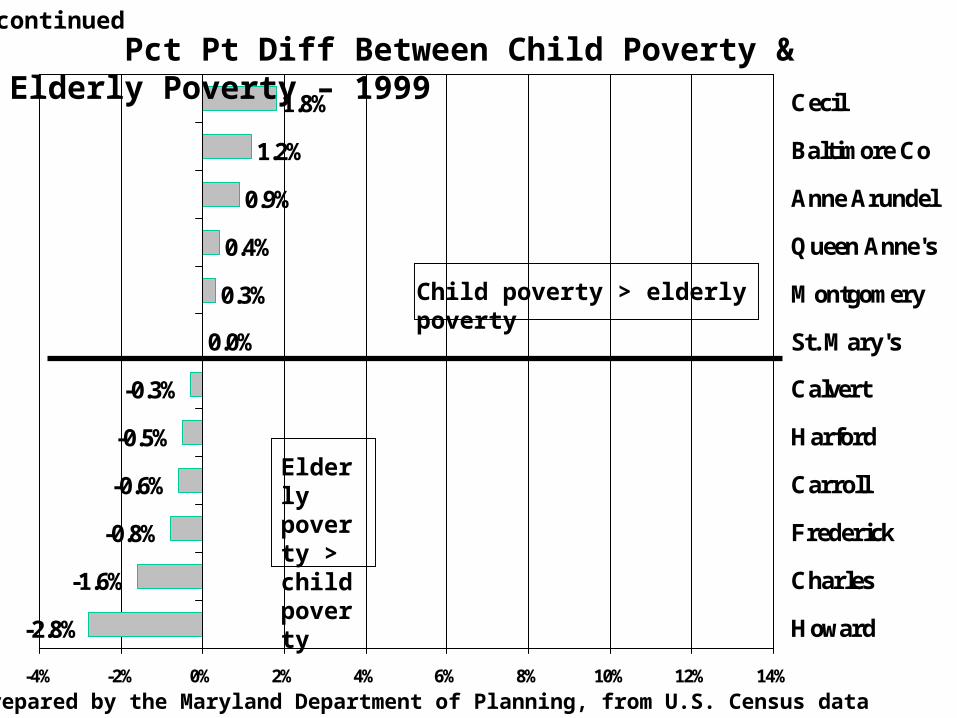
-2.8%
-1.6%
-0.8%
-0.6%
-0.5%
-0.3%
0.0%
0.3%
0.4%
0.9%
1.2%
1.8%
-4% -2% 0% 2% 4% 6% 8% 10% 12% 14%
Howard
Charles
Frederick
Carroll
Harford
Calvert
St. Mary's
Montgomery
Queen Anne's
Anne Arundel
Baltimore Co
Cecil
Pct Pt Diff Between Child Poverty & Elderly Poverty – 1999
Prepared by the Maryland Department of Planning, from U.S. Census data
Child poverty > elderly poverty
Elderly poverty > child poverty
continued

Characteristics of the Elderly
• Median Household Income & Poverty
• Percent of Income Spent on Housing
• Vehicle Availability
• Ability to Speak English
• Disability Status
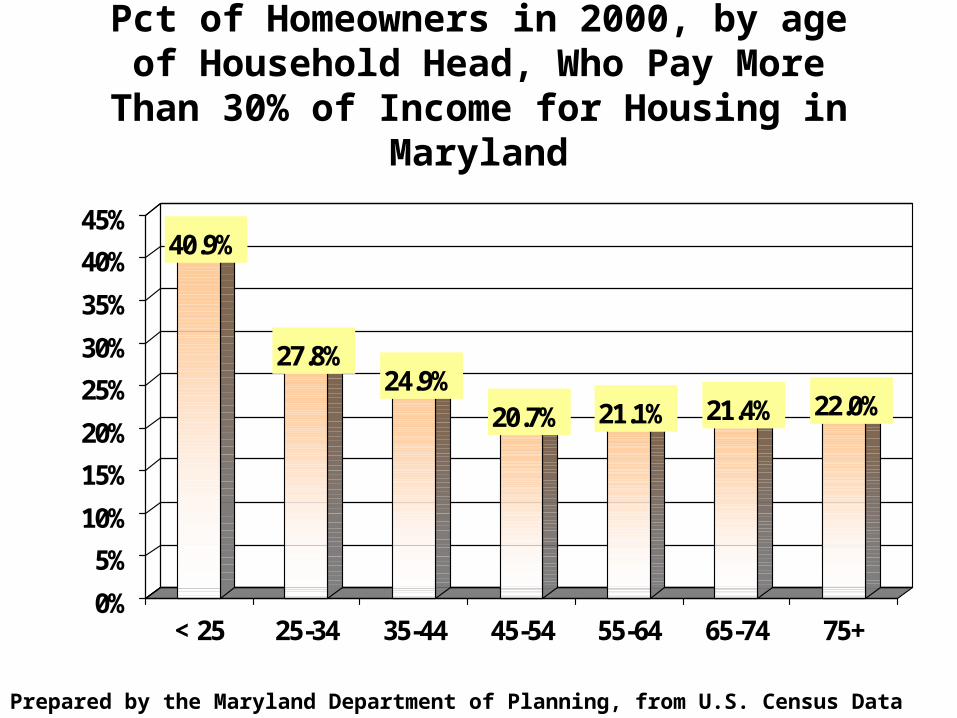
Pct of Homeowners in 2000, by age of Household Head, Who Pay More Than 30% of Income for
Housing in Maryland
40.9%
27.8%24.9%
20.7% 21.1% 21.4% 22.0%
0%
5%
10%
15%
20%
25%
30%
35%
40%
45%
< 25 25-34 35-44 45-54 55-64 65-74 75+
Prepared by the Maryland Department of Planning, from U.S. Census Data

Pct of Renters in 2000, by age of Household Head, Who Pay More Than 30% of Income for Housing
in Maryland
48.9%
31.6% 32.7% 31.8%
38.6%
48.5%
55.9%
0%
10%
20%
30%
40%
50%
60%
< 25 25-34 35-44 45-54 55-64 65-74 75+
Prepared by the Maryland Department of Planning, from U.S. Census Data

Characteristics of the Elderly
• Median Household Income & Poverty
• Percent of Income Spent on Housing
• Vehicle Availability
• Ability to Speak English
• Disability Status

Pct of Households in 2000, by age of Household Head, with No Vehicle Available in Maryland
19.4%
9.7% 8.5% 7.6%9.0%
13.6%
27.5%
0%
5%
10%
15%
20%
25%
30%
< 25 25-34 35-44 45-54 55-64 65-74 75+
Prepared by the Maryland Department of Planning, from U.S. Census Data

14.1%
15.2%
15.8%
15.9%
16.2%
17.2%
17.5%
17.5%
18.1%
19.3%
19.6%
44.5%
0% 5% 10% 15% 20% 25% 30% 35% 40% 45% 50%
Kent
Wicomico
Howard
Prince George's
Montgomery
Garrett
Baltimore
Dorchester
Washington
Somerset
Allegany
Baltimore City
Pct Age 65+ With No Vehicle Available by Jurisdiction – 2000
Prepared by the Maryland Department of Planning, from U.S. Census data

9.1%
9.6%
11.2%
11.7%
11.7%
11.7%
11.8%
12.2%
12.7%
13.0%
13.1%
14.1%
0% 5% 10% 15% 20% 25% 30% 35% 40% 45%
Queen Anne's
Calvert
Worcester
Talbot
Caroline
Carroll
St. Mary's
Anne Arundel
Charles
Harford
Frederick
Cecil
Pct Age 65+ With No Vehicle Available by Jurisdiction – 2000
Prepared by the Maryland Department of Planning, from U.S. Census data
continued
Characteristics of the Elderly
• Median Household Income & Poverty
• Percent of Income Spent on Housing
• Vehicle Availability
• Ability to Speak English
• Disability Status

Persons Who Speak English “Not Well” or “Not at All” by Age Group
13,604
82,946
14,706
0
20,000
40,000
60,000
80,000
100,000
5-17 18-64 65+
(1.4%) (2.5%) (2.5%)
Prepared by the Maryland Department of Planning, from U.S. Census Data

Persons Ages 65+ Who Speak English “Not Well or “Not at All”
1,334
668
1,597
1,942
2,244
6,921
0 2,000 4,000 6,000 8,000 10,000
Remainder
Howard
Baltimore City
Prince George's
Baltimore
Montgomery
Prepared by the Maryland Department of Planning, from U.S. Census Data

Characteristics of the Elderly
• Median Household Income & Poverty
• Percent of Income Spent on Housing
• Vehicle Availability
• Ability to Speak English
• Disability Status

Percent of Population Ages 65+ With a Reported Disability - 2000
41.9%39.8%
0%
10%
20%
30%
40%
50%
U.S. Maryland(Ranked 34th)
Prepared by the Maryland Department of Planning, from U.S. Census Data
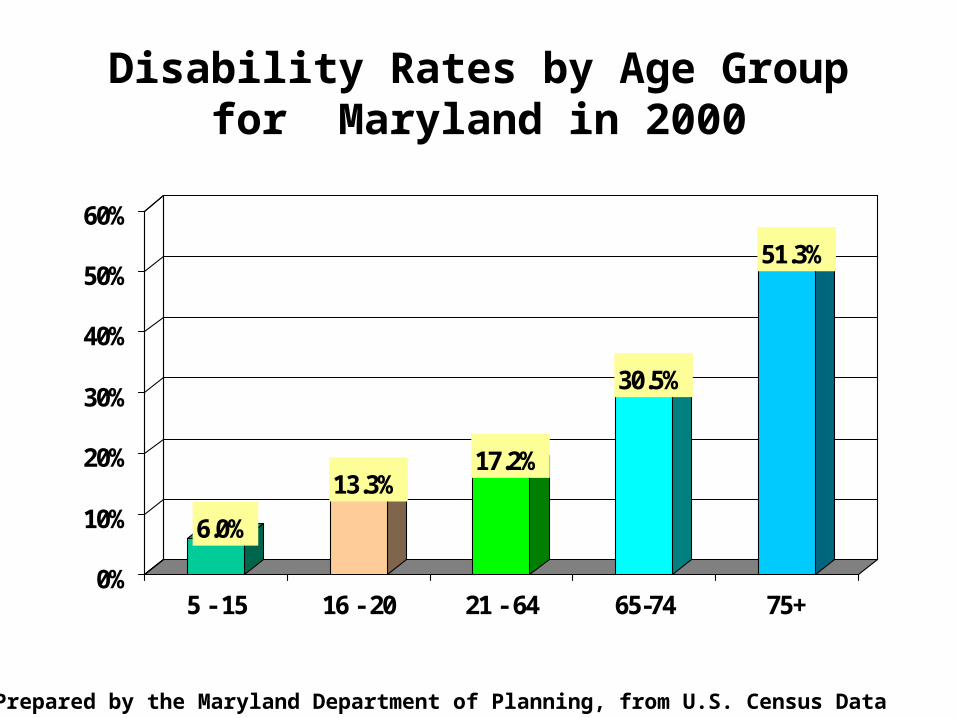
Disability Rates by Age Group for Maryland in 2000
6.0%
13.3%17.2%
30.5%
51.3%
0%
10%
20%
30%
40%
50%
60%
5 - 15 16 - 20 21 - 64 65-74 75+
Prepared by the Maryland Department of Planning, from U.S. Census Data

Type of Disabilities Reported in Maryland for Population Ages 65+ in 2000
71,858
153,499
0
50,000
100,000
150,000
200,000
Sensory Physical
Prepared by the Maryland Department of Planning, from U.S. Census Data

Disabilities Reported in Maryland by Activity Category in 2000 for Population Ages 65+
52,021
57,568
116,401
0 50,000 100,000 150,000
Self-care
Mental
Go-outside-home
Prepared by the Maryland Department of Planning, from U.S. Census Data

4,093
5,370
6,089
6,521
6,531
7,562
8,544
17,914
23,846
30,541
40,666
42,156
0 5,000 10,000 15,000 20,000 25,000 30,000 35,000 40,000 45,000
Wicomico
Allegany
Carroll
Howard
Frederick
Washington
Harford
Anne Arundel
Prince George's
Montgomery
Baltimore
Baltimore City
Population Age 65+ With Disabilities by Jurisdiction – 2000
Prepared by the Maryland Department of Planning, from U.S. Census data

1,316
1,562
1,644
1,679
1,836
2,158
2,281
2,358
2,716
3,306
3,373
3,833
0 5,000 10,000 15,000 20,000 25,000 30,000 35,000 40,000 45,000
Kent
Somerset
Caroline
Queen Anne's
Garrett
Dorchester
Calvert
Talbot
St. Mary's
Cecil
Worcester
Charles
Population Age 65+ With Disabilities by Jurisdiction – 2000
Prepared by the Maryland Department of Planning, from U.S. Census data
continued

39.6%
39.7%
40.0%
40.5%
41.0%
42.5%
42.5%
43.1%
43.1%
44.5%
47.2%
51.2%
0% 10% 20% 30% 40% 50% 60%
Harford
Carroll
Prince George's
Wicomico
Dorchester
Allegany
Charles
Washington
Caroline
Garrett
Somerset
Baltimore City
Percent Age 65+ With Disabilities by Jurisdiction – 2000
Prepared by the Maryland Department of Planning, from U.S. Census data

32.7%
33.5%
35.7%
36.1%
37.1%
37.2%
37.3%
37.5%
38.0%
38.1%
38.2%
39.1%
0% 10% 20% 30% 40% 50% 60%
Montgomery
Queen Anne's
Talbot
Calvert
Frederick
Worcester
Howard
St. Mary's
Anne Arundel
Baltimore
Kent
Cecil
Percent Age 65+ With Disabilities by Jurisdiction – 2000
Prepared by the Maryland Department of Planning, from U.S. Census data
continued

Characteristics of the Elderly
• Median Household Income & Poverty
• Percent of Income Spent on Housing
• Vehicle Availability
• Ability to Speak English
• Disability Status

Elderly Population Projections for Maryland
• Total Elderly Population
• Elderly Share of Total Population
• Implications - Disability
• Dependent Populations
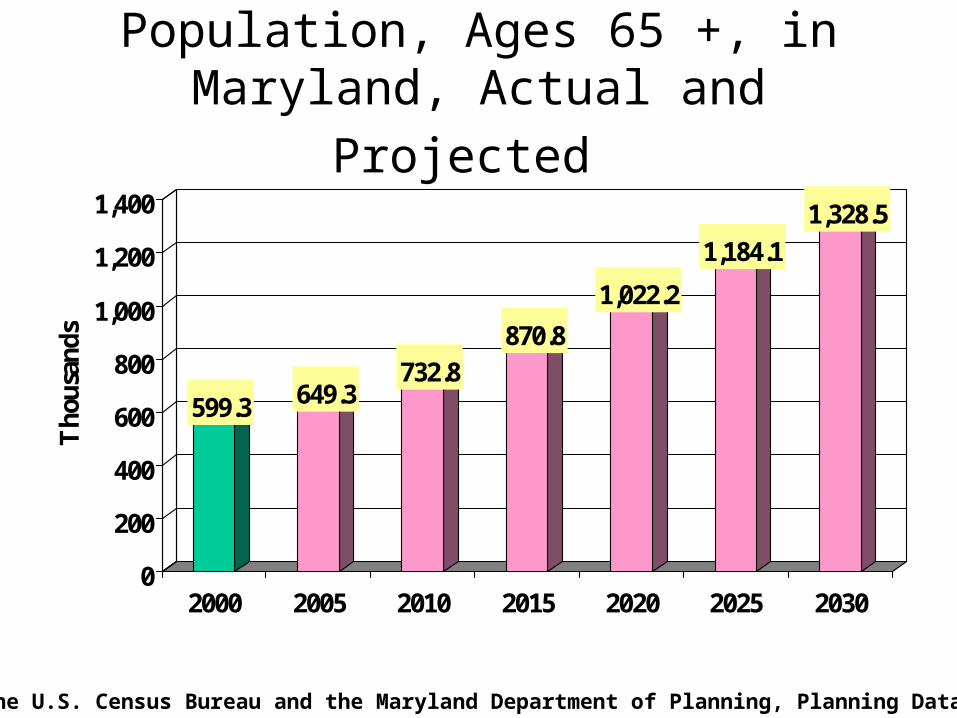
Population, Ages 65 +, in Maryland,
Actual and Projected
599.3 649.3732.8
870.8
1,022.2
1,184.1
1,328.5
0
200
400
600
800
1,000
1,200
1,400
Tho
usan
ds
2000 2005 2010 2015 2020 2025 2030
Source: The U.S. Census Bureau and the Maryland Department of Planning, Planning Data Services

Change in Maryland Population,
Ages 65 +
84,963
133,544
289,285306,372
0
50,000
100,000
150,000
200,000
250,000
300,000
350,000
1990-2000 2000-2010 2010-2020 2020-2030
Source: The U.S. Census Bureau and the Maryland Department of Planning, Planning Data Services

Projected Population Gain in Maryland, 2000–2030(Ages 0-64 and 65 +)
336.4
729.2
0
200
400
600
800
Th
ousa
nd
s
0 - 64 65+
Source: The Maryland Department of Planning, Planning Data Services

Historical and Projected Population, Ages 65+ for Maryland
10.8% 11.3%12.8%
16.7%
20.9%
0%
5%
10%
15%
20%
25%
1990 2000 2010 2020 2030
Source: The U.S. Census Bureau and the Maryland Department of Planning, October 2002

13.1%
14.1%
14.1%
14.4%
14.6%
14.8%
17.9%
18.0%
19.2%
21.2%
22.5%
23.6%
0% 5% 10% 15% 20% 25%
Carroll
Caroline
Somerset
Queen Anne's
Washington
Baltimore
Allegany
Garrett
Dorchester
Kent
Talbot
Worcester
Projected Percent Population Age 65+ by Jurisdiction – 2010
Source: Maryland Department of Planning, Planning Data Services

9.9%
10.5%
10.8%
10.8%
11.2%
11.4%
11.6%
12.6%
12.8%
12.9%
13.0%
13.0%
0% 5% 10% 15% 20% 25%
Prince George's
Howard
Frederick
Charles
Calvert
Cecil
St. Mary's
Baltimore City
Wicomico
Anne Arundel
Harford
Montgomery
Projected Percent Population Age 65+ by Jurisdiction – 2010
Source: Maryland Department of Planning, Planning Data Services
continued

17.4%
17.6%
17.8%
18.3%
18.5%
18.5%
20.1%
21.5%
22.5%
23.7%
26.0%
27.9%
28.1%
0% 5% 10% 15% 20% 25% 30%
Washington
Carroll
Harford
Queen Anne's
Baltimore
Anne Arundel
Allegany
Allegany
Garrett
Dorchester
Kent
Talbot
Worcester
Projected Percent Population Age 65+ by Jurisdiction – 2020
Source: Maryland Department of Planning, Planning Data Services

13.7%
14.4%
14.8%
14.9%
15.1%
15.3%
15.6%
15.7%
16.7%
17.2%
17.3%
17.4%
17.4%
0% 5% 10% 15% 20% 25% 30%
Prince George's
Frederick
Charles
Baltimore City
Cecil
Howard
Wicomico
St. Mary's
Calvert
Somerset
Montgomery
Caroline
Washington
Projected Percent Population Age 65+ by Jurisdiction – 2020
Source: Maryland Department of Planning, Planning Data Services
continued

22.3%
22.5%
22.6%
23.3%
23.3%
24.0%
24.0%
27.9%
29.5%
32.2%
32.8%
33.3%
0% 5% 10% 15% 20% 25% 30% 35%
Baltimore
Allegany
Carroll
Calvert
Harford
Queen Anne's
Anne Arundel
Garrett
Dorchester
Kent
Worcester
Talbot
Projected Percent Population Age 65+ by Jurisdiction – 2030
Source: Maryland Department of Planning, Planning Data Services

17.5%
17.7%
18.2%
18.3%
19.0%
19.2%
20.2%
20.8%
21.2%
21.4%
21.6%
21.6%
0% 5% 10% 15% 20% 25% 30% 35%
Baltimore City
Prince George's
Wicomico
Frederick
Cecil
Charles
Howard
Somerset
Washington
St. Mary's
Montgomery
Caroline
Projected Percent Population Age 65+ by Jurisdiction – 2030
Source: Maryland Department of Planning, Planning Data Services
continued
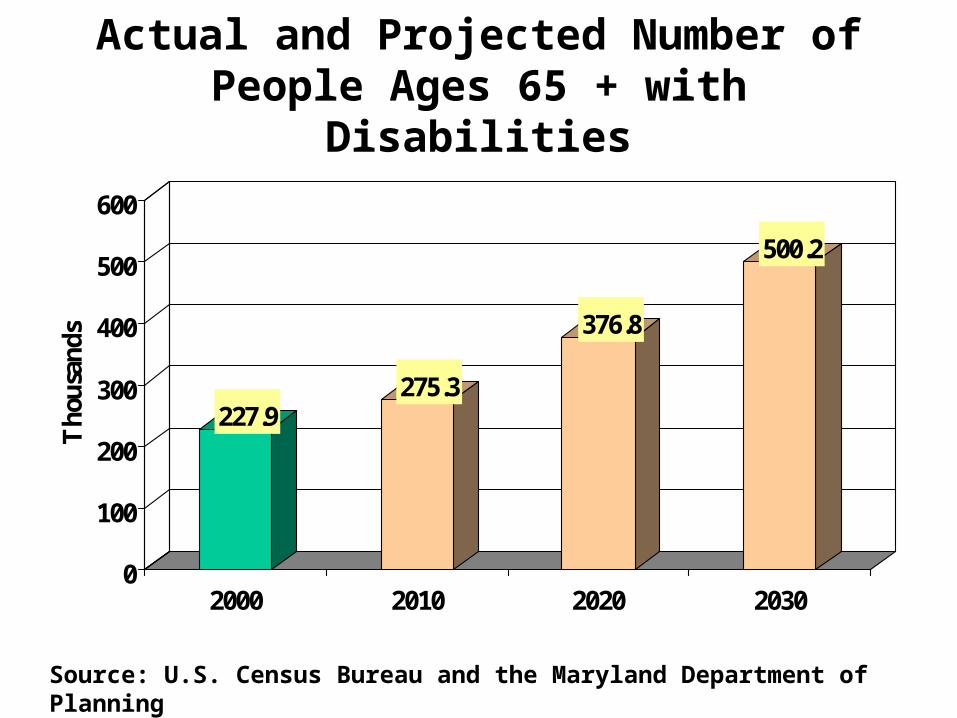
Actual and Projected Number of People Ages 65 + with Disabilities
227.9275.3
376.8
500.2
0
100
200
300
400
500
600
Tho
usan
ds
2000 2010 2020 2030
Source: U.S. Census Bureau and the Maryland Department of Planning

Dependency Ratios for Maryland *
10
20
30
40
50
60
70
1990 2000 2010 2020 2030
Total Youth Elderly
•Pop < 16/pop16-64 x100 = youth dependency ratio
•Pop 65+/pop16-64x100 = elderly dependency ratioSource: Maryland Department of Planning, Planning Data Services

Maryland State Data CenterMaryland State Data Center
Website:
www.mdp.state.md.us/msdc
Mark Goldstein
410-767-4454


