THE ESSENTIAL OIL FROM PEEL AND FLOWER OF CITRUS MAXIMA
By
Napaporn Thavanapong
A Thesis Submitted in Partial Fulfillment of the Requirements for the Degree
MASTER OF PHARMACY
Program of Pharmacognosy
Graduate School
SILPAKORN UNIVERSITY
2006
น้ํามันหอมระเหยจากเปลือกผลและดอกของสมโอ
โดย
นางนภาภรณ ธาวนพงษ
วิทยานิพนธนี้เปนสวนหนึ่งของการศึกษาตามหลักสูตรปริญญาเภสัชศาสตรมหาบัณฑิต
สาขาวิชาเภสชัเวท
บัณฑิตวิทยาลยั มหาวิทยาลยัศิลปากร
ปการศึกษา 2549
ลิขสิทธิ์ของบัณฑิตวิทยาลัย มหาวิทยาลัยศลิปากร
The graduate school, Silpakorn University accepted thesis entitled “THE
ESSENTIAL OIL FROM PEEL AND FLOWER OF CITRUS MAXIMA” by
Napaporn Thavanapong in partial fulfillment of the requirements for the degree of
master of pharmacy, program of pharmacognosy.
.…..……………………………………..
(Assoc.Prof. Sirichai Chinatankul, Ph.D.)
Dean of Graduate School
.............../.............../……………
Thesis advisors
1. Asst. Prof. Penpun Wetwitayaklung, Ph.D.
2. Dr. Juree Charoenteeraboon, Ph.D.
Thesis committee
………………………………Chairman
(Assoc. Prof. Uthai Sotanaphun, Ph.D.)
.............../.............../……………
.................................................Member ….............................................Member
(Asst. Prof. Penpun Wetwitayaklung, Ph.D.) (Dr. Juree Charoenteeraboon, Ph.D.)
.............../.............../…………… .............../.............../……………
.................................................Member .................................................Member
(Asst. Prof. Malai Satiraphan) (Assoc. Prof. Nijsiri Ruangrungsi, Ph.D.)
.............../.............../…………… .............../.............../…………….
iv
47357201 : สาขาวิชาเภสัชเวท คําสําคัญ : น้ํามันหอมระเหย / CITRUS MAXIMA / สมโอ / น้ํามันดอกสม / การสกัดดวย คารบอนไดออกไซดในสภาวะของไหลยิ่งยวด / การกลั่นดวยไอน้ําในสภาวะควบคุม ความดัน / ฤทธิ์ตานเชื้อจุลชีพ นภาภรณ ธาวนพงษ : น้ํามันหอมระเหยจากเปลือกผลและดอกสมโอ อาจารยผูควบคุมวิทยานิพนธ : ผศ.ดร. เพ็ญพรรณ เวชวิทยาขลัง และ ดร. จุรีย เจริญธีรบูรณ. 122 หนา. เปลือกผลและดอกสมโอ (Citrus maxima Merr.) พันธุขาวใหญ จากอําเภอบางคนที จังหวดัสมุทรสงคราม ประเทศไทย ถูกนาํมาเตรียมน้ํามนัหอมระเหย โดยน้ํามันจากเปลือกผลสมโอไดจากการเตรียมดวยการบีบเย็น (CP) การกลั่นดวยไอน้ําในสภาวะควบคุมความดัน (VP) และการสกัดดวยคารบอนไดออกไซดในสภาวะของไหลยิ่งยวด (SCP) เมื่อวิเคราะหหาองคประกอบทางเคมีของน้ํามันหอมระเหยดวยแกสโครมาโตรกราฟฟและแกสโครมาโตรกราฟ-แมสสเปกโตรมิเตอร ผานแคปปลาร่ีคอลัมนสองชนิดคอื DB-5 และ carbowax พบสารที่เปนองคประกอบทางเคมีหลักในน้ํามันหอมระเหยทั้งสามชนิดคือ limonene, myrcene, β-pinene, α-pinene, sabinene,
linalool เปนตน น้ํามนัหอมระเหยดอกสมโอสกัดดวยคารบอนไดออกไซดในสภาวะของไหลยิ่งยวด (SC-f) พบ limonene ในปริมาณสูง แตมีสารกลุมออกซิจิเนเทต คอมพาวดโดยรวม ในปริมาณที่นอยกวาเมื่อเปรยีบเทียบกับน้ํามนัหอมระเหยดอกสม (neroli) ที่ไดจากการสกัดดอก
Citrus aurantium var. amara และน้ํามันหอมระเหยดอกสมโอทีไ่ดจากการกลัน่ดวยไอน้ํา จากรายงานกอนหนานี ้ น้ํามันหอมระเหย SCP และ SC-f สามารถยับยั้งการเจริญเติบโตของเชื้อ S.
aureus ที่ความเขมขนต่ําสุด (MIC) เทากับ 2.5 µl/ml ในขณะที่ neroli สามารถยับยั้งได 50% แต CP และ VP ไมมีฤทธิ์ที่ความเขมขนเดยีวกัน น้ํามันหอมระเหยทุกตวัอยางไมสามารถยับยั้ง E. coli ในขณะที่ SCP, SC-f และ neroli ยับยั้ง C. albican ได 50% ที่ความเขมขน 2.5 µl/ml ______________________________________________________________________________ สาขาวิชาเภสชัเวท บัณฑิตวทิยาลัย มหาวทิยาลัยศิลปากร ปการศึกษา 2549 ลายมือช่ือนักศึกษา ……………………………………………….. ลายมือช่ืออาจารยผูควบคุมวทิยานิพนธ 1. ……………………...… 2. ………………………….
v
47357201 : MAJOR : PHARMACOGNOSY
KEY WORDS : ESSENTIAL OIL/ CITRUS MAXIMA/ POMELO/ NEROLI/
SUPERCRITICAL CARBON DIOXIDE/ VACUUM STEAM
DISTLLATION/ ANTIMICROBIAL
NAPAPORN THAVANAPONG : THE ESSENTIAL OIL FROM PEEL AND
FLOWER OF CITRUS MAXIMA. THESIS ADVISORS : ASST. PROF. PENPUN
WETWITAYAKLUNG, Ph.D., JUREE CHAROENTEERABOON, Ph.D., 122 pp.
The peel and flower of Citrus maxima Merr. cultivar khao–yai were
collected from Bangkontee District, Samutsongkarm Province of Thailand. The peel
oils of C. maxima were prepared by cold pressing (CP), vacuum steam distillation
(VP) and supercritical carbon dioxide extraction (SCP) methods. The major
compounds that were detected in SCP, CP and VP essential oils by GC and GC-MS
analysis using DB-5 and carbowax capillary column were limonene, myrcene, β-
pinene, α-pinene, sabinene, linalool etc. C. maxima flower which was extracted by
supercritical carbon dioxide extraction (SC-f) showed higher content of limonene, but
less total oxygenated compounds than commercial neroli derived from Citrus
aurantium var. amara and steam distillation C. maxima flower oil from the previous
reports. SCP and SC-f showed antimicrobial activity against S. aureus at the same
minimum inhibitory concentration (MIC) equaled to 2.5 µl/ml. Neroli showed 50%
inhibition for S. aureus at 2.5 µl/ml whereas CP and VP did not active. All of the oil
samples could not inhibit the growth of E. coli, while SCP, SC-f and neroli at the
concentration of 2.5 µl/ml presented 50% inhibition against C. albican.
Program of Pharmacognosy Graduate School, Silpakorn University Academic Year 2006
Student’s signature …………………………..………..…
Thesis Advisors’s signature 1. …..……………………… 2. …………………………….…
vi
ACKNOWLEDGEMENTS
I would like to thank Assoc. Prof. Dr. Uthai Sotanaphun, Asst. Prof. Dr.
Wandee Yanpaisan and Asst. Dr. Chavalit Sittisombut for giving me a chance to
study in the Master degree of Pharmacognocy. I deeply thank all professors who
taught me at the Faculty of Pharmacy, Silpakorn University, especially the deparment
of Pharmacognocy, Pharmaceutical Chemistry, Pharmaceutical Technology and
Biopharmaceutical.
I would like to specially thank my dear advisor, Asst. Prof. Dr. Penpun
Wetwitayaklung and Dr. Juree Charoenteeraboon, who gave me an opportunity to
learn more about my interesting topic and early financial support. I am very
impressing of their kindness and patient for guiding me to solve all problems during
the trouble periods. I am very grateful to them for their great advice and moral
support.
I am indebted to the thesis defense committee for the comments and
suggestion, especially Assoc. Prof. Dr. Nijsiri Ruangrungsi, Department of
Pharmacognosy, Faculty of Pharmaceutical Science, Chulalongkorn Univesity, who
spent valuable time to be the external examiner and kind advice. I also thank Asst.
Prof. Malai Satiraphan, Department of Pharmceutical Chemistry, Faculty of
Pharmacy, Silapakorn Univesity, for spending their valuable time on my thesis
examination and their kindness and helpfulness for gas chromatography analysis.
I would like to thank Mr. Somnuek Suchaitanavanit, Thai Traditional and
Herbal Development Center, module 1, Biotechnology Pilot Plant, Thailand Science
Park, Klong 1, Klongluang, Pathumtani, who let me used the supercritical carbon
dioxide extractor in pilot-scale and vacuum steam distillatory equipment for essential
oil extraction and some raw materials.
I would like to thank the scientist at the Faculty of Pharmacy, Silapakorn
University for their helpful assistance of using the all equipments.
I also would like to acknowledge several friends, Mrs. Nuch Pojchaijongdee,
Mr. Lersak Prachuabaree and Ms. Tasamaporn Sukwattanasinit for their
encouragement, helpfulness and kindness advice.

vii
Moreover, I am pleasure to thank my family for their love and understanding
for solving problems together.
Finally, I thank the Lord who bring me pass all situations and support me all
things that I need in this education.
viii
CONTENTS
Page
THAI ABSTRACT ..………………………………………………………… iv
ENGLISH ABSTRACT…………………..…………………………………. v
ACKNOWLEDGEMENTS………………………………………………….. vi
LIST OF TABLES……………………………………………………............ x
LIST OF FIGURES…………………………………………………………... xii
LIST OF ABBREVIATIONS………………………………………………... xvii
CHAPTER
I. INTRODUCTION……………………………………………………. 1
II. LITERATURE REVIEW…………………………………………….. 4
1. Citrus maxima…….……………………………………………….. 4
2. Chemical constituents of C. maxima……......................................... 6
3. Biological activities of C. maxima…….…………………………… 20
4. Essential oil from Citrus spp………………………………………. 23
4.1 Preparation of Citrus essential oil…………………………….. 25
4.1.1 Cold pressing method……………………………………. 25
4.1.2 Steam distillation…………………………………............ 26
4.1.3 Enfleurage………………………………………………... 26
4.1.4 Solvent extraction………………………………………... 27
4.1.5 Supercritical carbon dioxide extraction………………….. 27
III. MATERIALS AND METHODS…………………………………….. 30
1. Plant materials……………………………………………………... 30
2. Extraction methods………………..…………….…………………. 30
2.1 Supercritical carbon dioxide extraction…………….………… 30
2.2 Vacuum steam distillation……………………………………. 31
2.3 Cold pressing method………………………………………… 31
ix
CONTENTS (CONTINUED)
Page
3. Analysis……………………………………………………………. 32
3.1 Physical properties……….…………………………………… 32
3.1.1 Density………………………………………………….. 32
3.1.2 Optical rotation ………………………………………… 32
3.1.3. Refractive index……………………………………….. 33
3.2 Chemical characteristics……………………………………… 33
3.2.1 Infrared absorption spectra………………………………. 33
3.2.2 Gas chromatography (GC)………………………………. 33
3.2.3 Gas chromatography-Mass spectroscopy (GC-MS)……... 36
4. Anti-microbial activity…………………………………………….. 39
4.1 Assay medium requirements………………………………….. 39
4.2 Test microorganism…………………………………………… 39
4.3 Microdilution plate……………………………………………. 39
4.4 Microplate reader……………………………………………… 39
4.5 Microdilution method for anti-microbial assay……………….. 40
IV. RESULTS AND DISCUSSION…………………………………………. 41
1. Extraction………………………………………………………….. 41
2. Physical and chemical characteristics…………………………….... 43
3. GC method validation and quantification………………………….. 44
3.1 GC method validation…………………………………………. 44
3.2 Quantification………………………………............................. 45
4. Anti-microbial activity…………………………………………….. 66
V. CONCLUSIONS………………………………………………………….. 68
REFERENCES……………………………………………………………….. 70
APPENDIX : FIGURES………………………………………………….…... 78
VITA………………………………………………………………………….. 122
x
LIST OF TABLES
Table Page
1 Chemical constituents of C. maxima……………………………….. 7
2 Biological activities of C. maxima…………………………………. 21
3 The operating condition of GC…………………………………….. 36
4 The operating condition of GC-MS………………………………… 37
5 Physical properties of essential oils from C. maxima peel
and flower, and neroli……………………………………........ 43
6 Result of method validation for GC………………………………… 46
7 The amount of some important compounds in essential oil samples
analysed by using DB-5 capillary column and GC…...……… 46
8 Qualitative and quantitative analysis of C. maxima peel essential oil
analysed by using DB-5 capillary column……………………. 47
9 Qualitative and quantitative analysis of C. maxima peel essential oil
analysed by using carbowax capillary column……………….. 49
10 Classification of the chemical compositions of C. maxima peel,
flower essential oils and neroli……………………………….. 53
11 The chemical compositions of C. maxima peel, flower
essential oils and neroli……………………………………….. 56
12 Qualitative and quantitative analysis of
C. maxima flower essential oil (SC-f) and
C. aurantium var amara (neroli)
analysed by using DB-5 capillary column……………………. 57
13 Qualitative and quantitative analysis of
C. maxima flowers essential oil (SC-f) and
C. aurantium var amara (neroli)
analysed by using carbowax capillary column……………….. 59
14 Comparison between the C. maxima Merr. flower essential oil
from Vietnam and SC-f……………………………………….. 63
15 Comparison of main components in Citrus flower essential oil……. 66
xi
LIST OF TABLES (CONTINUED)
Table Page
16 Minimum inhibitory concentrations (MIC) of essential oil
from peel, flower of C. maxima and neroli…………………... 67
xii
LIST OF FIGURES
Figure Page
1 Monoterpenes and sesquiterpenes isolated from C. maxima………. 16
2 Pressure-temperature phase diagram……………………………….. 79
3 C. maxima cultivar khao-yai fruit and flowers from
Bangkontee District, Samutsongkharm Province of Thailand… 79
4 C. maxima dry peel…………………………………………………. 79
5 C. maxima fresh peel……………………………………………….. 79
6 The pilot scale of supercritical carbon dioxide extractor
at Thai Traditional and Herbal Development Center………… . 80
7 The pilot scale of vacuum steam distillation apparatus
at Thai Traditional and Herbal Development Center…………. 80
8 SCP : oil derived from C. maxima peel,
extracted by supercritical carbon dioxide…………………….. 81
9 CP : oil derived from C. maxima peel,
extracted by cold pressing method…………………………… 81
10 VP : oil derived from C. maxima peel,
extracted by vacuum steam distillation…….………………… 81
11 SC-f : oil derived from C. maxima flower,
extracted by supercritical carbon dioxide…………………….. 81
12 neroli : oil derived from C. aurantium var.amara,
extracted by organic solvent. ……………..…………………... 81
13 Calibration curve of limonene analysed by using DB-5 …………… 82
14 Calibration curve of linalool analysed by using DB-5 …………….. 82
15 Calibration curve of (E)-nerolidol analysed by using DB-5……….. 83
16 Calibration curve of (Z,E)- and (Z,Z)-farnesol
analysed by using DB-5 ………………………………………. 83
17 Calibration curve of (E,E)- and (E,Z)-farnesol
analysed by using DB-5 …………… ……………………..…. 84
xiii
LIST OF FIGURES (CONTINUED)
Figure Page
18 Calibration curve of limonene analysed by using carbowax ………. 84
19 IR spectrum of essential oil derived from C. maxima peel, extracted by
supercritical carbon dioxide : SCP…………………………… 85
20 IR spectrum of essential oil derived from C. maxima peel, extracted by
cold pressing method : CP……………………………………. 85
21 IR spectrum of essential oil derived from C. maxima peel, extracted by
steam distillation : VP………………………………………… 86
22 IR spectrum of essential oil derived from C. maxima flower, extracted by
supercritical carbon dioxide : SC-f…………………………..... 86
23 IR spectrum of essential oil derived from C. aurantium var. amara,
extracted by organic solvent : neroli…………………………. 87
24 GC chromatogram of C.maxima peel essential oil from
supercritical carbon dioxide extraction (SCP)
analysed by using DB-5 ……………………………………… 88
25 GC chromatogram of C.maxima peel essential oil from
cold pressing method (CP) analysed by using DB-5 ………… 89
26 GC chromatogram of C.maxima peel essential oil from
vacuum steam distillation (VP) analysed by using DB-5 ……. 90
27 GC chromatogram of C.maxima peel essential oil from
supercritical carbon dioxide extraction (SCP)
analysed by using carbowax …………………………………. 91
28 GC chromatogram of C.maxima peel essential oil from
cold pressing method (CP) analysed by using carbowax ......... 92
29 GC chromatogram of C.maxima peel essential oil from
vacuum steam distillation (VP) analysed by using carbowax… 93
30 GC chromatogram of C.maxima flower essential oil from
supercritical carbon dioxide extraction (SC-f)
analysed by using DB-5 ……………………………………… 94
xiv
LIST OF FIGURES (CONTINUED)
Figure Page
31 GC chromatogram of C. aurantium var. amara flower essential oil
from solvent extraction (neroli) analysed by using DB-5 …… 95
32 GC chromatogram of C.maxima flower essential oil from
supercritical carbon dioxide extraction (SC-f)
analysed by using carbowax ………………………………….. 96
33 GC chromatogram of C. aurantium var. amara flower essential oil
from solvent extraction (neroli) analysed by using carbowax… 97
34 Mass spectrum of identified benzyl benzoate……………………… 98
35 Mass spectrum of identified bicyclogermacrene…………………… 98
36 Mass spectrum of identified δ-(+)-cadinene……………………….. 98
37 Mass spectrum of identified camphene…………………………….. 99
38 Mass spectrum of identified carbitol……………………………….. 99
39 Mass spectrum of identified (E)-(+)-carveol……………………….. 99
40 Mass spectrum of identified (Z)-(+)-carveol……………………….. 100
41 Mass spectrum of identified caryophyllene oxide………………….. 100
42 Mass spectrum of identified β-caryophyllene……………………… 100
43 Mass spectrum of identified citronellal…………………………….. 101
44 Mass spectrum of identified citronellol……………………………. 101
45 Mass spectrum of identified α –copaene…………………………… 101
46 Mass spectrum of identified β-copaene……………………………. 102
47 Mass spectrum of identified β-cubebene…………………………... 102
48 Mass spectrum of identified p-cymene…………………………….. 102
49 Mass spectrum of identified n-decanal…………………………...... 103
50 Mass spectrum of identified dihydrolinalyl acetate………………… 103
51 Mass spectrum of identified dodecanal…………………………….. 103
52 Mass spectrum of identified β-(-)-elemene………………………… 104
53 Mass spectrum of identified δ-elemene……………………………. 104
54 Mass spectrum of identified (E,E)-α –farnesene…………………… 104
55 Mass spectrum of identified farnesol………………………………. 105
xv
LIST OF FIGURES (CONTINUED)
Figure Page
56 Mass spectrum of identified geranial……………………………….. 106
57 Mass spectrum of identified geraniol……………………………….. 106
58 Mass spectrum of identified geranyl acetate………………………... 106
59 Mass spectrum of identified geranyl formate………………………. 107
60 Mass spectrum of identified germacrene B………………………… 107
61 Mass spectrum of identified germacrene D……………………….... 107
62 Mass spectrum of identified germacrene D-4-ol…………………… 108
63 Mass spectrum of identified α –humulene…………………………. 108
64 Mass spectrum of identified indole………………………………… 108
65 Mass spectrum of identified R-(+)-limonene………………………. 109
66 Mass spectrum of identified (E)-(+)-limonene oxide……………… 109
67 Mass spectrum of identified (Z)-(-)-limonene oxide………………. 109
68 Mass spectrum of identified linalool………………………………. 110
69 Mass spectrum of identified (Z)-(-)-linalool oxide………………… 110
70 Mass spectrum of identified (E)-(+)-linalool oxide………………… 110
71 Mass spectrum of identified linalyl acetate……………………........ 111
72 Mass spectrum of identified methyl antranilate……………………. 111
73 Mass spectrum of identified methyl benzoate……………………… 111
74 Mass spectrum of identified myrcene………………………………. 112
75 Mass spectrum of identified neral…………………………………... 112
76 Mass spectrum of identified nerol………………………………….. 112
77 Mass spectrum of identified (E)-nerolidol………………………….. 113
78 Mass spectrum of identified neryl acetate………………………….. 113
79 Mass spectrum of identified (+)-nootkatone……………………….. 113
80 Mass spectrum of identified (Z )-β-ocimene……………………….. 114
81 Mass spectrum of identified (E)-β-ocimene………………………... 114
82 Mass spectrum of identified perilla aldehyde………………………. 114
xvi
LIST OF FIGURES (CONTINUED)
Figure Page
83 Mass spectrum of identified α –phellandrene……………………… 115
84 Mass spectrum of identified phenyl ethyl alcohol…………………. 115
85 Mass spectrum of identified α -(-)-pinene………………………….. 115
86 Mass spectrum of identified β-(+)-pinene………………………..… 116
87 Mass spectrum of identified sabinene……………………………… 116
88 Mass spectrum of identified (Z)-sabinene hydrate…………………. 116
89 Mass spectrum of identified α -(-)-selinene………………………... 117
90 Mass spectrum of identified β -(+)-selinene……………………….. 117
91 Mass spectrum of identified (+)-spathulenol………………………. 117
92 Mass spectrum of identified terpinen-4-ol………………………….. 118
93 Mass spectrum of identified γ –terpinene…………………………... 118
94 Mass spectrum of identified α –terpineol…………………………… 118
95 Mass spectrum of identified γ –terpineol…………………………… 119
96 Mass spectrum of identified terpinolene……………………………. 119
97 Mass spectrum of identified α –terpinyl acetate……………………. 119
98 Mass spectrum of identified tetradecanal…………………………… 120
99 Mass spectrum of identified α –thujene…………………………….. 120
100 Mass spectrum of identified 2-(formylamino)-benzoate…………… 120
101 Mass spectrum of identified 3,7-dimethyl-2,6-octadien-1-ol………. 121
102 Mass spectrum of identified 3,7-dimethyl-1,5-octadien-3,7-diol….. 121
103 Mass spectrum of identified unknown from lime oil………………. 121
xvii
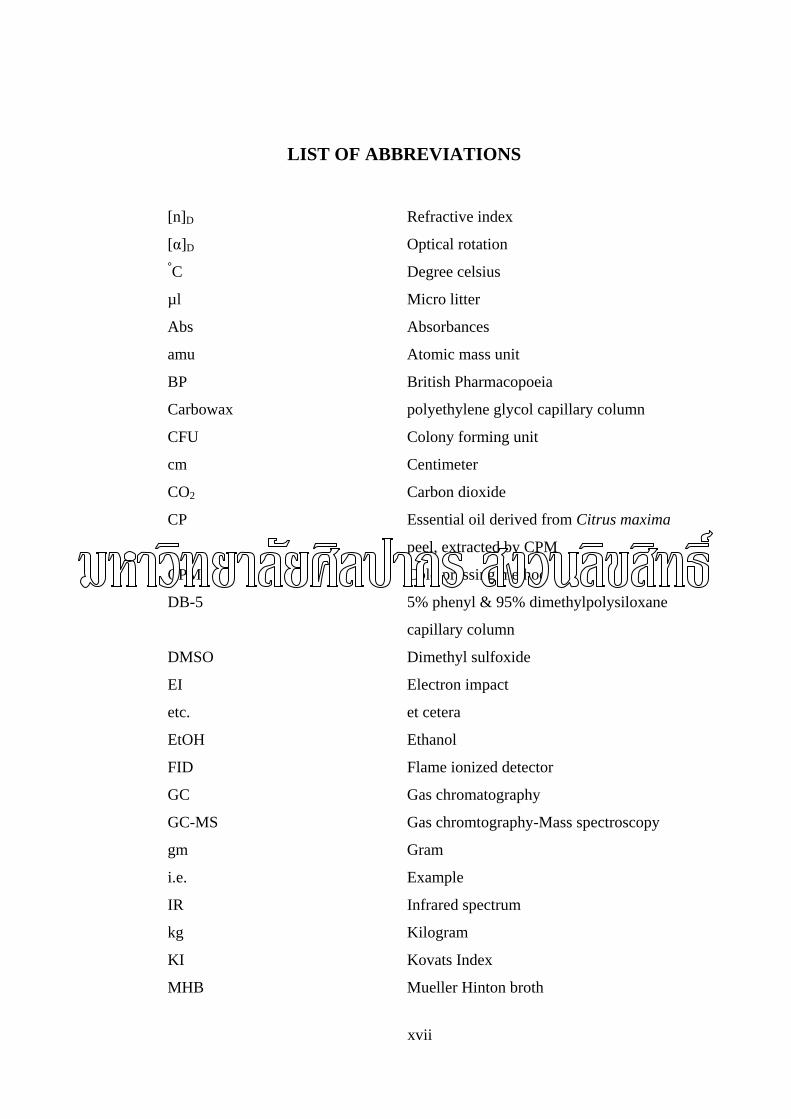
LIST OF ABBREVIATIONS
[n]D Refractive index
[α]D Optical rotation
°C Degree celsius
µl Micro litter Abs Absorbances amu Atomic mass unit
BP British Pharmacopoeia Carbowax polyethylene glycol capillary column
CFU Colony forming unit
cm Centimeter
CO2 Carbon dioxide
CP Essential oil derived from Citrus maxima
peel, extracted by CPM CPM Cold pressing method DB-5 5% phenyl & 95% dimethylpolysiloxane
capillary column
DMSO Dimethyl sulfoxide EI Electron impact
etc. et cetera
EtOH Ethanol FID Flame ionized detector
GC Gas chromatography GC-MS Gas chromtography-Mass spectroscopy
gm Gram
i.e. Example
IR Infrared spectrum
kg Kilogram
KI Kovats Index
MHB Mueller Hinton broth
xviii
LIST OF ABBREVIATIONS (CONTINUED)
MIC Minimum inhibitory concentration
min Minute
ml Millimeter
MPa Mega pascal
N/S Not state
neroli Essential oil derived from Citrus aurantium
var. amara, extracted by organic solvent, from Italy (commercial product)
ng Nano gram
nm Nano meter
OV-1 100% dimethylpolysiloxane capillary column
ppm Part per million
Psi Pound per square inch
r2 Correlation coefficient
RI Retention index
rpm round per minute
RSD Relative standard deviation
Rt Retention time
SCF Essential oil derived from Citrus maxima
flower, extracted by SCO2
SCO2 Supercritical carbon dioxide extraction
SCP Essential oil derived from Citrus maxima
peel, extracted by SCO2
SD Standard deviation
SDA Sabouraud dextrose agar
spp. Species
TSA Tryptic soy agar
TSB Tryptic soy broth
xix
LIST OF ABBREVIATIONS (CONTINUED)
TTHD Thai Traditional and Herbal Development
Center
USA United State of America
v/w Volume by weight
VP Essential oil derived from Citrus maxima
peel, extracted by VSD
VSD Vacuum steam distillation
1
CHAPTER I
INTRODUCTION
The pomelo (Citrus maxima Merr.), a native plant of Asia, which is best
cultivated in China, southern Japan, Vietnam, Malaysia, Indonesia and Thailand. The
fruit of pomelo is commonly eaten fresh or made as juice. It is also popular for jam
and syrup. In traditional medicine, the fruit peel has been used for cough, swellings,
and epilepsy, because of the effectiveness of the volatiles.1 The middle layer (albedo)
of fruit peel is extracted for pectin which is used as dietary fiber for reducing body
weight.2
The Citrus species are famous for the source of essential oils. C. maxima is
the same as other Citrus species that contains essential oil glands in their fruit peel
and flower petals. The Citrus peel oils have a strong and desirable aroma with
refreshing effect. They have been used as flavoring in foods, beverages and
pharmaceutical products. They also have been used as fragrance in perfumes,
cosmetic and aromatherapy. The Citrus flower oils have the relaxing and hormone
balancing effects which have been used in aromatherapy and perfumery.3, 4
In Thailand, there are lots of cultivar of C. maxima such as khao-num-puang,
khao-poung and khao-yai which are popular as fresh eating. The C. maxima is peeled
for their fresh pulp and juice that are sold both in Thailand and foreign countries. The
high demand of pomelo in the market causes around one metric ton of the peel left as
by products in each day. These wastes could be served as raw materials for essential
oil industries. So the study of C. maxima peel essential oil could increase the value of
the useless waste.
The extraction methods of Citrus essential oil are important, since these oils
are very sensitive to heat. The old classical method used only for Citrus peel extract is
cold pressing method. The smell of cold press oil is naturally, but contains a lot of
impurities. The second classical method for essential oil extraction is steam
distillation. This method is universal for most volatile oil extraction. It is an easy

2
method and gives pure essential oil separated from water. However, this method is
used high temperature which some chemicals in essential oil may be volatile,
especially Citrus oils. Some chemicals of Citrus oils are changed their structure by
heat. Therefore the steam distillation is not the suitable method for Citrus essential oil
extraction. Citrus essential oil extraction needs low temperature method which gives
low impurities contamination. At present, supercritical carbon dioxide extraction is
appropriate to solve the problems of the classical methods. It could extract essential
oils with low temperature and no solvent used resulting in the improvement of the
extract efficiency and the reduction of impurities.
Neroli is commonly oil used from Citrus species. This oil is produced from
bitter orange flower (Citrus aurantium L.) by distillation or solvent extraction. It had
been used in the high quality eau de cologne since the seventeenth century. High
quality perfume and aromatherapy are always adding neroli in their recipes. Neroli
has the relaxant effect with the balancing condition. It could cause restorative effect
on the brain and stimulate the upper digestive organs. It also effectively controls
bacterial and microbacterial infection, especially gastroenteritis and lung tuberculosis.
In the perfume industry, neroli oil is widely used in blends with most other floral oils
and absolutes, including jasmine oil, lavender oil, rose oil and its absolute, ylang-
ylang oil, vanilla, as well as petigrain oil, bergamot oil, lemon oil, lime oil, grapefruit
oil, and etc.5 C. maxima flower have a similar scent as bitter orange flower. The C.
maxima flower are bigger than bitter orange flower in size, and they also contain more
oil glands on their petals. So, Citrus flower could give higher amount of essential oil
than the bitter orange flower.6
Nowadays, there are no commercial C. maxima essential oil available.
Because the extraction of flower essential oils needs modern methodology for
reducing solvent residue, impurities and chemicals transformation and increasing
yield. These factors influence on the oil quality. Therefore, supercritical carbon
dioxide extraction is considerable advantage over the other extraction methods.
It is true that the gardener grows C. maxima trees for their fruits not flower.
However, after fertilization of C. maxima flower, their petals always fall down and
they are allowed to wither with no use. Then, the development of C. maxima flower
3
oil extraction is profitable for the gardener. This may help to increase gardener’s
income and to support the perfumery industries in Thailand. Because of C. maxima is
unique in Southeast Asia and its flower oil could generally substitute neroli that
import from western countries.
The aims of this study were to compare the essential oil from different
extraction methods of peel and flower of C. maxima that could be applied to
industries. The comparison were done by differentiate and comparable the chemical
constituents in the oils from different extraction methods and sources. In this study,
the C. maxima peel oils were pressed by cold pressing, vacuum steam distillation and
supercritical carbon dioxide extraction methods. The C. maxima flower oil was
obtained from supercritical carbon dioxide extraction and compared to commercial
neroli that was obtained from the solvent extraction method.
Goal and objective of this study
1. For study and comparison the chemical constituents of essential oil derived
from Citrus maxima peel by the cold pressing, vacuum steam distillation and
supercritical carbon dioxide extraction.
2. For study and comparison the chemical constituents of essential oil derived
from Citrus maxima flower by supercritical carbon dioxide extraction and the
commercial neroli derived from Citrus aurantium var. amara that was found in
Thailand market.
3. For study antimicrobial activities of C. maxima peel oil, and flower oil
compare to that of neroli.
4
CHAPTER II
LITERATURE REVIEW
1. Citrus maxima
Citrus maxima (pomelo or shaddock), family Rutaceae, is one of the famous
fruits in Thailand. The other scientific or synonyms of pomelo are Aurantium
maximum Burm. ex Rumph, Citrus aurantium L. var grandis L., Citrus decumana L.,
Citrus grandis Osbeck and Citrus pamplemos Risso. Pomelo is a indigenous plant of
Malayu Island and the east of India. It is widespread in China, Japan, the Philippines,
Indonesia, the United State of America and Thailand.7,8 It can be cultivated in lots of
provinces of Thailand. Its different local names from different parts of Thailand are
Ma-O (North), Sung-Ou (Maehongson) and Som-O (Central)9, 10, 11
In Thailand, C. maxima was developed to plenty of cultivar for their pleasant
taste and their names were depended on the cultivated areas. For example, khao-tong-
dee, khao-num-puang, khao-hom, khao-poung, khao-pan and khao-yai varieties are
found in the Central : Nakhon-Pathom, Samutsakhon, Samutsongkarm and Rachaburi
provinces. While tang-gwar, ta-koy varieties are found in the North: Chainat,
Nakhonsawan, Uthaithani, Phichit and Phitsanulok provinces. There were some
varieties in the south such as hom-hadyai in Songkhla province.7, 8
C. maxima is medium sized tree. Its leaves have the small winged petioles.
The flower are bisexual and smell sweet. The tree can flower when its age is four
years old. The flowering in December – February is called Som-Pee when its
produces lots of flower, and the flowering in August – September is called Som-Ta-
Wai. The fruit is always round shape and big size. Fruit peel has the 3 layers: the
outer layer is called flavedo or epicarp which has the oil glands, the medium layer is
called albedo or mesocarp which is white in color and has plenty of spongy cells, and
5
the inner layer is called endocarb which is the edible portion of the fruit, the juice
sags.4, 8, 12
C. maxima flower smell quite similarly to the C. aurantium var. amara
flower (neroli). Neroli is the well known essential oil for aromatherapy and perfumery
industry. The production of neroli starts to be considerable when the tree is about 10
years old, and reaches its maximum, when the tree is about 20-30 years old (5-25 kg
of flower per tree per year). The harvest of the flower requires a considerable amount
of work. It is time consuming, and causes of an increase in cost. The flower are
picked at the time of their blooming under warm and sunny weather conditions. Those
harvested in the early morning yield oil higher than those harvested in the afternoon.
The closed blossoms yield lower, and give to the oil a green note. The collection of
the flower should be selective, avoiding small leaves and petioles. The most common
of extraction method for neroli producing are distillation and solvent extraction.
Hydro- distillation, without the distilled or cohobated water recycle, at low pressure
inside the alembic, for three hours could produce about 1.0 % average yield. Dipping
the flower in water, prior to the distillation, increases the oil yield. The flower
concrete is obtained by extraction with hexane or light petroleum with a yield that
range between 0.2-0.3 % for the flower harvested in spring. The extractors used are
the classical static type, with a load of 1,000-2,000 L, and the flower extracted
immediately after the harvest could give higher yield than those stored for several
hours. Moreover, dipping the flower in the solvent at different times gives a higher
yield than one single extraction. From the concrete it is possible to obtain the absolute
using methods for producing absolutes (extraction with alcohols, winterization,
filtration and concentration). The yields are about 48-52% of concrete. The main
components of neroli from distillation method were limonene, linalool, linalyl acetate,
nerolidol, geranyl acetate, neryl acetate, geraniol, nerol, α-terpineol, methyl
anthranilate and other aromatic compounds. The composition of neroli oils from
Spanish and Tunisian which were obtained by hydro distillation and the oil extracted
by supercritical carbon dioxide from bitter orange flower (C. aurantium) from
Morocco showed the different contents between the two types of oils : monoterpene
hydrocarbons and linalyl acetate (38.0 and 28.0%, 5.0 and 24.0% respectively).
6
Because of there were some chemical transformation of linalyl acetate during the
distillation process, leading to the formation of monoterpene hydrocarbons and other
monoterpenoids. Neroli from solvent extraction contained lower monoterpene
hydrocarbons (5.9%) and higher linalyl acetate (16.8%) than the oil from distillation
method.4,13
Chemical constituents of essential oil isolated from the flower of C. maxima
in Vietnam by steam distillation was investigated. Limonene, linalool, nerolidol and
farnesol are the main compounds.60 However it has not been reported about the
extraction of C. maxima flower by SCO2.
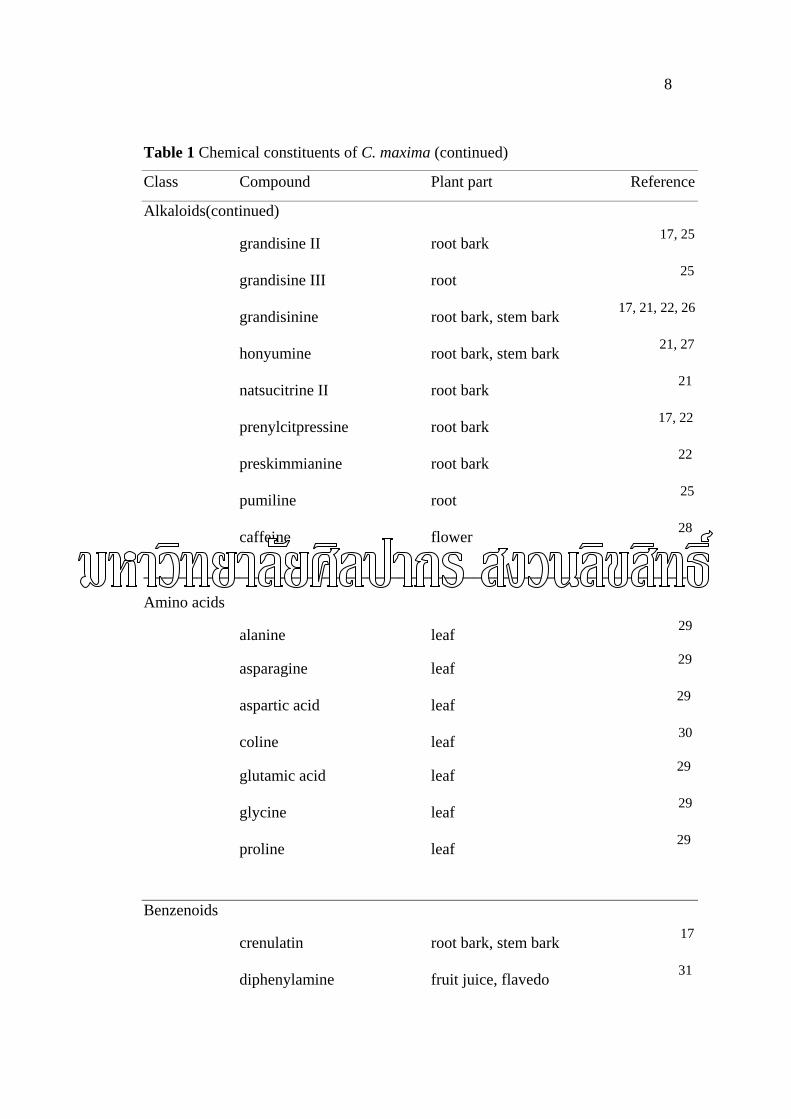
2. Chemical constituents of C. maxima
There are plenty of reports about the chemical constituents in the plant parts
of C. maxima. The reported compounds in this review have been searched until 25
November 2004 including alkaloids, amino acids, benzenoids, carbohydrates,
carotenoids, coumarins, flavonoids, monoterpenes, sesquiterpenes, triterpenes and
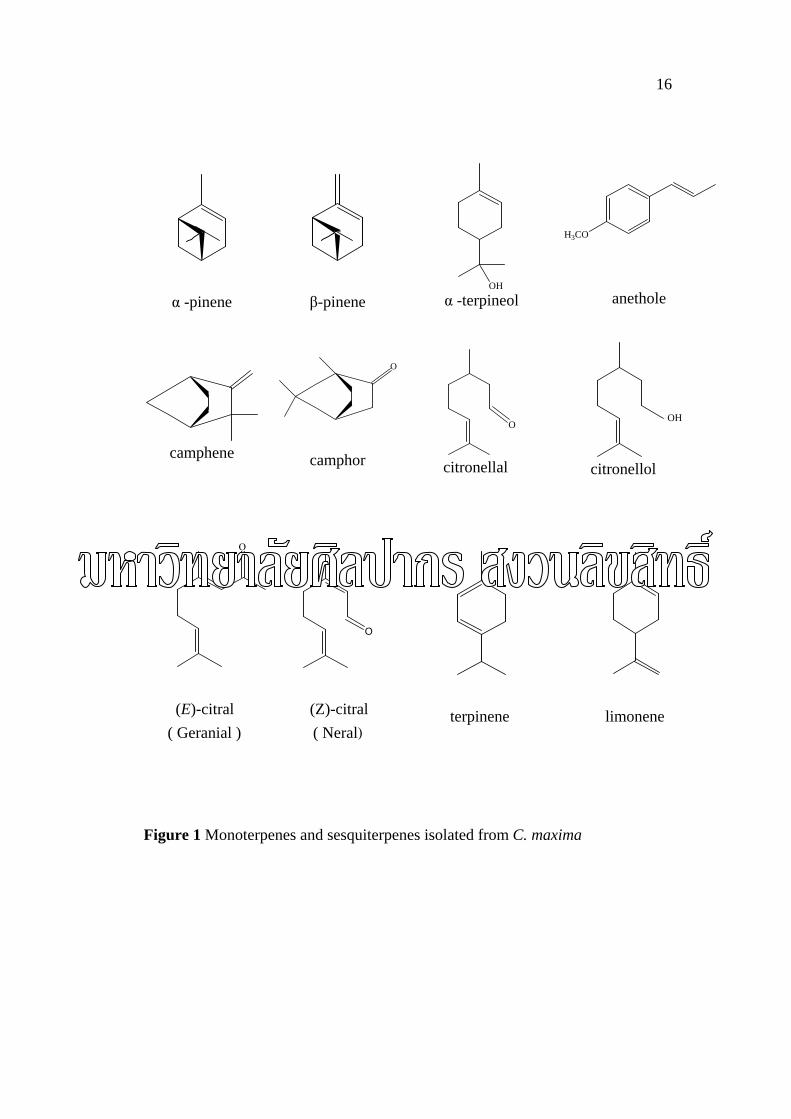
steroids (Table 1). Figure 1 shows the structures of monoterpenes and sesquiterpenes,
which are found in C. maxima essential oil. The biological activities of C. maxima
essential oil are shown in Table 2.
7
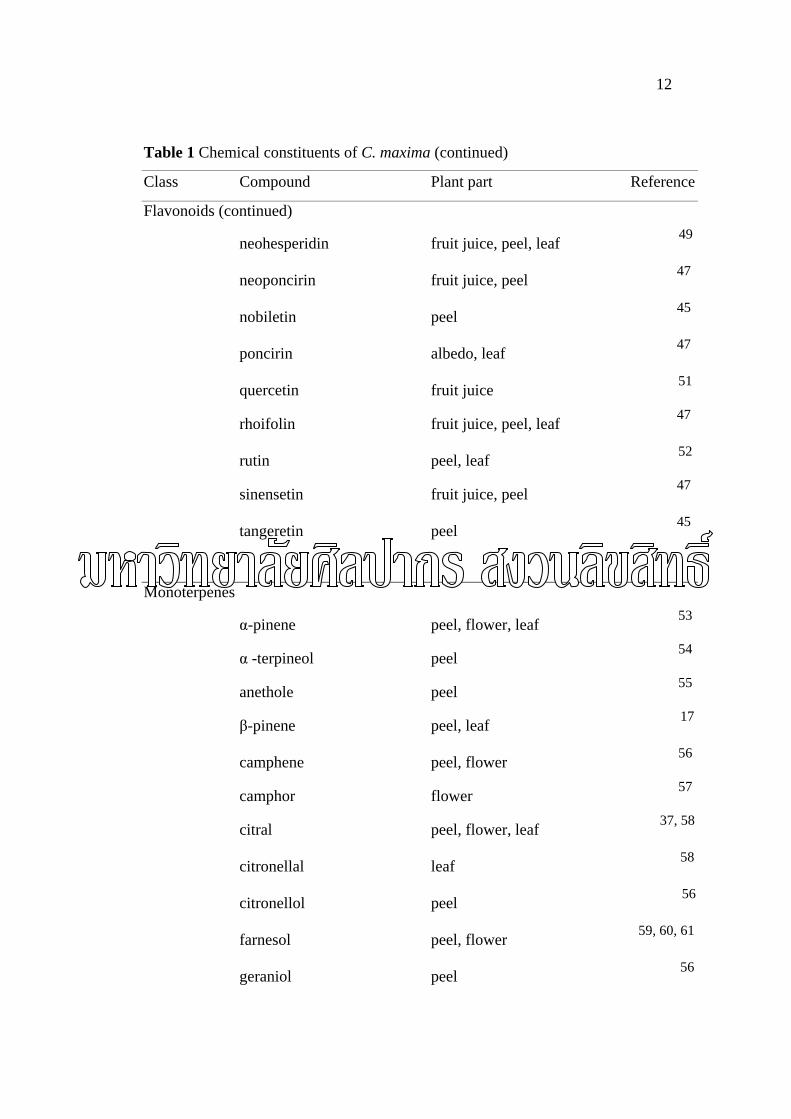
Table 1 Chemical constituents of C. maxima
Class Compound Plant part Reference
Alkaloids
5-hydroxyacronycine root bark, stem bark 14
acriginine A root 15
atalafoline stem bark 14
baiyumine A root bark 16, 17
baiyumine B root bark 16, 17
buntanbismine stem bark 18
buntanine root bark, stem bark 17
buntanmine stem bark 17
citbismine A root 19
citbismine B root 19
citbismine C root 19
citbismine E root 20
citpressine I root bark, stem bark 17, 21, 22
citpressine I root bark, stem bark 17, 22
citracridone I root bark, stem bark 17, 21, 22
citracridone II root bark 17, 21, 22
citropone A root bark 17, 23
citropone B root bark 17, 23
citrusinine I root bark 22
geibalansine stem bark 24
glycocitrine I root bark 17, 21, 22
grandisine I root bark 17, 21
8
Table 1 Chemical constituents of C. maxima (continued)
Class Compound Plant part Reference
Alkaloids(continued) grandisine II root bark 17, 25
grandisine III root 25
grandisinine root bark, stem bark 17, 21, 22, 26
honyumine root bark, stem bark 21, 27
natsucitrine II root bark 21
prenylcitpressine root bark 17, 22
preskimmianine root bark 22
pumiline root 25
caffeine flower 28 ___________________________________________________ Amino acids
alanine leaf 29
asparagine leaf 29
aspartic acid leaf 29
coline leaf 30
glutamic acid leaf 29
glycine leaf 29
proline leaf 29
Benzenoids
crenulatin root bark, stem bark 17
diphenylamine fruit juice, flavedo 31
9
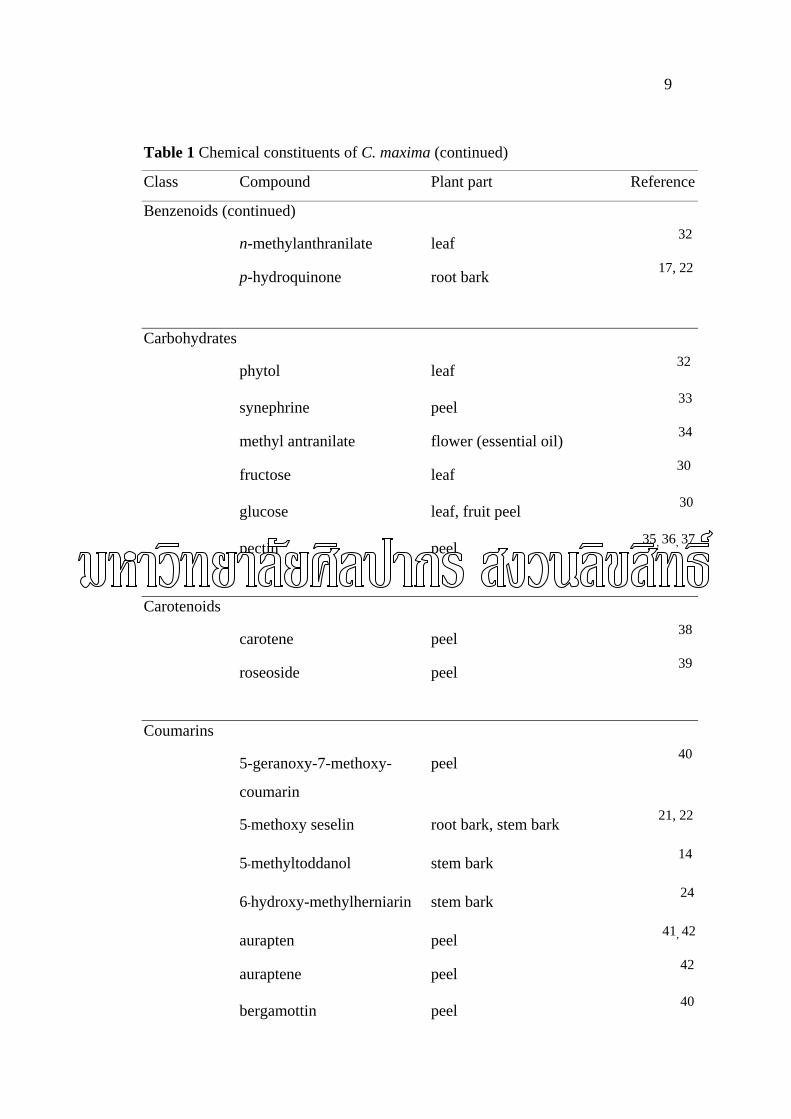
Table 1 Chemical constituents of C. maxima (continued)
Class Compound Plant part Reference
Benzenoids (continued) n-methylanthranilate leaf 32
p-hydroquinone root bark 17, 22
Carbohydrates
phytol leaf 32
synephrine peel 33
methyl antranilate flower (essential oil) 34
fructose leaf 30
glucose leaf, fruit peel 30
pectin peel 35, 36, 37
Carotenoids
carotene peel 38
roseoside peel 39
Coumarins
5-geranoxy-7-methoxy- peel 40
coumarin
5-methoxy seselin root bark, stem bark 21, 22
5-methyltoddanol stem bark 14
6-hydroxy-methylherniarin stem bark 24
aurapten peel 41, 42
auraptene peel 42
bergamottin peel 40
10
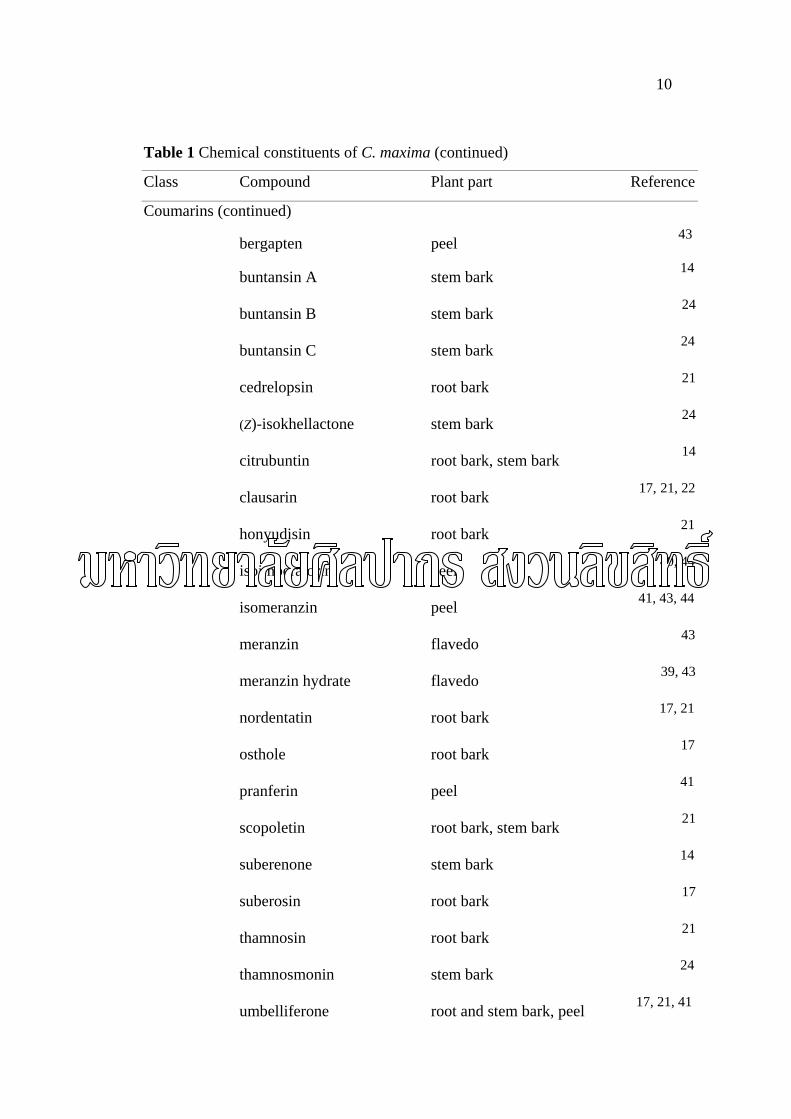
Table 1 Chemical constituents of C. maxima (continued)
Class Compound Plant part Reference
Coumarins (continued)
bergapten peel 43
buntansin A stem bark 14
buntansin B stem bark 24
buntansin C stem bark 24
cedrelopsin root bark 21
(Z)-isokhellactone stem bark 24
citrubuntin root bark, stem bark 14
clausarin root bark 17, 21, 22
honyudisin root bark 21
isoimperatorin peel 40, 44
isomeranzin peel 41, 43, 44
meranzin flavedo 43
meranzin hydrate flavedo 39, 43
nordentatin root bark 17, 21
osthole root bark 17
pranferin peel 41
scopoletin root bark, stem bark 21
suberenone stem bark 14
suberosin root bark 17
thamnosin root bark 21
thamnosmonin stem bark 24
umbelliferone root and stem bark, peel 17, 21, 41
11
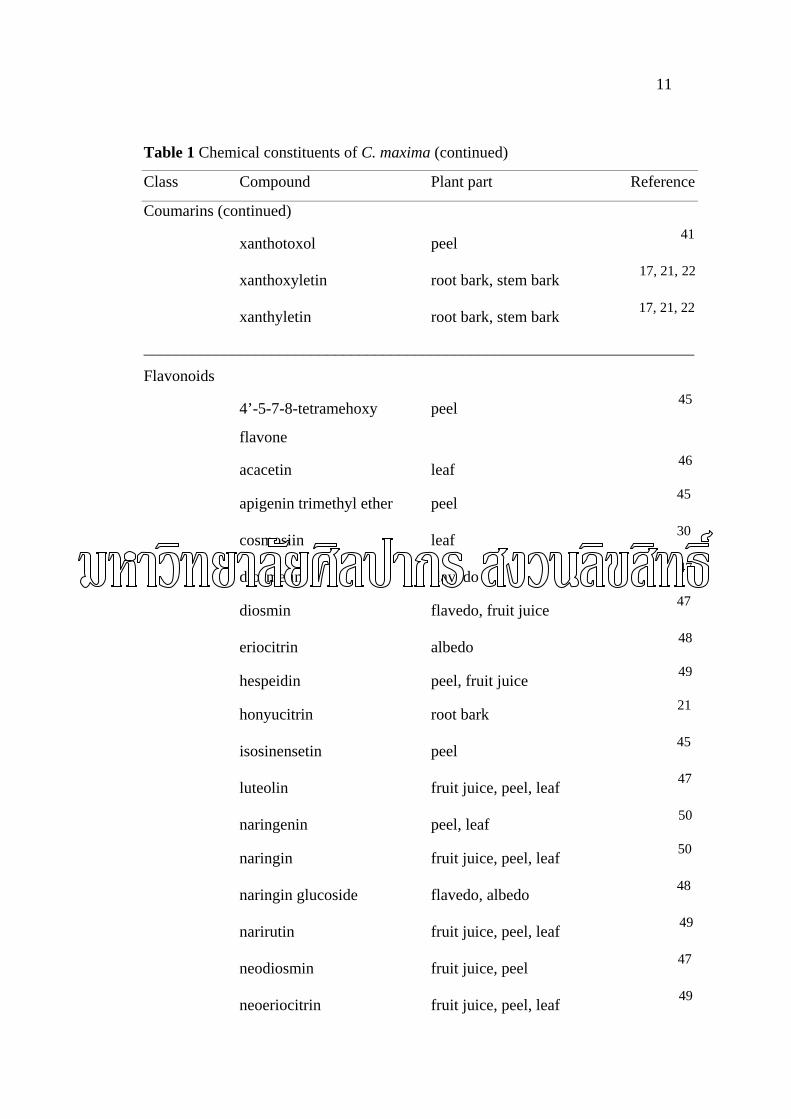
Table 1 Chemical constituents of C. maxima (continued)
Class Compound Plant part Reference
Coumarins (continued)
xanthotoxol peel 41
xanthoxyletin root bark, stem bark 17, 21, 22
xanthyletin root bark, stem bark 17, 21, 22
_____________________________________________________________________
Flavonoids
4’-5-7-8-tetramehoxy peel 45
flavone
acacetin leaf 46
apigenin trimethyl ether peel 45
cosmosiin leaf 30
diosmetin flavedo 47
diosmin flavedo, fruit juice 47
eriocitrin albedo 48
hespeidin peel, fruit juice 49
honyucitrin root bark 21
isosinensetin peel 45
luteolin fruit juice, peel, leaf 47
naringenin peel, leaf 50
naringin fruit juice, peel, leaf 50
naringin glucoside flavedo, albedo 48
narirutin fruit juice, peel, leaf 49
neodiosmin fruit juice, peel 47
neoeriocitrin fruit juice, peel, leaf 49
12
Table 1 Chemical constituents of C. maxima (continued)
Class Compound Plant part Reference
Flavonoids (continued)
neohesperidin fruit juice, peel, leaf 49
neoponcirin fruit juice, peel 47
nobiletin peel 45
poncirin albedo, leaf 47
quercetin fruit juice 51
rhoifolin fruit juice, peel, leaf 47
rutin peel, leaf 52
sinensetin fruit juice, peel 47
tangeretin peel 45
Monoterpenes
α-pinene peel, flower, leaf 53
α -terpineol peel 54
anethole peel 55
β-pinene peel, leaf 17
camphene peel, flower 56
camphor flower 57
citral peel, flower, leaf 37, 58
citronellal leaf 58
citronellol peel 56
farnesol peel, flower 59, 60, 61
geraniol peel 56
13
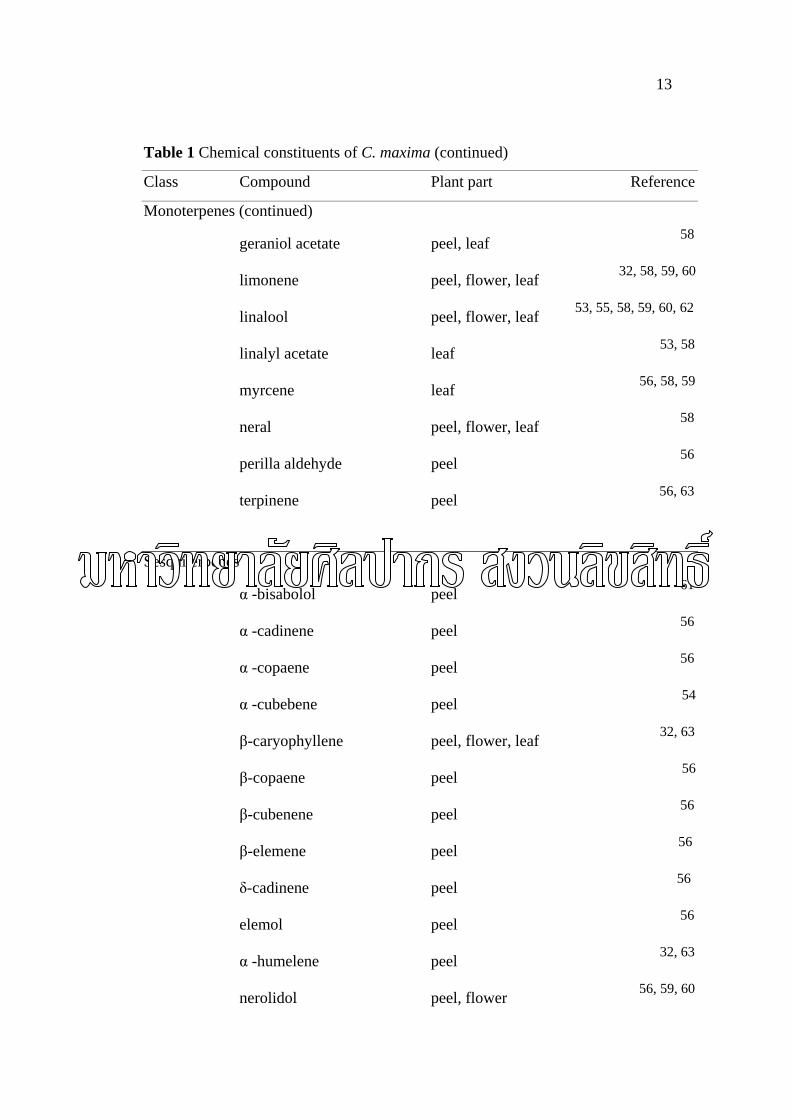
Table 1 Chemical constituents of C. maxima (continued)
Class Compound Plant part Reference
Monoterpenes (continued)
geraniol acetate peel, leaf 58
limonene peel, flower, leaf 32, 58, 59, 60
linalool peel, flower, leaf 53, 55, 58, 59, 60, 62
linalyl acetate leaf 53, 58
myrcene leaf 56, 58, 59
neral peel, flower, leaf 58
perilla aldehyde peel 56
terpinene peel 56, 63
Sesquiterpenes
α -bisabolol peel 61
α -cadinene peel 56
α -copaene peel 56
α -cubebene peel 54
β-caryophyllene peel, flower, leaf 32, 63
β-copaene peel 56
β-cubenene peel 56
β-elemene peel 56
δ-cadinene peel 56
elemol peel 56
α -humelene peel 32, 63
nerolidol peel, flower 56, 59, 60
14
Table 1 Chemical constituents of C. maxima (continued)
Class Compound Plant part Reference
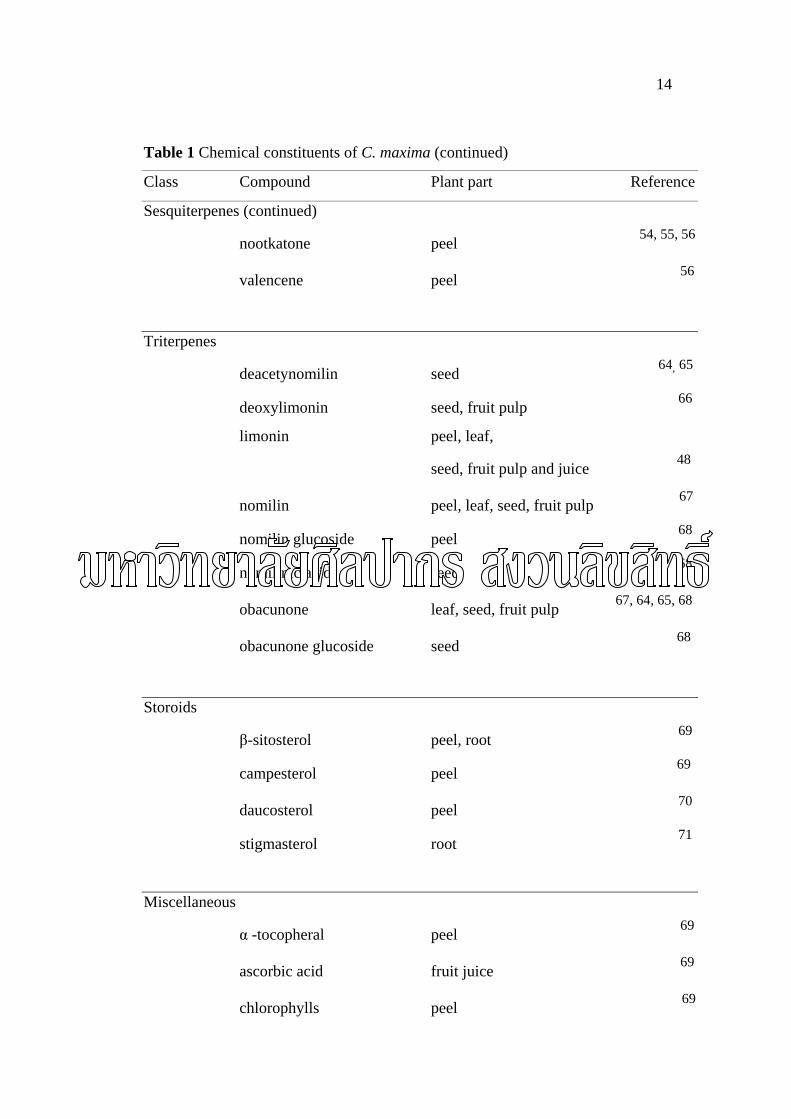
Sesquiterpenes (continued)
nootkatone peel 54, 55, 56
valencene peel 56
Triterpenes
deacetynomilin seed 64, 65
deoxylimonin seed, fruit pulp 66
limonin peel, leaf,
seed, fruit pulp and juice 48
nomilin peel, leaf, seed, fruit pulp 67
nomilin glucoside peel 68
nomilinic acid seed 68
obacunone leaf, seed, fruit pulp 67, 64, 65, 68
obacunone glucoside seed 68
Storoids
β-sitosterol peel, root 69
campesterol peel 69
daucosterol peel 70
stigmasterol root 71
Miscellaneous
α -tocopheral peel 69
ascorbic acid fruit juice 69
chlorophylls peel 69
15
Table 1 Chemical constituents of C. maxima (continued)
Class Compound Plant part Reference
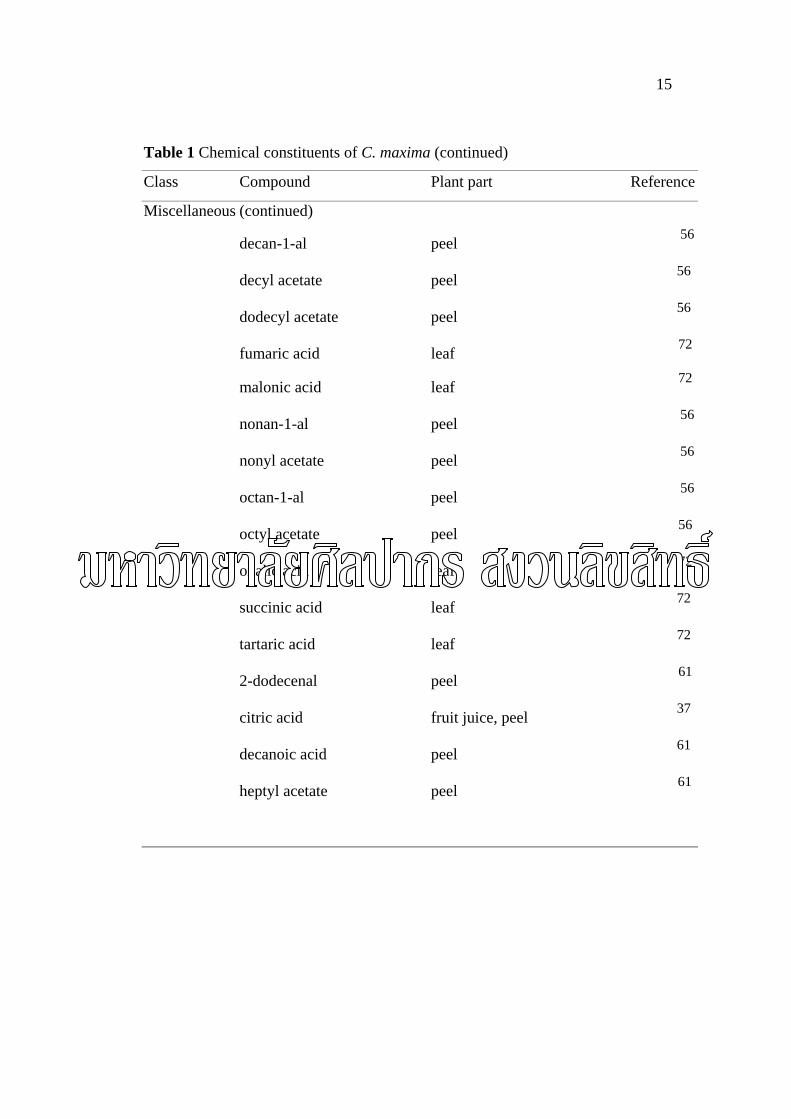
Miscellaneous (continued)
decan-1-al peel 56
decyl acetate peel 56
dodecyl acetate peel 56
fumaric acid leaf 72
malonic acid leaf 72
nonan-1-al peel 56
nonyl acetate peel 56
octan-1-al peel 56
octyl acetate peel 56
oxalic acid leaf 72
succinic acid leaf 72
tartaric acid leaf 72
2-dodecenal peel 61
citric acid fruit juice, peel 37
decanoic acid peel 61
heptyl acetate peel 61
16
α -pinene
β-pinene
OH α -terpineol
H3CO
anethole
camphene
O
camphor
O
citronellal
OH
citronellol
Figure 1 Monoterpenes and sesquiterpenes isolated from C. maxima
O
O
(E)-citral (Z)-citral ( Geranial ) ( Neral)
terpinene limonene
17
OH
COOCH3
linalool linalyl acetate
OH
COOCH3
geraniol geranyl acetate
OH
myrcene nerolidol
HO
α -bisabolol α -cadinene
OH
E
E
(E,E)-farnesol
OH
E
Z
(Z,E)-farnesol
OH
Z
E
(E,Z)-farnesol
OH
Z
Z
(Z,Z)-farnesol
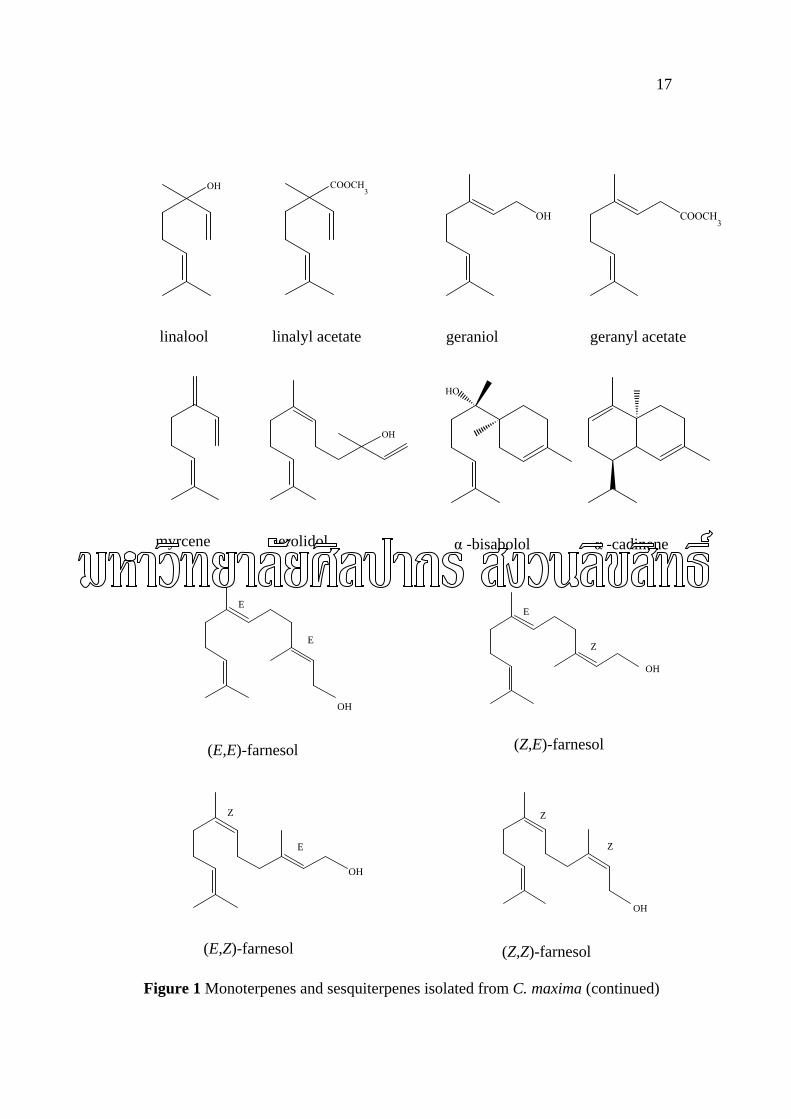
Figure 1 Monoterpenes and sesquiterpenes isolated from C. maxima (continued)
18
β-caryophyllene
α -humulene
α -cubebene
β-cubebene
α -copaene
β-copaene
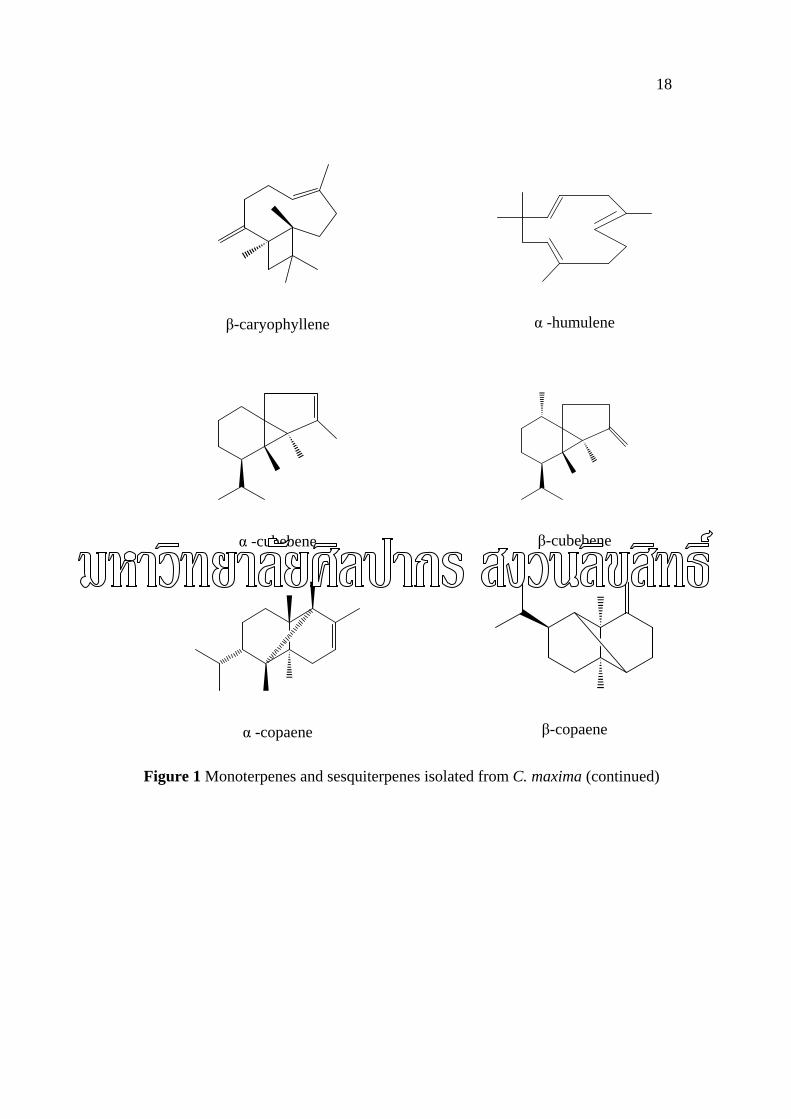
Figure 1 Monoterpenes and sesquiterpenes isolated from C. maxima (continued)
19
β-elemene
δ-cadinene
OH
elemol
O
nootkatone
valencene
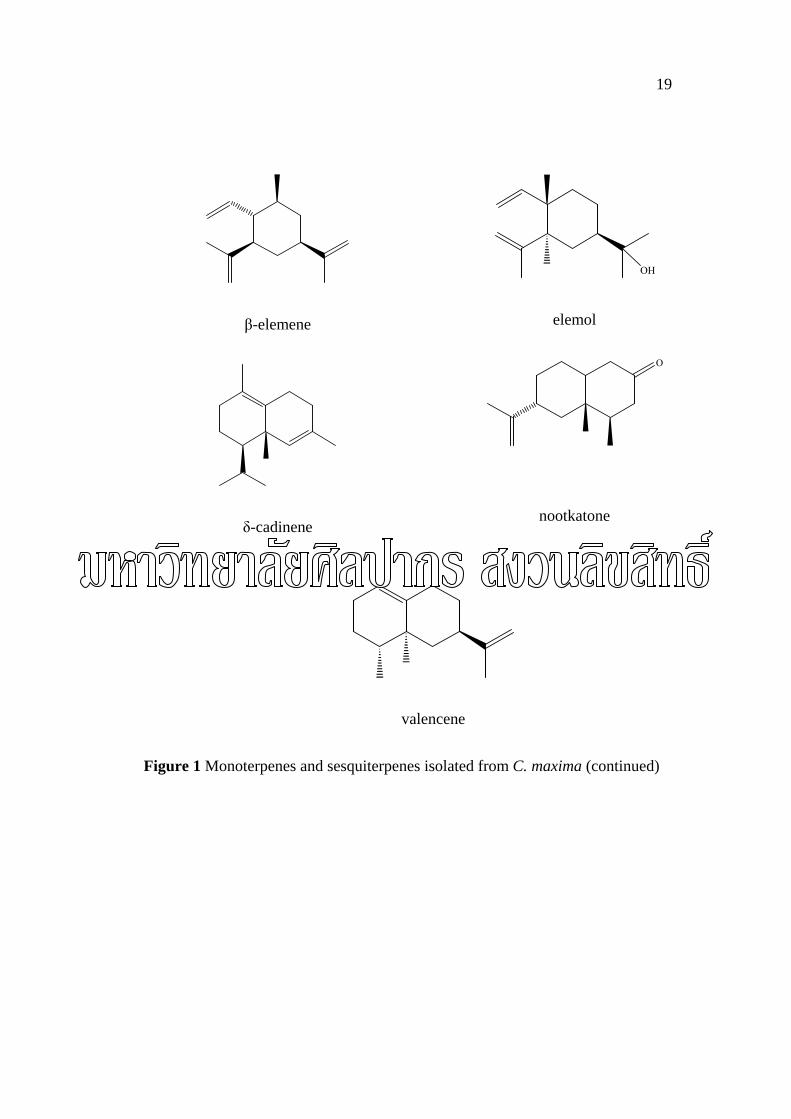
Figure 1 Monoterpenes and sesquiterpenes isolated from C. maxima (continued)
20
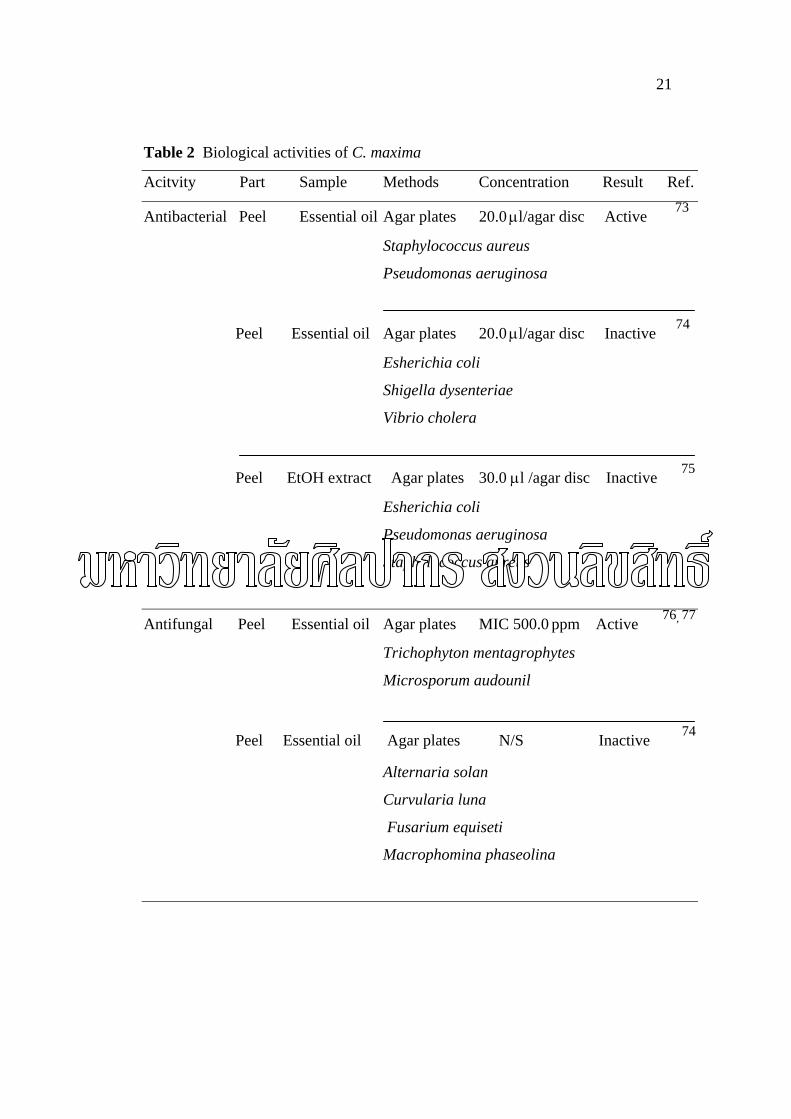
3. Biological activities of C. maxima
As they are the secondary metabolites, essential oils have been known as the
protective compounds of plants. They have lots of bioactivities, especially antioxidant
and anti-microbial activities.86 Thus, they are used in skincare products for perfuming
and aromatherapy purposes. There have been a plenty of researches of this property,
since the anti-microbial has been the common activity found in essential oils from
plants. The previous reports, until 25 November 2004, of Citrus maxima peel essential
oil showed the anti-bacterial against Staphylococcus aureus and Pseudomonas
aeruginosa with the concentration of 20.0 µl/agar disc73, and the anti-fungal against
Trichophyton mentagrophytes and Microsporum audounil with MIC 500 ppm. using
agar plate method.76, 77 There were no reports about activity of C. maxima flower
essential oil yet.
21
Table 2 Biological activities of C. maxima
Acitvity Part Sample Methods Concentration Result Ref.
Antibacterial Peel Essential oil Agar plates 20.0 µl/agar disc Active 73
Staphylococcus aureus
Pseudomonas aeruginosa
Peel Essential oil Agar plates 20.0 µl/agar disc Inactive 74
Esherichia coli
Shigella dysenteriae
Vibrio cholera
Peel EtOH extract Agar plates 30.0 µl /agar disc Inactive 75
Esherichia coli
Pseudomonas aeruginosa
Staphylococcus aureus
Antifungal Peel Essential oil Agar plates MIC 500.0 ppm Active 76, 77
Trichophyton mentagrophytes
Microsporum audounil
Peel Essential oil Agar plates N/S Inactive 74
Alternaria solan
Curvularia luna
Fusarium equiseti
Macrophomina phaseolina
22
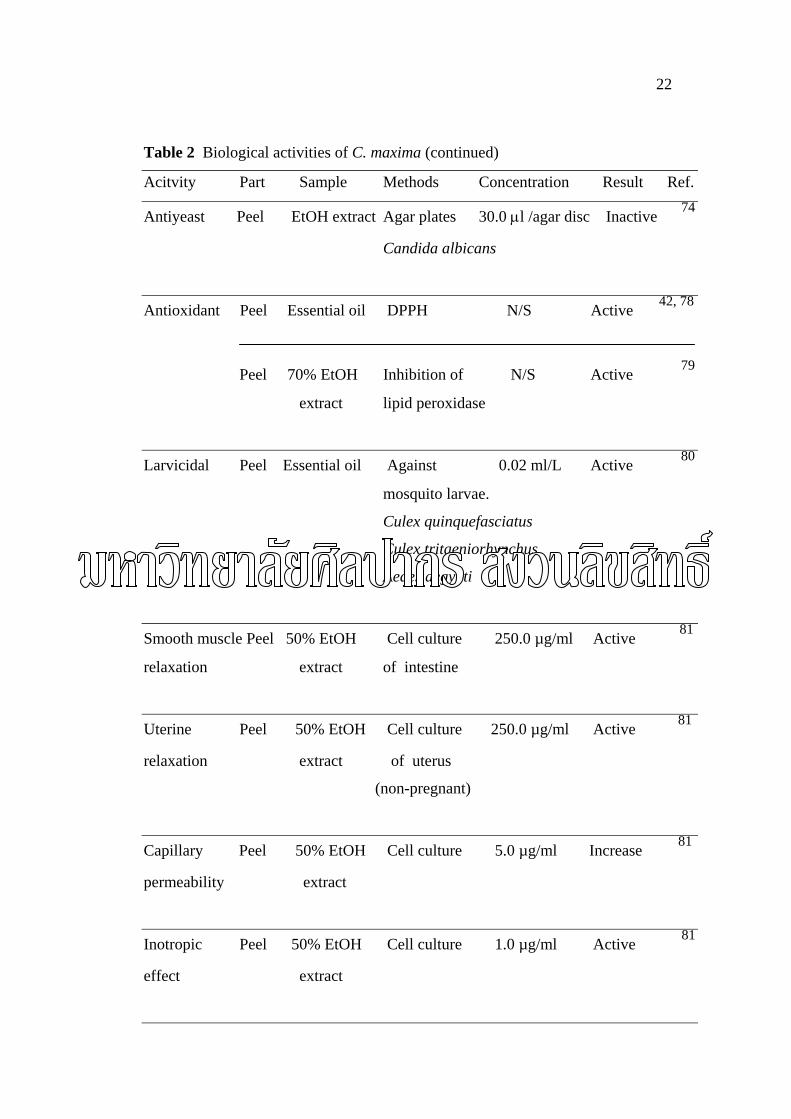
Table 2 Biological activities of C. maxima (continued)
Acitvity Part Sample Methods Concentration Result Ref.
Antiyeast Peel EtOH extract Agar plates 30.0 µl /agar disc Inactive 74
Candida albicans
Antioxidant Peel Essential oil DPPH N/S Active 42, 78
Peel 70% EtOH Inhibition of N/S Active 79
extract lipid peroxidase
Larvicidal Peel Essential oil Against 0.02 ml/L Active 80
mosquito larvae.
Culex quinquefasciatus
Culex tritaeniorhynchus
Aedes aegypti
Smooth muscle Peel 50% EtOH Cell culture 250.0 µg/ml Active 81
relaxation extract of intestine
Uterine Peel 50% EtOH Cell culture 250.0 µg/ml Active 81
relaxation extract of uterus
(non-pregnant)
Capillary Peel 50% EtOH Cell culture 5.0 µg/ml Increase 81
permeability extract
Inotropic Peel 50% EtOH Cell culture 1.0 µg/ml Active 81
effect extract
23
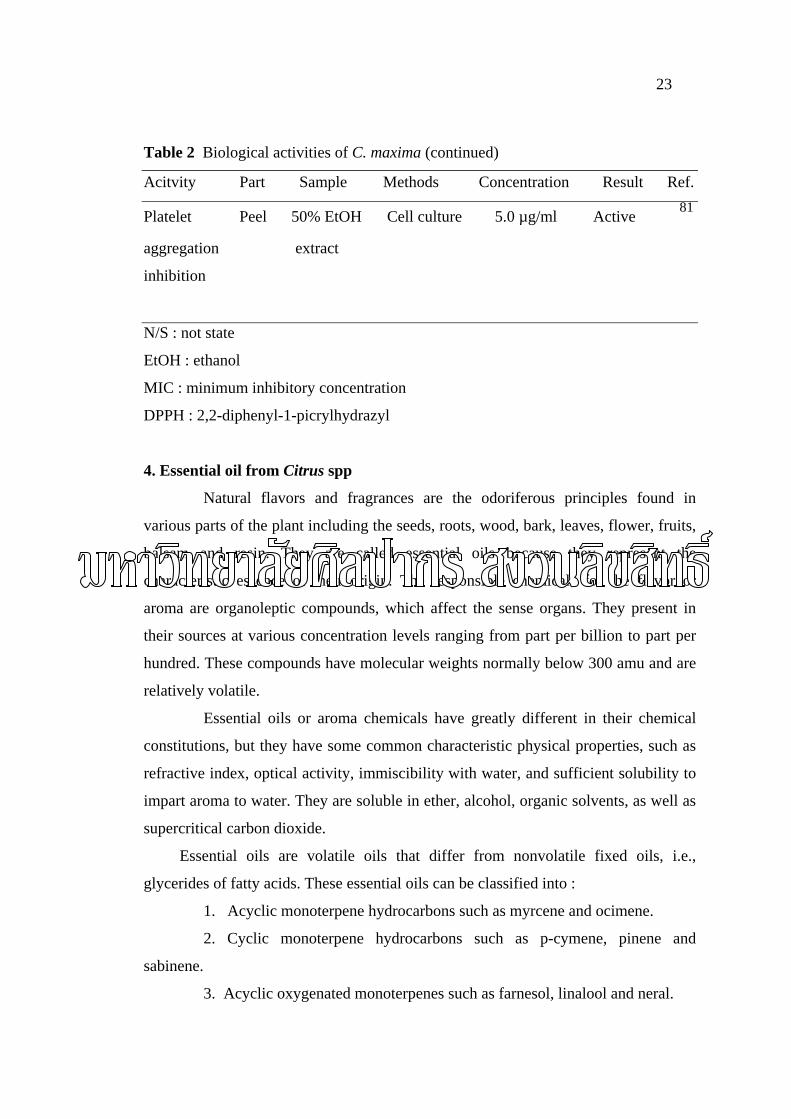
Table 2 Biological activities of C. maxima (continued)
Acitvity Part Sample Methods Concentration Result Ref.
Platelet Peel 50% EtOH Cell culture 5.0 µg/ml Active 81
aggregation extract
inhibition
N/S : not state
EtOH : ethanol
MIC : minimum inhibitory concentration
DPPH : 2,2-diphenyl-1-picrylhydrazyl
4. Essential oil from Citrus spp
Natural flavors and fragrances are the odoriferous principles found in
various parts of the plant including the seeds, roots, wood, bark, leaves, flower, fruits,
balsam and resin. They are called essential oils because they represent the
characteristic essence of their origin. The responsible chemicals for the flavor or
aroma are organoleptic compounds, which affect the sense organs. They present in
their sources at various concentration levels ranging from part per billion to part per
hundred. These compounds have molecular weights normally below 300 amu and are
relatively volatile.
Essential oils or aroma chemicals have greatly different in their chemical
constitutions, but they have some common characteristic physical properties, such as
refractive index, optical activity, immiscibility with water, and sufficient solubility to
impart aroma to water. They are soluble in ether, alcohol, organic solvents, as well as
supercritical carbon dioxide.
Essential oils are volatile oils that differ from nonvolatile fixed oils, i.e.,
glycerides of fatty acids. These essential oils can be classified into :
1. Acyclic monoterpene hydrocarbons such as myrcene and ocimene.
2. Cyclic monoterpene hydrocarbons such as p-cymene, pinene and
sabinene.
3. Acyclic oxygenated monoterpenes such as farnesol, linalool and neral.
24
4. Cyclic oxygenated monoterpenes such as terpineol and geraniol.
5. Acyclic sesquiterpene hydrocarbon such as farnesene
6. Cyclic sesquiterpene hydrocarbon such as copaene and humulene.
7. Acyclic oxygenated sesquiterpenes such as nerolidol.
8. Cyclic oxygenated sesquiterpenes such as nootkatone and spathulenol.
9. Aromatic compounds such as indole.
10. Long chain hydrocarbons such as tetradecanal and dodecanal.
Terpene hydrocarbons (monoterpenes and sesquiterpenes) are the
hydrocarbons derive from isoprene unit (2-methyl butadiene) having molecular
formular of (C5H8)n (monoterpene hydrocarbons contain n = 2 and sesquiterpene
hydrocarbon contain n=3). They are the unsaturated compounds that can decompose
by hydrolysis or photolysis and change to the other compounds.
The odor and taste of essential oils are mainly determined by these
oxygenated constituents, which some extent is soluble in water, and most of them are
soluble in alcohol.4, 82
The essential oils from Citrus spp. (fruit peel, leaf and flower) are well
known as the perfumery and flavoring agent from natural source and have been
produced in metric tons per year. The quality of Citrus essential oils obviously
depends on a large extent of factors deriving from the nature of itself (provenance,
type of soil, climate, Citrus variety), but the processing of raw material also has a
significant effect. Since the fragrance of an essential oil is directly related to the
content of aldehydes and esters, then extraction technique is very important. In order
to produce Citrus oil with a high aldehyde content, the amount of water used in the
procedures should be reduced to the minimum as necessary. The chemical
transformations of Citrus oil which may occur during the distillation method, by
subject to high temperatures (95-105 °C) for long periods of time (6-12 hours) in a
very acidic environment (pH 2.2-2.4) can modify the Citrus oil in its composition :
aldehyde content (neral, geranial) and sabinene almost disappear, otherwise, 1,4- and
1,8-cineole, terpinolene, α-terpineol and p-cymene are formed.4
25
4.1 Preparation of Citrus essential oils 4, 82
4.1.1. Cold pressing method
Cold pressing is the method specifically used for recovering essential oils
from peel of Citrus spp. There are three distinct types of phenomena occurring during
the process.
a. The oil glands that contain essential oil, located in the epidermis layer,
are ruptured.
b. The creation in the peel of compressed areas surrounded by areas
which are under less pressure, through which the oil can be expressed.
c. The abrasion of the peel.
The abrasion of the peel allows the oil to ooze out from the outside
surface in the form of liquid that is separated rapidly after standing into three layers.
The upper layer is practically pure essential oil; the intermediate layer contains
emulsified oil and includes colloidal particles in suspension; and the lower aqueous
layer contains no oil and cannot be used. Recovering of the essential oil could be done
by centrifugation. The essential oil that gains from this method may contain traces of
water, which will induce slow hydrolysis. The water should be eliminated by treating
with anhydrous sodium sulphate.
Cold pressing Citrus oils have superior odor characteristics when compared
to steam distilled oils, because they derive from the non-thermal processing. These
oils are stable because of the presence of natural antioxidants such as tocopherol,
which is not degradation by heat. However, these oils contain plenty of unsaturated
components, such as waxy and terpenes, which can polymerise easily to resinous
materials, thus producing alteration of their aroma and darkness in color. That is why
during storage, the deposited waxy and resin residue are found on the bottom of the
essential oil container.
26
4.1.2. Steam distillation
Distillation is the process of distilling plant material with steam generated
outside of the still in a steam generator that generally referred to as a boiler. As in
steam and water distillation, the plant material is supported on a perforated grid above
the steam inlet. Recovery of the essential oil is facilitated by distillation of two
immiscible liquids, namely water and essential oil and based on the boiling
temperature, the combined vapor pressures equaling to the ambient pressure. Thus the
essential oil ingredients whose boiling points are normally range from 200 to 300 °C
are made to boil at a temperature closing to that of water. In case of the lighter than
water oils, they floats at the top and water goes to the bottom. Essential oils which are
difficult to volatile in steam are mostly left behind in the still with the botanical
matter, while some very volatile chemicals may be lost in the distillation process. The
steam distillation process is the most widely acceptable process for large scale of
essential oils production. However, an obvious drawback of this process may be the
induction of chemicals changes by oxidation and hydrolysation reaction, so that, the
recovered oils are often difference from those presence in the original source.
Furthermore, if distillation is carried out under reduced pressure, vacuum steam
distillation, the consequent lowering of the boiling point significantly helps to avoid,
or reduce, harmful reactions to the integrity of the original composition of the
essential oil and allows recovery of components which are not distilled under ordinary
pressure condition.
Distilled essential oil should be almost colorless. The yellow color indicates
that the distillation has been carried out too quickly or too slowly. If distillation is
interrupted during processing, the quality of recovered essential oil is poor with high
amount of hydrocarbons and deficiency in oxygenated compounds.
4.1.3. Enfleurage
Enfleurage is the classical method of flower and aromatic botanicals
extraction for perfumery and aromatherapy using cold fats or lard as extractant. This
process is suitable for flower which continue to emit fragrance even after plucking.
The odorless fat is spread on glass plates which are placed in closed system. The
flower are put in the system and replaced by the fresh one everyday until the fat is
27
saturated with essential oil. The saturated fat is dissolved in alcohol at 30 to 40 °C and
then cooled to 5 to 10 °C which the fat is precipitated out. The filtrate which is
concentrated under vacuum to eliminate alcohol and the liquid residue is called
absolute. This process consumes extensive time, labor and other steps to eliminate
alcohol and fat. However, the essential oil receiving from this method is superior
aroma since it is non-thermo labile process.
4.1.4. Solvent extraction
These processes use hydrocarbon solvents, organic solvents, such as
hexane, petroleum ether, benzene, toluene, ethanol, isopropanol, ethyl acetate,
acetone, etc., to extract plant materials. The extraction occurring by diffusion transfers
from the solids to the surrounding solvents, known as leaching. The operating
temperature and time of extraction are specific to the nature of the botanical
substances and contact devices. The concentrated solution is done by vacuum
distillation. The residue, dark colored and waxy substance, is called concrete. The
concrete is dissolved in alcohol at 30 to 40°C and then cooled to 5 to 10°C which the
wax precipitates out. After filtration, the filtrate is concentrated under vacuum to
eliminate alcohol and the liquid residue which is called absolute.
As described above, there are many steps involved in recovering good
quality and quantity of fragrance from botanical substances. The fragrance may lose
of top notes, vary of volatile compounds, and contain some undesirable impurities,
depending on the polarity of the solvents. The thermal degradation, hydrolysis,
alcoholysis, etc. may happen and could affect the quality and stability of oils. The
important process of this method is the solvents elimination from extracts, because of
their harmfulness.
4.1.5. Supercritical carbon dioxide extraction (SCO2)82
When a gas is compressed to a sufficiently high pressure, it becomes
liquid. If the gas is heated to a specific temperature, at the specific pressure, the hot
gas will become supercritical fluid. This temperature is called the critical temperature
and the corresponding vapor pressure is called the critical pressure. The values of the
28
temperature and pressure are defined as critical point which is unique to a given
substance. These state of the substances are called supercritical fluid when both the
temperature and pressure exceed the critical point values as shown in a pressure-
temperature phase diagram (Figure 2). This fluid now takes on several of gas and
liquid properties. Supercritical fluid is the region where the maximum solvent
capacity and the largest variations in solvent properties can be achieved with small
changes in temperature and pressure. It offers very attractive extraction
characteristics, owing to its favorable diffusivity, viscosity, surface tension and other
physical properties. Its diffusivity is one to two orders of magnitude higher than those
of liquids. The diffuseness facilitates rapid mass transfer and faster completion of
extraction than conventional liquid solvents. The low viscosity and surface tension
enable it to easily penetrate the botanical materials from which the active components
are extracted. The gas-like characteristics of supercritical fluid provide ideal
conditions for extraction of solutes giving a high degree of recovery in a short period
of time.
The most desirable supercritical fluid solvent for extraction of natural
products is carbon dioxide (CO2). It is an inert, inexpensive, easily available, odorless,
tasteless, environment-friendly, and generally regards as safe solvent. In the
supercritical fluid processing with CO2, there is no solvent residue in the extract,
because of it becomes gas in the ambient condition. Its near-ambient critical
temperature, 31.1 °C, makes it ideally suitable for thermolabile natural products
extraction. Due to its low latent heat of vaporization, low energy input is required for
the extraction separation system. SCO2 produces the most natural smelling extracts,
since the hydrolysis does not occur in the process.4
The advantages of the SCO2 technique are well known by now and it is
often regards as an alternative to the classical methods. It has been established as an
environmental friendly technique for separating essential oil from herbs or plants. The
chemical compositions of C. maxima peel oil from classical techniques, cold pressing
and distillation, have been the subject of many studies but they have no report about
chemical constituents of C. maxima by SCO2 before. There was only one study about
SCO2 condition (pressure, temperature and period) of C. maxima peel in the

29
laboratory scale. This extraction condition was 40°C, 13 MPa and duration of
extraction was 1 hour.83
30
CHAPTER III
MATERIALS AND METHODS
1. Plant materials
The fruit of Citrus maxima cultivar khao–yai were collected from
Bangkontee District, Samutsongkarm Province, Thailand in December 2005 for their
peel, while their flower were collected in February 2006 (Figure 3). Neroli essential
oil, essential oil from Italy, which has been used as standard, was extracted by
solvents extraction method and was purchased from Topica Life company, Thailand.
C. maxima peel (flavedo) were divided into two parts. The first part, was
prepared for supercritical carbon dioxide extraction (SCO2). It was dried with hot air
oven (35 to 40°C, Figure 4) and milled with a cutting mill (Taian Hkeb-11, D.O.L.
Magnetic starter) to minimize the approximate particle size 0.5 cm. The second fresh
part (Figure 5) was distilled by vacuum steam distillation (VSD) and pressed after
peeling by cold pressing method (CPM). The fresh flower, which were extracted by
SCO2, were processed as soon as they were collected.
2. Extraction methods
2.1 Supercritical carbon dioxide extraction (SCO2)
This research used the pilot scale SCO2 (Guangzhou Masson New
Separation Technology, China) which is belong to Thai Traditional and Herbal
Development Center (TTHD), where located at module 1, Biotechnology Pilot Plant,
Thailand Science Park, Klong 1, Klongluang, Pathumtani, Thailand (Figure 6). The
plant material was loaded in to a high pressure stainless steel extractor tank and the
extract-laden carbon dioxide was sent to the two separator tanks. Samples eight kg. of
prepared peel as described above, were extracted with supercritical carbon dioxide
and the experiments for optimization the extraction conditions were carried out. The
evaluated parameters were temperature and pressure of the extractor (40 to 60 °C and
13 to 20 MPa) and of two separators (20 to 40 °C and 5 to 8 MPa). Another variables
31
were kept constant as particle size of plant material, carbon dioxide flow rate (1.0
ml/min), time for equilibrium condition (30 minutes) and extraction time (3.0 hours).
The best established temperature and pressure conditions were selected and used in
the experiments for separation the essential oil from plant materials. For finding the
best condition for extraction essential oil from C. maxima flower, the cut fresh peel,
the milled dried pills, the milled fresh flower and whole fresh flower were used for
trial and error. Fresh flower dipping in the SCO2 for 24 hours, prior extraction, were
used for comparing the result.
From the experiments, the best extraction condition gave the oleoresin
deposit in the first separator and the second separator contained two immiscible phase
of essential oils and water. The essential oils were separated, filtered and then
anhydrous sodium sulphate was added for elimination of trace water. In this study the
peel essential oil that derived from SCO2 was called SCP and the flower essential oil
that derived from SCO2 was called SC-f.
2.2 Vacuum steam distillation (VSD)
The fresh C. maxima peel (10.0 kgs) were cut in the small size (about 1.0 to
3.0 cm.) and extracted by VSD apparatus, Figure 7 (Pilot scale, Model : T-36,
Technical Business Company, Thailand located in TTHD). The peel were submitted
to steam distillation for 3.0 hours, under controlled temperature and pressure (about
-600 bar and 60 °C). The extracted essential oil, called VP, was dried over anhydrous
sodium sulphlate before storage.
2.3 Cold pressing method (CPM)
The fresh C. maxima peel (1.0 kg) were cut in the small size (1.0 to 3.0 cm).
The cut peel were fed into the screw pressing instrument, vegetable juicer, which was
household used for producing vegetable and fruit juice. During pressing, the liquid
was separated and flowed out through the net, while the pressed peel (pulp) was
ejected from the front end of the instrument. The mixture of oil and water was
separated and recovered by centrifugation with 3000 rpm for 10.0 mins. Then, the oil
was separated, filterted and anhydrous sodium sulphate was added. For this study the
oil derived form cold pressing method was called CP.
32
All of the oil samples, SCP, SC-f, VP, CP, neroli, were kept in air tight,
protected from light containers and placed in refrigerated at +4 °C prior to analysis.
3. Analysis
Samples (Figure 8 to 12)
SCP : Essential oil derived from Citrus maxima peel, extracted by SCO2
CP : Essential oil derived from Citrus maxima peel, extracted by CPM
VP : Essential oil derived from Citrus maxima peel, extracted by VSD
SC-f : Essential oil derived from Citrus maxima flower, extracted by SCO2
Neroli : Essential oil derived from Citrus aurantium var. amara flower,
extracted by organic solvent, from Italy (Commercial product)
3.1 Physical properties
3.1.1 Density
The true density of essential oils were measured using the pycnometer and
analytical balance (Sartorius BP 210S) at the Department of Pharmaceutical
chemistry, Faculty of Pharmacy, Silpakorn University.
3.1.2 Optical rotation [α]D
The angle of rotation of all pure essential oils were measured on
Polarimeter (Jasco P-1010, Japan) at the Department of Chemistry, Faculty of
Sciences, Silpakorn Univesity. The wavelength of the sodium D line (589 nm) and
temperature at 30°C were conditions that used for experiment.
33
3.1.3 Refractive Index [n]D
The refractive index of all pure essential oils at 25°C were measured by
Refractometry (Schmidt & Haensch berlin, Germany) at the Department of
Pharmaceutical Chemistry, Faculty of Pharmacy, Silpakorn University.
3.2 Chemical Characteristic
3.2.1 Infrared absorption spectra (IR spectrum)
IR spectrums (fingerprints) of all essential oils were determined by Fourier
transform - Infrared Spectroscopy (Nicolet 4700 FT-IR Spectrometer, ) at Faculty of
Pharmacy, Silpakorn University. The IR spectra were reported in % reflectance.
3.2.2 Gas Chromatography (GC)
Chemical identification and quantificaation of essential oils were investigated
by Gas Chromatography equipped with FID detector (Agilent Technologies 5890
series II, USA) at Faculty of Pharmacy, Silpakorn University. Two types of capillary
columns, DB-5 and cabowax, were used for separation of different profile volatile
components. The operating condition of GC was shown in Table 3 and the carrier gas
was Helium 99.9999% purity, Flame Ionization Detector (FID), DB-5 : J&W, Agilent
Technologies, USA, Carbowax : Ohiovalley specialty, USA.
The identification of individual components was based on the comparison of
their retention index (RI), Kovats index (KI), on polar and non-polar column, and
their mass spectra from GC-MS.
In this study, the GC methods that were employed for analysis were validated
to confirm the analytical results. The validate test methods that were done were
selectivity, linearity, accuracy and precision.84
Selectivity
Selectivity was a measure of the capability of the analytical method to
determine a particular analyte in various matrices with minimal or no interference
from other matrix components. For choosing the operating condition of GC, VP was
used to be the test sample for analysis, because it has been known as pure volatile oil.
Pure VP, VP mixed with solvent and VP mixed with all standard solutions and
34
internal standard were injected into GC. Three evaluated parameters were tested :
ramp (2.0, 3.0, 4.0, 5.0°C/min), column flow (1.0, 2.0 ml/min) and split ratio ( 1 : 20,
1 : 90, 1 : 120). Another variables were kept constant, for example, initial
temperature, final temperature and injection temperature. The best conditions were
defined by the ability of condition to resolve individual compounds that could be
measured using a single procedure.
Calibration linearity
Calibration of the gas chromatography delineated the relationship between the
detector response and the concentrations of the analyte introduced into instrument. A
calibration curve was the graphical depiction of this relationship. Calibration curve of
a gas chromatographic method involves the analysis of standards containing target
compounds at different concentrations covering the working range of the instrument.
In order to produce calibration curve for this work, standard solutions : R-(+)-
limonene, linalool, nerolidol and farnesol were the target compounds. The standard
solutions were prepared as analyte solutions at 7 concentration levels, 7 repeated of
each concentration for limonene and linalool (0.0001, 0.001, 0.01, 0.1, 0.3, 0.5, 0.9
µl/µl) and 5 concentration levels, 7 repeated for nerolidol, farnesol (0.0001, 0.001,
0.01, 0.05, 0.1 µl/µl), based on the amount of target compounds in the sample.
Acceptability of linearity data was often judged by examining the correlation
coefficient of the linear regression line for the response versus concentration. A
correlation coefficient (r2) of more than 0.999 was generally considered acceptable.
The quantitation of target compounds could be calculated using the equation from
linear correlation.
Accuracy
Accuracy was how close the experimental data is to the true value. Standards
addition techniques and matrix spikes would be used and recoveries determined. The
standard addition techniques indicated how the method performed with respect to
accuracy of the final procedural steps. The accuracy should be evaluated at the low as
well as the high analyte concentration values expected. An accuracy criterion for a
particular method is that the mean recovery value would be 95 + 2% at each
35
concentration over 80 – 120% of the anlyte range concentration. This study used the
standard addition techniques by adding linalool into VP in 4 concentrations (0.002,
0.004, 0.006, 0.008 µl/ml) and the accuracy was determined on DB-5 column. R-(+)-
limonene was added into neroli oil in the same concentrations of linalool and the
accuracy was determined on carbowax column. Each experiment was analysed in
triplicate.
Precision
Precision of GC method was the measurement of closeness of analyte
concentrations to each other when the analytes were performed on identical
conditions, for example, the same method, same sample, same operator, and same
laboratory conditions over a short period of time, called repeatability. The precision
data was calculated and expressed as standard deviation (SD) which often reported as
the relative standard deviation (RSD). The precision data were obtained from the
multiple injections of standard addition sample solutions. Each sample was injected in
to GC in triplicate. The precision criteria for GC would be that the instrument
precision (RSD) should be + 1%, and the repeatability of the method would be + 2%.
For Retention Index (RI) or Kovats index (KI) calculation, each essential oil
samples (pure) were injected into GC for 7 repetition and the retention times were
averaged and used for calculation of KI. All essential oil samples were also
investigated by GC-MS for mass spectrum.

36
Table 3 The operating condition of GC
_________________________________________________________________ Operating condition DB-5 Carbowax
____________________________________________________________________ Capillary column
Compositions 5%phenyl & 95% dimethylpolysiloxane polyethylene glycol
Length 30 m. 60 m.
Thickness 0.25 µm 0.25 µm
Diameter 0.25 µm 0.25 µm
Carrier gas Helium Helium
Column flow rate 1.0 ml/min 2.0 ml/min
Carrier gas pressure 12.5 Psi 33.5 Psi
Oven
Initial temperature 60.0°C (5.0 mins) 60.0°C (5.0 mins)
Ramp 3.0°C/min 3.0°C/min
Final temperature 250.0°C (15.0 mins) 180.0°C (30.0 mins)
Injection
Injection temperature 230°C 230°C
Split flow 90.0 ml/min 90.0 ml/min
Split ratio 1 : 90 1 : 90
Sample volume 1.0 µl 1.0 µl
Detector
Type FID FID
Detector interface temperature 240°C 240°C
___________________________________________________________________________________
3.2.3 Gas Chromatography-Mass Spectroscopy (GC-MS)
Mass spectra of each chemical constituents in essential oil samples were used
to confirmed the identification. They were compared with quadrupole mass spectra in
the library of HP-Chemstation data processor, library database for mass spectra
matching up to 80% : Willey 7n, NIST02 and Pesticide and compared with the mass
spectra as reported by R.P. Adams, 2001.85 GC-MS was performed with a Agilent
Technologies GC 6890, USA gas chromatograph, equipped with a Agilent
Technologies MSD 5973N mass spectrometer as detector, USA. The instrument is
37
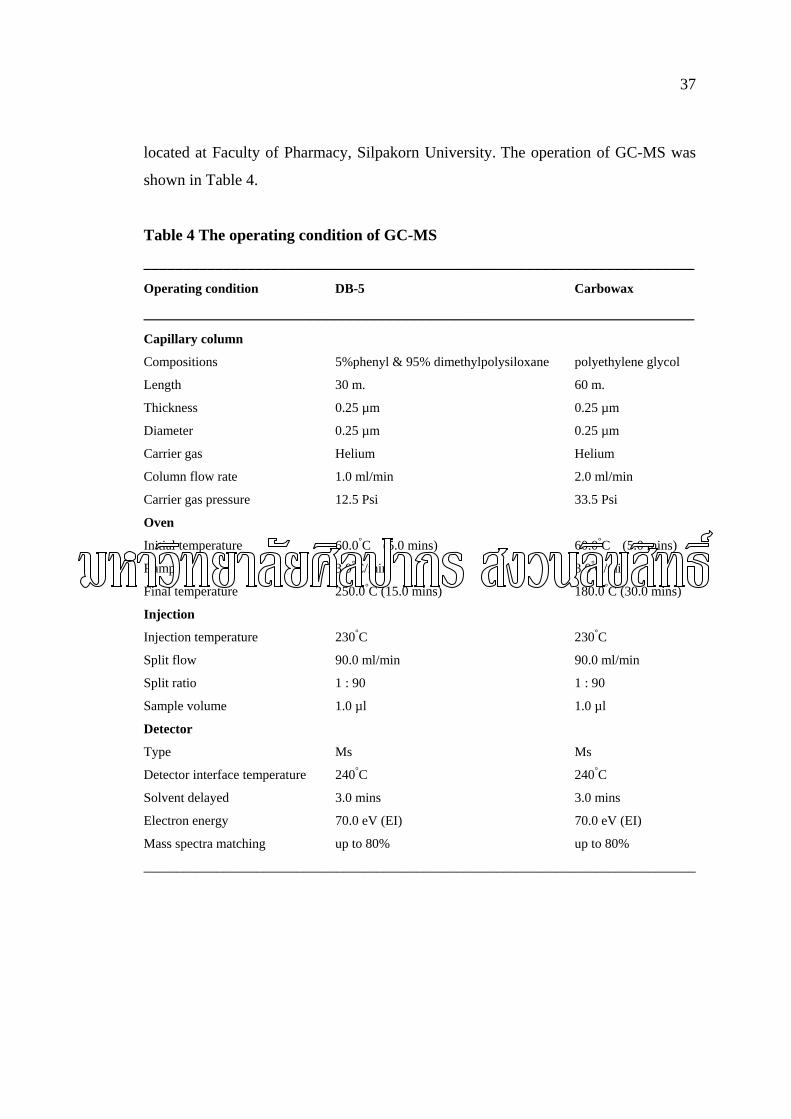
located at Faculty of Pharmacy, Silpakorn University. The operation of GC-MS was
shown in Table 4.
Table 4 The operating condition of GC-MS
_____________________________________________________________________ Operating condition DB-5 Carbowax
_____________________________________________________________________ Capillary column
Compositions 5%phenyl & 95% dimethylpolysiloxane polyethylene glycol
Length 30 m. 60 m.
Thickness 0.25 µm 0.25 µm
Diameter 0.25 µm 0.25 µm
Carrier gas Helium Helium
Column flow rate 1.0 ml/min 2.0 ml/min
Carrier gas pressure 12.5 Psi 33.5 Psi
Oven
Initial temperature 60.0°C (5.0 mins) 60.0°C (5.0 mins)
Ramp 3.0°C/min 3.0°C/min
Final temperature 250.0°C (15.0 mins) 180.0°C (30.0 mins)
Injection
Injection temperature 230°C 230°C
Split flow 90.0 ml/min 90.0 ml/min
Split ratio 1 : 90 1 : 90
Sample volume 1.0 µl 1.0 µl
Detector
Type Ms Ms
Detector interface temperature 240°C 240°C
Solvent delayed 3.0 mins 3.0 mins
Electron energy 70.0 eV (EI) 70.0 eV (EI)
Mass spectra matching up to 80% up to 80%
___________________________________________________________________________________

38
Standard compounds for GC and GC-MS
( + )-Linalool : 95.0%, Fluka®, Switzerland.
density 0.861, 100.0 gm
(R)-( + )-Limonene : 98.0%, Aldrich®, Germany.
density 0.840, 100.0 gm
Nerolidol : 98.0%, Aldrich®, Germany.
density 0.875, 25.0 gm
Farnesol : 95.0%, Aldrich®, USA.
density 0.886, 25.0 gm
(mixture of isomers)
Alkane C8 to C20 : 40.0 µg/ml in hexane,
Fluka®, Germany, 5.0 ml
Alkane C21 to C40 : 40.0 µg/ml in toluene,
Fluka®, Germany.5.0 ml
Solvent : 99.0% n-Hexane, AnalaR®,
BDHL Laboratory Supplies,2.5 L
Internal standard : Tetradecane olefine free
99.5%, Fluka®, Germany, 5.0 ml
39
4. Anti-microbial activity86
The anti-microbial activities of C. maxima peel and flower essential oil from
different extraction methods (SCP, CP, VP and SC-f) were investigated in this study
using the broth microdilution technique. Three test organisms were used in the assay.
4.1 Assay medium requirements
Tryptic soy broth (TSB) media (USP 211825) and Muller Hinton broth
(MHB) media (USP 275730) were used as nutrient sources for the test organisms at
the concentration of 3.0 gm/ml and 2.1 gm/ml, respectively. All media and
equipments were sterilized by autoclave before using.
4.2 Test microorganisms
Three test organisms, Staphylococcus aureus ATCC 6538, Escherichia coli
ATCC 8739 and Candida albicans ATCC 17110, were used for the assay. The
microorganisms were maintained in Tryptic soy agar (TSA) for bacterias and
Sabouraud dextrose agar (SDA) for yeast at 37.0°C for 18-24 hours. The isolated
colony was incubated to broth and incubated overnight at 37.0°C. One loop of this
cultured broth was transferred to new tube and resuspended in TSB, then incubated at
37.0°C for 2-5 hours in the shaking incubator. After 2-5 hours incubation, the
microorganism culture was used for the assay.
4.3 Microdilution plate
The 96 well cell culture cluster, round bottom with lid, sterile (COSTAR®;
Corning Incorporated 3799, USA) was used.
4.4 Microplate reader
Packard/A Packard BioScience Company, Fusion™, USA.
Plate type 96 well plate
Detection mode Absorbance
Well read time (seconds) 1.0
Number of times to read each well 1.0
Light source type Halogen CW
Light source intensity 10.0
40
Primary excitation filter position Abs 550
Primary emission filter position Diffuser
4.5 Mircodilution method for anti-microbial assay
The amounts of S. aureus, E. coli and C. albicans were adjusted by
comparing the turbidity to the McFarland suspension No.5 (0.5% BaCl2 in 0.56 N in
SO4 v/v) and further diluted to be 106 CFU/ml using MHB as diluent. To overcome
the insolubility of the oils in the broth, the assay was performed in 1% DMSO of
MHB. The 90.0 µl of five folded dilutions of each oil sample were prepared in a 96-
well plate. The 10.0 µl of each test organism was added into each well to make a final
concentration of approximately 105 CFU/ml. In each test, test organism in MHB was
used as the positive growth control, while the oil samples in MHB and MHB alone
were used as negative growth control. The plates were then incubated at 37 °C for 18
hours. The minimum inhibitory concentration (MIC) value was defined as the lowest
concentration of essential oil inhibiting visible growth by using microplate reader. To
evaluate whether this MIC of oil could kill the microorganism, 10 µl of each well at
MIC was transferred to a new well containing 90 µl MHB and incubated at 37 °C for
18-48 hours. If the oil can kill microbial, the clear solution was found in each well.
Each experiment was performed in triplicate.
41
CHAPTER IV
RESULTS AND DISCUSSION
1. Extraction
In order to obtain the best conditions for the SCO2 of C. maxima peel and
flower, the experiments were performed at different pressure-temperature settings of
extractor and separators. The best condition for peel and flower extraction were 40°C,
13 MPa for extractor, 40°C, 8 MPa for the first separator, and 20°C, 5 MPa for the
second separator. The SCP and SC-f were clear solution with dark-green and light-
yellow in color, respectively. The SCP and SC-f were condensed out in second
separator with water, while the other compounds of peel and flower were separated in
first separator. For SCO2 of peel, only dry milled peel extraction gave essential oil,
while the milled fresh peel could not. Because high water content in fresh peel
reduced extraction power of SCO2.
The extraction of cut fresh peel by SCO2 in addition of 1% cosolvent (95%
ethanol) was given the liquid mixture of ethanol, water, essential oil and both
hydrophobic and hydrophilic impurities. The water and ethanol could be eliminate
from the mixture by rotary evaporator. However, this evaporation caused the losing of
some volatile oil and could not separate the oil from nonvolatile impurities. So the air
dried peel (flavodo) were milled to around 0.5 cm in diameter and immediately
extraction by SCO2 under the mentioned condition. The obtained SCP was similar in
color and smell to the CP.
The CP was clear solution with dark-green in color. It showed small amount
of precipitate at the bottom of the container after storage. The oil that obtained from
VSD method was clear solution with no color. Its percentage yield was about 0.2%
v/w on fresh peel basis.
In this study the cold press extraction was done by modification of small
vegetable juicer which the juice was extracted and the pulp was automatic ejection.
The principle of this juice maker was the expression the juice from pulp. The
42
collected juice was centrifuged for oil separation. The estimated %yield of CP was
0.3% v/w on fresh peel basis.
The present investigation, peel oils from SCO2 and VSD were gained from
pilot scale equipment that required at least around 8-10 kg of the peel per each time of
extraction. Because of large amount of raw material require, the criteria for extraction
condition selection was the separation of oil from impurities, not the highest yield of
oil.
The limitation of C. maxima flower oil extraction by SCO2 was the supply of
raw materials (flower). In this study, around 1 kg of fresh C. maxima flower were
extracted under the best condition that was chosen from C. maxima peel oil
extraction. The whole flower were extracted in fresh condition, since the smell of
dried flower was distorted from their original and their aroma was decreased by the
time and method of drying. The only factor of extraction condition of C. maxima
flower that differ from those of peel was the extraction time. The whole fresh flower
were allowed to contact CO2 for 24 hours in extractor. In commercial, the fresh bitter
orange flower that were dipped in water 24 hours for storage before distillation gave
the raise of yield about 0.2-0.3% over the fresh flower without dipping in water prior
to distillation.
The milled fresh C. maxima flower were also on trial for increasing yield of
extraction. However, the flower oil could not collect and lots of impurities
contaminated in both separators. Then the reduction of flower size could not enhance
the yield of the oil. The intensification of particle area by reducing particle size could
magnify the mass transfer of raw material to CO2. This was the reason why lots of
impurities were found in the extract. Normally, water was not only reducing mass
transfer by decreasing the lipophilicity of CO2 and impeding the penetration of CO2
into raw material particles, but also enhancing the solubility of some substance as
cosolvent and increasing the hydrophilicity of CO2. For the extraction of milled fresh
flower, water may enhance the power of CO2 extraction, then lots of impurities were
coextracted.
The percentage yield of SCP and SC-f were about 0.4% v/w on dry peel
basis and 0.2% v/w on fresh flower basis, respectively. The amount of essential oils of
C. maxima peel and flower from this study were not the maximum amount. Because
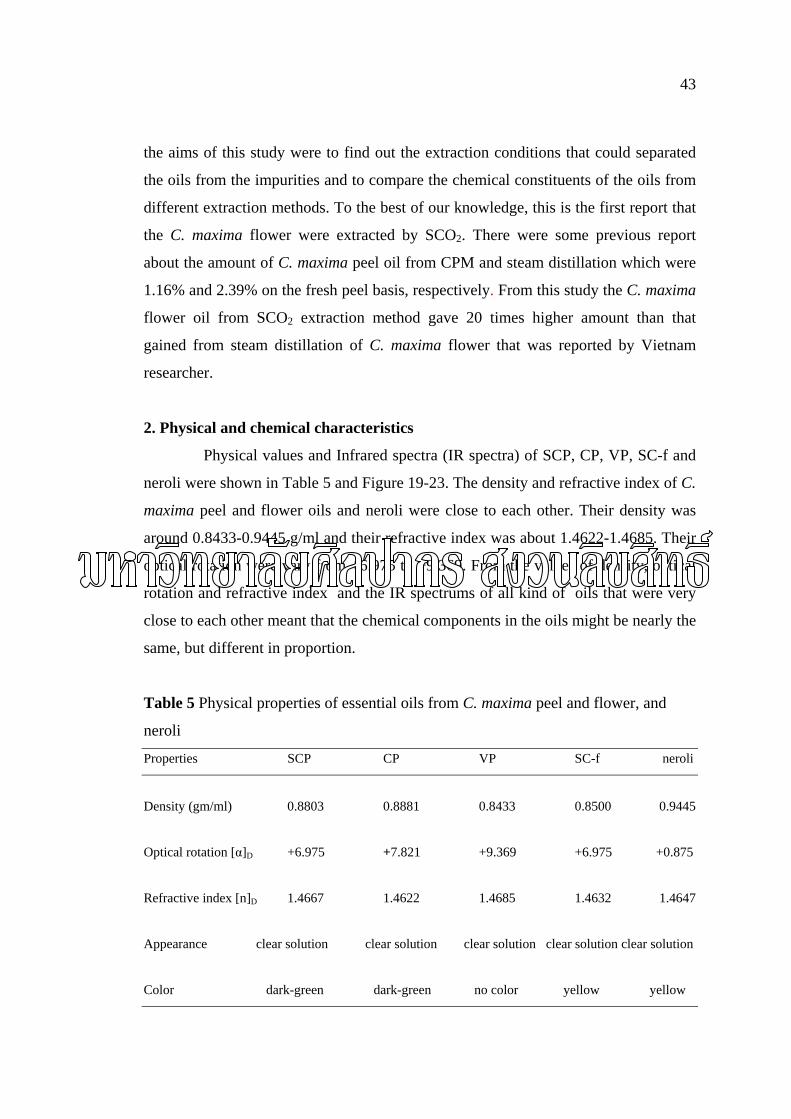
43
the aims of this study were to find out the extraction conditions that could separated
the oils from the impurities and to compare the chemical constituents of the oils from
different extraction methods. To the best of our knowledge, this is the first report that
the C. maxima flower were extracted by SCO2. There were some previous report
about the amount of C. maxima peel oil from CPM and steam distillation which were
1.16% and 2.39% on the fresh peel basis, respectively. From this study the C. maxima
flower oil from SCO2 extraction method gave 20 times higher amount than that
gained from steam distillation of C. maxima flower that was reported by Vietnam
researcher.
2. Physical and chemical characteristics
Physical values and Infrared spectra (IR spectra) of SCP, CP, VP, SC-f and
neroli were shown in Table 5 and Figure 19-23. The density and refractive index of C.
maxima peel and flower oils and neroli were close to each other. Their density was
around 0.8433-0.9445 g/ml and their refractive index was about 1.4622-1.4685. Their
optical rotation were vary from +6.975 to +9.369. From the values of density, optical
rotation and refractive index and the IR spectrums of all kind of oils that were very
close to each other meant that the chemical components in the oils might be nearly the
same, but different in proportion.
Table 5 Physical properties of essential oils from C. maxima peel and flower, and
neroli
Properties SCP CP VP SC-f neroli
Density (gm/ml) 0.8803 0.8881 0.8433 0.8500 0.9445
Optical rotation [α]D +6.975 +7.821 +9.369 +6.975 +0.875
Refractive index [n]D 1.4667 1.4622 1.4685 1.4632 1.4647
Appearance clear solution clear solution clear solution clear solution clear solution
Color dark-green dark-green no color yellow yellow
44
3. GC method validation and quantification
3.1 GC method validation
The GC methods of essential oil analysis of both DB-5 and carbowax
columns were validated as shown in Table 6. The calibration curves of both columns
(Figure 13 to 18) showed the linearity with r2 = 0.9992 and 0.9922 for DB-5 and
carbowax, respectively. The validation data showed acceptable results for accuracy of
both capillary columns (DB-5 : 99.10%, carbowax : 102.20%) while the repeatability
shown %RSD higher than standard criteria104 (5.39, 2.80% for DB-5 and carbowax,
respectively). For solving this problem, each pure essential oil samples were injected
into GC for 7 repetition. For identification, the retention times were averaged before
calculated KI and confirmed with mass spectrum by GC-MS.
The chemical constituents of all essential oil samples were identified based
on their mass spectra compared with the standard spectra from R.P. Adam85 and
relative index (RI) or Kovats index (KI) from previous reports.85,87,88,89,90 Kovats
index were computed by using the following formula.85, 91
KI = 100 { [(log Rt(x) – log Pz) / (log Rt(Pz+1) – log Rt(Pz)] + z },
where : The Rt(x) is the adjusted retention time of the analyte. It was measured at the
same conditions as those of the n-alkanes (C8-C40) and then compared with the two n-
alkanes which eluted in front and behind (containing “z” and “z+1” carbon atoms
respectively ) and P is the adjusted retention time of n-alkane which calculated by the
same as the adjusted retention time of analytes:
Rt(x) = Rt(xaverage) – Rt(air peak),
where : Rt(xaverage) is the average retention time of analyte , Rt(air peak) is the average
retention time of air peak.
45
The quantity of each identified chemical constituent was determined by area
normalization method as followed
% area of compound A = area under peak A x 100
total area of all peaks
The qualitative and quantitative analysis of C. maxima peel and flower oil
using DB-5 were shown in Table 8 and 12. The qualitative and quantitative analysis
of C. maxima peel and flower oil using carbowax were shown in Table 9 and 13.
3.2 Quantification
The compounds in C. maxima oils and neroli that were chosen for
quantitative analysis were R-(+)-limonene, linalool, nerolidol and farnesol. These
compounds were the prominent compounds in essential oil of C. maxima flower oil
(steam distillation) of Vietnam (18.2, 16.4, 29.3 and 15.7%, respectively).60 As
shown in Table 13 and 14, C. maxima flower which were extracted by SCO2 (SC-f)
had the different amount of these four compounds : 86.20, 0.38, 0.59, 0.95%,
respectively, using DB-5 capillary column. The result showed that SC-f have higher
amount of R-(+)-limonene but lower amount of total oxygenated compounds than C.
maxima flower essential oil from Vietnam. These may happen from different variety,
extraction methods and cultivated area of C. maxima. To analyse the quantity of these
four compounds that contained in the essential oil samples (SCP, CP, VP, SC-f and
neroli), the standard curves of them were ploted using DB-5 capillary column and the
amount of each compound in ng/µl have been shown in the Table 7. The VP
contained the highest amount of R-(+)-limonene (833.56 ng/µl), neroli contained the
highest amount of linalool (158.62 ng/µl), while the highest amount of (E)-nerolidol
and (E, E)-farnesol were found in SC-f (4.20 and 5.35 ng/µl, respectively) compared
with SCP and CP. The other isomers of farnesol were found only in SCP and SC-f.
The SC-f had a little bit higher amount of farnesol isomer than SCP. It was interesting
that CP, VP and neroli had not faenesol and VP did not contain nerolidol. These
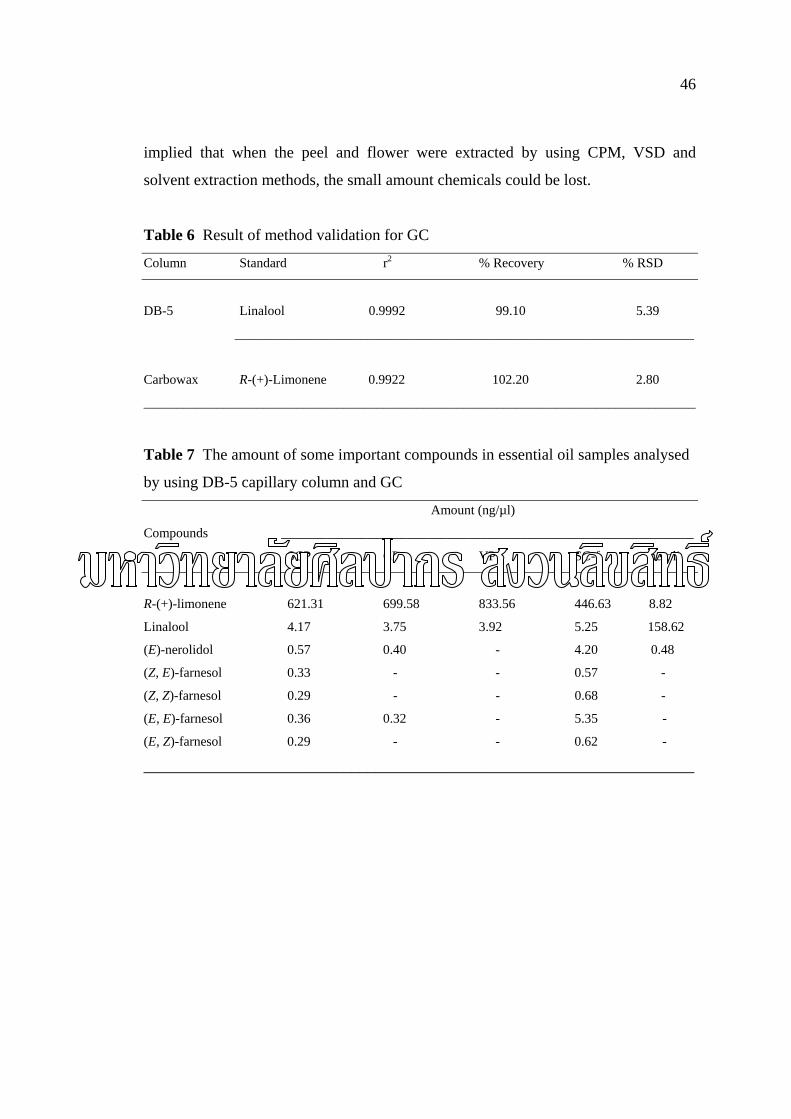
46
implied that when the peel and flower were extracted by using CPM, VSD and
solvent extraction methods, the small amount chemicals could be lost.
Table 6 Result of method validation for GC
Column Standard r2 % Recovery % RSD
DB-5 Linalool 0.9992 99.10 5.39
_____________________________________________________________________
Carbowax R-(+)-Limonene 0.9922 102.20 2.80
___________________________________________________________________________________
Table 7 The amount of some important compounds in essential oil samples analysed
by using DB-5 capillary column and GC
Amount (ng/µl)
Compounds ______________________________________________________________
SCP CP VP SC-f neroli
R-(+)-limonene 621.31 699.58 833.56 446.63 8.82
Linalool 4.17 3.75 3.92 5.25 158.62
(E)-nerolidol 0.57 0.40 - 4.20 0.48
(Z, E)-farnesol 0.33 - - 0.57 -
(Z, Z)-farnesol 0.29 - - 0.68 -
(E, E)-farnesol 0.36 0.32 - 5.35 -
(E, Z)-farnesol 0.29 - - 0.62 -
_____________________________________________________________________
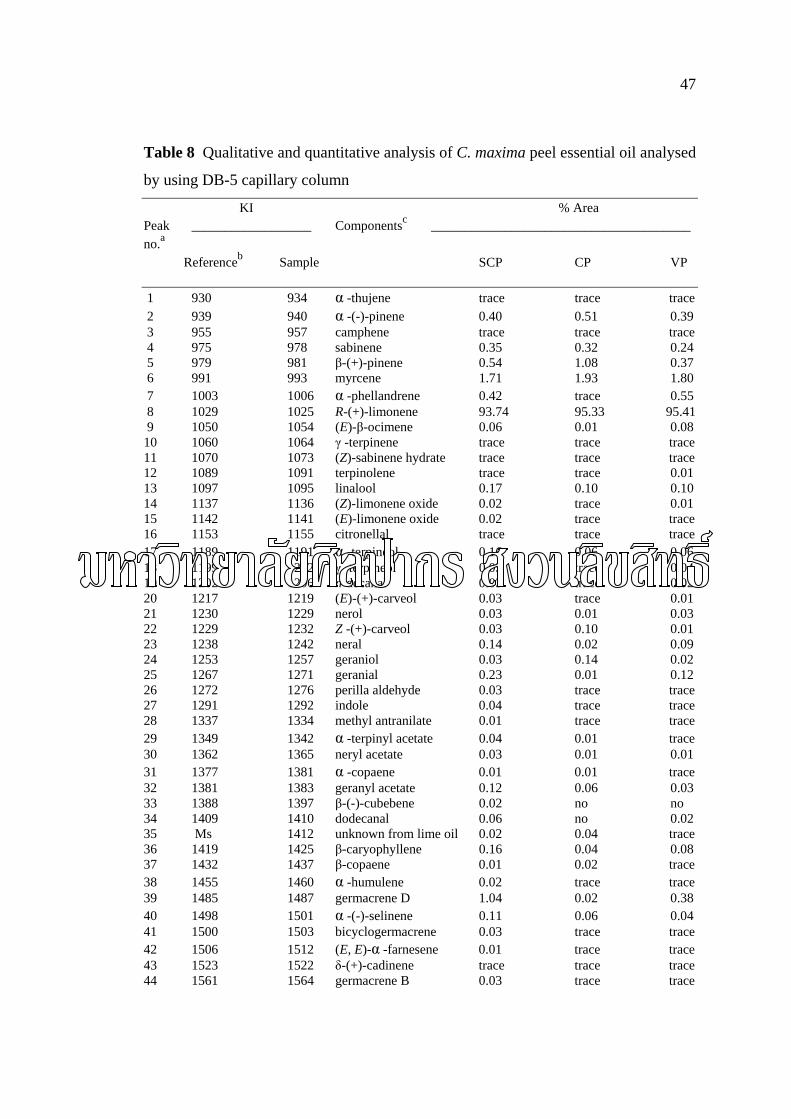
47
Table 8 Qualitative and quantitative analysis of C. maxima peel essential oil analysed
by using DB-5 capillary column
KI % Area Peak __________________ Componentsc _______________________________________ no.a Referenceb Sample SCP CP VP 1 930 934 α -thujene trace trace trace 2 939 940 α -(-)-pinene 0.40 0.51 0.39 3 955 957 camphene trace trace trace 4 975 978 sabinene 0.35 0.32 0.24 5 979 981 β-(+)-pinene 0.54 1.08 0.37 6 991 993 myrcene 1.71 1.93 1.80 7 1003 1006 α -phellandrene 0.42 trace 0.55 8 1029 1025 R-(+)-limonene 93.74 95.33 95.41 9 1050 1054 (E)-β-ocimene 0.06 0.01 0.08 10 1060 1064 γ -terpinene trace trace trace 11 1070 1073 (Z)-sabinene hydrate trace trace trace 12 1089 1091 terpinolene trace trace 0.01 13 1097 1095 linalool 0.17 0.10 0.10 14 1137 1136 (Z)-limonene oxide 0.02 trace 0.01 15 1142 1141 (E)-limonene oxide 0.02 trace trace 16 1153 1155 citronellal trace trace trace 17 1189 1191 α -terpineol 0.16 0.06 0.06 18 1199 1202 γ -terpineol 0.05 trace 0.04 19 1202 1206 n-decanal 0.03 trace 0.02 20 1217 1219 (E)-(+)-carveol 0.03 trace 0.01 21 1230 1229 nerol 0.03 0.01 0.03 22 1229 1232 Z -(+)-carveol 0.03 0.10 0.01 23 1238 1242 neral 0.14 0.02 0.09 24 1253 1257 geraniol 0.03 0.14 0.02 25 1267 1271 geranial 0.23 0.01 0.12 26 1272 1276 perilla aldehyde 0.03 trace trace 27 1291 1292 indole 0.04 trace trace 28 1337 1334 methyl antranilate 0.01 trace trace 29 1349 1342 α -terpinyl acetate 0.04 0.01 trace 30 1362 1365 neryl acetate 0.03 0.01 0.01 31 1377 1381 α -copaene 0.01 0.01 trace 32 1381 1383 geranyl acetate 0.12 0.06 0.03 33 1388 1397 β-(-)-cubebene 0.02 no no 34 1409 1410 dodecanal 0.06 no 0.02 35 Ms 1412 unknown from lime oil 0.02 0.04 trace 36 1419 1425 β-caryophyllene 0.16 0.04 0.08 37 1432 1437 β-copaene 0.01 0.02 trace 38 1455 1460 α -humulene 0.02 trace trace 39 1485 1487 germacrene D 1.04 0.02 0.38 40 1498 1501 α -(-)-selinene 0.11 0.06 0.04 41 1500 1503 bicyclogermacrene 0.03 trace trace 42 1506 1512 (E, E)-α -farnesene 0.01 trace trace 43 1523 1522 δ-(+)-cadinene trace trace trace 44 1561 1564 germacrene B 0.03 trace trace
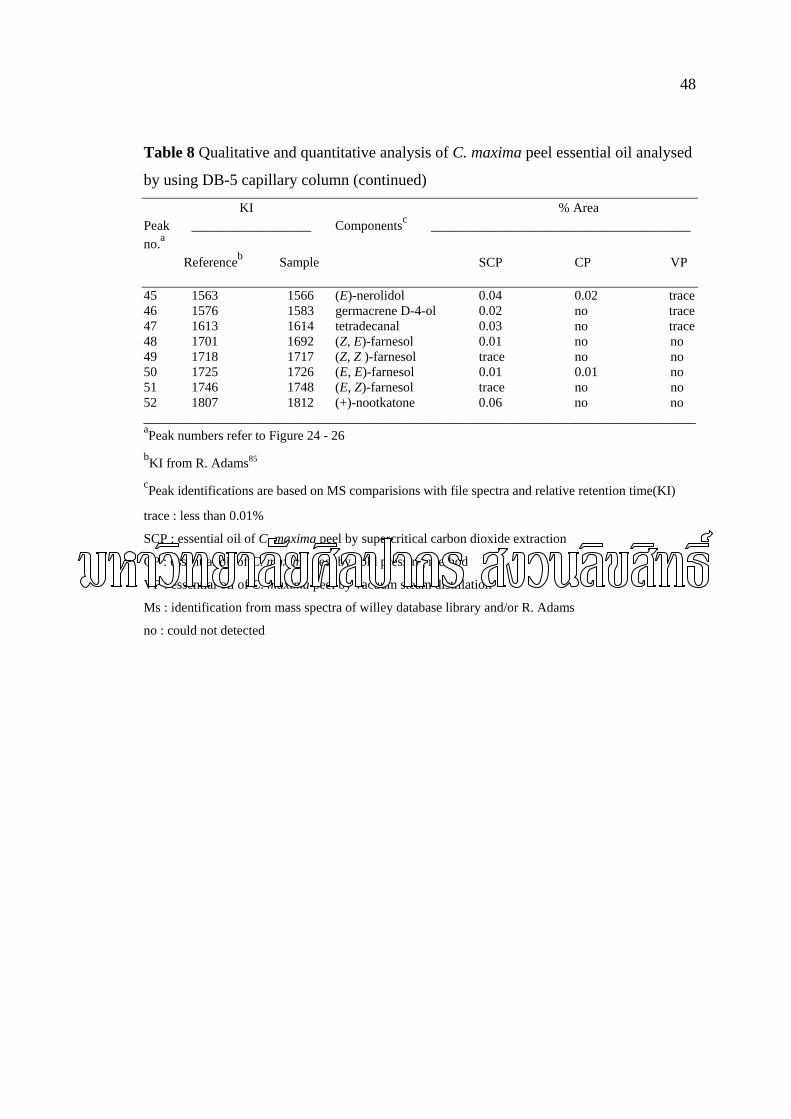
48
Table 8 Qualitative and quantitative analysis of C. maxima peel essential oil analysed
by using DB-5 capillary column (continued)
KI % Area Peak __________________ Componentsc _______________________________________ no.a Referenceb Sample SCP CP VP 45 1563 1566 (E)-nerolidol 0.04 0.02 trace 46 1576 1583 germacrene D-4-ol 0.02 no trace 47 1613 1614 tetradecanal 0.03 no trace 48 1701 1692 (Z, E)-farnesol 0.01 no no 49 1718 1717 (Z, Z )-farnesol trace no no 50 1725 1726 (E, E)-farnesol 0.01 0.01 no 51 1746 1748 (E, Z)-farnesol trace no no 52 1807 1812 (+)-nootkatone 0.06 no no ___________________________________________________________________________________ aPeak numbers refer to Figure 24 - 26 bKI from R. Adams85 cPeak identifications are based on MS comparisions with file spectra and relative retention time(KI)
trace : less than 0.01%
SCP : essential oil of C. maxima peel by supercritical carbon dioxide extraction
CP : essential oil of C. maxima peel by cold pressing method
VP : essential oil of C. maxima peel by vacuum steam distillation
Ms : identification from mass spectra of willey database library and/or R. Adams
no : could not detected
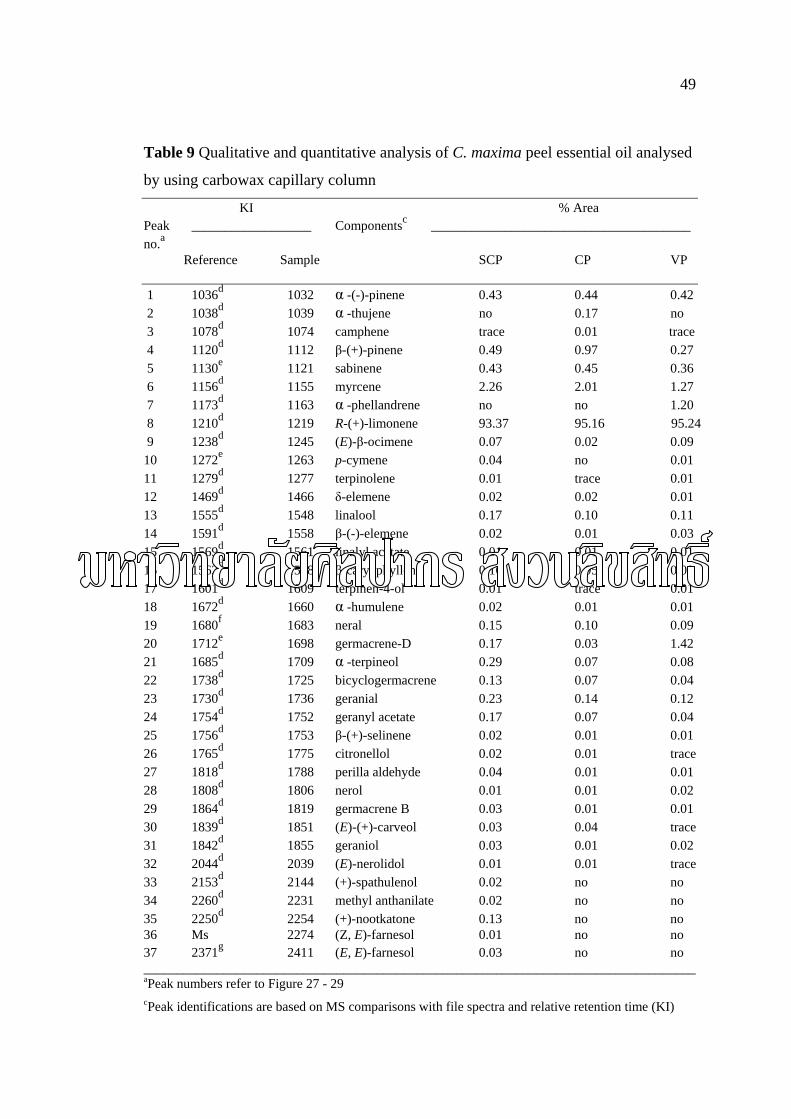
49
Table 9 Qualitative and quantitative analysis of C. maxima peel essential oil analysed
by using carbowax capillary column
KI % Area Peak __________________ Componentsc _______________________________________ no.a Reference Sample SCP CP VP 1 1036d 1032 α -(-)-pinene 0.43 0.44 0.42 2 1038d 1039 α -thujene no 0.17 no 3 1078d 1074 camphene trace 0.01 trace 4 1120d 1112 β-(+)-pinene 0.49 0.97 0.27 5 1130e 1121 sabinene 0.43 0.45 0.36 6 1156d 1155 myrcene 2.26 2.01 1.27 7 1173d 1163 α -phellandrene no no 1.20 8 1210d 1219 R-(+)-limonene 93.37 95.16 95.24 9 1238d 1245 (E)-β-ocimene 0.07 0.02 0.09 10 1272e 1263 p-cymene 0.04 no 0.01 11 1279d 1277 terpinolene 0.01 trace 0.01 12 1469d 1466 δ-elemene 0.02 0.02 0.01 13 1555d 1548 linalool 0.17 0.10 0.11 14 1591d 1558 β-(-)-elemene 0.02 0.01 0.03 15 1569d 1561 linalyl acetate 0.01 0.01 0.01 16 1562d 1588 β-caryophyllene 0.16 0.05 0.09 17 1601d 1609 terpinen-4-ol 0.01 trace 0.01 18 1672d 1660 α -humulene 0.02 0.01 0.01 19 1680f 1683 neral 0.15 0.10 0.09 20 1712e 1698 germacrene-D 0.17 0.03 1.42 21 1685d 1709 α -terpineol 0.29 0.07 0.08 22 1738d 1725 bicyclogermacrene 0.13 0.07 0.04 23 1730d 1736 geranial 0.23 0.14 0.12 24 1754d 1752 geranyl acetate 0.17 0.07 0.04 25 1756d 1753 β-(+)-selinene 0.02 0.01 0.01 26 1765d 1775 citronellol 0.02 0.01 trace 27 1818d 1788 perilla aldehyde 0.04 0.01 0.01 28 1808d 1806 nerol 0.01 0.01 0.02 29 1864d 1819 germacrene B 0.03 0.01 0.01 30 1839d 1851 (E)-(+)-carveol 0.03 0.04 trace 31 1842d 1855 geraniol 0.03 0.01 0.02 32 2044d 2039 (E)-nerolidol 0.01 0.01 trace 33 2153d 2144 (+)-spathulenol 0.02 no no 34 2260d 2231 methyl anthanilate 0.02 no no 35 2250d 2254 (+)-nootkatone 0.13 no no 36 Ms 2274 (Z, E)-farnesol 0.01 no no 37 2371g 2411 (E, E)-farnesol 0.03 no no ___________________________________________________________________________________ aPeak numbers refer to Figure 27 - 29 cPeak identifications are based on MS comparisons with file spectra and relative retention time (KI)
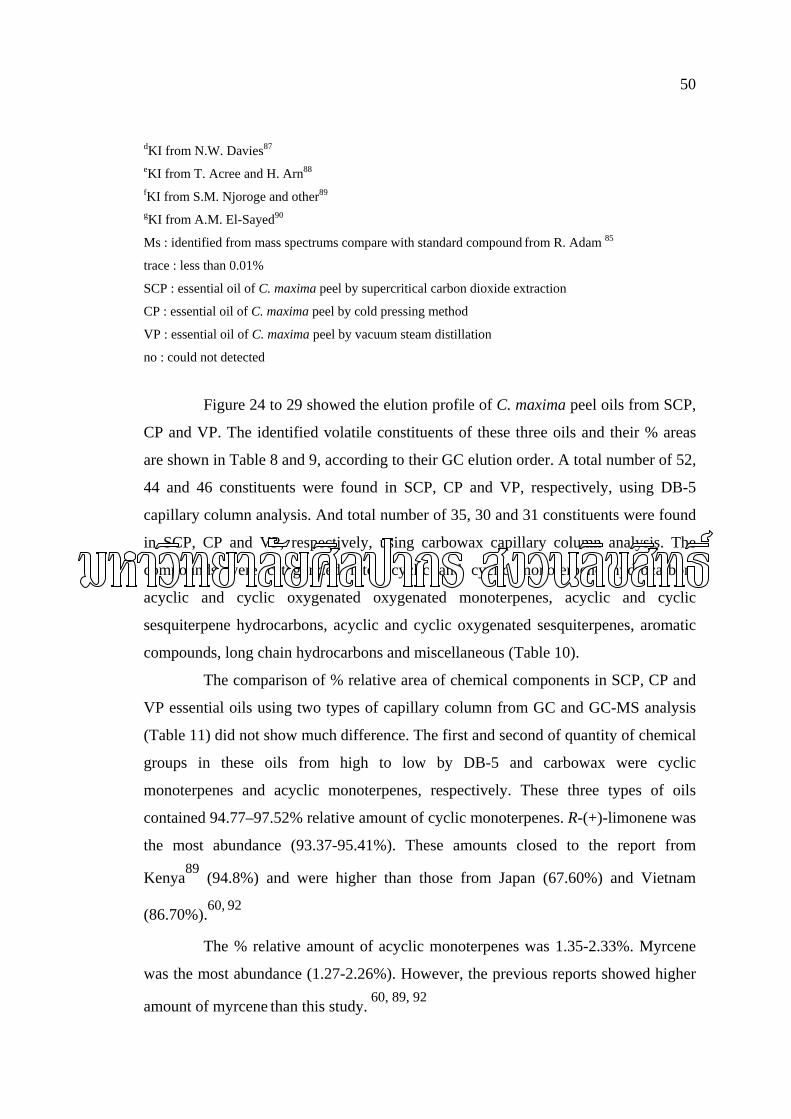
50
dKI from N.W. Davies87 eKI from T. Acree and H. Arn88 fKI from S.M. Njoroge and other89 gKI from A.M. El-Sayed90
Ms : identified from mass spectrums compare with standard compound from R. Adam 85
trace : less than 0.01%
SCP : essential oil of C. maxima peel by supercritical carbon dioxide extraction
CP : essential oil of C. maxima peel by cold pressing method
VP : essential oil of C. maxima peel by vacuum steam distillation
no : could not detected
Figure 24 to 29 showed the elution profile of C. maxima peel oils from SCP,
CP and VP. The identified volatile constituents of these three oils and their % areas
are shown in Table 8 and 9, according to their GC elution order. A total number of 52,
44 and 46 constituents were found in SCP, CP and VP, respectively, using DB-5
capillary column analysis. And total number of 35, 30 and 31 constituents were found
in SCP, CP and VP, respectively, using carbowax capillary column analysis. The
compounds were categorized into acyclic and cyclic monoterpene hydrocarbon,
acyclic and cyclic oxygenated oxygenated monoterpenes, acyclic and cyclic
sesquiterpene hydrocarbons, acyclic and cyclic oxygenated sesquiterpenes, aromatic
compounds, long chain hydrocarbons and miscellaneous (Table 10).
The comparison of % relative area of chemical components in SCP, CP and
VP essential oils using two types of capillary column from GC and GC-MS analysis
(Table 11) did not show much difference. The first and second of quantity of chemical
groups in these oils from high to low by DB-5 and carbowax were cyclic
monoterpenes and acyclic monoterpenes, respectively. These three types of oils
contained 94.77–97.52% relative amount of cyclic monoterpenes. R-(+)-limonene was
the most abundance (93.37-95.41%). These amounts closed to the report from
Kenya89 (94.8%) and were higher than those from Japan (67.60%) and Vietnam
(86.70%).60, 92
The % relative amount of acyclic monoterpenes was 1.35-2.33%. Myrcene
was the most abundance (1.27-2.26%). However, the previous reports showed higher
amount of myrcene than this study. 60, 89, 92
51
The chromatogram of SCP presented more number of peaks than the other
methods. It contained some components that could not be detected in other oil
samples, for example, (+)-spathulenol, methyl anthanilate, farnesol and
(+)-nootkatone. In addition, SCP contained higher amount of total oxygenated
compounds than CP and VP. The amount of total oxygenated compounds from DB-5
of SCP, CP and VP were 1.25, 0.60 and 0.61, respectively. The amount of total
oxygenated compounds from carbowax of SCP, CP and VP were 1.37, 0.55 and 0.52,
respectively.
The chemical transformations could occur during the distillation of lime oil
by subject to high temperatures (95-105 °C) for long periods (6-12 hours) in a very
acidic environment (pH 2.2-2.4). The report about lime oil indicated that lime oil
suffered deep modifications in its composition : neral, geranial and sabinene almost
disappeared; α- and β-pinene reacted to different extent (β-pinene could react
approximately 10 times faster than α-pinene to form 1,4- and 1,8-cineole, terpinolene,
α-terpineol and p-cymene).4 Although, the essential oils extraction for SCP, CP and
VP were the methods which avoided the conditions that might cause chemical
transformation, (temperature lower than 95 °C, 3 hours extraction time and without
the acidic condition), a little amount of chemical transformated compounds still
happened such as: (Z)-sabinene hydrate and p-cymene. The (Z)-sabinene hydrate was
detected in SCP, CP and VP less than 0.01% by DB-5 capillary column. The amount
of p-cymene which was found in SCP and VP were 0.04 and 0.01%, respectively, by
carbowax capillary column.
There were some chemicals that could not be detected by polar column and
some could not be detected by nonpolar column. Therefore, using of two different
column polarities could present some of different chemical compounds that were
determined only in each column. The chemical components of peel oils that were
detected only in DB-5 were γ-terpinene, (Z)-limonene oxide, (E)-limonene oxide,
citronellal, γ-terpineol, n-decanal, (Z)-(+)-carveol, indole, α-terpinyl acetate, neryl
acetate, α-copaene, β-(-)-cubebene, dodecanal, β-copaene, α-(-)-selinene, δ-(+)-
cadinene, germacrene D-4-ol, tetradecanal, (Z, Z)-farnesol and (E, E)-farnesol. The
chemical components of peel oils that were detected only in carbowax were δ-
52
elemene, β-(-)-elemene, linayl acetate, β-(+)-selinene, citronellol and (+)-spathulenol.
SCP contained higher amount of α-terpineol, neral and geranial than the other oils,
while CP had β-(+)-pinene in higher amount than the other oils. In addition, SCP, CP
and VP showed close amount of sabinene and α-(-)-pinene. These results suggested
that SCO2 had extraction capacity stronger than the other methods. SCO2 gave less of
deterioration of essential oil components. Since SCO2 method avoided factors that
caused chemical transformations. The VP really showed higher deterioration of some
volatile components than CP.
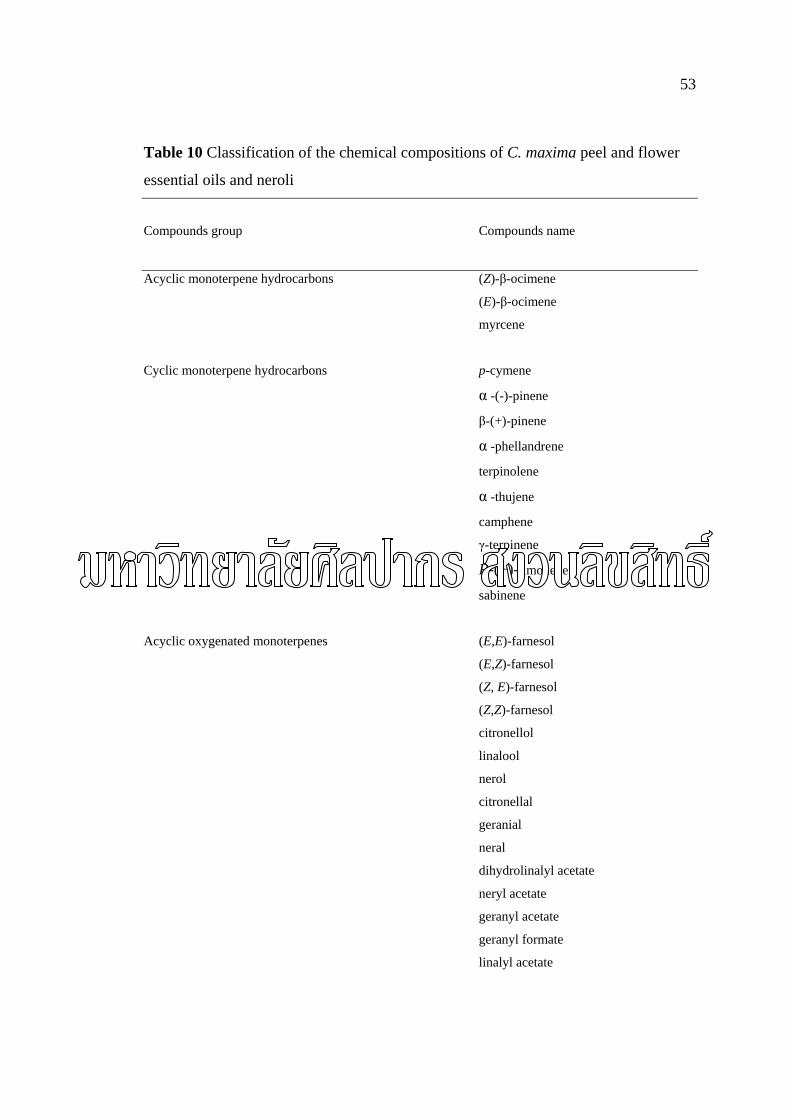
53
Table 10 Classification of the chemical compositions of C. maxima peel and flower
essential oils and neroli
Compounds group Compounds name
Acyclic monoterpene hydrocarbons (Z)-β-ocimene
(E)-β-ocimene
myrcene
Cyclic monoterpene hydrocarbons p-cymene
α -(-)-pinene
β-(+)-pinene
α -phellandrene
terpinolene
α -thujene
camphene
γ-terpinene R-(+)-limonene
sabinene
Acyclic oxygenated monoterpenes (E,E)-farnesol
(E,Z)-farnesol
(Z, E)-farnesol
(Z,Z)-farnesol
citronellol
linalool
nerol
citronellal
geranial
neral
dihydrolinalyl acetate
neryl acetate
geranyl acetate
geranyl formate
linalyl acetate
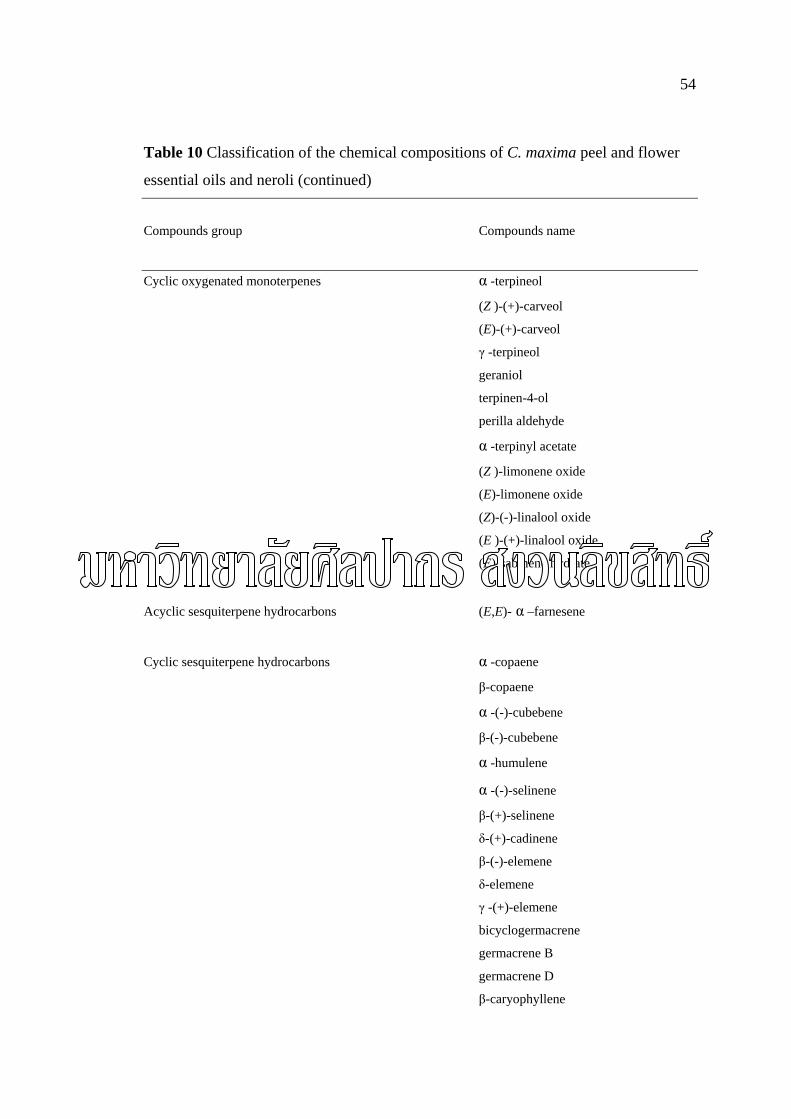
54
Table 10 Classification of the chemical compositions of C. maxima peel and flower
essential oils and neroli (continued)
Compounds group Compounds name
Cyclic oxygenated monoterpenes α -terpineol
(Z )-(+)-carveol
(E)-(+)-carveol
γ -terpineol
geraniol
terpinen-4-ol
perilla aldehyde
α -terpinyl acetate
(Z )-limonene oxide
(E)-limonene oxide
(Z)-(-)-linalool oxide
(E )-(+)-linalool oxide
(E)-sabinene hydrate
Acyclic sesquiterpene hydrocarbons (E,E)- α –farnesene
Cyclic sesquiterpene hydrocarbons α -copaene
β-copaene
α -(-)-cubebene
β-(-)-cubebene
α -humulene
α -(-)-selinene
β-(+)-selinene
δ-(+)-cadinene
β-(-)-elemene
δ-elemene
γ -(+)-elemene
bicyclogermacrene
germacrene B
germacrene D
β-caryophyllene
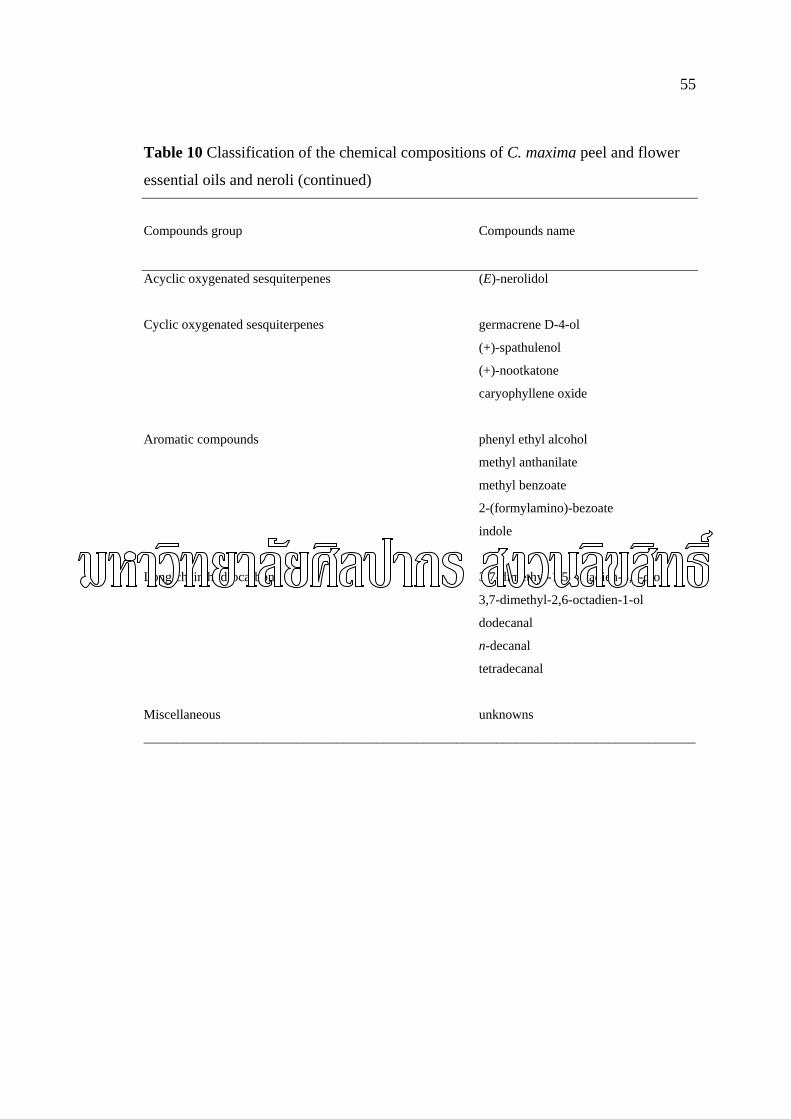
55
Table 10 Classification of the chemical compositions of C. maxima peel and flower
essential oils and neroli (continued)
Compounds group Compounds name
Acyclic oxygenated sesquiterpenes (E)-nerolidol
Cyclic oxygenated sesquiterpenes germacrene D-4-ol
(+)-spathulenol
(+)-nootkatone
caryophyllene oxide
Aromatic compounds phenyl ethyl alcohol
methyl anthanilate
methyl benzoate
2-(formylamino)-bezoate
indole
Long chain hydrocarbons 3,7-dimethyl-1,5-octadien-3,7-diol
3,7-dimethyl-2,6-octadien-1-ol
dodecanal
n-decanal
tetradecanal
Miscellaneous unknowns
___________________________________________________________________________________
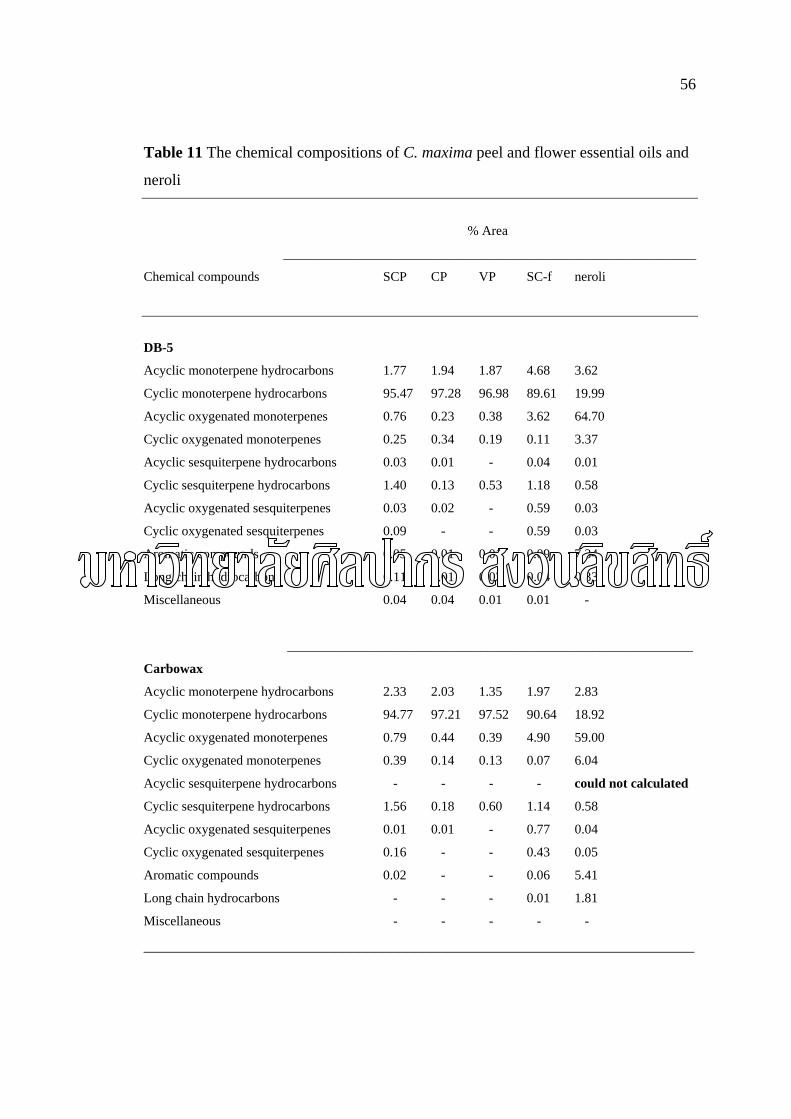
56
Table 11 The chemical compositions of C. maxima peel and flower essential oils and
neroli
% Area
______________________________________________________________
Chemical compounds SCP CP VP SC-f neroli
DB-5
Acyclic monoterpene hydrocarbons 1.77 1.94 1.87 4.68 3.62
Cyclic monoterpene hydrocarbons 95.47 97.28 96.98 89.61 19.99
Acyclic oxygenated monoterpenes 0.76 0.23 0.38 3.62 64.70
Cyclic oxygenated monoterpenes 0.25 0.34 0.19 0.11 3.37
Acyclic sesquiterpene hydrocarbons 0.03 0.01 - 0.04 0.01
Cyclic sesquiterpene hydrocarbons 1.40 0.13 0.53 1.18 0.58
Acyclic oxygenated sesquiterpenes 0.03 0.02 - 0.59 0.03
Cyclic oxygenated sesquiterpenes 0.09 - - 0.59 0.03
Aromatic compounds 0.05 0.01 0.01 0.09 7.34
Long chain hydrocarbons 0.11 0.01 0.03 0.04 0.33
Miscellaneous 0.04 0.04 0.01 0.01 -
_____________________________________________________________
Carbowax
Acyclic monoterpene hydrocarbons 2.33 2.03 1.35 1.97 2.83
Cyclic monoterpene hydrocarbons 94.77 97.21 97.52 90.64 18.92
Acyclic oxygenated monoterpenes 0.79 0.44 0.39 4.90 59.00
Cyclic oxygenated monoterpenes 0.39 0.14 0.13 0.07 6.04
Acyclic sesquiterpene hydrocarbons - - - - could not calculated
Cyclic sesquiterpene hydrocarbons 1.56 0.18 0.60 1.14 0.58
Acyclic oxygenated sesquiterpenes 0.01 0.01 - 0.77 0.04
Cyclic oxygenated sesquiterpenes 0.16 - - 0.43 0.05
Aromatic compounds 0.02 - - 0.06 5.41
Long chain hydrocarbons - - - 0.01 1.81
Miscellaneous - - - - -
_____________________________________________________________________
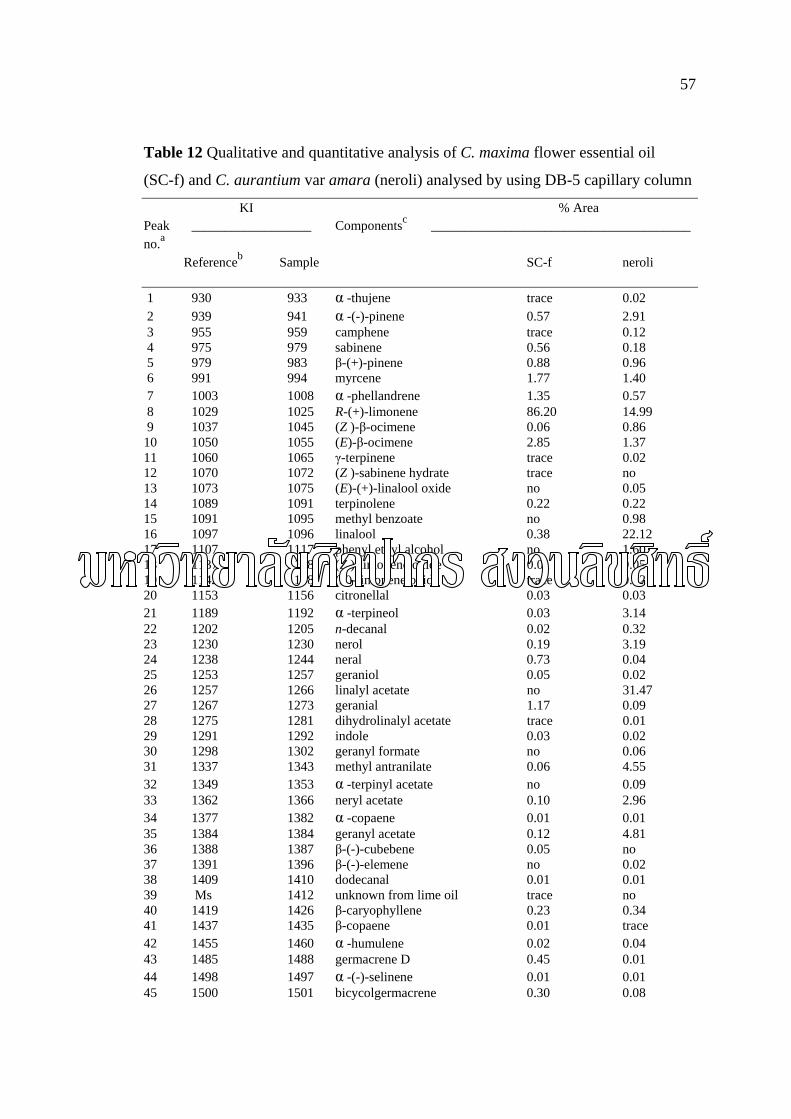
57
Table 12 Qualitative and quantitative analysis of C. maxima flower essential oil
(SC-f) and C. aurantium var amara (neroli) analysed by using DB-5 capillary column
KI % Area Peak __________________ Componentsc _______________________________________ no.a Referenceb Sample SC-f neroli 1 930 933 α -thujene trace 0.02 2 939 941 α -(-)-pinene 0.57 2.91 3 955 959 camphene trace 0.12 4 975 979 sabinene 0.56 0.18 5 979 983 β-(+)-pinene 0.88 0.96 6 991 994 myrcene 1.77 1.40 7 1003 1008 α -phellandrene 1.35 0.57 8 1029 1025 R-(+)-limonene 86.20 14.99 9 1037 1045 (Z )-β-ocimene 0.06 0.86 10 1050 1055 (E)-β-ocimene 2.85 1.37 11 1060 1065 γ-terpinene trace 0.02 12 1070 1072 (Z )-sabinene hydrate trace no 13 1073 1075 (E)-(+)-linalool oxide no 0.05 14 1089 1091 terpinolene 0.22 0.22 15 1091 1095 methyl benzoate no 0.98 16 1097 1096 linalool 0.38 22.12 17 1107 1117 phenyl ethyl alcohol no 1.60 18 1137 1138 (Z )-limonene oxide 0.01 0.05 19 1142 1148 (E)-limonene oxide trace 0.02 20 1153 1156 citronellal 0.03 0.03 21 1189 1192 α -terpineol 0.03 3.14 22 1202 1205 n-decanal 0.02 0.32 23 1230 1230 nerol 0.19 3.19 24 1238 1244 neral 0.73 0.04 25 1253 1257 geraniol 0.05 0.02 26 1257 1266 linalyl acetate no 31.47 27 1267 1273 geranial 1.17 0.09 28 1275 1281 dihydrolinalyl acetate trace 0.01 29 1291 1292 indole 0.03 0.02 30 1298 1302 geranyl formate no 0.06 31 1337 1343 methyl antranilate 0.06 4.55 32 1349 1353 α -terpinyl acetate no 0.09 33 1362 1366 neryl acetate 0.10 2.96 34 1377 1382 α -copaene 0.01 0.01 35 1384 1384 geranyl acetate 0.12 4.81 36 1388 1387 β-(-)-cubebene 0.05 no 37 1391 1396 β-(-)-elemene no 0.02 38 1409 1410 dodecanal 0.01 0.01 39 Ms 1412 unknown from lime oil trace no 40 1419 1426 β-caryophyllene 0.23 0.34 41 1437 1435 β-copaene 0.01 trace 42 1455 1460 α -humulene 0.02 0.04 43 1485 1488 germacrene D 0.45 0.01 44 1498 1497 α -(-)-selinene 0.01 0.01 45 1500 1501 bicycolgermacrene 0.30 0.08
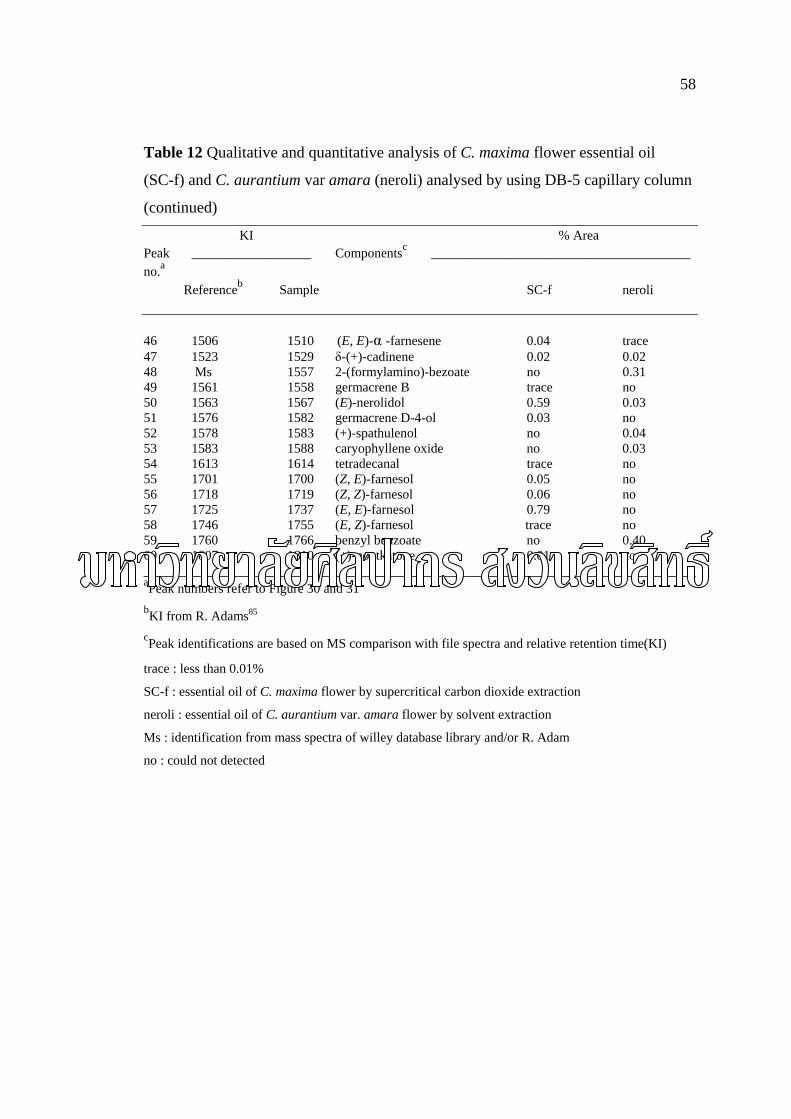
58
Table 12 Qualitative and quantitative analysis of C. maxima flower essential oil
(SC-f) and C. aurantium var amara (neroli) analysed by using DB-5 capillary column
(continued)
KI % Area Peak __________________ Componentsc _______________________________________ no.a Referenceb Sample SC-f neroli 46 1506 1510 (E, E)-α -farnesene 0.04 trace 47 1523 1529 δ-(+)-cadinene 0.02 0.02 48 Ms 1557 2-(formylamino)-bezoate no 0.31 49 1561 1558 germacrene B trace no 50 1563 1567 (E)-nerolidol 0.59 0.03 51 1576 1582 germacrene D-4-ol 0.03 no 52 1578 1583 (+)-spathulenol no 0.04 53 1583 1588 caryophyllene oxide no 0.03 54 1613 1614 tetradecanal trace no 55 1701 1700 (Z, E)-farnesol 0.05 no 56 1718 1719 (Z, Z)-farnesol 0.06 no 57 1725 1737 (E, E)-farnesol 0.79 no 58 1746 1755 (E, Z)-farnesol trace no 59 1760 1766 benzyl benzoate no 0.40 60 1807 1810 (+)-nootkatone 0.01 no ___________________________________________________________________________________ aPeak numbers refer to Figure 30 and 31 bKI from R. Adams85 cPeak identifications are based on MS comparison with file spectra and relative retention time(KI)
trace : less than 0.01%
SC-f : essential oil of C. maxima flower by supercritical carbon dioxide extraction
neroli : essential oil of C. aurantium var. amara flower by solvent extraction
Ms : identification from mass spectra of willey database library and/or R. Adam
no : could not detected
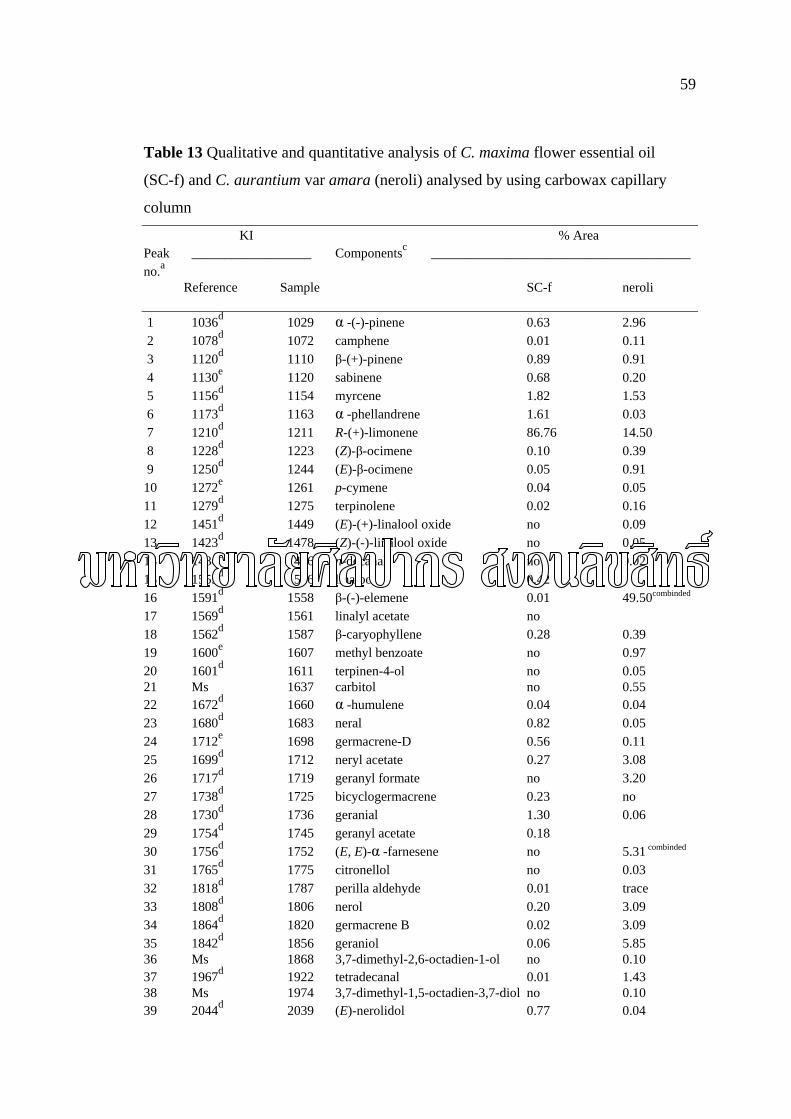
59
Table 13 Qualitative and quantitative analysis of C. maxima flower essential oil
(SC-f) and C. aurantium var amara (neroli) analysed by using carbowax capillary
column
KI % Area Peak __________________ Componentsc _______________________________________ no.a Reference Sample SC-f neroli 1 1036d 1029 α -(-)-pinene 0.63 2.96 2 1078d 1072 camphene 0.01 0.11 3 1120d 1110 β-(+)-pinene 0.89 0.91 4 1130e 1120 sabinene 0.68 0.20 5 1156d 1154 myrcene 1.82 1.53 6 1173d 1163 α -phellandrene 1.61 0.03 7 1210d 1211 R-(+)-limonene 86.76 14.50 8 1228d 1223 (Z)-β-ocimene 0.10 0.39 9 1250d 1244 (E)-β-ocimene 0.05 0.91 10 1272e 1261 p-cymene 0.04 0.05 11 1279d 1275 terpinolene 0.02 0.16 12 1451d 1449 (E)-(+)-linalool oxide no 0.09 13 1423d 1478 (Z)-(-)-linalool oxide no 0.05 14 1484e 1496 n-decanal no 0.02
15 1555d 1546 linalool 0.42 16 1591d 1558 β-(-)-elemene 0.01 49.50combinded
17 1569d 1561 linalyl acetate no 18 1562d 1587 β-caryophyllene 0.28 0.39 19 1600e 1607 methyl benzoate no 0.97 20 1601d 1611 terpinen-4-ol no 0.05 21 Ms 1637 carbitol no 0.55 22 1672d 1660 α -humulene 0.04 0.04 23 1680d 1683 neral 0.82 0.05 24 1712e 1698 germacrene-D 0.56 0.11 25 1699d 1712 neryl acetate 0.27 3.08 26 1717d 1719 geranyl formate no 3.20 27 1738d 1725 bicyclogermacrene 0.23 no 28 1730d 1736 geranial 1.30 0.06 29 1754d 1745 geranyl acetate 0.18 30 1756d 1752 (E, E)-α -farnesene no 5.31 combinded 31 1765d 1775 citronellol no 0.03 32 1818d 1787 perilla aldehyde 0.01 trace 33 1808d 1806 nerol 0.20 3.09 34 1864d 1820 germacrene B 0.02 3.09 35 1842d 1856 geraniol 0.06 5.85 36 Ms 1868 3,7-dimethyl-2,6-octadien-1-ol no 0.10 37 1967d 1922 tetradecanal 0.01 1.43 38 Ms 1974 3,7-dimethyl-1,5-octadien-3,7-diol no 0.10 39 2044d 2039 (E)-nerolidol 0.77 0.04
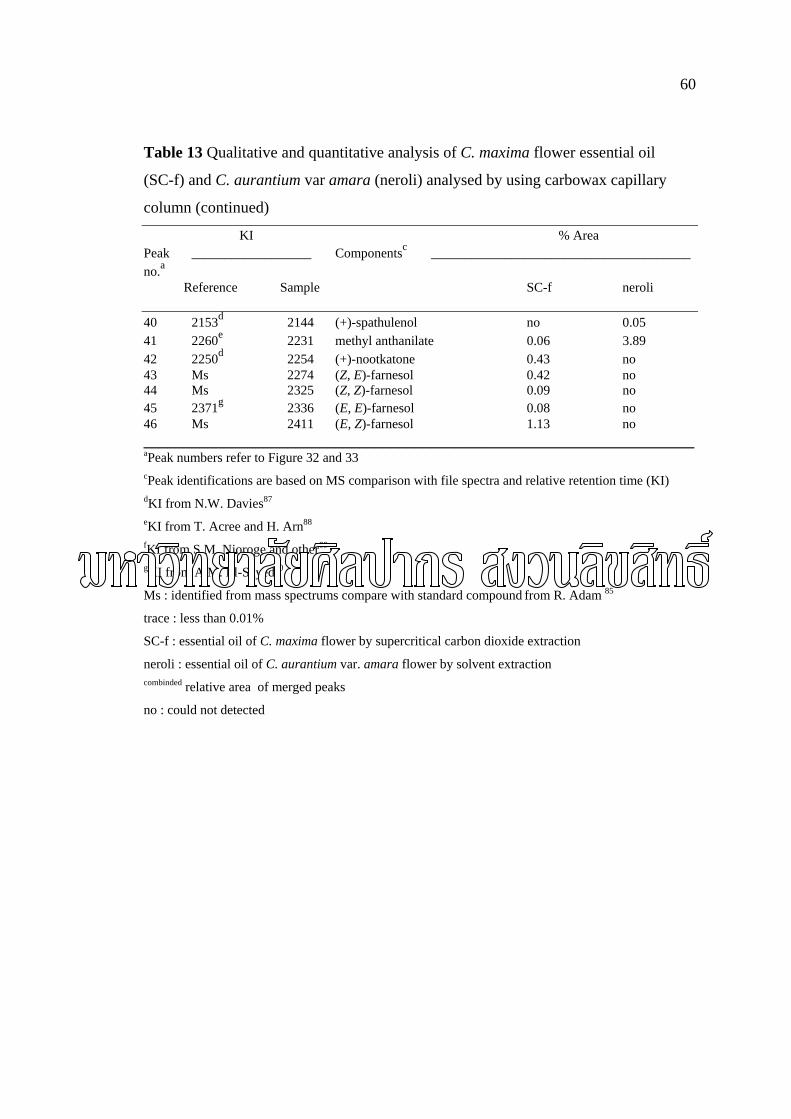
60
Table 13 Qualitative and quantitative analysis of C. maxima flower essential oil
(SC-f) and C. aurantium var amara (neroli) analysed by using carbowax capillary
column (continued)
KI % Area Peak __________________ Componentsc _______________________________________ no.a Reference Sample SC-f neroli 40 2153d 2144 (+)-spathulenol no 0.05 41 2260e 2231 methyl anthanilate 0.06 3.89 42 2250d 2254 (+)-nootkatone 0.43 no 43 Ms 2274 (Z, E)-farnesol 0.42 no 44 Ms 2325 (Z, Z)-farnesol 0.09 no 45 2371g 2336 (E, E)-farnesol 0.08 no 46 Ms 2411 (E, Z)-farnesol 1.13 no _____________________________________________________________________ aPeak numbers refer to Figure 32 and 33 cPeak identifications are based on MS comparison with file spectra and relative retention time (KI) dKI from N.W. Davies87 eKI from T. Acree and H. Arn88 fKI from S.M. Njoroge and other89 gKI from A.M. El-Sayed90
Ms : identified from mass spectrums compare with standard compound from R. Adam 85
trace : less than 0.01%
SC-f : essential oil of C. maxima flower by supercritical carbon dioxide extraction
neroli : essential oil of C. aurantium var. amara flower by solvent extraction combinded relative area of merged peaks
no : could not detected
61
The elution profile of C. maxima flower oil (SC-f, spectra 12 and 14) and
neroli (13 and 15) using DB-5 and carbowax capillary column, respectively. The
identification and the relative area of chemicals of C. maxima flower oil and neroli
was shown in Table 12 and 13. For neroli analysis using carbowax, there were 2
merged peaks happen at peak numbers 15 to 17 and peak numbers 29 to 30. The first
merged peak contained linalool, β-(-)-elemene and linalyl acetate. The second merged
peak contained (E,E)-α-farnesene and geranyl acetate. This conclusion was confirmed
by peaks and % relative areas of those compounds in neroli that were separated by
DB-5 column.
The analysed data of DB-5 column showed that SC-f and neroli had 49
constituents but some compounds were different. The compounds that appeared in
both SC-f and neroli were R-(+)-limonene, linalool, α-(-)-, β-(+)-pinene, sabinene,
myrcene, α-phellandrene, (Z)-β-ocimene, (E)-β-ocimene, γ-terpinene, terpinolene,
citronellal, α-tepineol, nerol, neral, geraniol, geranial, indole, methyl anthranilate,
neryl acetate, geranyl acetate, dodecanal, β-caryophyllene, α-humulene, germacrene
D, α-(-)-selinene, bicyclogermacrene, (E,E)-α-farnesene, δ-(+)-cadinene, (E)-
nerolidol, etc. However, their relative peak areas were different. When the data were
categorized in Table 11, the results showed that neroli contained more various type of
oxygenated compounds than SC-f, especially oxygenated cyclic monoterpenes,
oxygenated acyclic monoterpenes and other oxygenated compounds such as neryl
acetate (2.96, 0.10%), geranyl acetate (4.81, 0.12%), methyl anthranilate (4.55,
0.06%), linalool (22.12, 0.38%), nerol (3.19, 0.19%), [percent in parenthesis means %
relative amount of those compound belongs to neroli and SC-f, repectively]. While
the SC-f contained more terpene hydrocarbons than neroli (90.83, 20.55%),
especially, R-(+)-limonene (86.20, 14.99%), [percent in parenthesis means % relative
amount of those compound belongs to SC-f and neroli, repectively]. The compounds
that were found only in neroli when detected with DB-5 and carbowax were methyl
benzoate, benzyl benzoate, 2-(formylamine)-benzoate, (+)-spathulenol, caryophyllene
oxide, linalyl acetate and phenyl ethyl alcohol. On the other hand, the compounds that
were found only in SC-f when detected with DB-5 and carbowax were (Z)-sabinene
hydrate, β-(-)-cubebene, gernacrene D-4-ol, farnesol and (+)-nootkatone. These
different results may cause by the different species and extraction methods of the raw
62
materials. By using solvent extraction, neroli still contained the solvent residue,
phenyl ethyl alcohol, and other additive substances, benzoate compounds.
(+)-Nootkatone is the characteristic aroma compound of grapefruit peel oil,
which genetic relatively close to C. maxima.1, 92 (+)-Nootkatone was also found in
the C. maxima flower by SCO2 extraction but was not found in steam distillation
flower oil from Vietnam.60 There were some literatures reported the appearance of
some isomer of farnesol in neroli oil derived from bitter orange flower.5 However, in
this study, the farnesol could not be detected in neroli oil derived from C.aurantium
var. amara. The GC analysis data of SCP and SC-f showed that, they contained low
amount of all isomer of farnesol. As suggestion above, the SCO2 extraction could
extract the higher boiling points components better than the CPM and VSD.
The volatile components of SC-f and neroli that were detected only by DB-5
were γ-terpinene, (Z)-sabinene hydrate, phenyl ethyl alcohol, (Z)-limonene oxide, (E)-
limonene oxide, citronellal, α-terpineol, n-decanol, dihydrolinayl acetate, indole, α-
terpinyl acetate, α-copaene, dodecanal, β-copaene, α-(-)-selinene, δ-(+)-cadinene, 2-
(formylamino)-benzoate, germacrene D-4-ol, caryophyllene oxide, (E,E)-fanesol,
(E,Z)-fanesol and benzyl benzoate.
The volatile component of SC-f and neroli that were detected only by
carbowax were p-cymene, carbitol, β-citronellol, perilla aldehyde, 3,7-dimethyl-2,6-
octadiene-1-ol, 3,7-dimethyl-1,5-octadiene-3,7-diol.
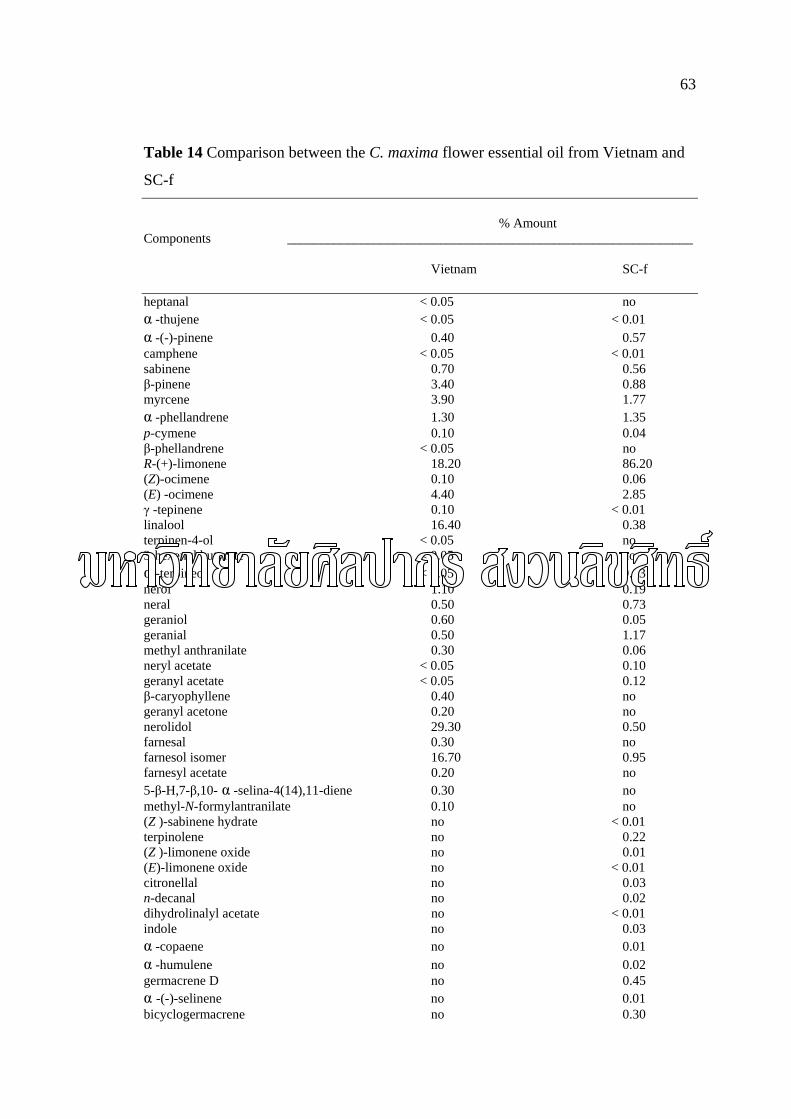
63
Table 14 Comparison between the C. maxima flower essential oil from Vietnam and
SC-f
% Amount
Components _____________________________________________________________ Vietnam SC-f heptanal < 0.05 no α -thujene < 0.05 < 0.01 α -(-)-pinene 0.40 0.57 camphene < 0.05 < 0.01 sabinene 0.70 0.56 β-pinene 3.40 0.88 myrcene 3.90 1.77 α -phellandrene 1.30 1.35 p-cymene 0.10 0.04 β-phellandrene < 0.05 no R-(+)-limonene 18.20 86.20 (Z)-ocimene 0.10 0.06 (E) -ocimene 4.40 2.85 γ -tepinene 0.10 < 0.01 linalool 16.40 0.38 terpinen-4-ol < 0.05 no 3-hexenyl butyrate < 0.05 no α -terpineol < 0.05 0.03 nerol 1.10 0.19 neral 0.50 0.73 geraniol 0.60 0.05 geranial 0.50 1.17 methyl anthranilate 0.30 0.06 neryl acetate < 0.05 0.10 geranyl acetate < 0.05 0.12 β-caryophyllene 0.40 no geranyl acetone 0.20 no nerolidol 29.30 0.50 farnesal 0.30 no farnesol isomer 16.70 0.95 farnesyl acetate 0.20 no 5-β-H,7-β,10- α -selina-4(14),11-diene 0.30 no methyl-N-formylantranilate 0.10 no (Z )-sabinene hydrate no < 0.01 terpinolene no 0.22 (Z )-limonene oxide no 0.01 (E)-limonene oxide no < 0.01 citronellal no 0.03 n-decanal no 0.02 dihydrolinalyl acetate no < 0.01 indole no 0.03 α -copaene no 0.01 α -humulene no 0.02 germacrene D no 0.45 α -(-)-selinene no 0.01 bicyclogermacrene no 0.30

64
Table 14 Comparison between the C. maxima flower essential oil from Vietnam and
SC-f (continued)
% relative amount
Components _____________________________________________________________ Vietnam SC-f (E, E)- α -farnesene no 0.04 δ-(+)-cadinene no 0.02 germacrene B no < 0.01 germacrene D-4-ol no 0.03 tetradecanal no < 0.01 (+)-nootkatone no 0.01 ___________________________________________________________________________________ SC-f : C. maxima flower essential oil by SCO2 extraction
Vietnam : C. maxima (J.Burman) flower essential oil by steam distillation from Vietnam
no : could not detected
The comparison between the C. maxima flower essential oil from Vietnam
and SC-f were shown in Table 14. The SC-f contained the higher % relative amount
of R-(+)-limonene, geranial, neryl acetate and geranyl acetate while the %relative
amount of linalool, farnesol, nerolidol, geraniol, nerol, ocimene, myrcene and β-(+)-
pinene were high in the oil from Vietnam. The SC-f also contained the fewer
amounts of high boiling components such as (+)-nootkatone, germacrene,
tetradecanal, etc. SC-f did not present some components that had in flower oil from
Vietnam such as 3-hexenyl burytate, farnesyl acetate, methyl-N-formylantranilate, 5-
β-H,7-β,10-α-selina-4(14),11-diene, heptanal, β-phellandrene, terpinen-4-ol, β-
caryophyllene, geranyl acetone and farnesal. As the result, the difference might be
caused by these different variety, extraction methods and the cultivated area of C.
maxima. The SC-f was extracted by SCO2 had come from flower of C. maxima
cultuva. khao-yai, cultivated in Samutsongkarm province of Thailand, and the oil
from Vietnam derived from C. maxima flower that was extracted by steam distillation
and cultivated in Dan Phuong district, Hanoi, Vietnam.
65
The comparison the percentages of the main components of flower essential
oil among SC-f, neroli, C. maxima flower oil prepared by steam distillation from
Vietnam23, and bitter orange flower oil (C. aurantium L. subsp. amara) by steam
distillaiton published in British Pharmacopoeia (BP)13 were shown in Table 15. The
amount of most major components of neroli oil were in the acceptable percentage
range that were reported in BP. Neroli contained higher amount of methyl anthranilate
and linalyl acetate than that report in BP. The reason of these differ may come from
the different extraction methods, different cultivated area and extraction skills. SC-f
showed the great difference in amount of R-(+)-limonene (86.20%) and linalool
(0.38%) from the other Citrus flower essential oils. The SC-f and the oil from
Vietnam contained lower amount of the oxygenated compounds than both of C.
aurantium flower oils, such as α-terpineol, neryl acetate, geranyl acetate and methyl
anthranilate. Linalyl acetate was not detected in C. maxima. Finally, the (E)-nerolidol
contained the highest amount in the oil from Vietnam.
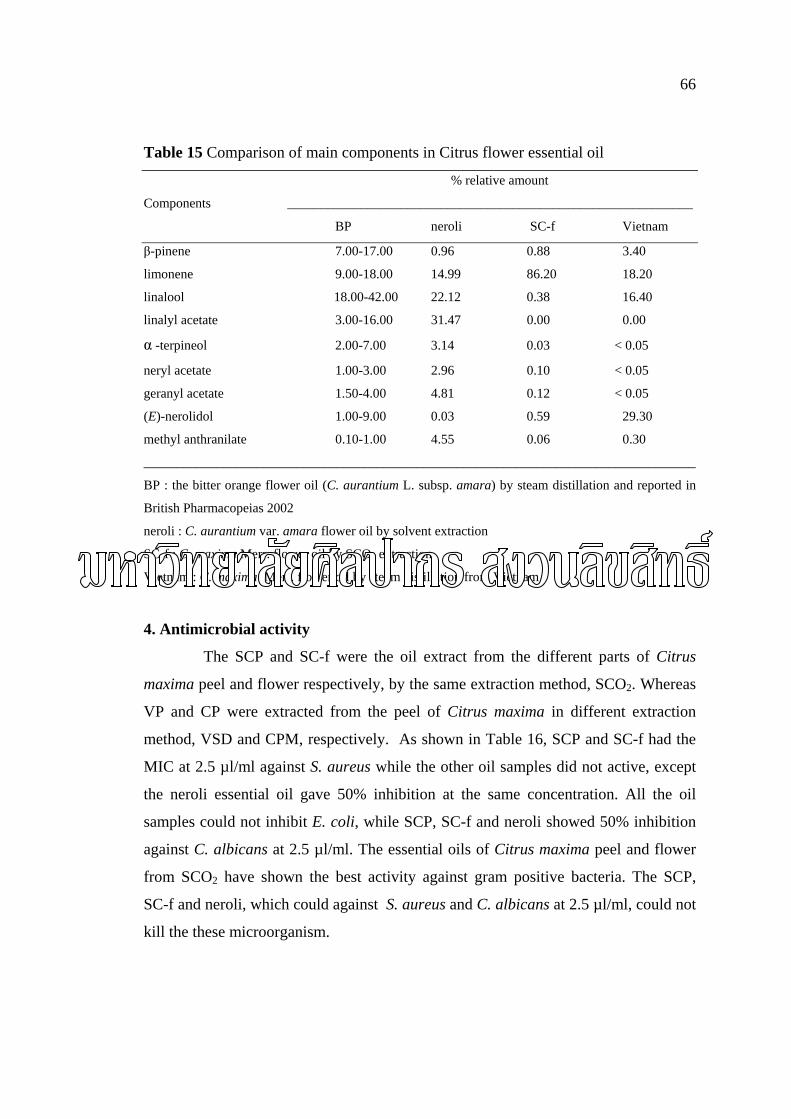
66
Table 15 Comparison of main components in Citrus flower essential oil
% relative amount
Components _____________________________________________________________
BP neroli SC-f Vietnam
β-pinene 7.00-17.00 0.96 0.88 3.40
limonene 9.00-18.00 14.99 86.20 18.20
linalool 18.00-42.00 22.12 0.38 16.40
linalyl acetate 3.00-16.00 31.47 0.00 0.00
α -terpineol 2.00-7.00 3.14 0.03 < 0.05
neryl acetate 1.00-3.00 2.96 0.10 < 0.05
geranyl acetate 1.50-4.00 4.81 0.12 < 0.05
(E)-nerolidol 1.00-9.00 0.03 0.59 29.30
methyl anthranilate 0.10-1.00 4.55 0.06 0.30
___________________________________________________________________________________
BP : the bitter orange flower oil (C. aurantium L. subsp. amara) by steam distillation and reported in
British Pharmacopeias 2002
neroli : C. aurantium var. amara flower oil by solvent extraction
SC-f : C. maxima Merr. flower oil by SCO2 extraction
Vietnam : C. maxima Merr. flower oil by steam distillation from Vietnam
4. Antimicrobial activity
The SCP and SC-f were the oil extract from the different parts of Citrus
maxima peel and flower respectively, by the same extraction method, SCO2. Whereas
VP and CP were extracted from the peel of Citrus maxima in different extraction
method, VSD and CPM, respectively. As shown in Table 16, SCP and SC-f had the
MIC at 2.5 µl/ml against S. aureus while the other oil samples did not active, except
the neroli essential oil gave 50% inhibition at the same concentration. All the oil
samples could not inhibit E. coli, while SCP, SC-f and neroli showed 50% inhibition
against C. albicans at 2.5 µl/ml. The essential oils of Citrus maxima peel and flower
from SCO2 have shown the best activity against gram positive bacteria. The SCP,
SC-f and neroli, which could against S. aureus and C. albicans at 2.5 µl/ml, could not
kill the these microorganism.
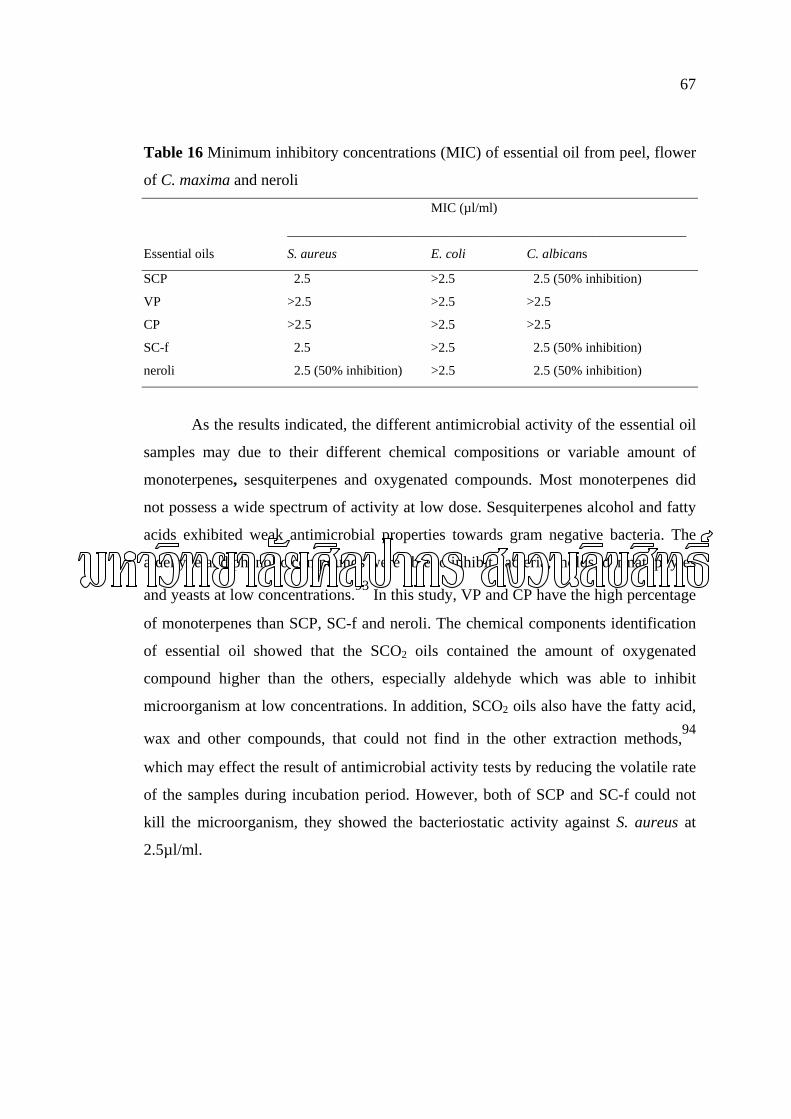
67
Table 16 Minimum inhibitory concentrations (MIC) of essential oil from peel, flower
of C. maxima and neroli
MIC (µl/ml)
____________________________________________________________
Essential oils S. aureus E. coli C. albicans
SCP 2.5 >2.5 2.5 (50% inhibition)
VP >2.5 >2.5 >2.5
CP >2.5 >2.5 >2.5
SC-f 2.5 >2.5 2.5 (50% inhibition)
neroli 2.5 (50% inhibition) >2.5 2.5 (50% inhibition)
As the results indicated, the different antimicrobial activity of the essential oil
samples may due to their different chemical compositions or variable amount of
monoterpenes, sesquiterpenes and oxygenated compounds. Most monoterpenes did
not possess a wide spectrum of activity at low dose. Sesquiterpenes alcohol and fatty
acids exhibited weak antimicrobial properties towards gram negative bacteria. The
aldehyde and phenolic compounds were able to inhibit bacteria, molds, dermatophytes
and yeasts at low concentrations.93 In this study, VP and CP have the high percentage
of monoterpenes than SCP, SC-f and neroli. The chemical components identification
of essential oil showed that the SCO2 oils contained the amount of oxygenated
compound higher than the others, especially aldehyde which was able to inhibit
microorganism at low concentrations. In addition, SCO2 oils also have the fatty acid,
wax and other compounds, that could not find in the other extraction methods,94
which may effect the result of antimicrobial activity tests by reducing the volatile rate
of the samples during incubation period. However, both of SCP and SC-f could not
kill the microorganism, they showed the bacteriostatic activity against S. aureus at
2.5µl/ml.
68
CHAPTER V
CONCLUSIONS
The major compounds that were detected in SCP, CP and VP essential oils
using DB-5 and carbowax capillary column by GC and GC-MS analysis were R-(+)-
limonene and myrcene. The amount of R-(+)-limonene of each oil that was detected
by both columns was close to each other. The SCP presented more number of
compounds and more oxygenated components than the other oils. Because SCO2
could extract the high boiling points components better than the other methods. These
three extraction methods showed low chemicals transformation, because they still
contained high amount of neral, geranial and sabinene, which were sensitive to
transform. Comparison with natural oil derived from cold pressing method, the oils
derived from SCO2 and VSD had small amount of the deterioration compounds such
as p-cymene which might be changed from other chemical compositions4, and form
hydrolysation during the extraction and raw material preparing procedure than oil
derived from CPM.
From this study, SCO2 was the best method that could solve the limitations
and weak points of the other Citrus extraction methods. The smell of Citrus oils from
SCO2 exhibited good quality and quite similar to natural oil. Since, SCP and SC-f
contained higher amount of oxygenated compounds than CP and VP. SCO2 were
suitable method for peel oil extraction. Since it could extract dried peel and gave high
quality oil with smell naturally alike. The use of dried raw materials reduced difficulty
about sample preparation, storage and deficiency.
In the present observations, VP indicated quality of oil resemble to CP and
SCP, when compared their chemical constituents. The cost of VSD was lower that
SCO2 and less impurities than CPM. Then asset of production and quality of produced
oils should be considered. However, this study did not concern to the maximum
quantity of oils from different extraction methods. So, the profit and worth of each
extraction methods for perfumery and industries should be further study.
69
The SC-f contained more R-(+)-limonene and other terpene hydrocarbons,
but less alcoholic compounds than neroli and steam distillation C. maxima flower oil
from Vietnam. The comparison between amount of chemical constituents of neroli to
orange flower oil in British Pharmacopeias 2002 (standard oil) showed that the
amount of major constituents of neroli were close to that of standard oil. However, in
commercial, some volatile compounds, such as methyl anthranilate and linalyl
acetate, might be added into the oil for improving the quality of smell. Moreover, the
commercial oil usually found some solvent and additive compound that not found in
Citrus natural oil and BP’s neroli, such as phenyl ethyl alcohol, methyl benzoate,
benzyl benzoate, etc. These added oxygenated compounds may effect the optical
rotation of neroli. The standard optical rotation of neroli (from BP) were +1.5 to
+11.5, but optical rotation of neroli (commercial) in this study equaled to +0.875. The
SC-f of this study showed the main chemical constituents different from the steam
distillation of flower oil from Vietnam. These differences may come from the
different in extraction method, cultivated areas and variety of plants. The SC-f and the
flower oil from Vietnam indicated the distinction of their components from BP’s
neroli. Although the amount of major compounds in Vietnam flower oil were more
close to BP’s neroli than SC-f, the SC-f contained type of chemical components more
resemble to that of BP’s neroli, commercial neroli and previous reported C. aurantium
flower oil than Vietnam flower oil. These except for linalyl aceate that found only in
C. aurantium not in C. maxima. For fanesol, it was found only in C. maxima. From
organoleptic test, SC-f had its own characteristic smell. The SC-f could apply for
products in perfumery, aromatherapy and flavoring. So, the development of SCO2 of
C. maxima flower was very interesting for further study.
For the antimicrobial activities of peel and flower oil of C. maxima, the MIC
of SCP and SC-f for S. aureus inhibition equaled to 2.5 µl/ml. Neroli showed 50%
inhibition for S. aureus at 2.5 µl/ml and CP and VP did not active. All of the oil
samples could not inhibit E. coli, while SCP, SC-f and neroli presented 50%
inhibition of C. albicans at 2.5 µl/ml. Comparison among C. maxima peel extraction
methods, the SCP indicated the best activity against gram positive bacteria than the
other methods.
70
REFERENCES
1M. Sawamura and others, “Volatile constituents of Redblush grapefruit (Citrus paradise) and Pummelo (Citrus grandis) peel essential oils from Kenya,” Journal of Agricultural and Food Chemistry 53, 25 (2005) : 9790-9794. 2S.C. Chang, and others, “Dietary fiber content and composition of fruits in Taiwan,” Asian pacific Journal of Clinical Nutrition 7, 3/4 (1998) : 206-210. 3 จงกชพร พินิจอักษร, “น้ํามนัหอมระเหยเบื้องตน,” เอกสารประกอบการสอนโรงเรียนน้ํามนัหอมระเหยเพื่อสุขภาพ, 2547. (อัดสําเนา) 4A.D. Giacomo and G.D. Giacomo, “Essential oil production,” in Medicinal and Aromatic Plants, 26ed. D.Giovanni and A.D. Giacomo (New York : Taylor and Francis, 2002), 114 - 493. 5P. Holmes, “Neroli : the lightness of being,” The International Journal of Aromatherapy 7, 2 (1995) : 14-17. 6L. Gamiz-Gracia and Luque de Castro, “Continuous subcritical water extraction of medicinal plant essential oil : comparison with conventional techniques,” Talanta 51 (2000) : 1179 - 1185. 7สมศักดิ์ สิงหลกะ, เกษตรดทีี่เหมาะสมสําหรับสมโอ, พิมพคร้ังที่1 (กรุงเทพมหานคร : ม.ป.ท., 2545), 1-3. 8วิเศษ อัครวิทยากุล, ความรูเกีย่วกับการปลูกสมโอ, พิมพคร้ังที่1 (นนทบรีุ : เกษตรสาสน, 2544), 1 - 30. 9หนวยบริการฐานขอมูลสมุนไพร ศูนยพันธุวิศวกรรมและเทคโนโลยีชีวภาพแหงชาต,ิ สมโอ [CD-ROM], คนขอมูล 27 กันยายน 2547. สํานักงานขอมูลสมุนไพรคณะเภสัชศาสตร มหาวิทยาลัยมหิดล
71
10Nomenclatural Database of Missouri Botanical Garden : (TROPICOS), Citrus maxima Merr [online], accessed 15 September 2004. Available from http://mobot.org.cgi-bin/search-vast 11เต็ม สมิตินันท, ช่ือพรรณไมแหงประเทศไทย, พิมพคร้ังที่2 (บริษัทประชาชน, 2544), 132. 12วิเชียร เฮงสวสัดิ์, โครงการพัฒนาบัณฑติ และวจิัยเทคโนโลยีหลังการเก็บเกีย่ว [online], คนขอมูล 30 กันยายน 2004. สืบคนจาก http://www.phtnet.org/citrus/botany.html 13The Department of Health, “Bitter-Orange Flower Oil,” in British Pharmacopoeia, vol.1 (London : The stationay office, 2002), 1267 - 1269. 14S.C. Huang, M.T. Chen and T.S. Wu, “Alkaloids and coumarins from stem bark of Citrus grandis,” Phytochemistry 28, 12 (1989) : 3574 - 3576.
15Y. Takemura and others, “Sturcture of acrignine-1, the first naturally occurring acridonolignoid from Citrus plants,” Chemical and Pharmaceutical Bulletin 41, 2 (1993) : 406 - 407. 16T.S. Wu, “Baiyumine-A and B, Two acridone alkaloids from Citrus grandis,” Phytochemistry 26, 3 (1987) : 871 - 872. 17T.S. Wu, “Alkaloids and Coumarins of Citrus grandis,” Phytochemistry 27, 11 (1988) : 3717 - 3718. 18T.S. Wu, S.C. Huang and P.L. Wu, “Buntanbismine, A bisacridone alkaloid from Citrus grandis,” Phytochemistry 42, 1 (1986) : 221 - 223.
19Y. Takemura and others, “Citbismine-A,B and C, New binary acridone alkaloids from Citrus plants,” Phytochemistry 42, 1 (1996) : 221 - 223. 20M. Ju-ichi and others, “Two new bisacridone alkaloids from Citrus plants,” Heterocycles 42, 1 (1996) : 237 - 240. 21T.S. Wu and others, “Coumarins, acridone alkaloids and a flavone from Citrus grandis,” Phytochemistry 27, 6 (1988) : 585 - 587. 22T.S. Wu, H. Furukawa and C.S. Kuoh, “Acridone alkaloids and coumarin from Citrus grandis,” Phytochemistry 22, 6 (1983) : 1493 - 1497.
72
23A.T. MC Phail and others, “Isolation and structures of citropone-A and B from Citrus plants, first examples of naturally-occurring homoacridone alkaloids containing a tropone ring system,” Tetrahedron LETT 26, 27 (1985) : 3271 - 3272. 24T.S. Wu, S.C. Huang and J.S. Lai, “Stem bark coumarins of Citrus grandis,” Phytochemistry 36, 1 (1994) : 217 - 219. 25Y. Takemura and others, “New acridone alkaloids from Citrus plants,” Heterocycles 34, 11 (1992) : 2123 - 2130. 26S.C. Basa, “Acridone alkaloids from Citrus decumana-II,” Indian Journal of Natural Products 8, 1 (1992) : 18. 27T.S. Wu and others, “Honyumine, a new linear pyranoacridone alkaloid from Citrus grandis Osbeck,” Heterocycles 24, 1 (1986) : 41 - 43. 28I. Stewart, “Identification of caffeine in Citrus flowers and leaves,” Journal of Agricultural and Food Chemistry 33, 6 (1985) : 1163 - 1165. 29A.N. Radhakrishnan, C.S. Vaidyanathan and K.V. Giri, “Nitrogenous constituents in plants, free amino acids in leaves and Leguminous seeds,” Journal of the Indian Institute of Science 37, A (1955) : 178 - 194. 30Y.Q. Ma and others, “Isolation and identification of water-soluble active principles in Guangdong snake bite drug,” Chung TS’AO Yao 13, 5 (1982) : 193 - 196. 31M.S. Hifnawy, S.M. Azzam and O.M.M. Sabry, “Diphenylamine, A hypoglycemic agent from Citrus fruits,” Bulletin of the Faculty of Pharmacy (Cairo University) 39, 2 (2001) : 93 - 97. 32I. Jantan and others, “Chemical composition of some Citrus oils from Malaysia,” Journal of Essential Oil Research 8, 6 (1996) : 627 - 632. 33L. Shi, Y. Gotou and K. Shindo, “Synephrine contents and their seasonal variation in peel of Citrus plants,” Shoyakugaku Zasshi 46, 2 (1992) : 150 - 155. 34D.J. Wang, “Studies on the constituents of the essential oil of four aromatic flowers,” K’O Hsueh Fa Chan Yueh K’AN 7 (1979) : 1036 - 1048. 35U. Palasiri, “Preliminary studies on pectin of Citrus maxima,” Journal of Pharmaceutical Association of Siam 2, 1 (1948) : 18 - 24.
73
36M. Azadbakht and others, “The comparison of various methods for extraction and isolation of pectin from Citrus decumana Murry,” Ulum-I Daroei(Tabriz, Islamic Republic of Iran) 1 (2003) : 21-28. 37H.F. Zoller, “Some constituents of the American grape fruit (Citrus decumana),” Journal of Industrial and Engineering Chemistry (Washigton, D.C.) 10 (1917) : 364 - 373. 38M. Sawamura and others, “Seasonal changes of isoprenoid-related substances in Citrus peels,” Nippon Shokuhin Kogyo Gakkaishi 33, 8 (1986) : 566 - 571. 39B.M. Feng and others, “Sturcture determination of the constituents from Citrus grandis Osbeck,” in China Journal of Chinese Materia Medica 26, 11 (2001) : 764 - 765. 40H.H. EL-Gohary and others, “A study of the coumarin contents of Citrus grandis fruits growing in Egypt,” Zagazig Journal of Pharmaceutical Sciences 3, 1 (1994) : 20 - 24. 41B. Feng and Y. Pei, “Study on chemical constituents of coumarins from Citrus grandis,” Shenyang Yaoke Daxue Xuebao 17, 4 (2000) : 253 - 255. 42K. Ogawa and others, “Evaluation of auraptene content in Citrus fruits and their products,” Journal of Agricultural and Food Chemistry 48, 5 (2000) : 1763 - 1769. 43D.M. Hale, P.P. Khopkar and J.B. Sheridan, “Coumarin glycosides from Citrus flavedo,” Phytochemistry 26, 9 (1987) : 2547 - 2549. 44B. Feng and Y. Pei, “Study on chemical constituents of coumarins from Citrus grandis,” Shenyang Yaoke Daxue Xuebao 17, 4 (2000) : 253 - 255. 45M. Mizuno and others, “Chemotaxonomy of the genus Citrus based on polymethoxyflavones,” Chemical and Pharmaceutical Bulletin 39, 4 (1991) : 945 - 949. 46M. Anis, “Flavonoid patterns of leaves of some Citrus species and their hybrids,” Plant Biochemical Journal 8 (1981) : 56 - 60. 47Y. Nogata and others, “High-Performance Liquid Chromatographic Determination of naturally occurring flavonoids in Citrus with a photodiode-array detector,” Journal of Chromatography A 667, 1/2 (1982) : 59 - 66.
74
48K. Kanes and B. Tisserat, “Phenolic composition of various tissues of Rutaceae species,” Phytochemistry 32, 4 (1993) : 967 - 974. 49S. Tosa and others, “Studies of flavonoid in Citrus analysis of flavanone glycosides in the peel of Citrus by high performance liquid chromatography,” Shoyakugaku Zasshi 42, 1 (1988) : 41 - 47. 50Y.C. Hou and others, “Determination and comparison of naringin and naringenin contents among water extracts of various processed Citri grandis pericarpium,” Chinese Pharmaceutical Journal (Taipei) 50, 3 (1998) : 137 - 145. 51M.G.L. Hertog, P.C.H. Hollman and B.V.D. Putte, “Content of potentially anticarcinogenic flavonoids of tea infusions, wines, and fruit juices,” Journal of Agricultural Food and Chemistry 41, 8 (1993) : 1242 - 1246. 52N. Shaft and M. Ikram, “Quantitative survey of rutin-containing plants part 1,” International Journal of Crude drug Research 20, 4 (1982) : 183 - 186. 53S.S. Nigam and S. Dutt, “Chemical examination of the essential oil derived from the leaves of Citrus decumana,” Indian SOAP Journal 11 (1945) : 107 - 110. 54X.H. Yang, G.X. Zhang and P. Cui, “GC/MS analysis of the chemical constituents of pomelo peel volatile oil,” Wuhan Huagong Cueyuan Xuebao 23, 2 (2001) : 13 - 15. 55Y.H. Zhou and others, “GC/MS analytical of essential oil from pomelo peel obtained in Rong country,” Guangxi Daxue Xuebao, Ziran Kexueban 29, 1 (2004) : 70 - 72. 56M. Sawamura and others, “Volatile constituents of several varieties of pummelos and characteristics among Citrus species,” Agicultural of biological Chemistry 55, 10 (1991) : 2571 - 2578. 57D.J. Wang, “Studies on the constituents of the essential oil of four aromatic flowers,” K’O Hsueh Fa Chan Yueh K’an 7 (1979) : 1036 - 1048. 58A.G. Vlisidis and K.I. Israilidis, “Analysis of essential oil fractions from Greek Citrus species,” Chemika Chronika, Genike Ekdose 60, 3 (1998) : 75 - 78. 59N.X. Dung, N.M. Pha and V. N. Lo, “The essential oils of flowers and fruit skin of two types of Citrus maxima from Doan Hung and Van Tri,” Tap Dhi Duoc Hoc 6 (1992) : 15 - 17.
75
60N.X. Dung and others, “The Essential Oil from the Flowers of Citrus maxima (J.Burman) Merrill from Vietnam,” Journal of Essential Oil Research 3 (Sep/Oct 1991) : 359 - 360. 61M. Sawamura and others, “Characteristic aroma components of Tosa-Buntan (Citrus grandis Osbeck forma Tosa) Fruit,” Food Science and Technology Research 7, 1 (2001) : 45 - 49. 62B.T. Brooks, “Citrus oils in the Philippine islands and the essential oils of Clausena anisumolene BL, and Ocimum sanctum,” Perfumery and essential oil record 2 (2001) : 264 - 265. 63Y.H. Taufiq-Yap and T.H. Peh, “Chemical variability and some biological activities of leaf essential oil from five species of Malaysian Citrus,” Oriental Journal of Chemistry 17, 3 (2001) : 387 - 390. 64D.L. Dreyer, “Citrus bitter principles. V. botanical distribution and chemotaxonomy in the Rutaceae, Phytochemistry 5 (1966) : 367. 65R.L. Rouseff and S. Nagy, “Distribution of limonoids in Citrus seeds,” Phytochemistry 21 (1982) : 85 - 90. 66T. Morishita, H. Jinnai and H. Nakachi, “The isolation of limonoids of banpeiyu (Citrus grandis Osbeck.),” Nippon Shokuhin Kogyo Gakkaishi 32, 8 (1985) : 590 - 591. 67T. Morishita, “Investigation of limonoid in the stem and the leaf of Citrus banpeiyu I,” Nippon Shokuhin Kogyogakkaishi 40, 5 (1993) : 357 - 361. 68H. Ohta and S. Hasegawa, “Limonoids in pummelos (Citrus grandis Osbeck.),” Journal of Food Science 60, 6 (1995) : 1284 - 1285. 69M. Sawamura and others, “Seasonal changes of isoprenoid-related substances in Citrus peels,” Nippon Shokuhin Kogyo Gakkaishi 33, 8 (1986) : 566 - 571. 70F. Baomin and P. Yuehu, “Chemical constituents of peels of Citrus grandis,” Shenyang Yaoke Daxue Xuebao 17, 5 (2000) : 332 - 333. 71Y.P. Chen, “Recent developments of natural product chemistry in Taiwan,” International Symposium Recent advance natural products research ,Seoul, Korea (14-16 December 1979) : 18 - 23.
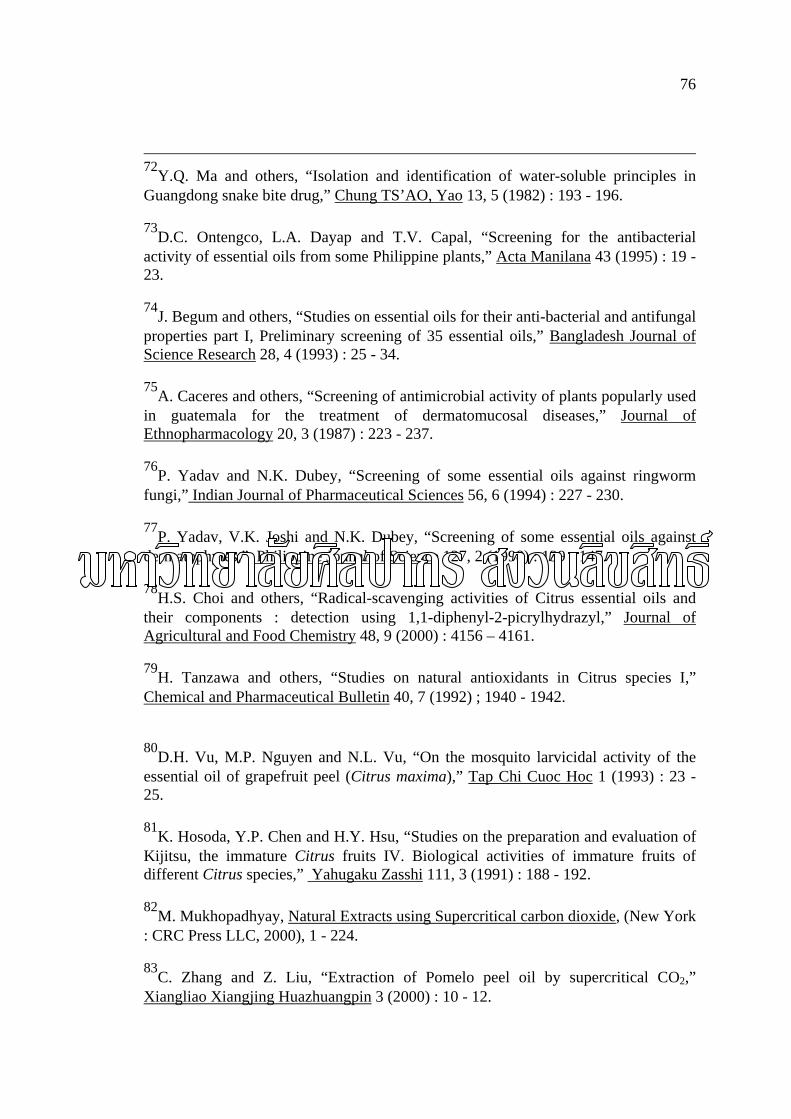
76
72Y.Q. Ma and others, “Isolation and identification of water-soluble principles in Guangdong snake bite drug,” Chung TS’AO, Yao 13, 5 (1982) : 193 - 196. 73D.C. Ontengco, L.A. Dayap and T.V. Capal, “Screening for the antibacterial activity of essential oils from some Philippine plants,” Acta Manilana 43 (1995) : 19 - 23. 74J. Begum and others, “Studies on essential oils for their anti-bacterial and antifungal properties part I, Preliminary screening of 35 essential oils,” Bangladesh Journal of Science Research 28, 4 (1993) : 25 - 34. 75A. Caceres and others, “Screening of antimicrobial activity of plants popularly used in guatemala for the treatment of dermatomucosal diseases,” Journal of Ethnopharmacology 20, 3 (1987) : 223 - 237. 76P. Yadav and N.K. Dubey, “Screening of some essential oils against ringworm fungi,” Indian Journal of Pharmaceutical Sciences 56, 6 (1994) : 227 - 230. 77P. Yadav, V.K. Joshi and N.K. Dubey, “Screening of some essential oils against dermatophytes,” Philippine Jounal of Science 127, 2 (1998) : 139 - 147. 78H.S. Choi and others, “Radical-scavenging activities of Citrus essential oils and their components : detection using 1,1-diphenyl-2-picrylhydrazyl,” Journal of Agricultural and Food Chemistry 48, 9 (2000) : 4156 – 4161. 79H. Tanzawa and others, “Studies on natural antioxidants in Citrus species I,” Chemical and Pharmaceutical Bulletin 40, 7 (1992) ; 1940 - 1942.
80D.H. Vu, M.P. Nguyen and N.L. Vu, “On the mosquito larvicidal activity of the essential oil of grapefruit peel (Citrus maxima),” Tap Chi Cuoc Hoc 1 (1993) : 23 - 25. 81K. Hosoda, Y.P. Chen and H.Y. Hsu, “Studies on the preparation and evaluation of Kijitsu, the immature Citrus fruits IV. Biological activities of immature fruits of different Citrus species,” Yahugaku Zasshi 111, 3 (1991) : 188 - 192. 82M. Mukhopadhyay, Natural Extracts using Supercritical carbon dioxide, (New York : CRC Press LLC, 2000), 1 - 224. 83C. Zhang and Z. Liu, “Extraction of Pomelo peel oil by supercritical CO2,” Xiangliao Xiangjing Huazhuangpin 3 (2000) : 10 - 12.
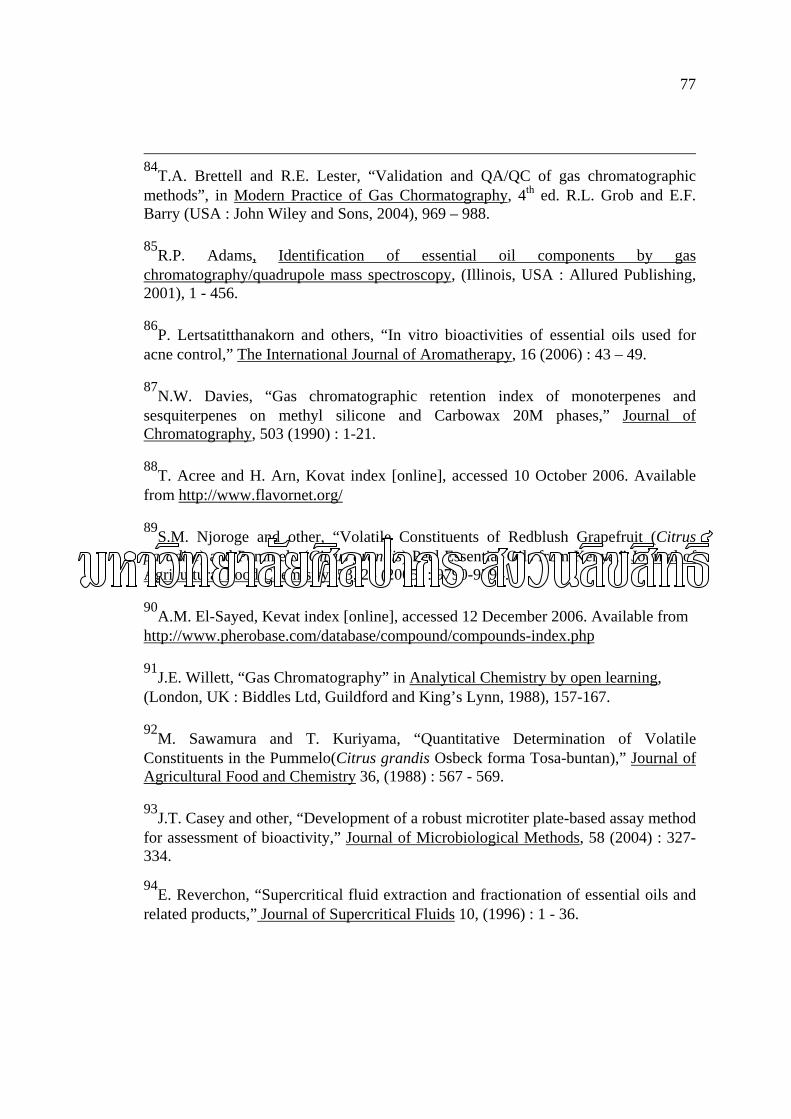
77
84T.A. Brettell and R.E. Lester, “Validation and QA/QC of gas chromatographic methods”, in Modern Practice of Gas Chormatography, 4th ed. R.L. Grob and E.F. Barry (USA : John Wiley and Sons, 2004), 969 – 988. 85R.P. Adams, Identification of essential oil components by gas chromatography/quadrupole mass spectroscopy, (Illinois, USA : Allured Publishing, 2001), 1 - 456. 86P. Lertsatitthanakorn and others, “In vitro bioactivities of essential oils used for acne control,” The International Journal of Aromatherapy, 16 (2006) : 43 – 49. 87N.W. Davies, “Gas chromatographic retention index of monoterpenes and sesquiterpenes on methyl silicone and Carbowax 20M phases,” Journal of Chromatography, 503 (1990) : 1-21. 88T. Acree and H. Arn, Kovat index [online], accessed 10 October 2006. Available from http://www.flavornet.org/ 89S.M. Njoroge and other, “Volatile Constituents of Redblush Grapefruit (Citrus paradise) and Pummelo (Citrus grandis) Peel Essential Oils from Kenya,” Journal of Agricultural Food Chemistry, 53, 25 (2005) : 9790-9794. 90A.M. El-Sayed, Kevat index [online], accessed 12 December 2006. Available from http://www.pherobase.com/database/compound/compounds-index.php 91J.E. Willett, “Gas Chromatography” in Analytical Chemistry by open learning, (London, UK : Biddles Ltd, Guildford and King’s Lynn, 1988), 157-167. 92M. Sawamura and T. Kuriyama, “Quantitative Determination of Volatile Constituents in the Pummelo(Citrus grandis Osbeck forma Tosa-buntan),” Journal of Agricultural Food and Chemistry 36, (1988) : 567 - 569. 93J.T. Casey and other, “Development of a robust microtiter plate-based assay method for assessment of bioactivity,” Journal of Microbiological Methods, 58 (2004) : 327-334. 94E. Reverchon, “Supercritical fluid extraction and fractionation of essential oils and related products,” Journal of Supercritical Fluids 10, (1996) : 1 - 36.
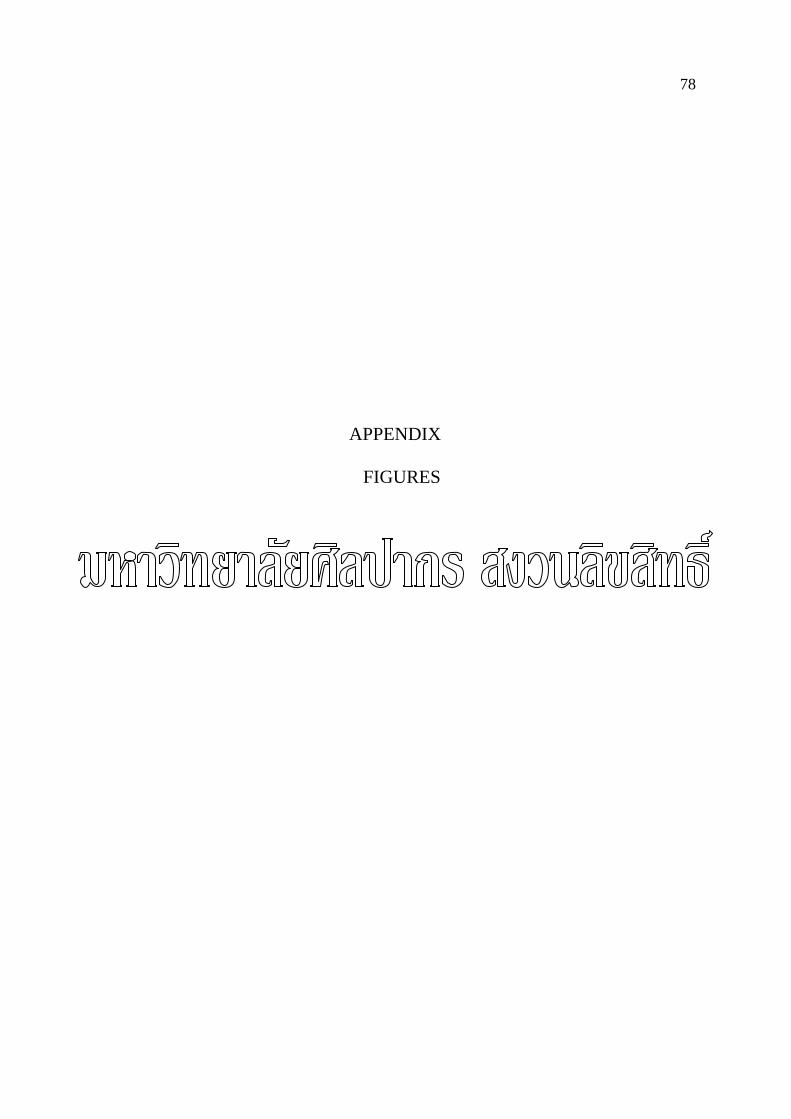
78
APPENDIX
FIGURES
79
Figure 2 Pressure-temperature phase diagram
A. B. Figure 3 C. maxima cultivar khao-yai fruit (A) and flower (B) from
Bangkontee District, Samutsongkarm Province of Thailand
Figure 4 C. maxima dry peel Figure 5 C. maxima fresh peel
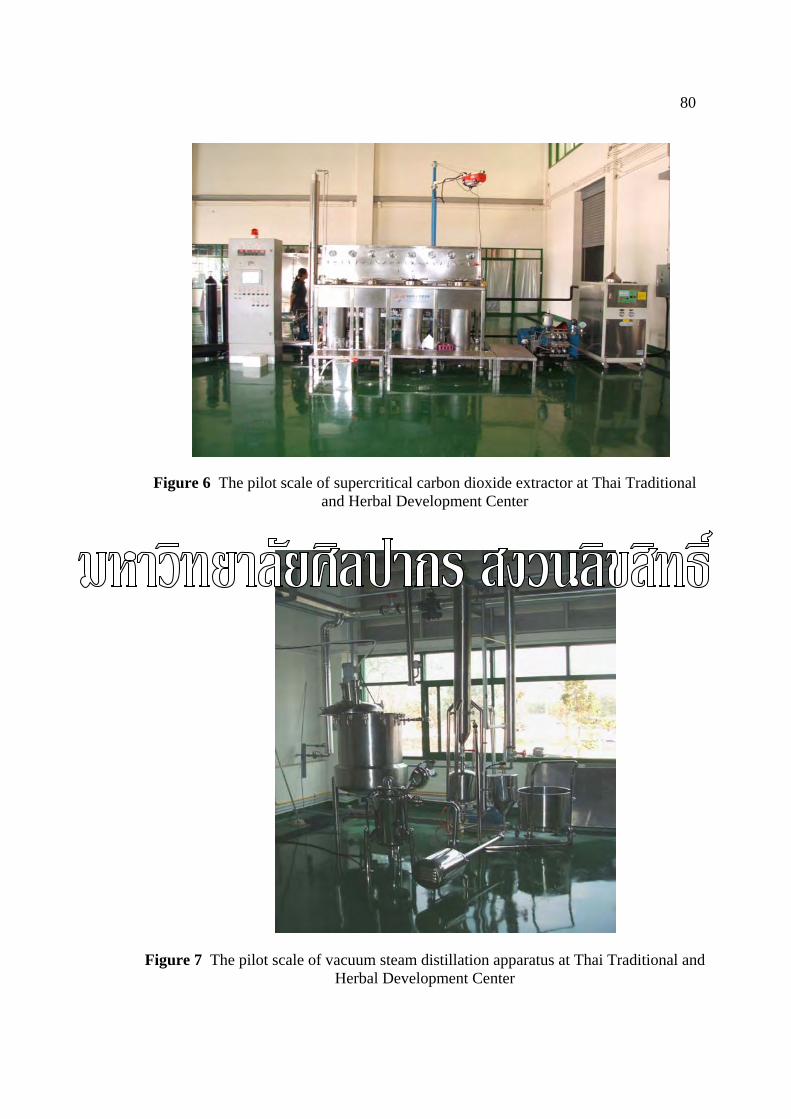
80
Figure 6 The pilot scale of supercritical carbon dioxide extractor at Thai Traditional and Herbal Development Center
Figure 7 The pilot scale of vacuum steam distillation apparatus at Thai Traditional and
Herbal Development Center
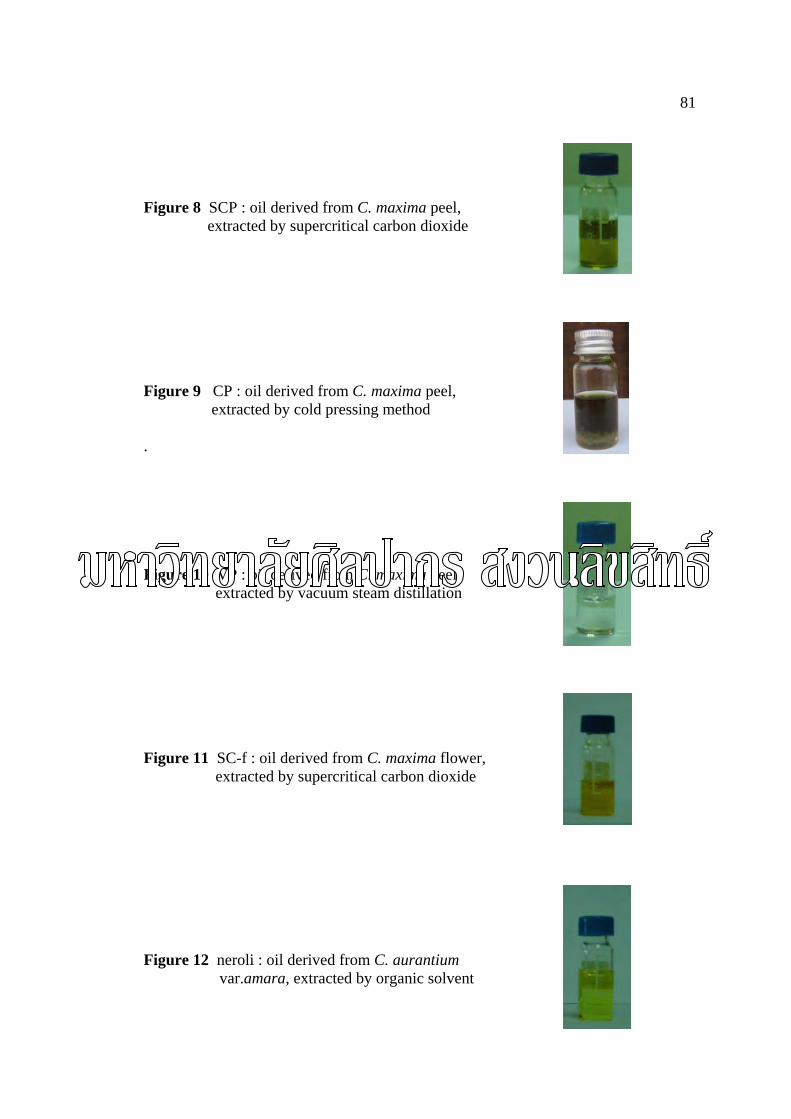
81
Figure 8 SCP : oil derived from C. maxima peel, extracted by supercritical carbon dioxide Figure 9 CP : oil derived from C. maxima peel, extracted by cold pressing method . Figure 10 VP : oil derived from C. maxima peel, extracted by vacuum steam distillation Figure 11 SC-f : oil derived from C. maxima flower,
extracted by supercritical carbon dioxide Figure 12 neroli : oil derived from C. aurantium var.amara, extracted by organic solvent
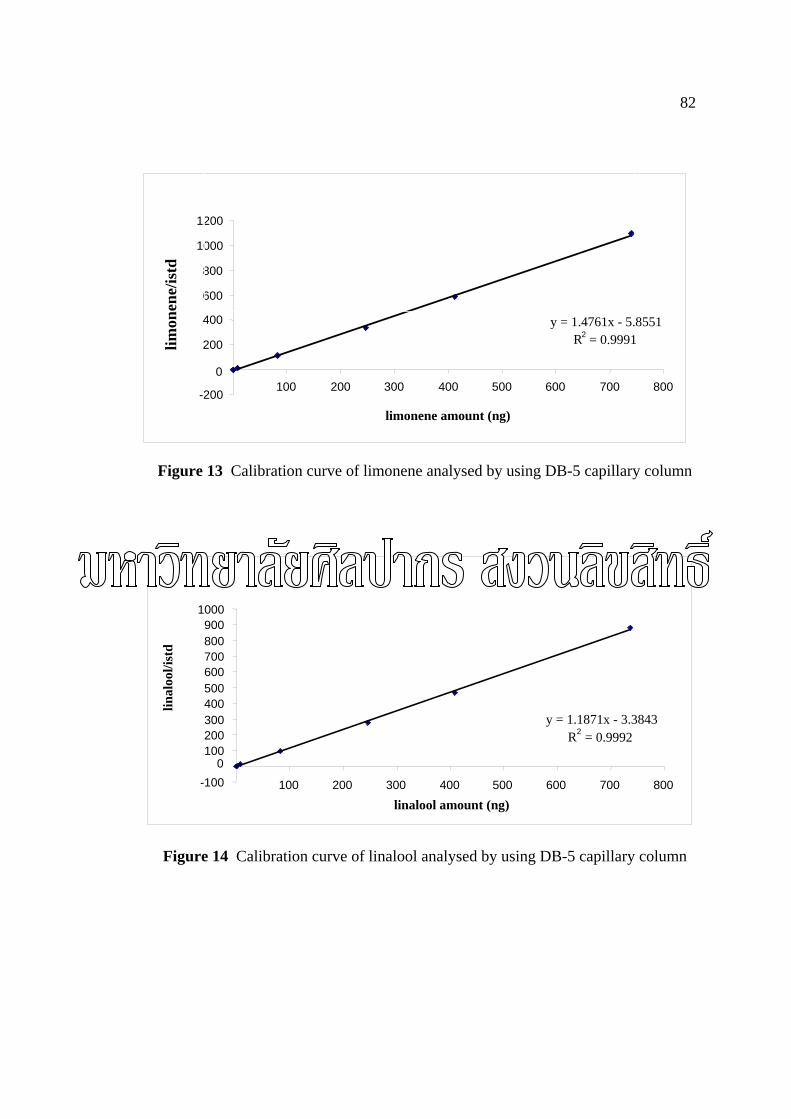
82
Figure 13 Calibration curve of limonene analysed by using DB-5 capillary column
Figure 14 Calibration curve of linalool analysed by using DB-5 capillary column
y = 1.1871x - 3.3843R 2 = 0.9992
-100
100 200 300 400 500 600 700 800 900
1000
0 100 200 300 400 500 600 700 800
linalool amount (ng)
linal
ool/i
std
y = 1.4761x - 5.8551R 2 = 0.9991
-200
200 400 600 800
1000 1200
0 100 200 300 400 500 600 700 800
limonene amount (ng)
limon
ene/
istd

83
Figure 15 Calibration curve of (E)-nerolidol analysed by using DB-5 capillary column
Figure 16 Calibration curve of (Z,E)- and (Z,Z)-farnesol analysed by using DB-5 capillary column
y = 1.1762x - 0.2942 R 2 = 0.9995
-10 0
10 20 30 40 50 60
5 10 15 20 25 30 35 40 45
(Z,E)- and (Z,Z)-farnesol amount (ng)
(Z,E
)- an
d (Z
,Z)-
farn
esol
/ISTD
y = 1.1339x - 0.2897 R 2 = 0.999
-10 0
10 20 30 40 50 60
10 20 30 40 50 60
(E)-nerolidol amount (ng)
(E)-
nero
lidol
/IST
D
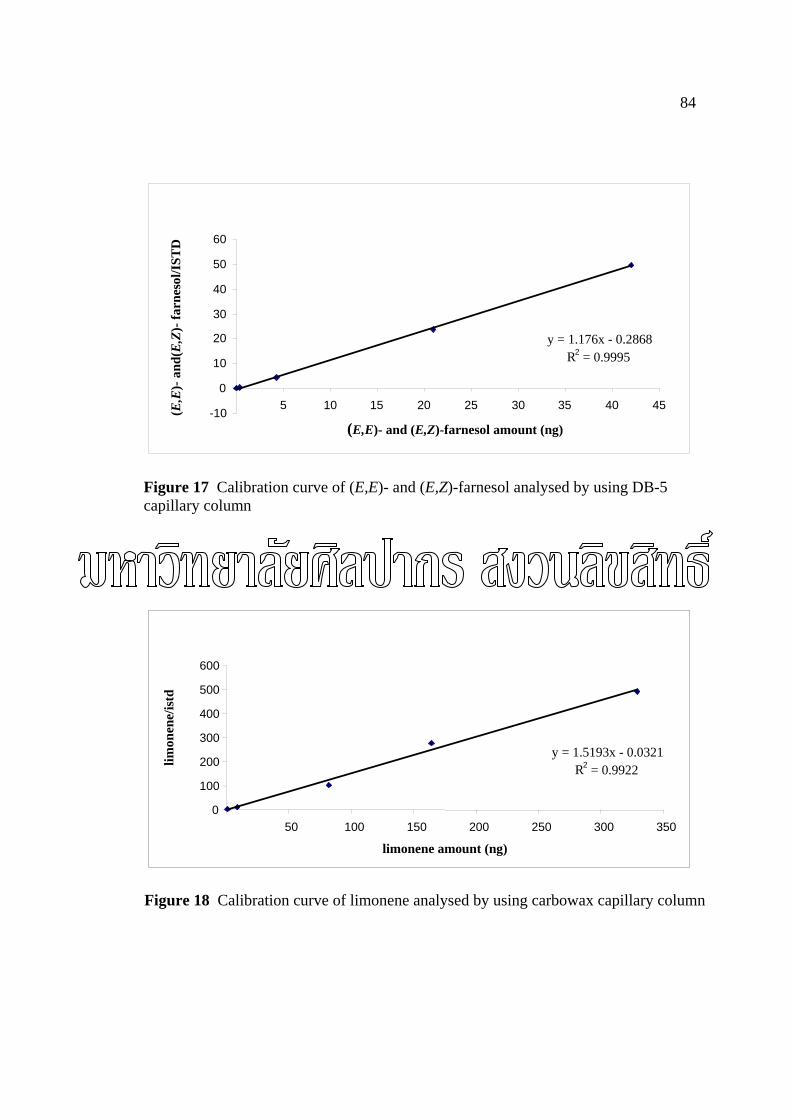
84
Figure 17 Calibration curve of (E,E)- and (E,Z)-farnesol analysed by using DB-5 capillary column
Figure 18 Calibration curve of limonene analysed by using carbowax capillary column
y = 1.176x - 0.2868 R 2 = 0.9995
-10 0
10 20 30 40 50 60
5 10 15 20 25 30 35 40 45
(E,E)- and (E,Z)-farnesol amount (ng)
(E,E
)- a
nd(E
,Z)-
farn
esol
/IST
D
y = 1.5193x - 0.0321R 2 = 0.9922
0 100 200 300 400 500 600
50 100 150 200 250 300 350
limonene amount (ng)
limon
ene/
istd
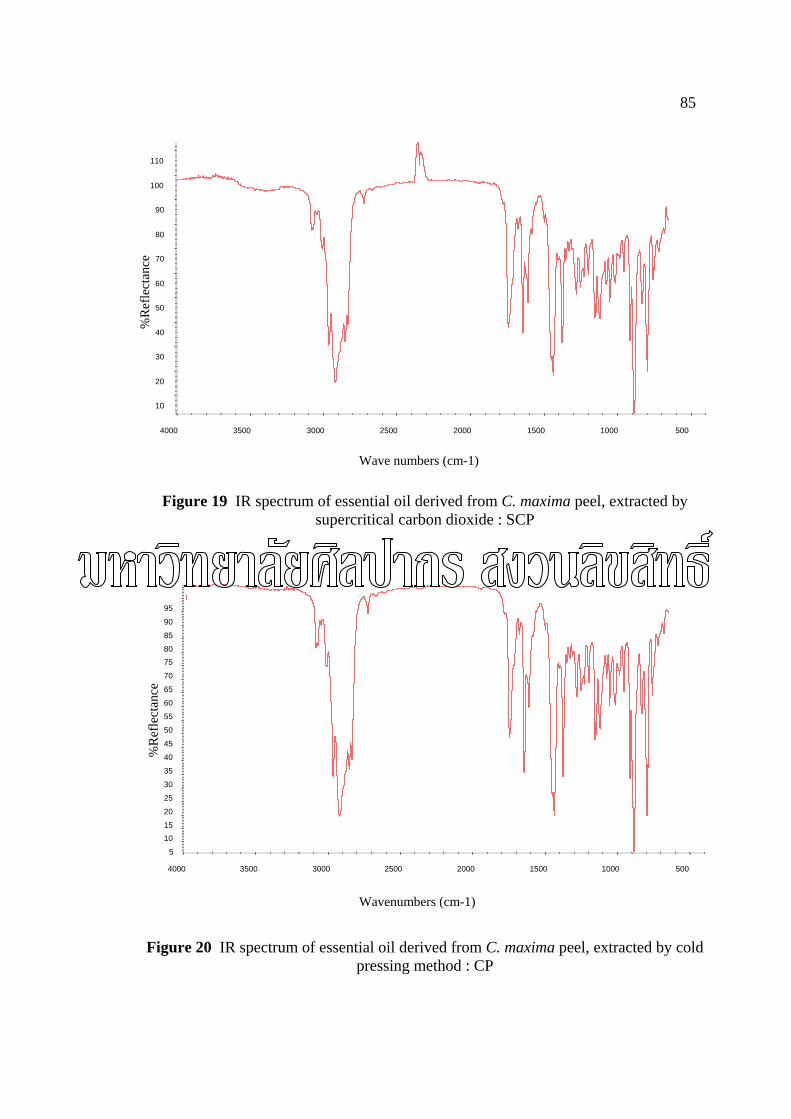
85
10
20
30
40
50
60
70
80
90
100
110
%R
efle
ctan
ce
500
1000
1500
2000
2500
3000
3500
4000
Wave numbers (cm-1)
Figure 19 IR spectrum of essential oil derived from C. maxima peel, extracted by
supercritical carbon dioxide : SCP
Figure 20 IR spectrum of essential oil derived from C. maxima peel, extracted by cold pressing method : CP
)
5
10 15 20 25 30 35 40 45 50 55 60 65 70 75 80 85 90 95
%R
efle
ctan
ce
500
1000
1500
2000
2500
3000
3500
4000
Wavenumbers (cm-1)
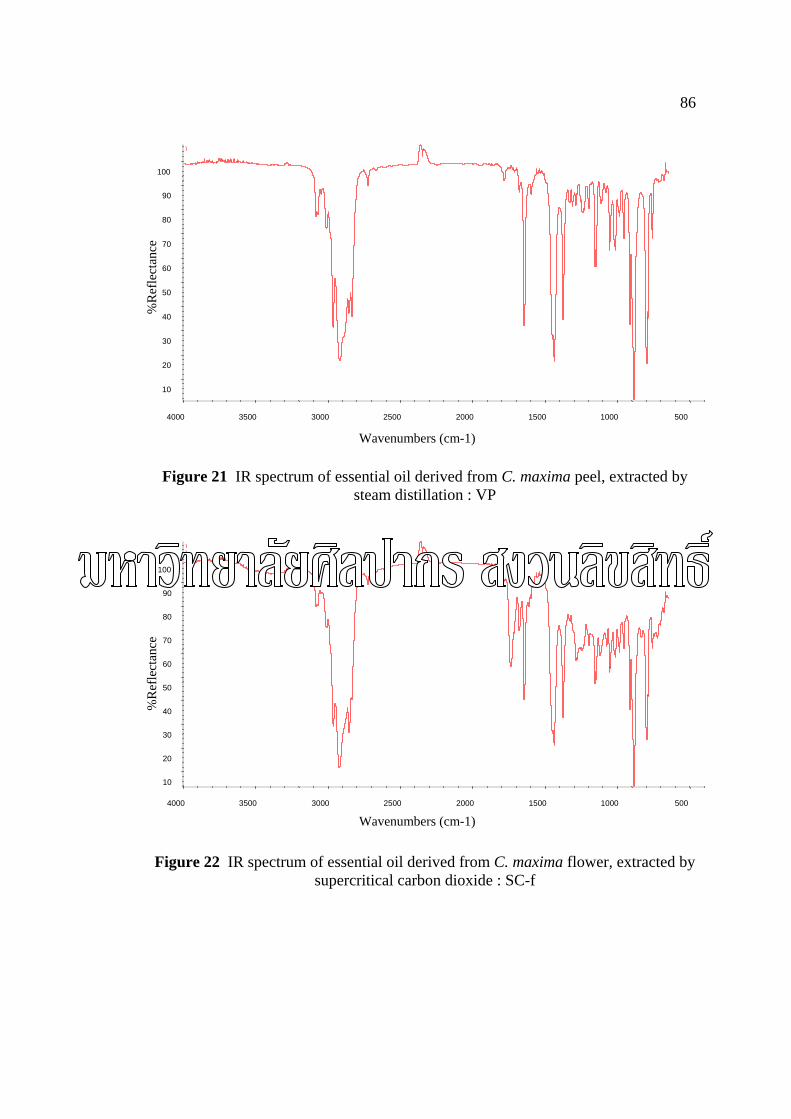
86
Figure 21 IR spectrum of essential oil derived from C. maxima peel, extracted by steam distillation : VP
Figure 22 IR spectrum of essential oil derived from C. maxima flower, extracted by
supercritical carbon dioxide : SC-f
))
10
20
30
40
50
60
70
80
90
100
%R
efle
ctan
ce
500
1000
1500
2000
2500
3000
3500
4000
)
10
20
30
40
50
60
70
80
90
100
%R
efle
ctan
ce
500
1000
1500
2000
2500
3000
3500
4000
Wavenumbers (cm-1)
Wavenumbers (cm-1)
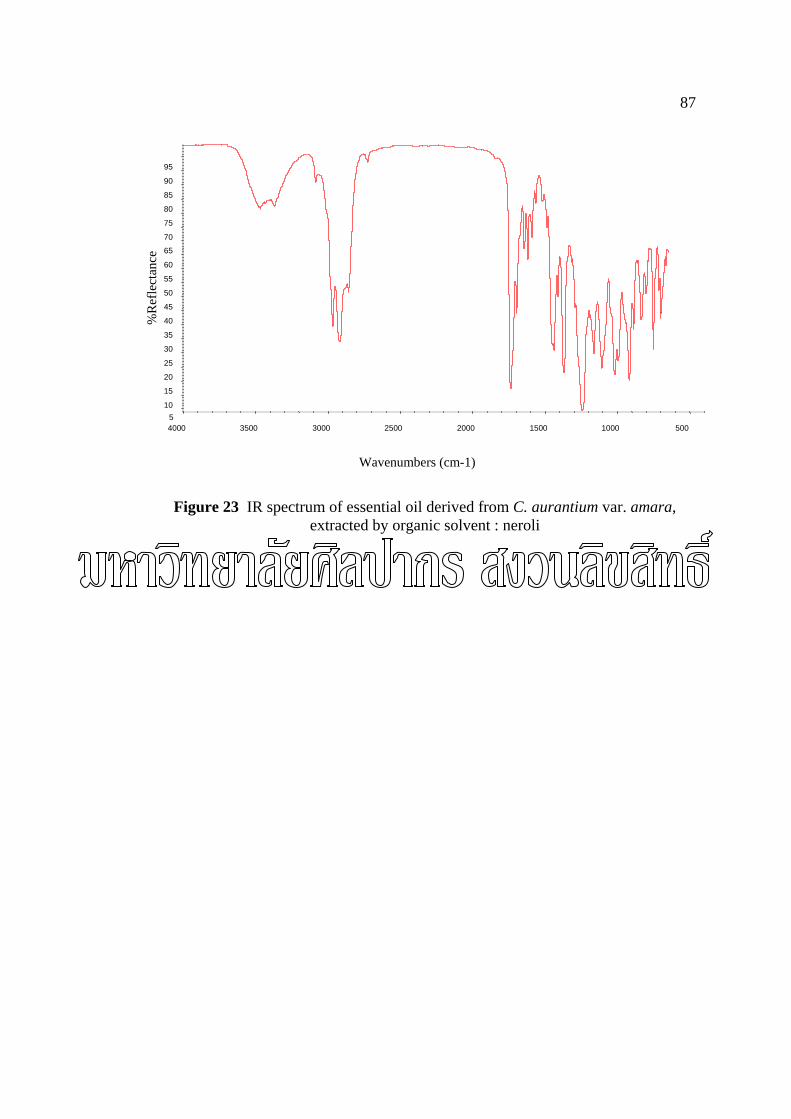
87
Figure 23 IR spectrum of essential oil derived from C. aurantium var. amara, extracted by organic solvent : neroli
5
10 15 20 25 30 35 40 45 50 55 60 65 70 75 80 85 90 95
%R
efle
ctan
ce
500
1000
1500
2000
2500
3000
3500
4000
Wavenumbers (cm-1)
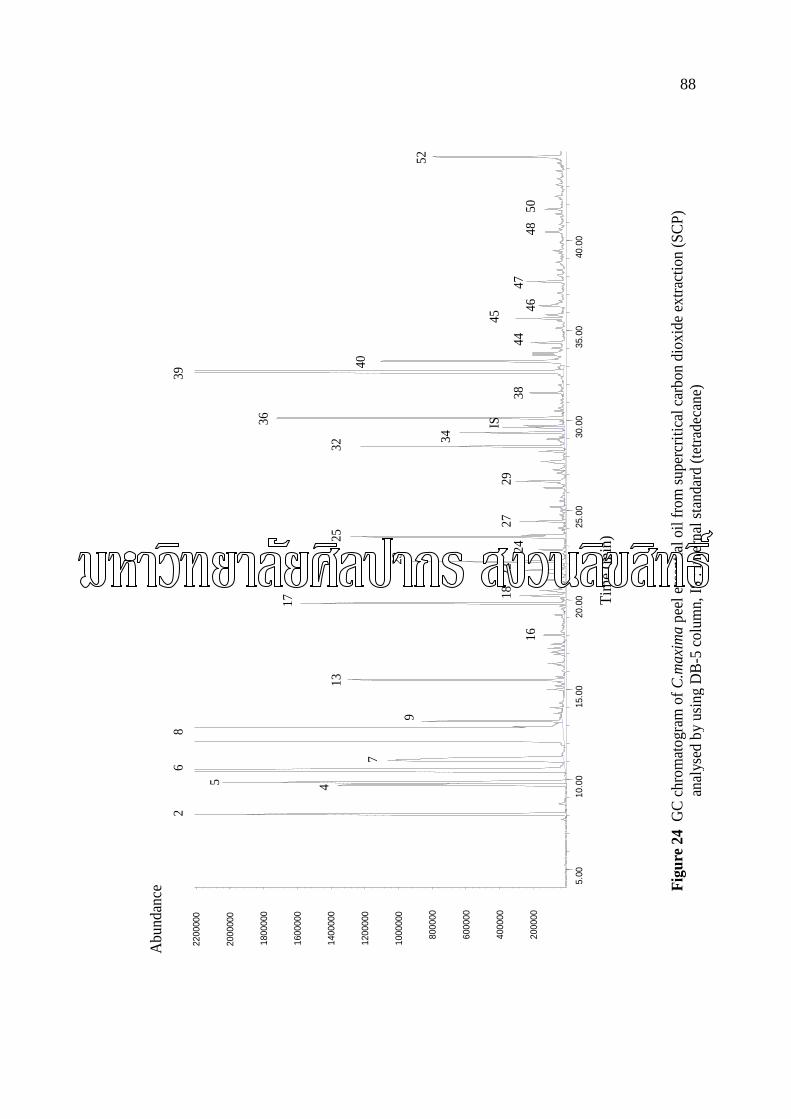
88
Fi
gure
24
GC
chro
mat
ogra
m o
f C.m
axim
a pe
el es
sent
ial o
il fro
m su
perc
ritic
al ca
rbon
dio
xide
extra
ctio
n (S
CP)
an
alys
ed b
y us
ing
DB-
5 co
lum
n, IS
: in
tern
al st
anda
rd (t
etra
deca
ne)
5.00
10
.00
15.0
0 20
.00
25.0
0 30
.00
35.0
0 40
.00
2000
00
4000
00
6000
00
8000
00
1000
000
1200
000
1400
000
1600
000
1800
000
2000
000
2200
000
A
bund
ance
Tim
e (m
in)
IS
2
4 5
6
8
7
9
13
17
16
23
25
18
22
24
27
2
9
32 3
4 36
3
8 39
40
44
45
47
46
48
50
52
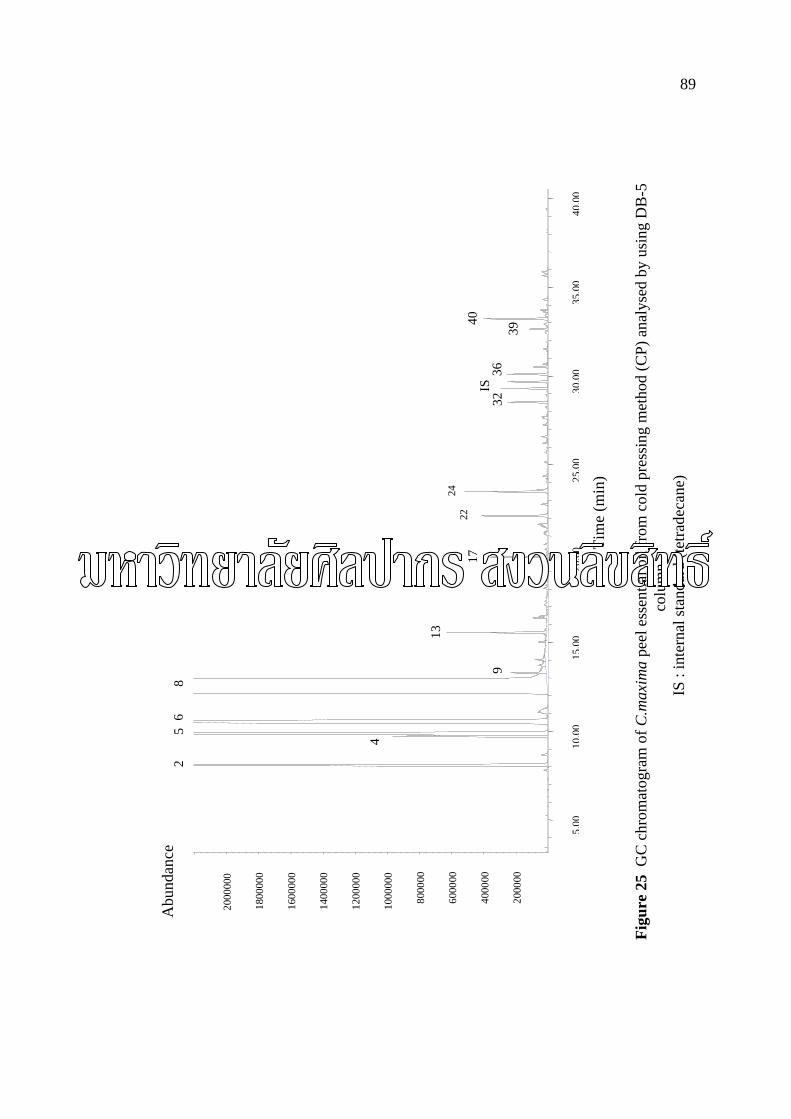
89
5.00
10.0
0
15
.00
20.0
0
25
.00
30.0
0
35
.00
40.0
0
2000
00
4000
00
6000
00
8000
00
1000
000
1200
000
1400
000
1600
000
1800
000
2000
000
2
4
5
6
8
9
13
17
32
3
6
IS
4
0
3
9
Tim
e (m
in)
24
22
Abu
ndan
ce
Figu
re 2
5 G
C c
hrom
atog
ram
of C
.max
ima
peel
ess
entia
l oil
from
col
d pr
essi
ng m
etho
d (C
P) a
naly
sed
by u
sing
DB
-5
colu
mn,
IS
: in
tern
al st
anda
rd (t
etra
deca
ne)
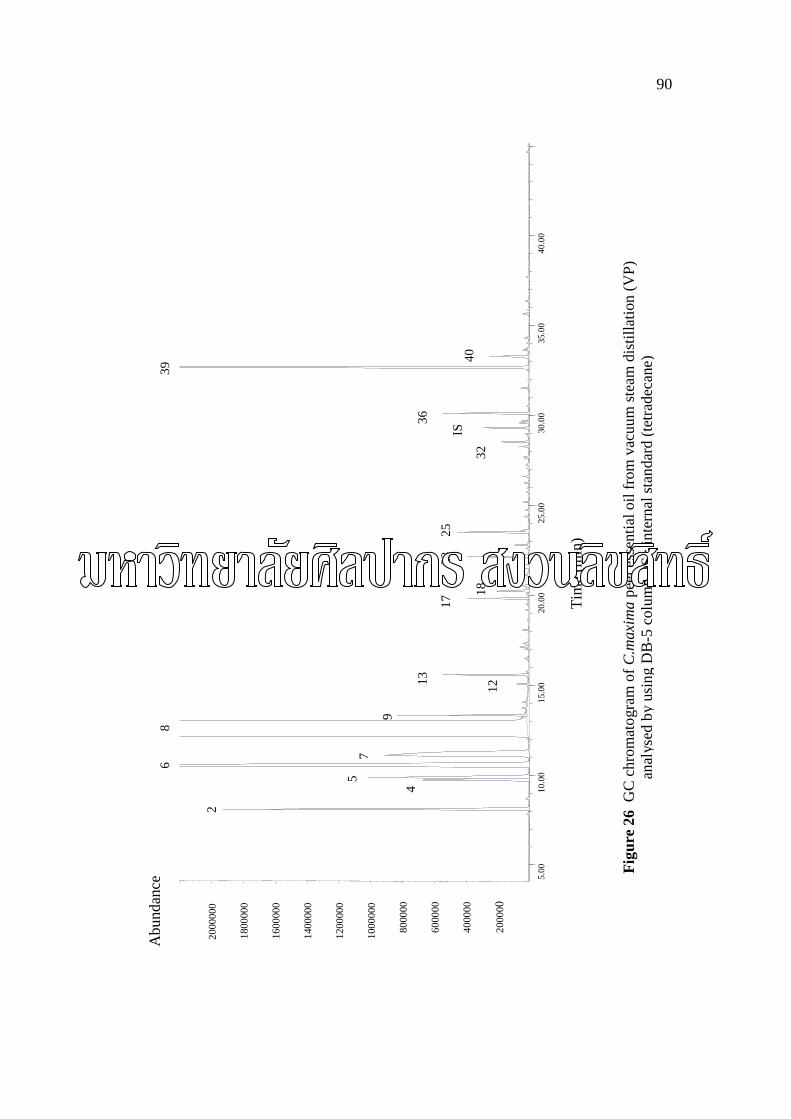
90
Figu
re 2
6 G
C c
hrom
atog
ram
of C
.max
ima
peel
ess
entia
l oil
from
vac
uum
stea
m d
istil
latio
n (V
P)
anal
ysed
by
usin
g D
B-5
col
umn,
IS :
inte
rnal
stan
dard
(tet
rade
cane
)
5.00
10
.00
15.0
0 20
.00
25.0
0 30
.00
35.0
0 40
.00
2000
00
4000
00
6000
00
8000
00
1000
000
1200
000
1400
000
1600
000
1800
000
2000
000
2
4
5 7
8
9
1
2 13
17 1
8
2
3 2
5
3
2
3
6
3
9 40
Tim
e (m
in)
Abu
ndan
ce
6
IS
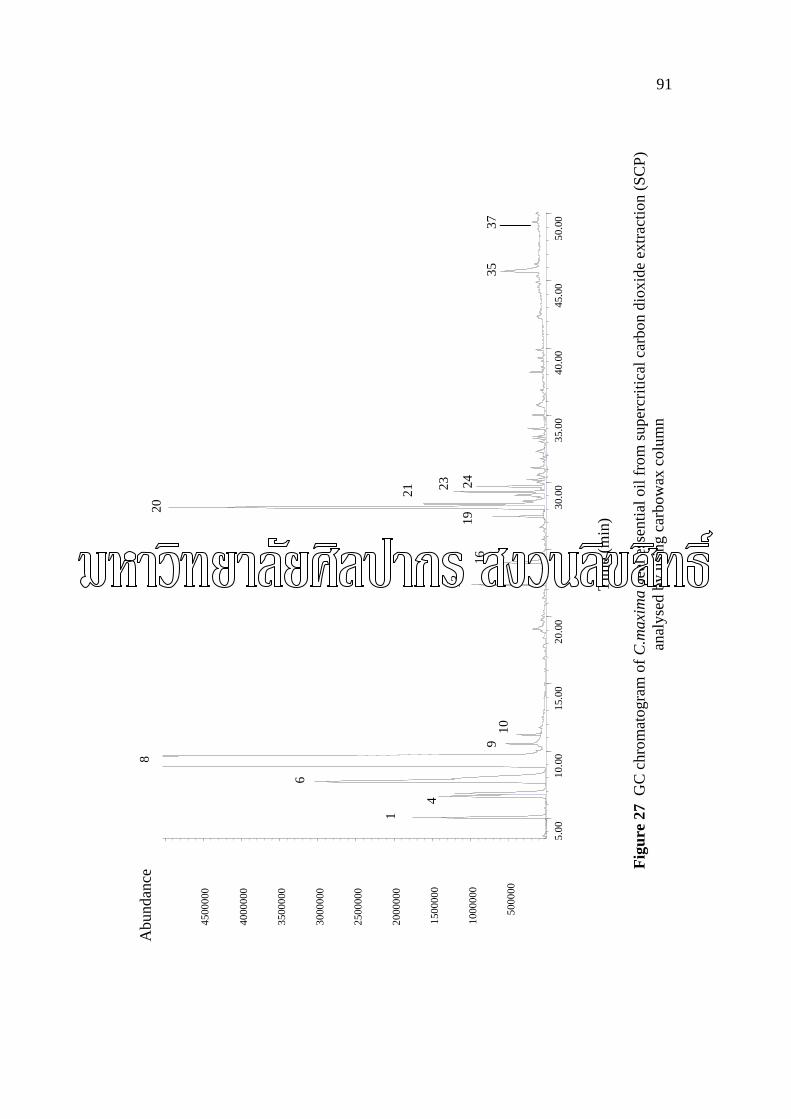
91
5.00
10
.00
15.0
0 20
.00
25.0
0 30
.00
35.0
0 40
.00
45.0
0 50
.00
5000
00
1000
000
1500
000
2000
000
2500
000
3000
000
3500
000
4000
000
4500
000
Abu
ndan
ce
1
4 6
8
9
10
13
16
1
9
20 2
1
23
24
35
37
Ti
me
(min
)
Figu
re 2
7 G
C c
hrom
atog
ram
of C
.max
ima
peel
ess
entia
l oil
from
supe
rcrit
ical
car
bon
diox
ide
extra
ctio
n (S
CP)
an
alys
ed b
y us
ing
carb
owax
col
umn
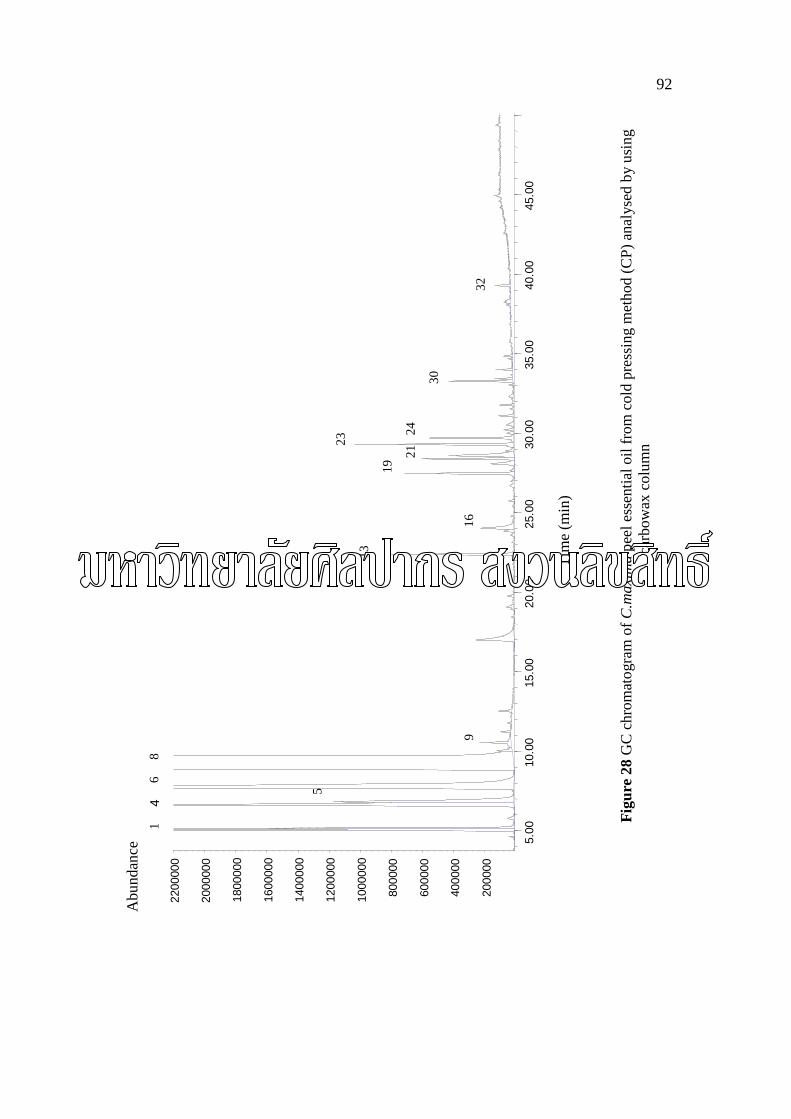
92
1 4
5
6 8
9
13
16
1
9
23
2
1 2
4
30
132
32
5.00
10
.00
15.0
0 20
.00
25.0
0 30
.00
35.0
0 40
.00
45.0
0
2000
00
4000
00
6000
00
8000
00
1000
000
1200
000
1400
000
1600
000
1800
000
2000
000
2200
000
Abu
ndan
ce
Figu
re 2
8 G
C c
hrom
atog
ram
of C
.max
ima
peel
ess
entia
l oil
from
col
d pr
essi
ng m
etho
d (C
P) a
naly
sed
by u
sing
ca
rbow
ax c
olum
n
Tim
e (m
in)
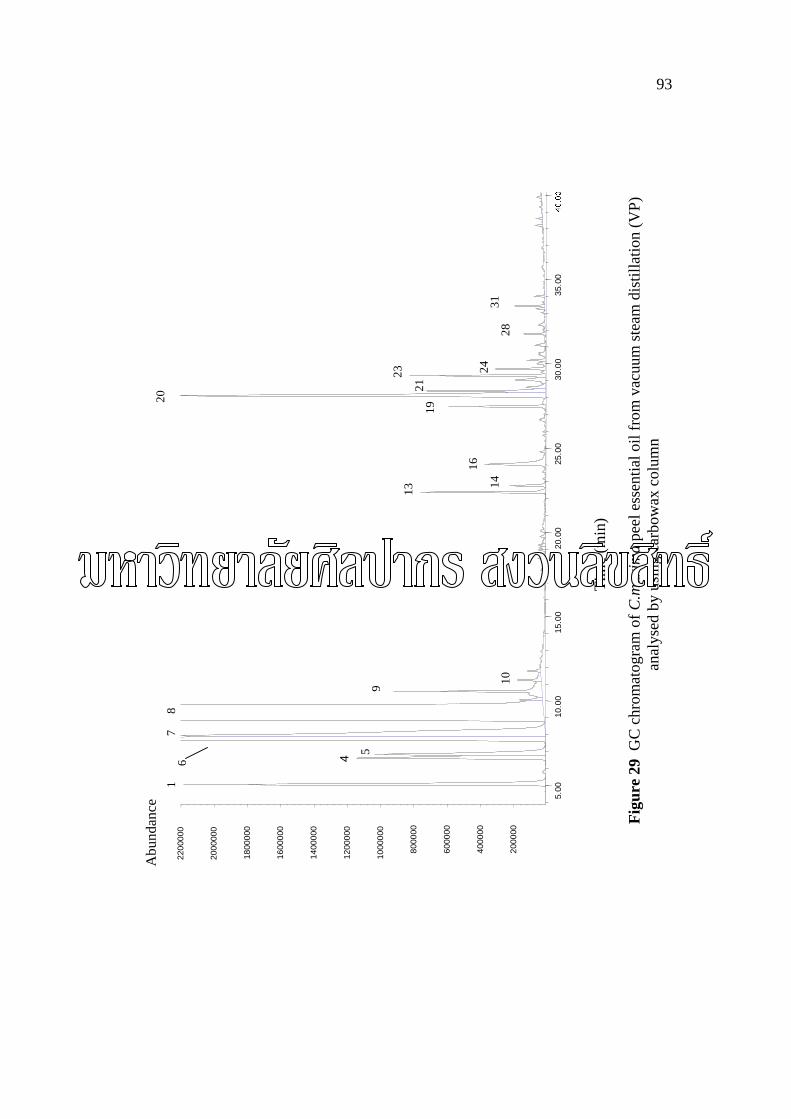
93
5.00
10
.00
15.0
0 20
.00
25.0
0 30
.00
35.0
0 40
.00
2000
00
4000
00
6000
00
8000
00
1000
000
1200
000
1400
000
1600
000
1800
000
2000
000
2200
000
Abu
ndan
ce
1
4 5
6
7
8
10
9
13
14
16
1
9 2
0 2
1 23
24
2
8 3
1
Ti
me
(min
)
Figu
re 2
9 G
C c
hrom
atog
ram
of C
.max
ima
peel
ess
entia
l oil
from
vac
uum
stea
m d
istil
latio
n (V
P)
anal
ysed
by
usin
g ca
rbow
ax c
olum
n
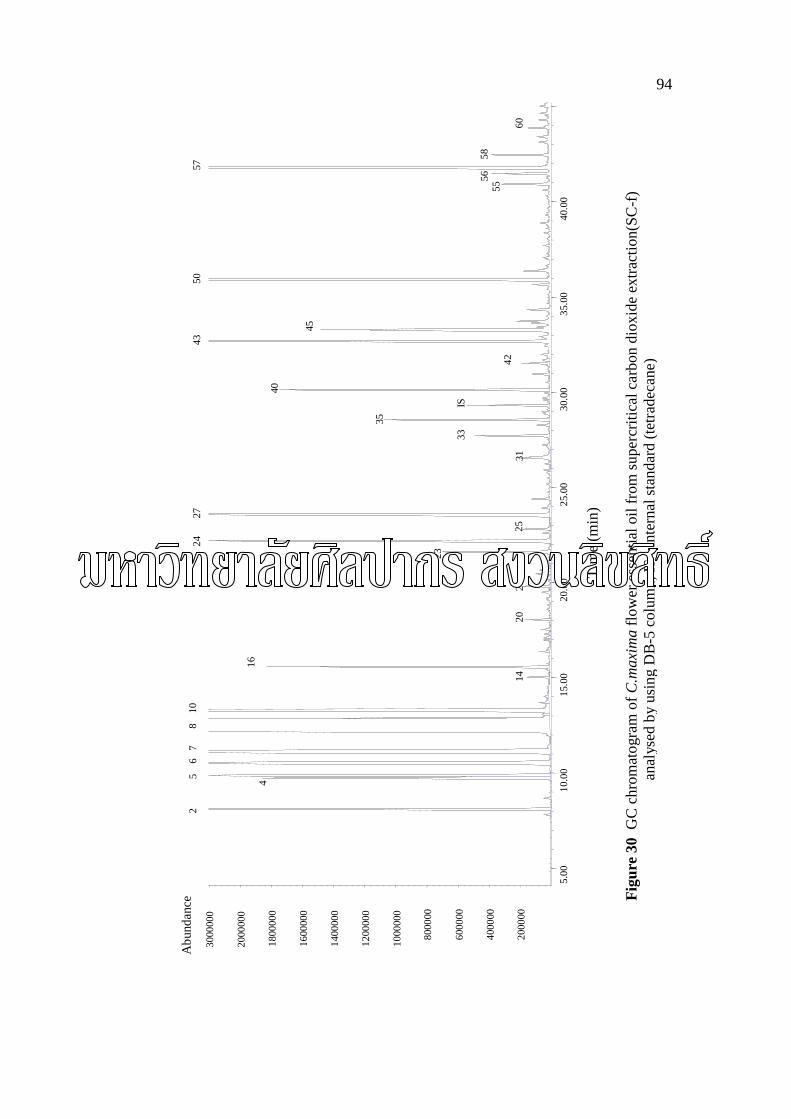
94
5.00
10
.00
15.0
0 20
.00
25.0
0 30
.00
35.0
0 40
.00
2000
00
4000
00
6000
00
8000
00
1000
000
1200
000
1400
000
1600
000
1800
000
2000
000
3000
000
2
4
5
6
7
8
1
0
16
2
1
20
24
1
4
23
25
2
7
3
3
3
1
35
Tim
e (m
in)
Abu
ndan
ce
IS
4
0
42 4
3 45
50
55
5
6 5
7 58
60
Figu
re 3
0 G
C c
hrom
atog
ram
of C
.max
ima
flow
er e
ssen
tial o
il fr
om su
perc
ritic
al c
arbo
n di
oxid
e ex
tract
ion(
SC-f
) an
alys
ed b
y us
ing
DB
-5 c
olum
n, IS
: in
tern
al st
anda
rd (t
etra
deca
ne)
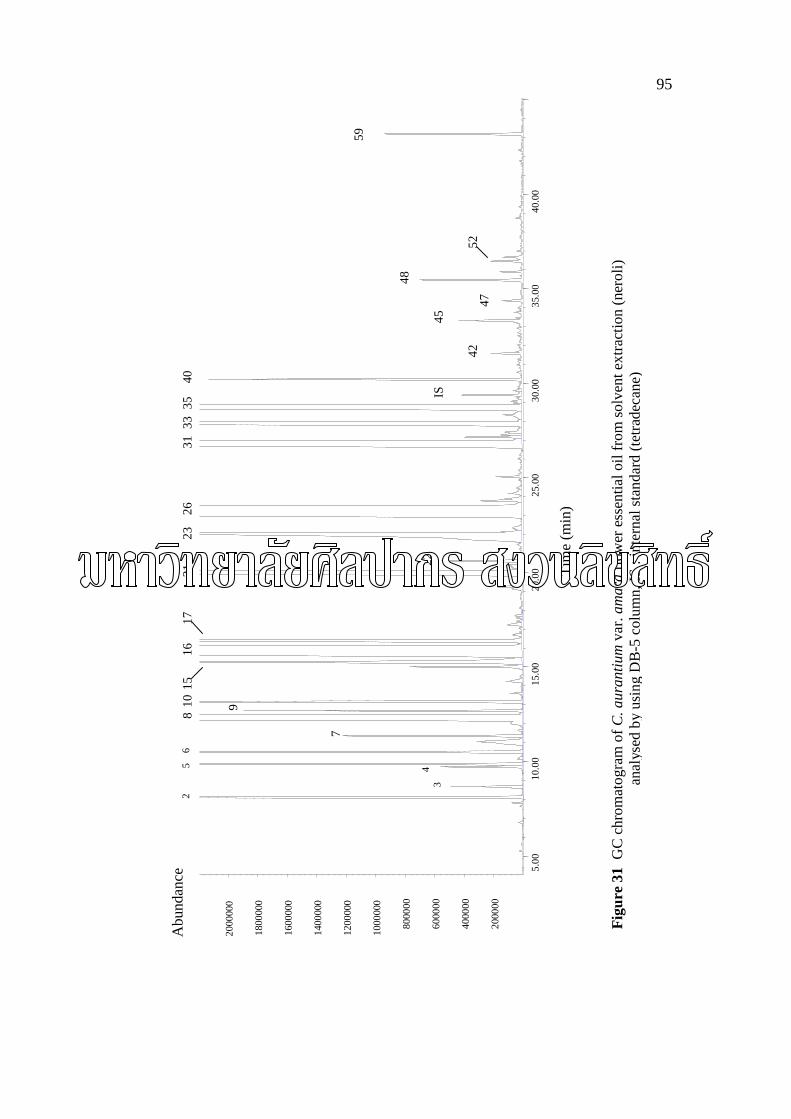
95
Fi
gure
31
GC
chr
omat
ogra
m o
f C. a
uran
tium
var
. am
ara
flow
er e
ssen
tial o
il fr
om so
lven
t ext
ract
ion
(ner
oli)
anal
ysed
by
usin
g D
B-5
col
umn,
IS :
inte
rnal
stan
dard
(tet
rade
cane
)
5.00
10
.00
15.0
0 20
.00
25.0
0 30
.00
35.0
0 40
.00
2000
00
4000
00
6000
00
8000
00
1000
000
1200
000
1400
000
1600
000
1800
000
2000
000
Abu
ndan
ce
7
8
Tim
e (m
in)
2 3
4
5
6
9
1
0 15
16
17
21
22
2
3 2
6
31
33
35
40
4
2
IS
4
5 47
48
52
5
9
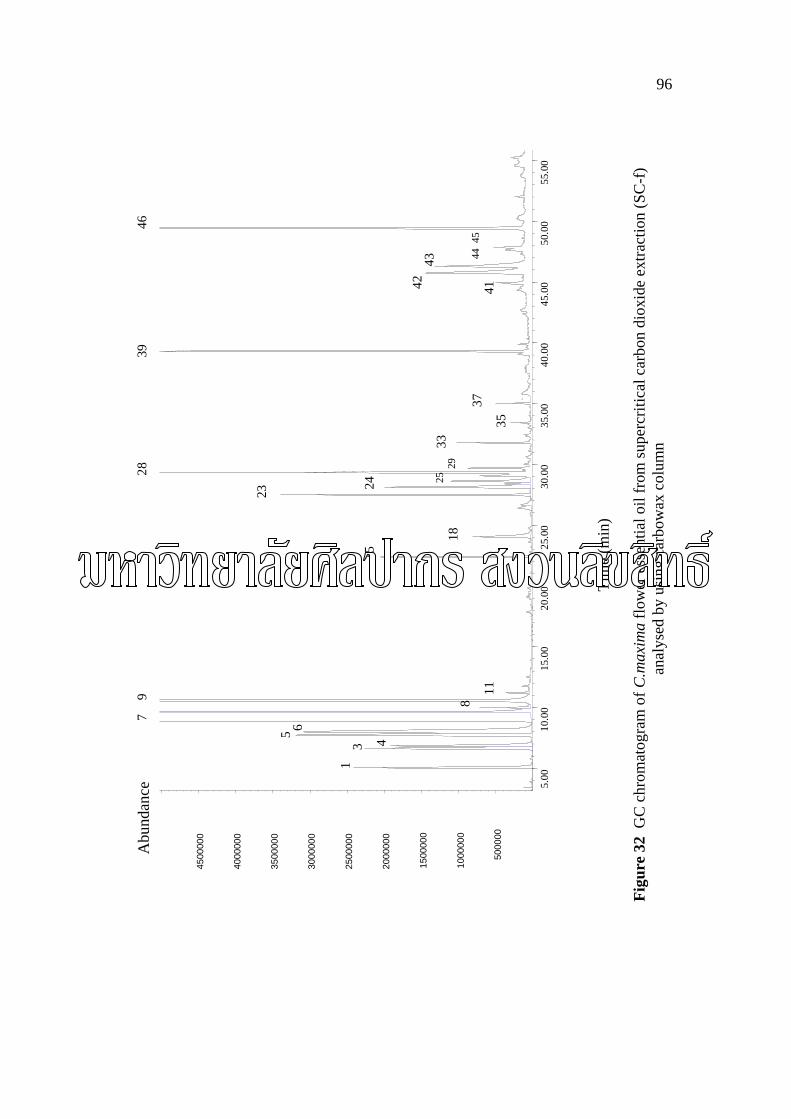
96
5.00
10
.00
15.0
0 20
.00
25.0
0 30
.00
35.0
0 40
.00
45.0
0 50
.00
55.0
0
5000
00
1000
000
1500
000
2000
000
2500
000
3000
000
3500
000
4000
000
4500
000
Abu
ndan
ce 1
3
4
5 6
7
8
15
9
11
1
8
23
24
25 28
2
9 3
3
39
35
37
41
4
2 4
3
4
4 4
5 4
6
Tim
e (m
in)
Figu
re 3
2 G
C c
hrom
atog
ram
of C
.max
ima
flow
er e
ssen
tial o
il fr
om su
perc
ritic
al c
arbo
n di
oxid
e ex
tract
ion
(SC
-f)
anal
ysed
by
usin
g ca
rbow
ax c
olum
n
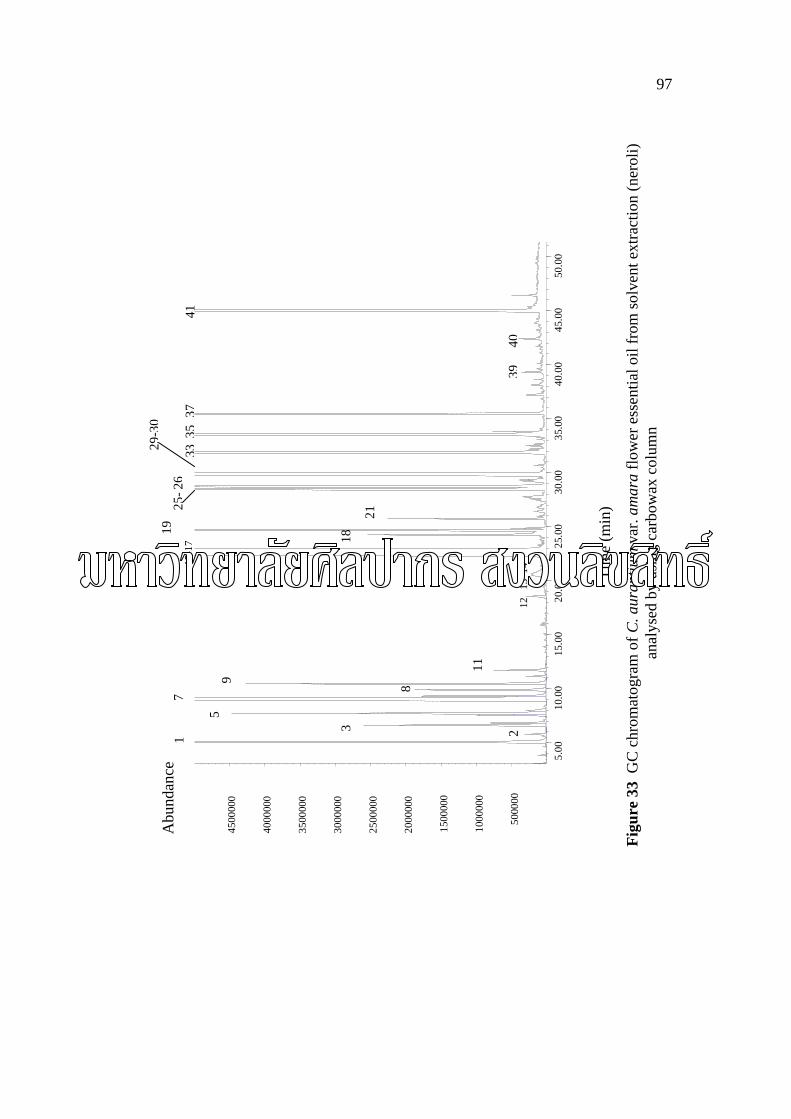
97
5.00
10
.00
15.0
0 20
.00
25.0
0 30
.00
35.0
0 40
.00
45.0
0 50
.00
5000
00
1000
000
1500
000
2000
000
2500
000
3000
000
3500
000
4000
000
4500
000
1
Abu
ndan
ce
2
3
5 7
8
9
11
12
13
14 15
-17 1
8 19 2
1
2 6
25-
29-
30
33 3
5 37
39
41
40
Tim
e (m
in)
Figu
re 3
3 G
C c
hrom
atog
ram
of C
. aur
antiu
m v
ar. a
mar
a flo
wer
ess
entia
l oil
from
solv
ent e
xtra
ctio
n (n
erol
i) an
alys
ed b
y us
ing
carb
owax
col
umn
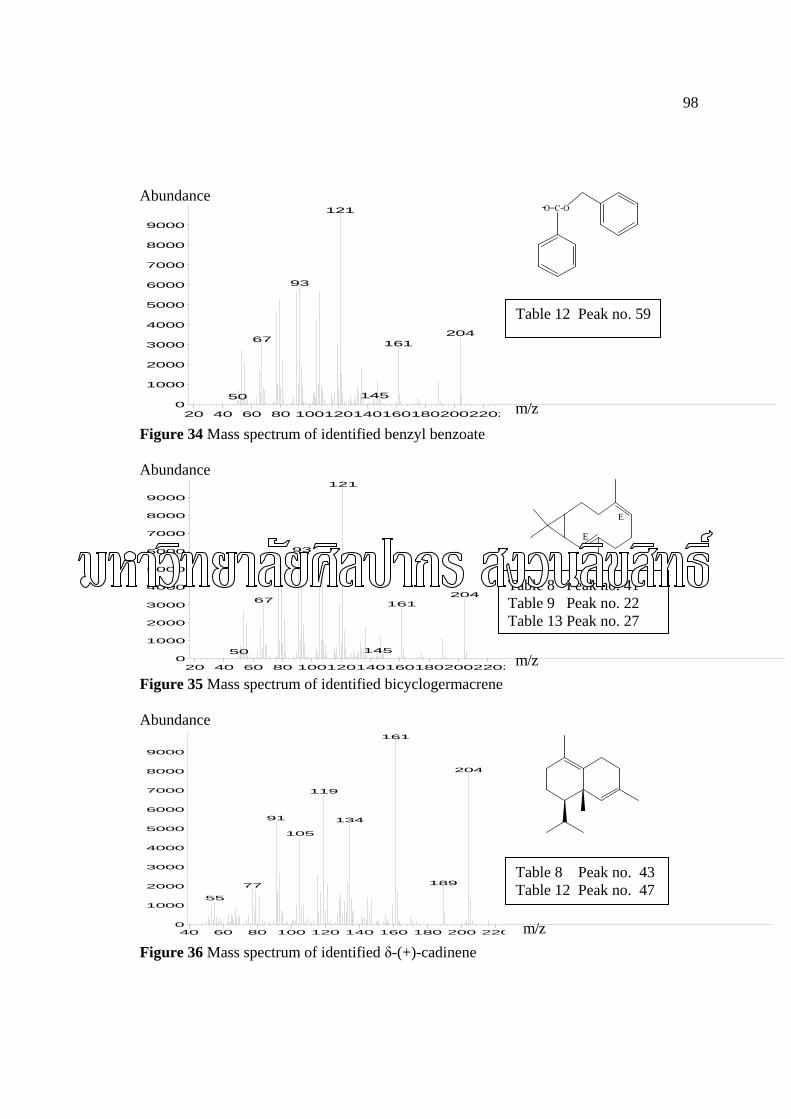
98
40 60 80 100 120 140 160 180 200 2200
1000
2000
3000
4000
5000
6000
7000
8000
9000
>
161
204
119
91 134
105
18977
55
20 40 60 80 10012014016018020022020
1000
2000
3000
4000
5000
6000
7000
8000
9000
(121
93
20467 161
14550
20 40 60 80 10012014016018020022020
1000
2000
3000
4000
5000
6000
7000
8000
9000
121
93
20467 161
14550
m/z
Abundance
Figure 34 Mass spectrum of identified benzyl benzoate Abundance
Figure 35 Mass spectrum of identified bicyclogermacrene Abundance
Figure 36 Mass spectrum of identified δ-(+)-cadinene
O=C-O
E
E
m/z
m/z
Table 12 Peak no. 59
Table 8 Peak no. 41 Table 9 Peak no. 22 Table 13 Peak no. 27
Table 8 Peak no. 43 Table 12 Peak no. 47
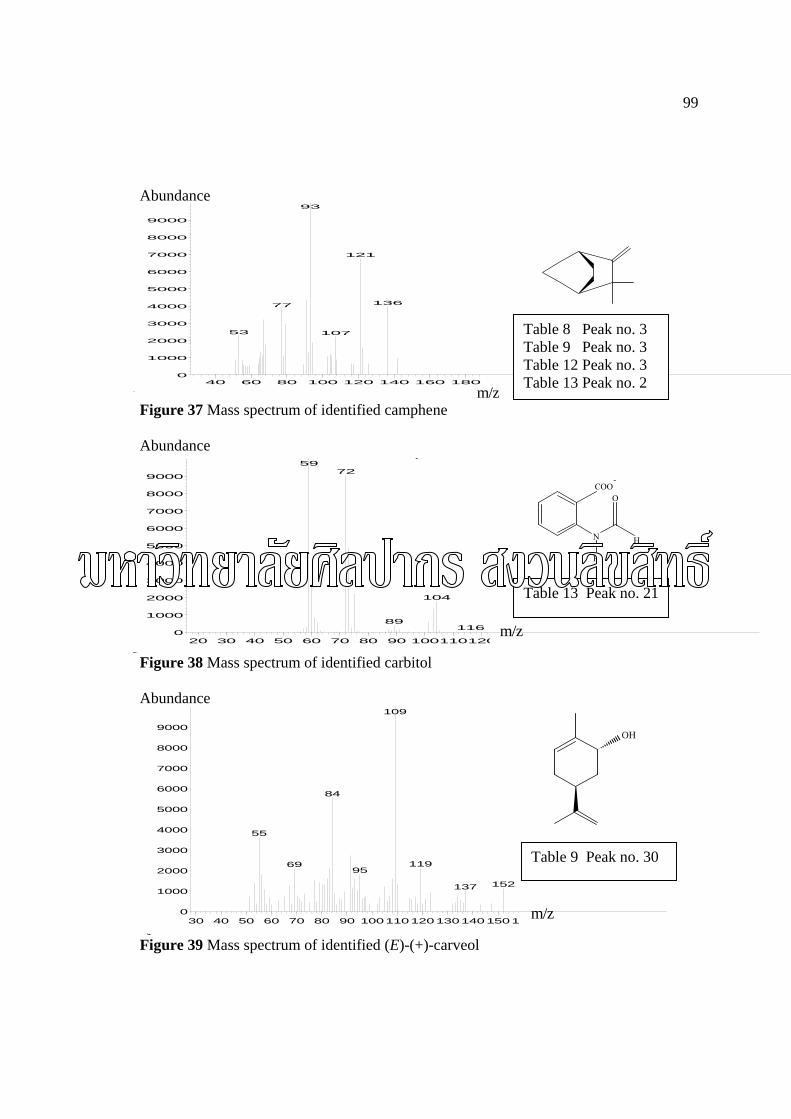
99
40 60 80 100 120 140 160 1800
1000
2000
3000
4000
5000
6000
7000
8000
9000
>
93
121
13677
53 107
m/z
20 30 40 50 60 70 80 90 1001101200
1000
2000
3000
4000
5000
6000
7000
8000
9000
>
(59
72
104
89116
30 40 50 60 70 80 90 10011012013014015010
1000
2000
3000
4000
5000
6000
7000
8000
9000
>
109
84
55
1196995
152137
Abundance
Figure 37 Mass spectrum of identified camphene Abundance
Figure 38 Mass spectrum of identified carbitol Abundance
Figure 39 Mass spectrum of identified (E)-(+)-carveol
m/z
NH
H
OCOO-
OH
m/z
Table 9 Peak no. 30
Table 13 Peak no. 21
Table 8 Peak no. 3 Table 9 Peak no. 3 Table 12 Peak no. 3 Table 13 Peak no. 2
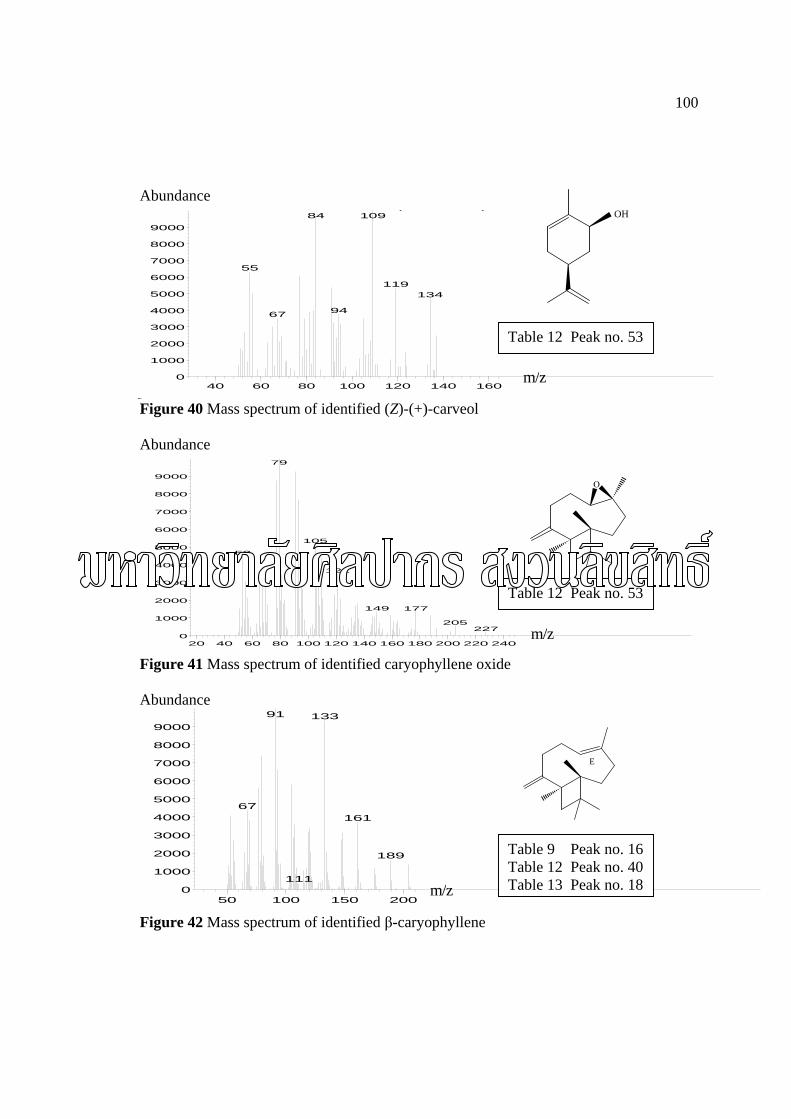
100
40 60 80 100 120 140 1600
1000
2000
3000
4000
5000
6000
7000
8000
9000
>
( )10984
55
119134
9467
20 40 60 80 100 120 140 160 180 200 220 2400
1000
2000
3000
4000
5000
6000
7000
8000
9000
>
( )79
105
53
121
149 177
205227
50 100 150 2000
1000
2000
3000
4000
5000
6000
7000
8000
900091 133
67161
189
111
Abundance
Figure 40 Mass spectrum of identified (Z)-(+)-carveol
Abundance
Figure 41 Mass spectrum of identified caryophyllene oxide
Abundance
Figure 42 Mass spectrum of identified β-caryophyllene
OH
m/z
O
E
m/z
m/z
Table 9 Peak no. 16 Table 12 Peak no. 40 Table 13 Peak no. 18
Table 12 Peak no. 53
Table 12 Peak no. 53
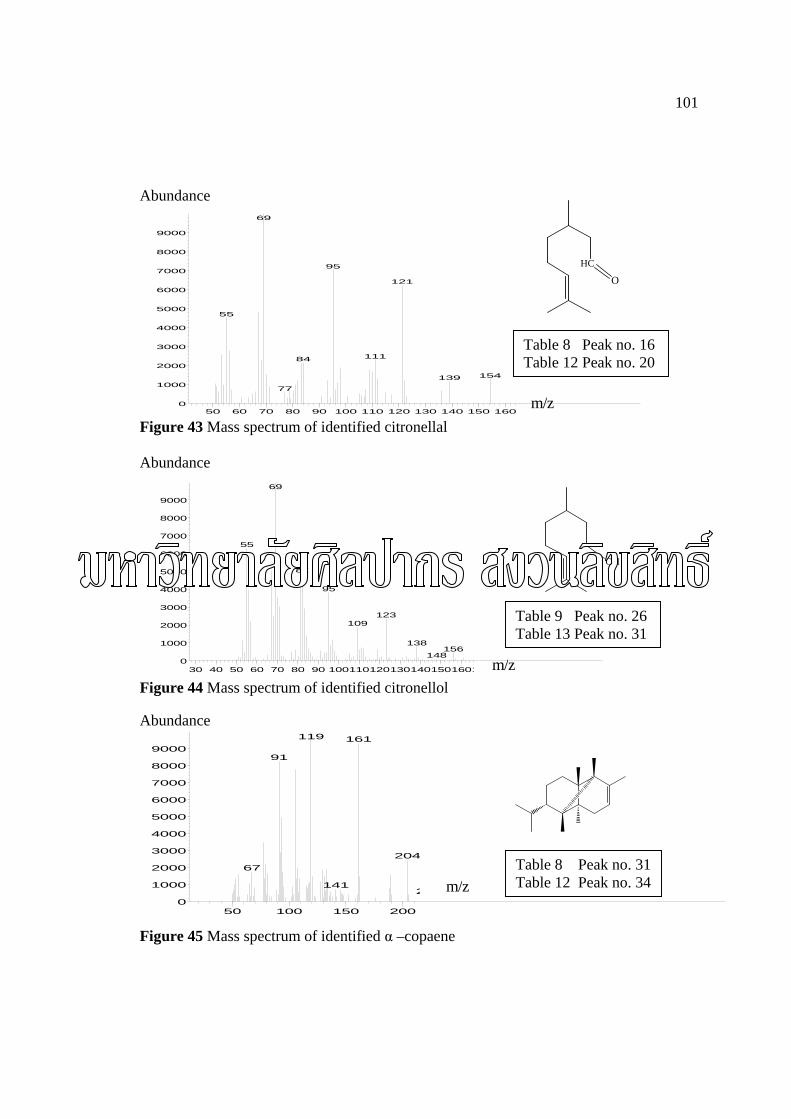
101
50 60 70 80 90 100 110 120 130 140 150 1600
1000
2000
3000
4000
5000
6000
7000
8000
9000
69
95
121
55
11184
154139
77
30 40 50 60 70 80 90 10011012013014015016010
1000
2000
3000
4000
5000
6000
7000
8000
9000
69
55
82
95
123109
138156
148
50 100 150 2000
1000
2000
3000
4000
5000
6000
7000
8000
9000
119 161
91
20467
1412
Abundance
Figure 43 Mass spectrum of identified citronellal Abundance
Figure 44 Mass spectrum of identified citronellol
Abundance
Figure 45 Mass spectrum of identified α –copaene
HC
O
m/z
m/z
OH
m/zTable 8 Peak no. 31 Table 12 Peak no. 34
Table 9 Peak no. 26 Table 13 Peak no. 31
Table 8 Peak no. 16 Table 12 Peak no. 20
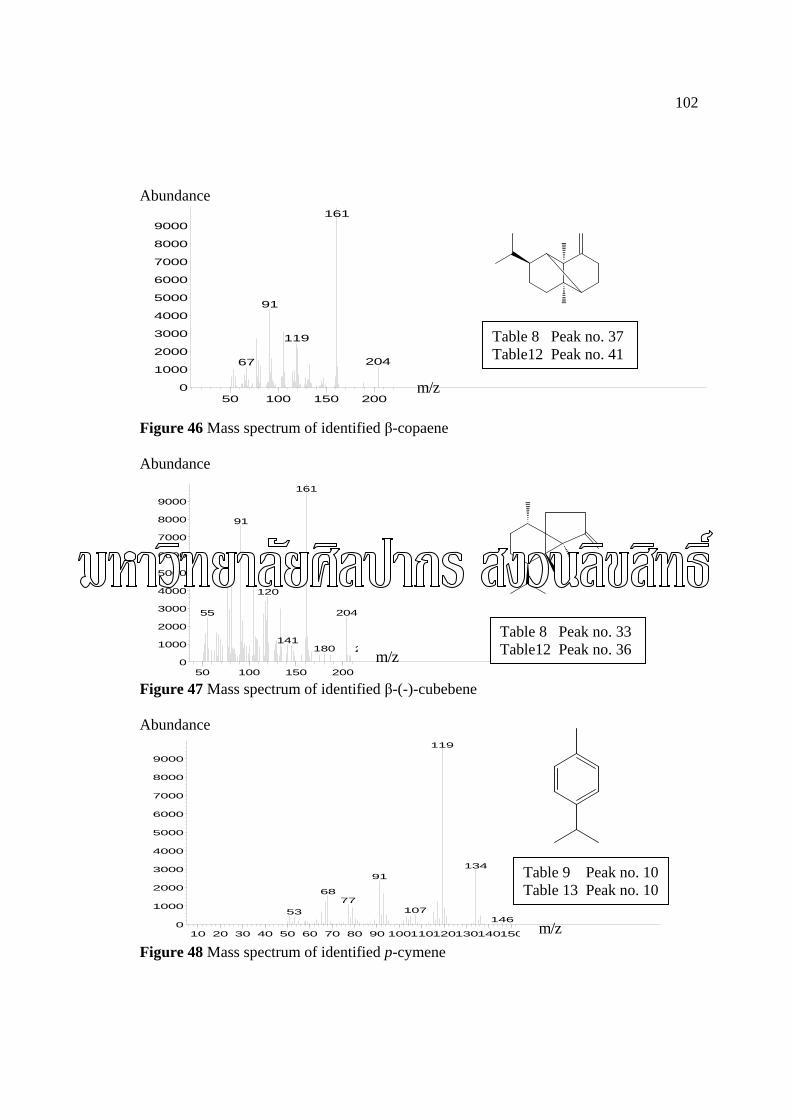
102
50 100 150 2000
1000
2000
3000
4000
5000
6000
7000
8000
9000
>
(161
91
119
20467
50 100 150 2000
1000
2000
3000
4000
5000
6000
7000
8000
9000
161
91
120
20455
141180 2
10 20 30 40 50 60 70 80 90 1001101201301401500
1000
2000
3000
4000
5000
6000
7000
8000
9000
( )119
13491
6877
10753146
Abundance
Figure 46 Mass spectrum of identified β-copaene
Abundance
Figure 47 Mass spectrum of identified β-(-)-cubebene
Abundance
Figure 48 Mass spectrum of identified p-cymene
m/z
m/z
m/z
Table 9 Peak no. 10 Table 13 Peak no. 10
Table 8 Peak no. 33 Table12 Peak no. 36
Table 8 Peak no. 37 Table12 Peak no. 41
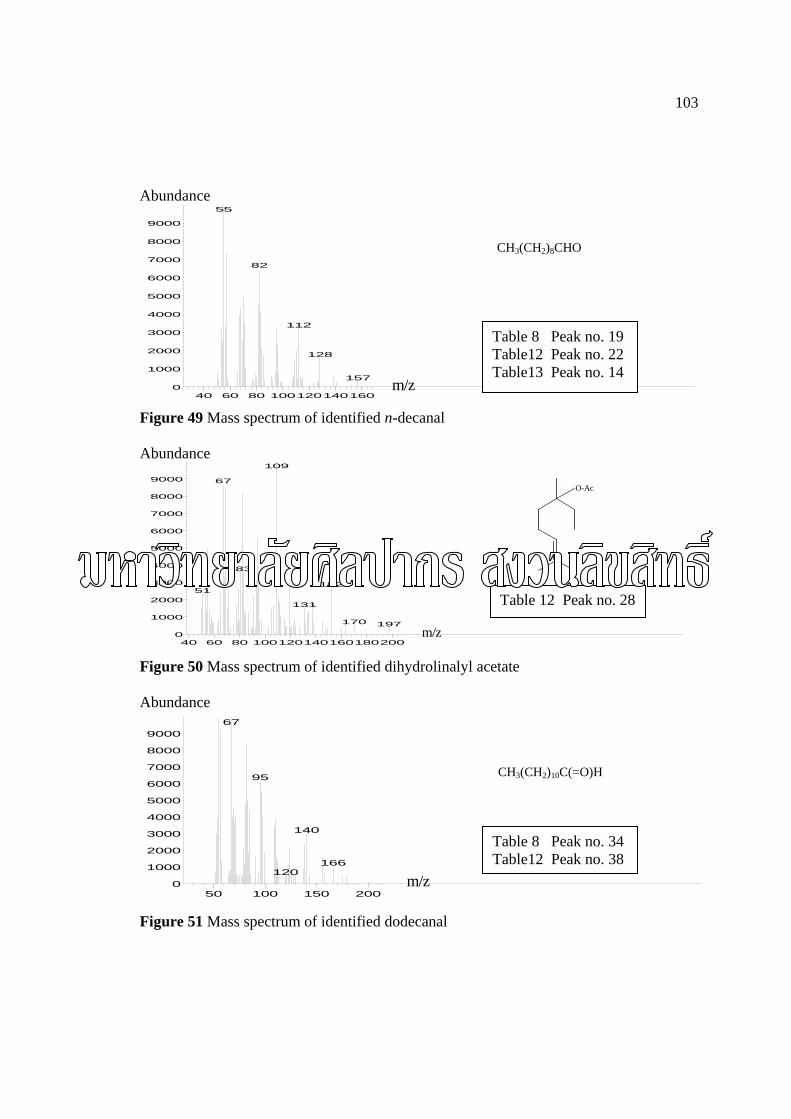
103
40 60 80 1001201401600
1000
2000
3000
4000
5000
6000
7000
8000
9000
>
55
82
112
128
157
40 60 80 1001201401601802000
1000
2000
3000
4000
5000
6000
7000
8000
9000
109
67
83
15251
131
170 197
50 100 150 2000
1000
2000
3000
4000
5000
6000
7000
8000
9000
>
67
95
140
166120
Abundance
CH3(CH2)8CHO
Figure 49 Mass spectrum of identified n-decanal Abundance
Figure 50 Mass spectrum of identified dihydrolinalyl acetate Abundance
CH3(CH2)10C(=O)H
Figure 51 Mass spectrum of identified dodecanal
m/z
O-Ac
m/z
m/z
Table 8 Peak no. 34 Table12 Peak no. 38
Table 12 Peak no. 28
Table 8 Peak no. 19 Table12 Peak no. 22 Table13 Peak no. 14
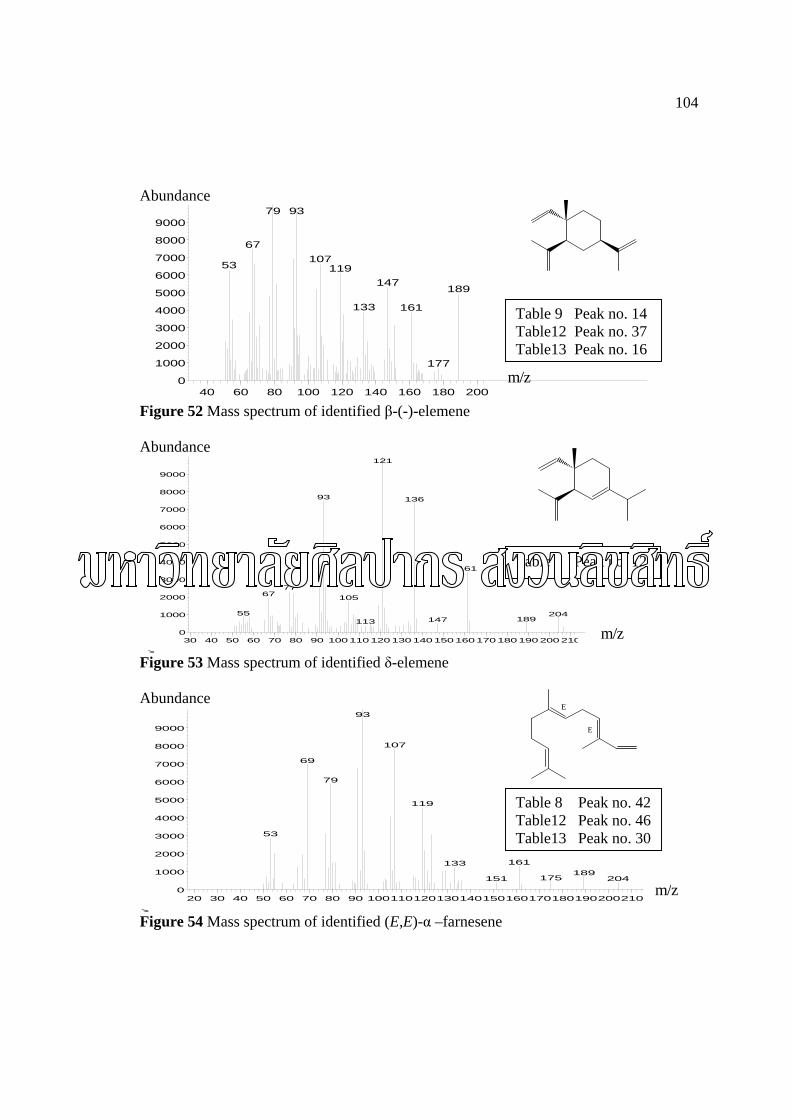
104
40 60 80 100 120 140 160 180 2000
1000
2000
3000
4000
5000
6000
7000
8000
900079 93
67107
53 119147
189
133 161
177
30 40 50 60 70 80 90 1001101201301401501601701801902002100
1000
2000
3000
4000
5000
6000
7000
8000
9000
>
121
93 136
161
7767 105
55 204189147113
20 30 40 50 60 70 80 90 1001101201301401501601701801902002100
1000
2000
3000
4000
5000
6000
7000
8000
9000
->
93
107
69
79
119
53
161133189
175 204151
Abundance
Figure 52 Mass spectrum of identified β-(-)-elemene Abundance
Figure 53 Mass spectrum of identified δ-elemene Abundance
Figure 54 Mass spectrum of identified (E,E)-α –farnesene
m/z
E
E
m/z
m/z
Table 8 Peak no. 42 Table12 Peak no. 46 Table13 Peak no. 30
Table 9 Peak no. 12
Table 9 Peak no. 14 Table12 Peak no. 37 Table13 Peak no. 16
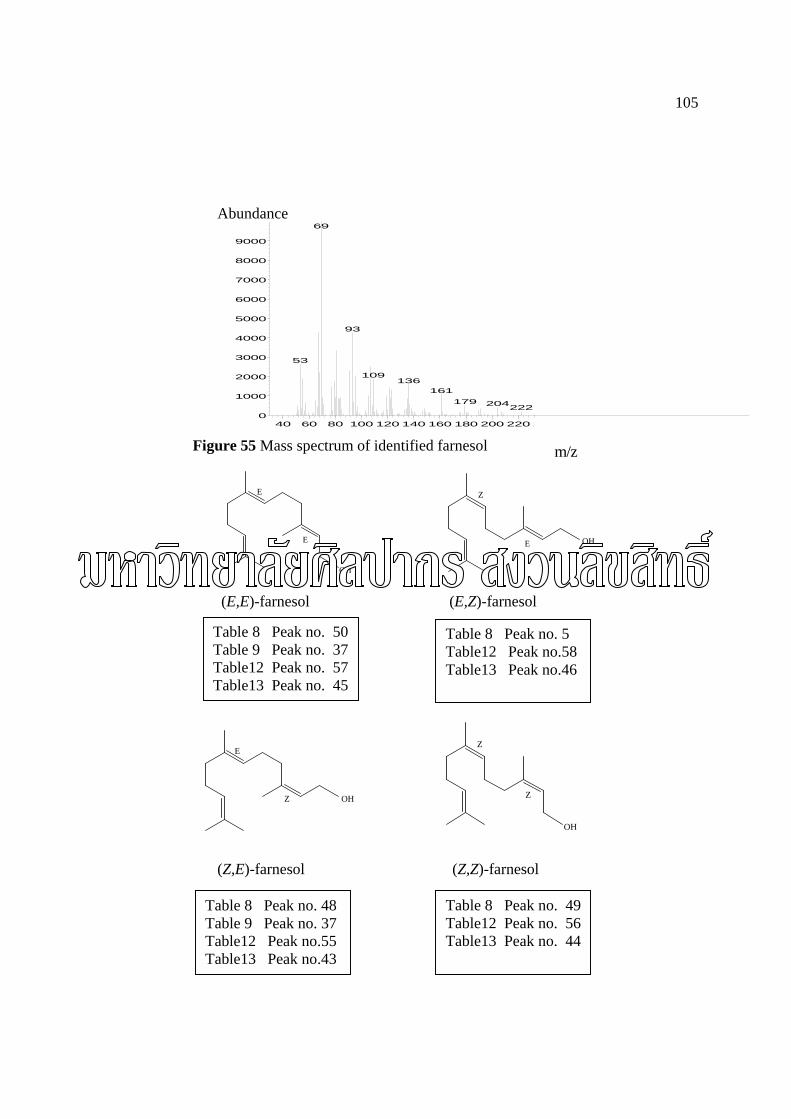
105
40 60 80 100 120 140 160 180 200 220 20
1000
2000
3000
4000
5000
6000
7000
8000
9000
69
93
53
109136
161
179 204222
Abundance
Figure 55 Mass spectrum of identified farnesol
OH
E
E
OHE
Z
(E,E)-farnesol (E,Z)-farnesol (Z,E)-farnesol (Z,Z)-farnesol
m/z
OH
Z
Z
Table 8 Peak no. 50 Table 9 Peak no. 37 Table12 Peak no. 57 Table13 Peak no. 45
OH
E
Z
Table 8 Peak no. 5 Table12 Peak no.58 Table13 Peak no.46
Table 8 Peak no. 48 Table 9 Peak no. 37 Table12 Peak no.55 Table13 Peak no.43
Table 8 Peak no. 49 Table12 Peak no. 56 Table13 Peak no. 44
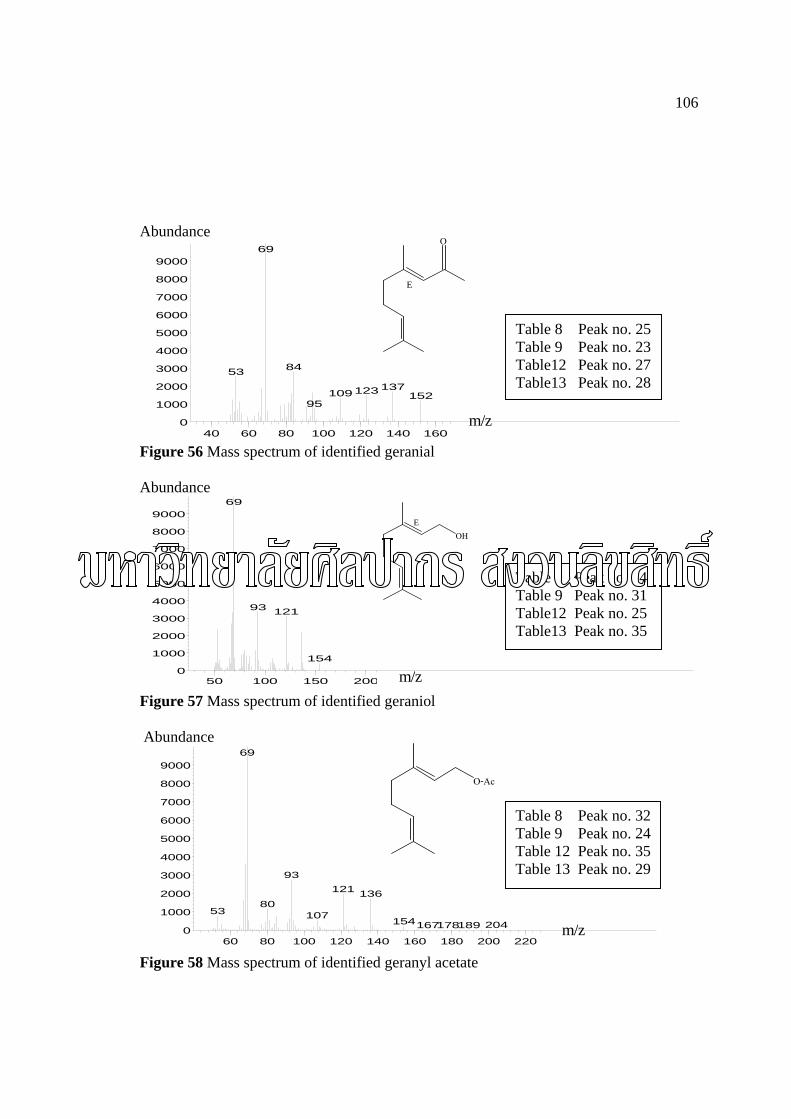
106
40 60 80 100 120 140 1600
1000
2000
3000
4000
5000
6000
7000
8000
900069
8453
137123109 15295
50 100 150 2000
1000
2000
3000
4000
5000
6000
7000
8000
900069
93 121
154
60 80 100 120 140 160 180 200 2200
1000
2000
3000
4000
5000
6000
7000
8000
900069
93
121 13680
53 107154 204189167178
Abundance
Figure 56 Mass spectrum of identified geranial Abundance
Figure 57 Mass spectrum of identified geraniol
Abundance
Figure 58 Mass spectrum of identified geranyl acetate
O
E
OHE
O-Ac
m/z
m/z
m/z
Table 8 Peak no. 32 Table 9 Peak no. 24 Table 12 Peak no. 35 Table 13 Peak no. 29
Table 8 Peak no. 24 Table 9 Peak no. 31 Table12 Peak no. 25 Table13 Peak no. 35
Table 8 Peak no. 25 Table 9 Peak no. 23 Table12 Peak no. 27 Table13 Peak no. 28
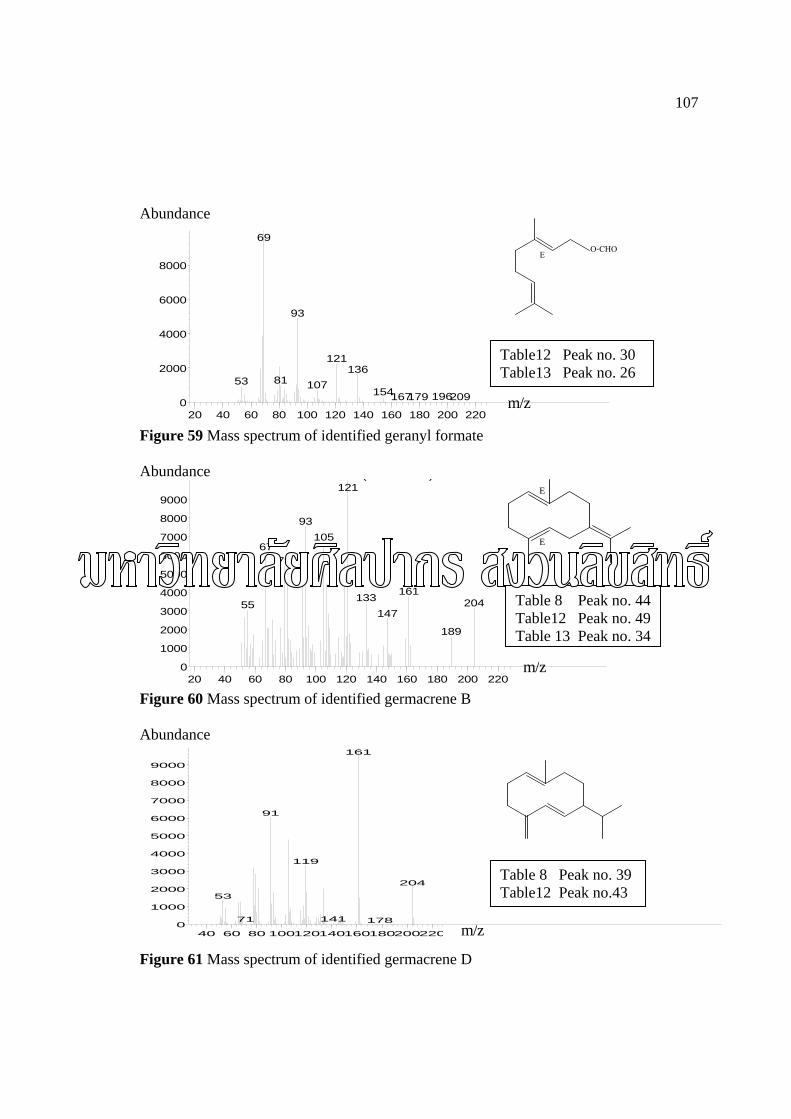
107
20 40 60 80 100 120 140 160 180 200 2200
2000
4000
6000
8000
69
93
121136
8153 107154 196167179 209
20 40 60 80 100 120 140 160 180 200 2200
1000
2000
3000
4000
5000
6000
7000
8000
9000
( )121
93
10567
79
161133 20455
147
189
40 60 80 1001201401601802002200
1000
2000
3000
4000
5000
6000
7000
8000
9000
(161
91
119
204
53
14171 178
Abundance
Figure 59 Mass spectrum of identified geranyl formate Abundance
Figure 60 Mass spectrum of identified germacrene B Abundance
Figure 61 Mass spectrum of identified germacrene D
O-CHOE
E
E
m/z
m/z
m/z
Table 8 Peak no. 39 Table12 Peak no.43
Table 8 Peak no. 44 Table12 Peak no. 49 Table 13 Peak no. 34
Table12 Peak no. 30 Table13 Peak no. 26
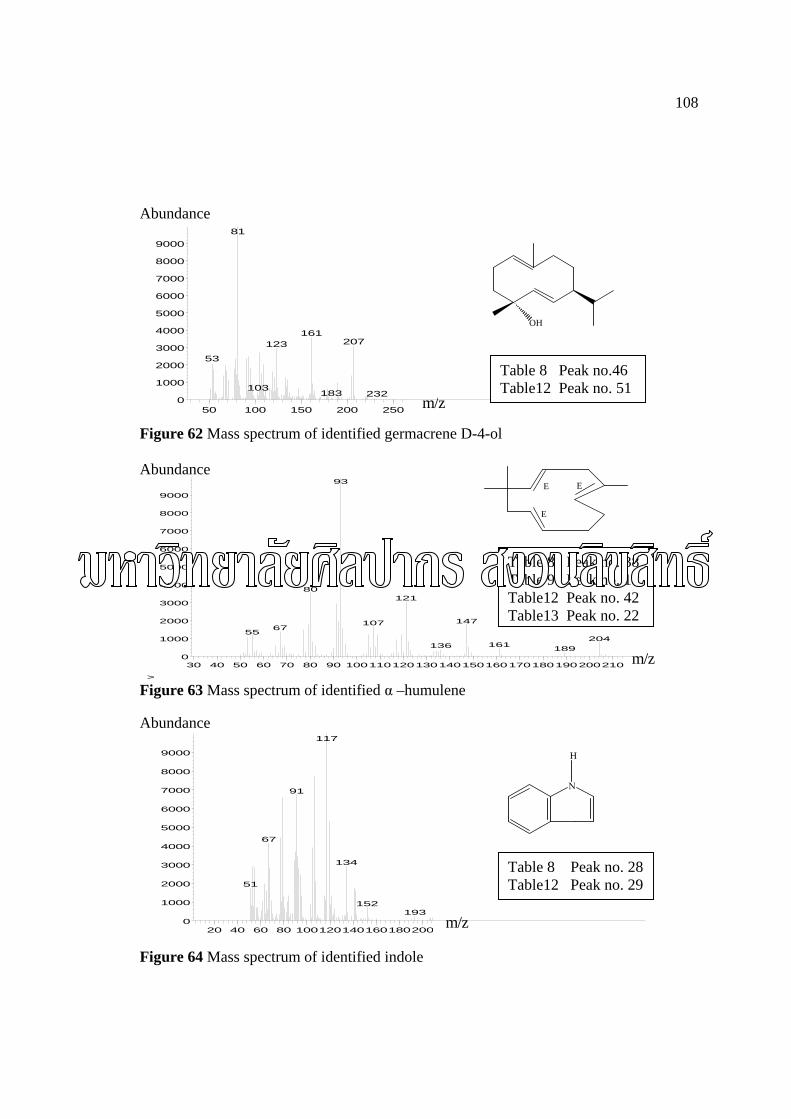
108
50 100 150 200 2500
1000
2000
3000
4000
5000
6000
7000
8000
9000
>
(81
161207123
53
103183 232
30 40 50 60 70 80 90 1001101201301401501601701801902002100
1000
2000
3000
4000
5000
6000
7000
8000
9000
>
93
80121
14710767
55204
161136 189
20 40 60 80 1001201401601802000
1000
2000
3000
4000
5000
6000
7000
8000
9000
117
91
67
134
51
152193
Abundance
Figure 62 Mass spectrum of identified germacrene D-4-ol Abundance
Figure 63 Mass spectrum of identified α –humulene Abundance
Figure 64 Mass spectrum of identified indole
OH
E
E
E
N
H
m/z
m/z
m/z
Table 8 Peak no. 28 Table12 Peak no. 29
Table 8 Peak no. 38 Table 9 Peak no. 18 Table12 Peak no. 42 Table13 Peak no. 22
Table 8 Peak no.46 Table12 Peak no. 51
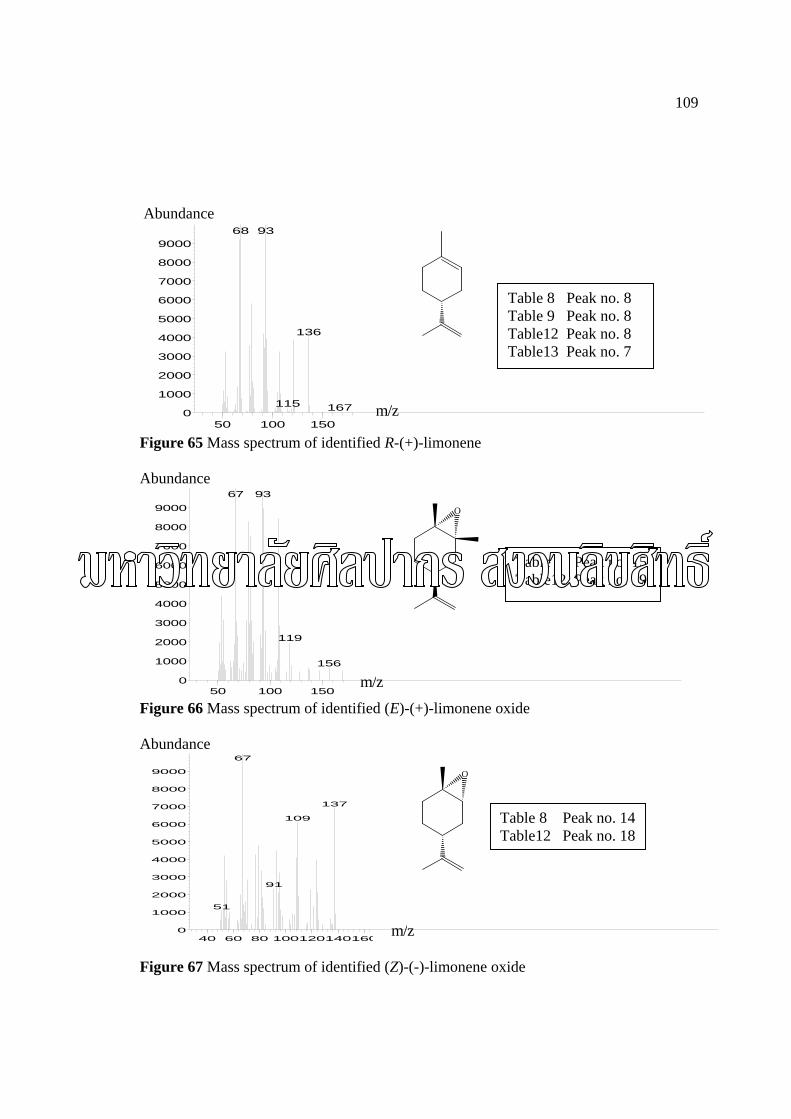
109
50 100 1500
1000
2000
3000
4000
5000
6000
7000
8000
90009368
136
115 167
50 100 1500
1000
2000
3000
4000
5000
6000
7000
8000
9000
67 93
119
156
40 60 80 1001201401600
1000
2000
3000
4000
5000
6000
7000
8000
9000
67
137
109
91
51
Abundance
Figure 65 Mass spectrum of identified R-(+)-limonene Abundance
Figure 66 Mass spectrum of identified (E)-(+)-limonene oxide
Abundance
Figure 67 Mass spectrum of identified (Z)-(-)-limonene oxide
O
O
m/z
m/z
m/z
Table 8 Peak no. 14 Table12 Peak no. 18
Table 8 Peak no. 15 Table12 Peak no. 19
Table 8 Peak no. 8 Table 9 Peak no. 8 Table12 Peak no. 8 Table13 Peak no. 7
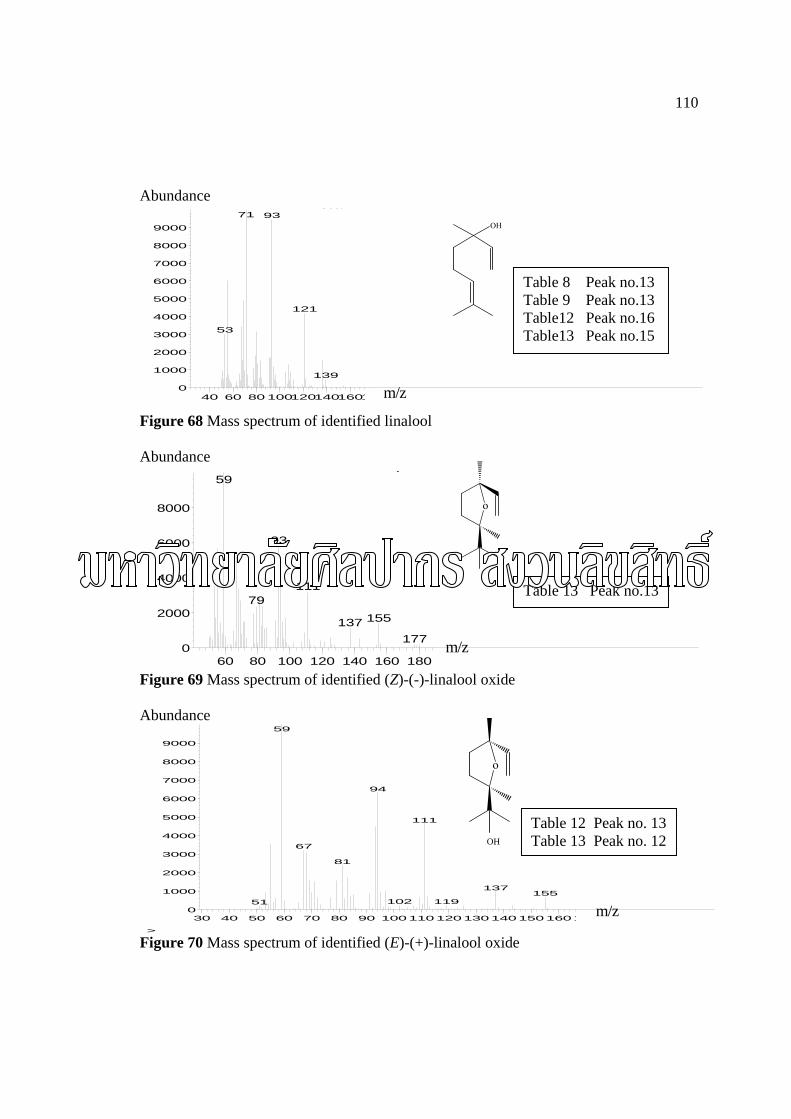
110
40 60 80 10012014016010
1000
2000
3000
4000
5000
6000
7000
8000
9000
>
Scan 2171 93
121
53
139
60 80 100 120 140 160 1800
2000
4000
6000
8000
(59
93
11179
155137177
30 40 50 60 70 80 90 10011012013014015016010
1000
2000
3000
4000
5000
6000
7000
8000
9000
>
( )59
94
111
67
81
137155
102 11951
Abundance
Figure 68 Mass spectrum of identified linalool Abundance
Figure 69 Mass spectrum of identified (Z)-(-)-linalool oxide
Abundance
Figure 70 Mass spectrum of identified (E)-(+)-linalool oxide
OH
o
o
OH
m/z
m/z
m/z
Table 12 Peak no. 13 Table 13 Peak no. 12
Table 13 Peak no.13
Table 8 Peak no.13 Table 9 Peak no.13 Table12 Peak no.16 Table13 Peak no.15
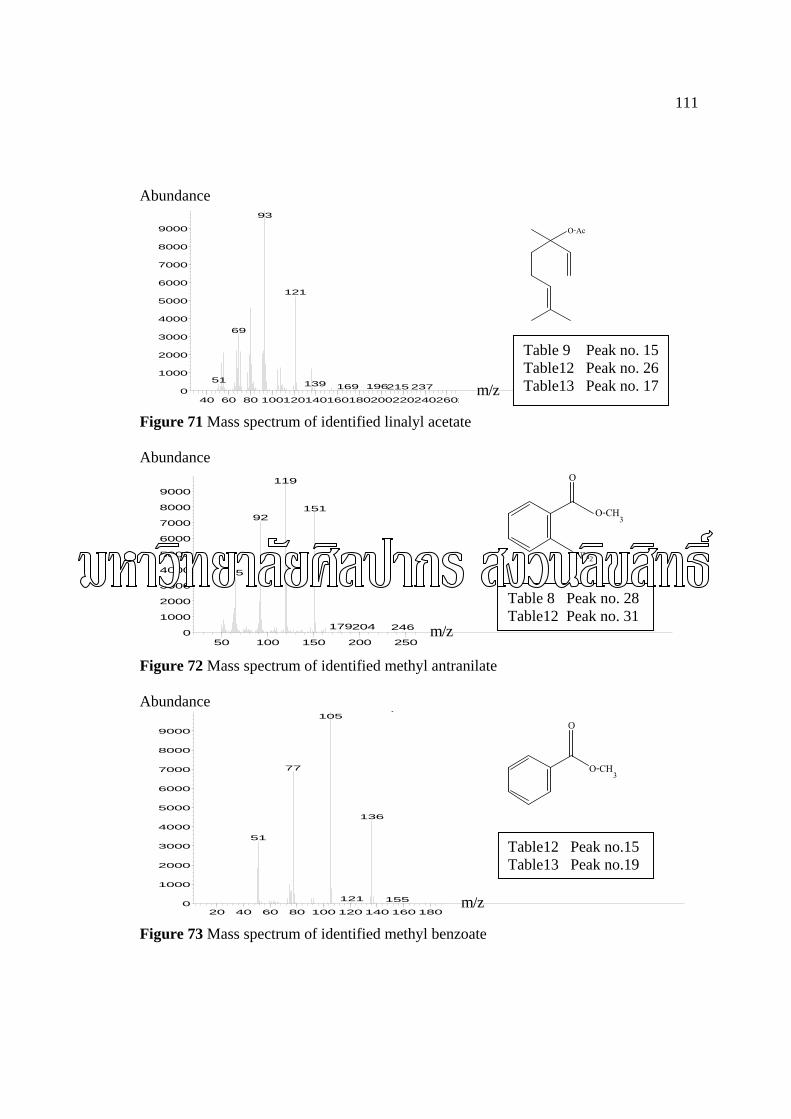
111
40 60 80 10012014016018020022024026020
1000
2000
3000
4000
5000
6000
7000
8000
9000
>
( )93
121
69
51 139 196169 237215
50 100 150 200 2500
1000
2000
3000
4000
5000
6000
7000
8000
9000
(119
15192
65
179204 246
20 40 60 80 100 120 140 160 1800
1000
2000
3000
4000
5000
6000
7000
8000
9000
(105
77
136
51
121 155
Abundance
Figure 71 Mass spectrum of identified linalyl acetate Abundance
Figure 72 Mass spectrum of identified methyl antranilate Abundance
Figure 73 Mass spectrum of identified methyl benzoate
O-Ac
NH2
O
O-CH3
O-CH3
O
m/z
m/z
m/z
Table12 Peak no.15 Table13 Peak no.19
Table 8 Peak no. 28 Table12 Peak no. 31
Table 9 Peak no. 15 Table12 Peak no. 26 Table13 Peak no. 17
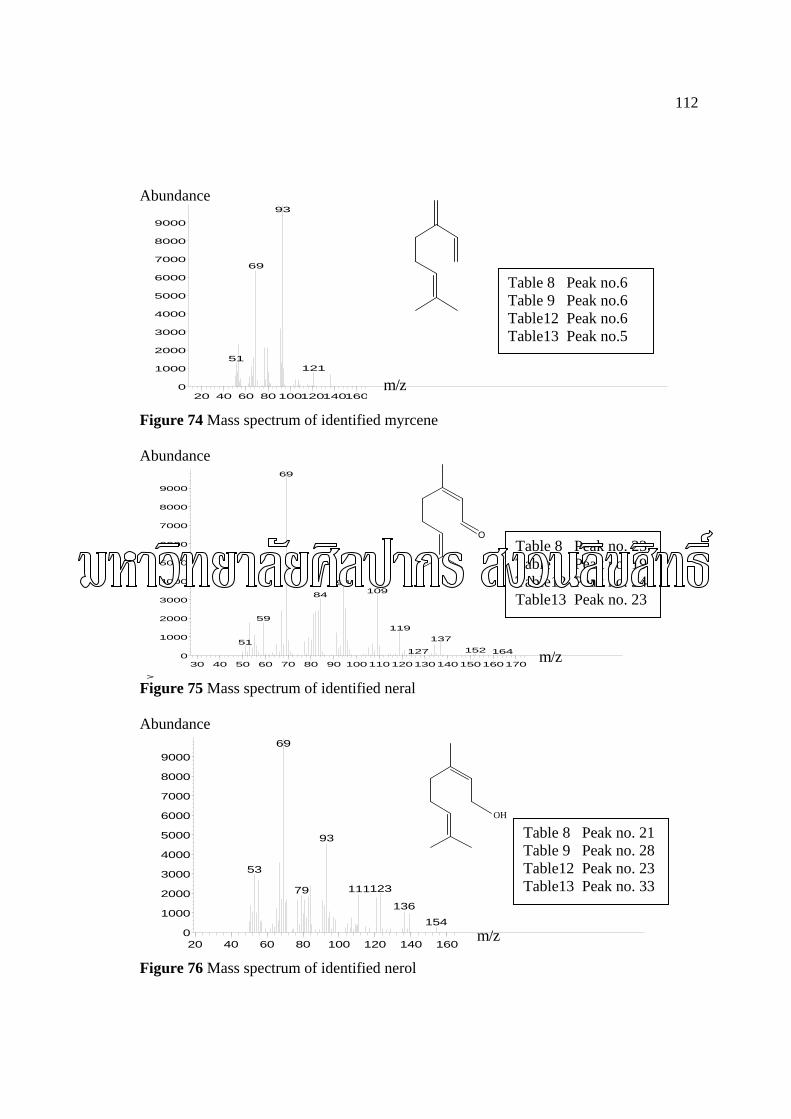
112
20 40 60 80 1001201401600
1000
2000
3000
4000
5000
6000
7000
8000
9000
>
93
69
51121
30 40 50 60 70 80 90 1001101201301401501601700
1000
2000
3000
4000
5000
6000
7000
8000
9000
>
69
9410984
59119
13751152127 164
20 40 60 80 100 120 140 1600
1000
2000
3000
4000
5000
6000
7000
8000
900069
93
53
12311179
136
154
Abundance
Figure 74 Mass spectrum of identified myrcene Abundance
Figure 75 Mass spectrum of identified neral Abundance
Figure 76 Mass spectrum of identified nerol
O
m/z
m/z
OH
m/z
Table 8 Peak no. 21 Table 9 Peak no. 28 Table12 Peak no. 23 Table13 Peak no. 33
Table 8 Peak no. 23 Table 9 Peak no. 19 Table12 Peak no. 24 Table13 Peak no. 23
Table 8 Peak no.6 Table 9 Peak no.6 Table12 Peak no.6 Table13 Peak no.5
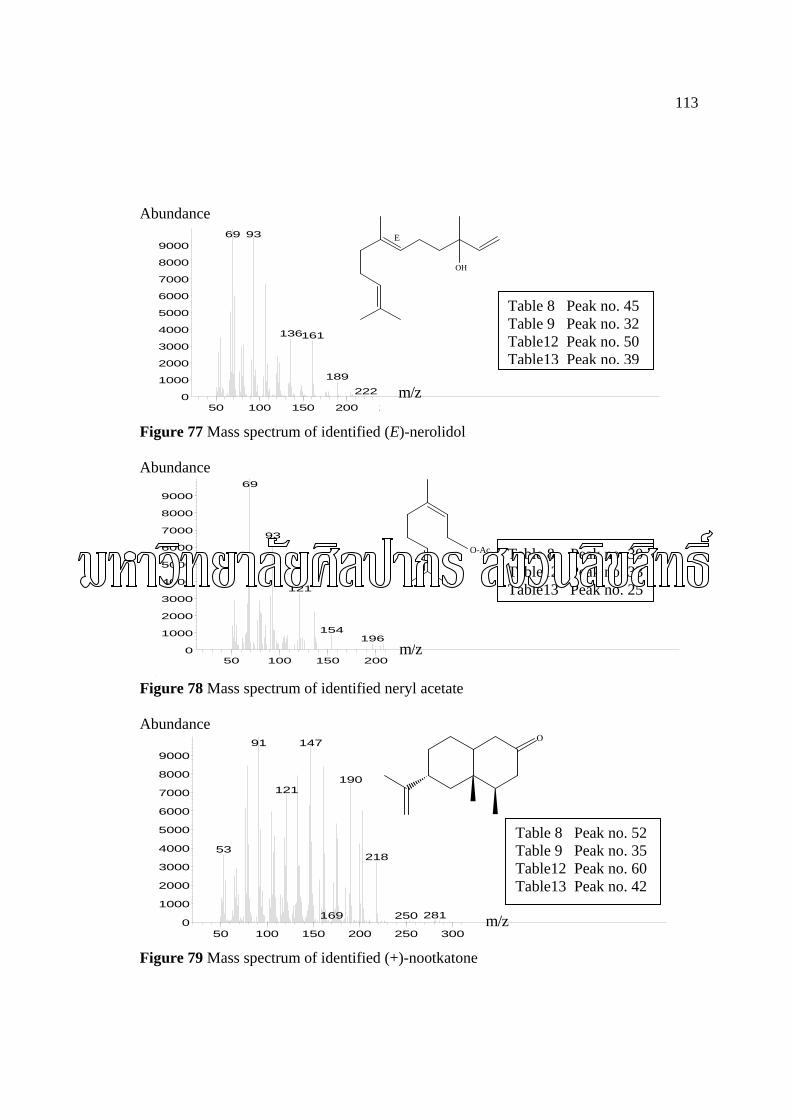
113
50 100 150 200 20
1000
2000
3000
4000
5000
6000
7000
8000
9000
(69 93
136161
189
222
50 100 150 2000
1000
2000
3000
4000
5000
6000
7000
8000
9000
>
(69
93
121
154196
50 100 150 200 250 3000
1000
2000
3000
4000
5000
6000
7000
8000
9000
>
91 147
190121
53218
281169 250
Abundance
Figure 77 Mass spectrum of identified (E)-nerolidol
Abundance
Figure 78 Mass spectrum of identified neryl acetate
Abundance
Figure 79 Mass spectrum of identified (+)-nootkatone
OH
E
O-Ac
O
m/z
m/z
m/z
Table 8 Peak no. 52 Table 9 Peak no. 35 Table12 Peak no. 60 Table13 Peak no. 42
Table 8 Peak no. 30 Table12 Peak no. 33 Table13 Peak no. 25
Table 8 Peak no. 45 Table 9 Peak no. 32 Table12 Peak no. 50 Table13 Peak no. 39
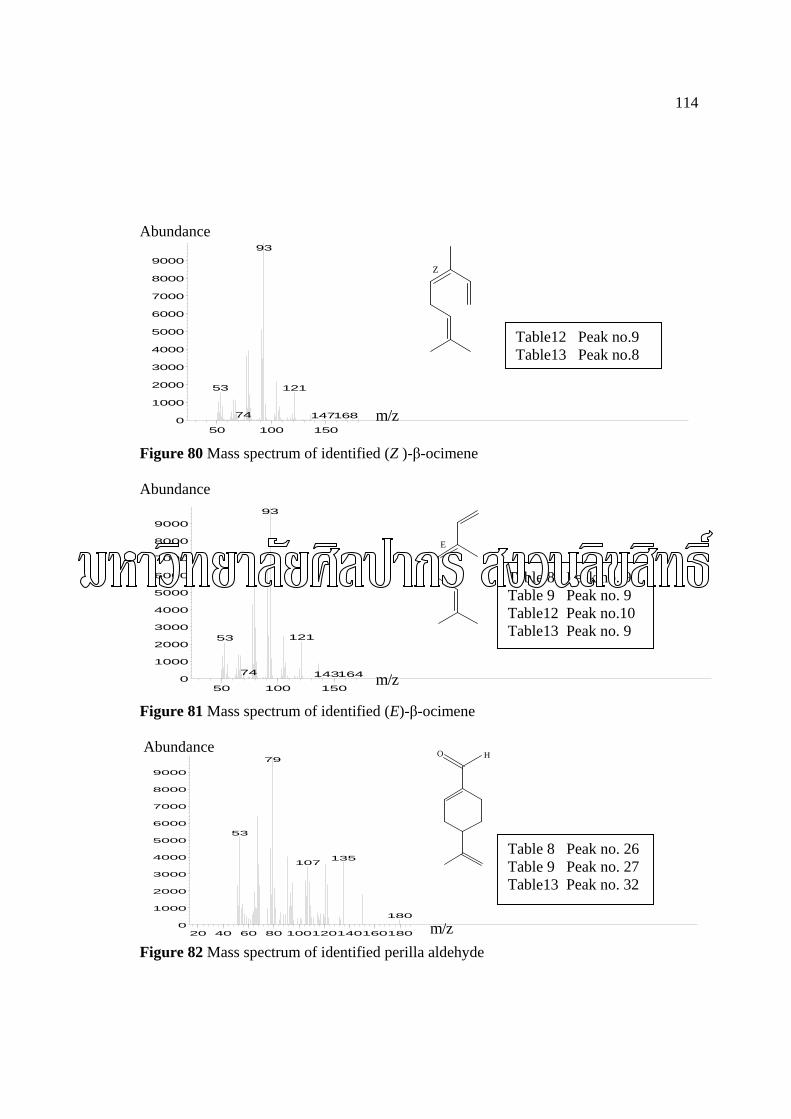
114
50 100 1500
1000
2000
3000
4000
5000
6000
7000
8000
9000
93
53 121
74 147168
50 100 1500
1000
2000
3000
4000
5000
6000
7000
8000
9000
>
93
12153
74 164143
20 40 60 80 1001201401601800
1000
2000
3000
4000
5000
6000
7000
8000
9000
79
53
135107
180
Abundance
Figure 80 Mass spectrum of identified (Z )-β-ocimene
Abundance
Figure 81 Mass spectrum of identified (E)-β-ocimene
Abundance
Figure 82 Mass spectrum of identified perilla aldehyde
Z
E
O H
m/z
m/z
m/z
Table 8 Peak no. 26 Table 9 Peak no. 27 Table13 Peak no. 32
Table 8 Peak no. 9 Table 9 Peak no. 9 Table12 Peak no.10 Table13 Peak no. 9
Table12 Peak no.9 Table13 Peak no.8
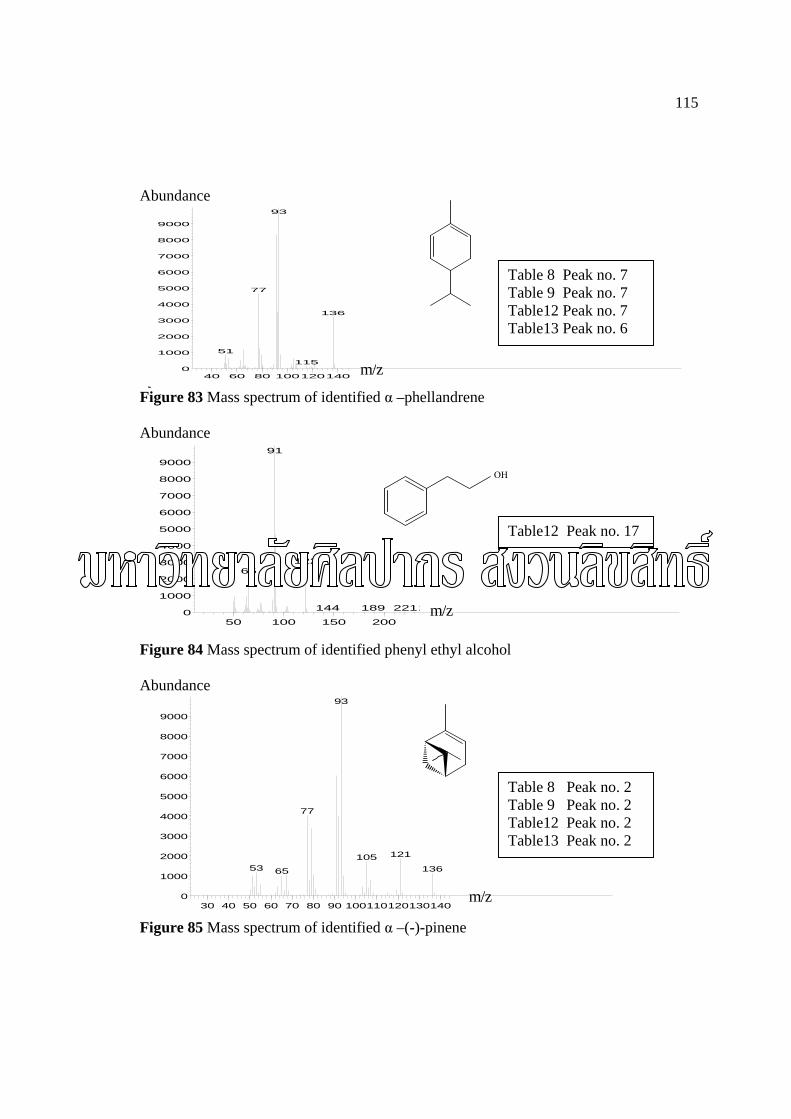
115
40 60 80 1001201400
1000
2000
3000
4000
5000
6000
7000
8000
9000
>
93
77
136
51
115
50 100 150 2000
1000
2000
3000
4000
5000
6000
7000
8000
9000
>
91
12265
144 189 2221
30 40 50 60 70 80 90 1001101201301400
1000
2000
3000
4000
5000
6000
7000
8000
9000
>
93
77
12110553 13665
Abundance
Figure 83 Mass spectrum of identified α –phellandrene Abundance
Figure 84 Mass spectrum of identified phenyl ethyl alcohol Abundance
Figure 85 Mass spectrum of identified α –(-)-pinene
OH
m/z
m/z
m/z
Table 8 Peak no. 2 Table 9 Peak no. 2 Table12 Peak no. 2 Table13 Peak no. 2
Table12 Peak no. 17
Table 8 Peak no. 7 Table 9 Peak no. 7 Table12 Peak no. 7 Table13 Peak no. 6
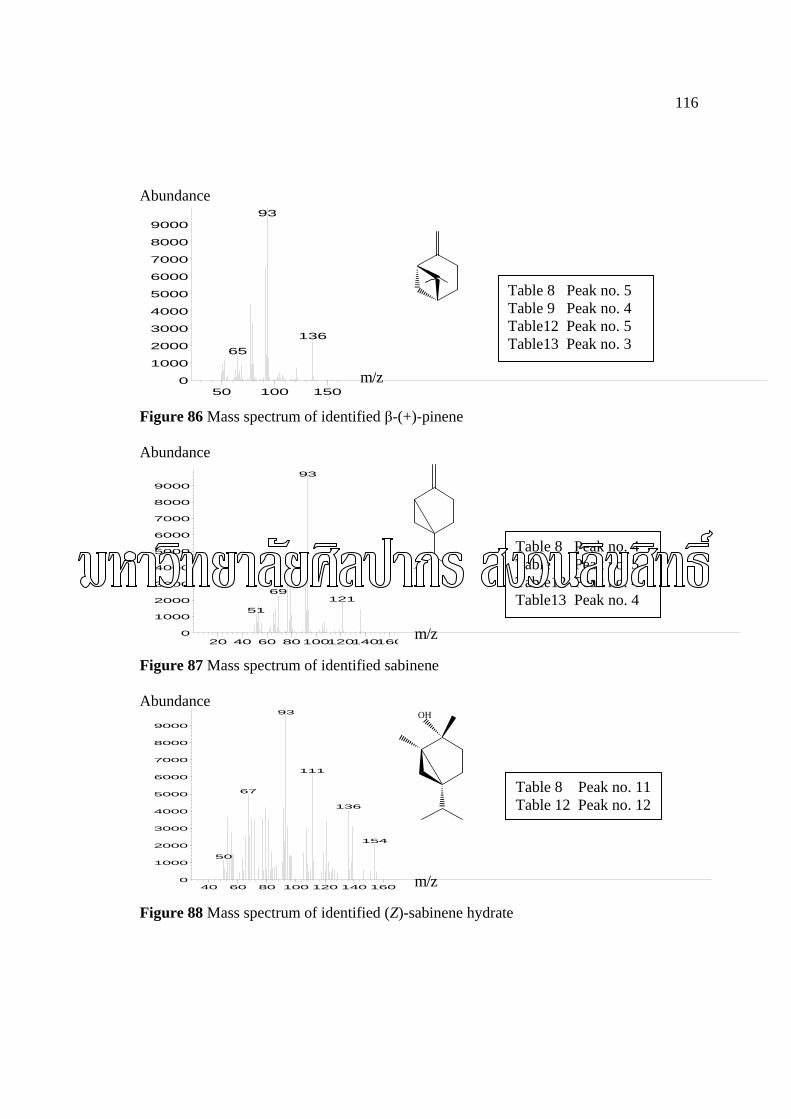
116
50 100 1500
1000
2000
3000
4000
5000
6000
7000
8000
9000
S93
136
65
20 40 60 801001201401600
1000
2000
3000
4000
5000
6000
7000
8000
9000
>
93
69121
51
40 60 80 100 120 140 1600
1000
2000
3000
4000
5000
6000
7000
8000
9000
>
93
111
67
136
154
50
Abundance
Figure 86 Mass spectrum of identified β-(+)-pinene Abundance
Figure 87 Mass spectrum of identified sabinene Abundance
Figure 88 Mass spectrum of identified (Z)-sabinene hydrate
OH
m/z
m/z
m/z
Table 8 Peak no. 11 Table 12 Peak no. 12
Table 8 Peak no. 4 Table 9 Peak no. 5 Table12 Peak no. 4 Table13 Peak no. 4
Table 8 Peak no. 5 Table 9 Peak no. 4 Table12 Peak no. 5 Table13 Peak no. 3
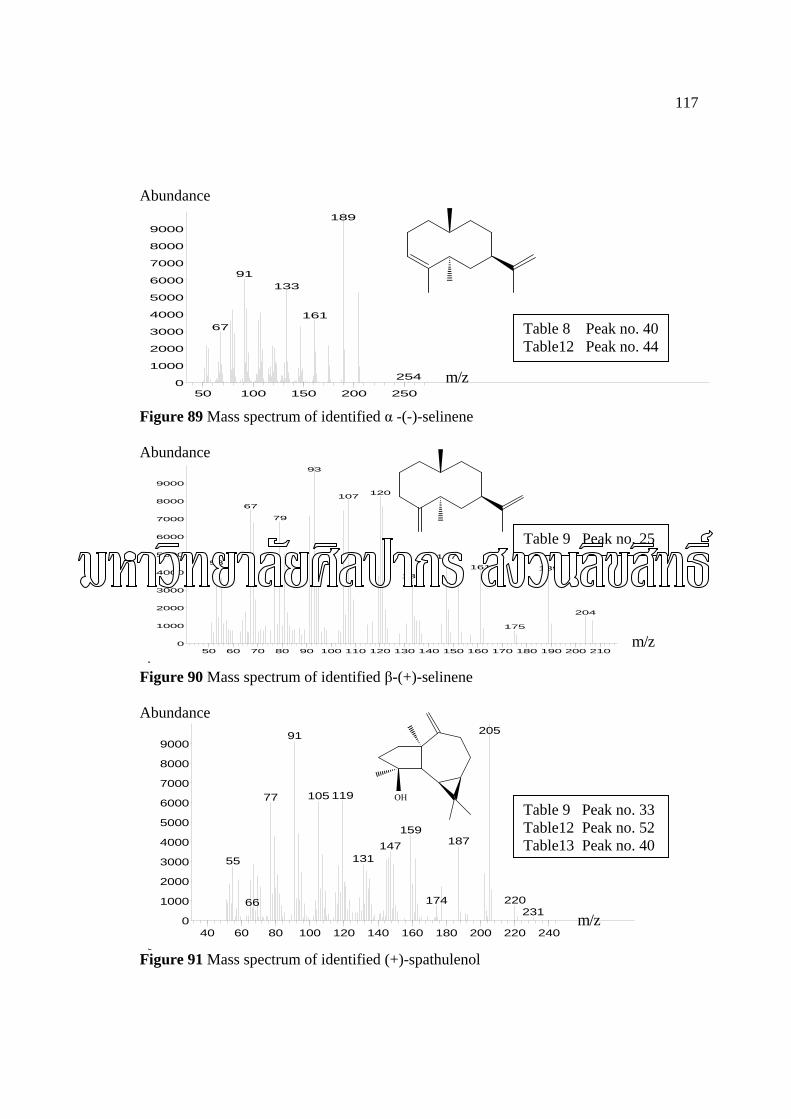
117
50 100 150 200 2500
1000
2000
3000
4000
5000
6000
7000
8000
9000
>
189
91133
16167
254
50 60 70 80 90 100 110 120 130 140 150 160 170 180 190 200 2100
1000
2000
3000
4000
5000
6000
7000
8000
9000
>
( )93
120107
67
79
14753
161 189133
204
175
d
40 60 80 100 120 140 160 180 200 220 2400
1000
2000
3000
4000
5000
6000
7000
8000
9000
>
20591
11910577
159187147
13155
22017466231
Abundance
Figure 89 Mass spectrum of identified α -(-)-selinene Abundance
Figure 90 Mass spectrum of identified β-(+)-selinene Abundance
Figure 91 Mass spectrum of identified (+)-spathulenol
OH
m/z
m/z
m/z
Table 9 Peak no. 33 Table12 Peak no. 52 Table13 Peak no. 40
Table 9 Peak no. 25
Table 8 Peak no. 40 Table12 Peak no. 44
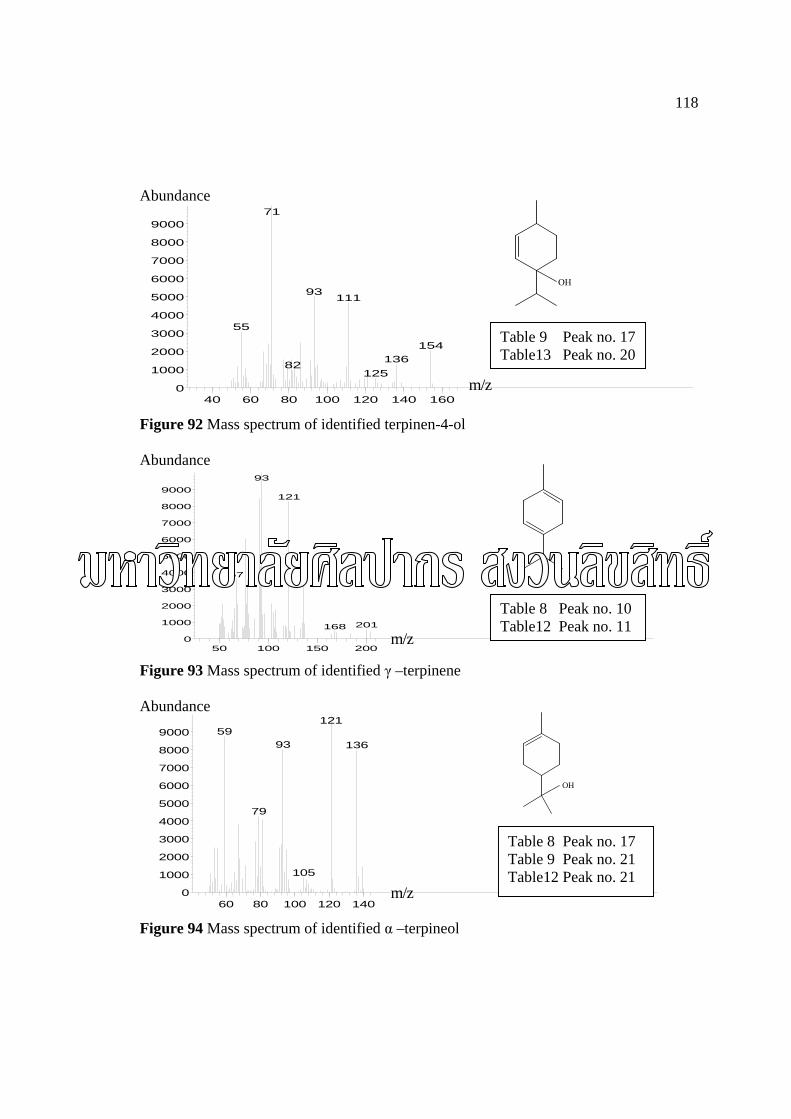
118
40 60 80 100 120 140 1600
1000
2000
3000
4000
5000
6000
7000
8000
9000
(71
93111
55
154136
82125
50 100 150 2000
1000
2000
3000
4000
5000
6000
7000
8000
9000
>
93
121
67
2201168
60 80 100 120 1400
1000
2000
3000
4000
5000
6000
7000
8000
9000121
5993 136
79
105
Abundance
Figure 92 Mass spectrum of identified terpinen-4-ol Abundance
Figure 93 Mass spectrum of identified γ –terpinene Abundance
Figure 94 Mass spectrum of identified α –terpineol
OH
OH
m/z
m/z
m/z
Table 8 Peak no. 17 Table 9 Peak no. 21 Table12 Peak no. 21
Table 8 Peak no. 10 Table12 Peak no. 11
Table 9 Peak no. 17 Table13 Peak no. 20
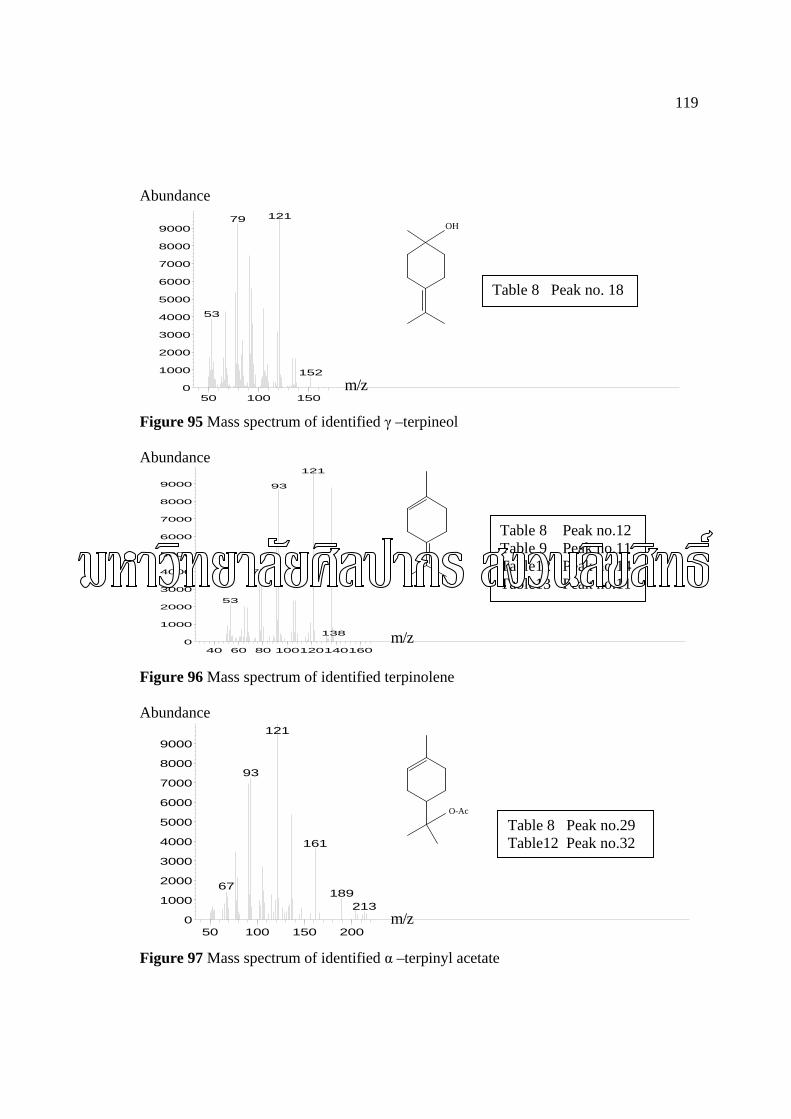
119
50 100 1500
1000
2000
3000
4000
5000
6000
7000
8000
900012179
53
152
40 60 80 1001201401600
1000
2000
3000
4000
5000
6000
7000
8000
9000
121
93
77
53
138
50 100 150 2000
1000
2000
3000
4000
5000
6000
7000
8000
9000121
93
161
67189
213
Abundance
Figure 95 Mass spectrum of identified γ –terpineol Abundance
Figure 96 Mass spectrum of identified terpinolene Abundance
Figure 97 Mass spectrum of identified α –terpinyl acetate
OH
m/z
O-Ac
m/z
m/z
Table 8 Peak no.29 Table12 Peak no.32
Table 8 Peak no.12 Table 9 Peak no.11 Table12 Peak no.14 Table13 Peak no.11
Table 8 Peak no. 18
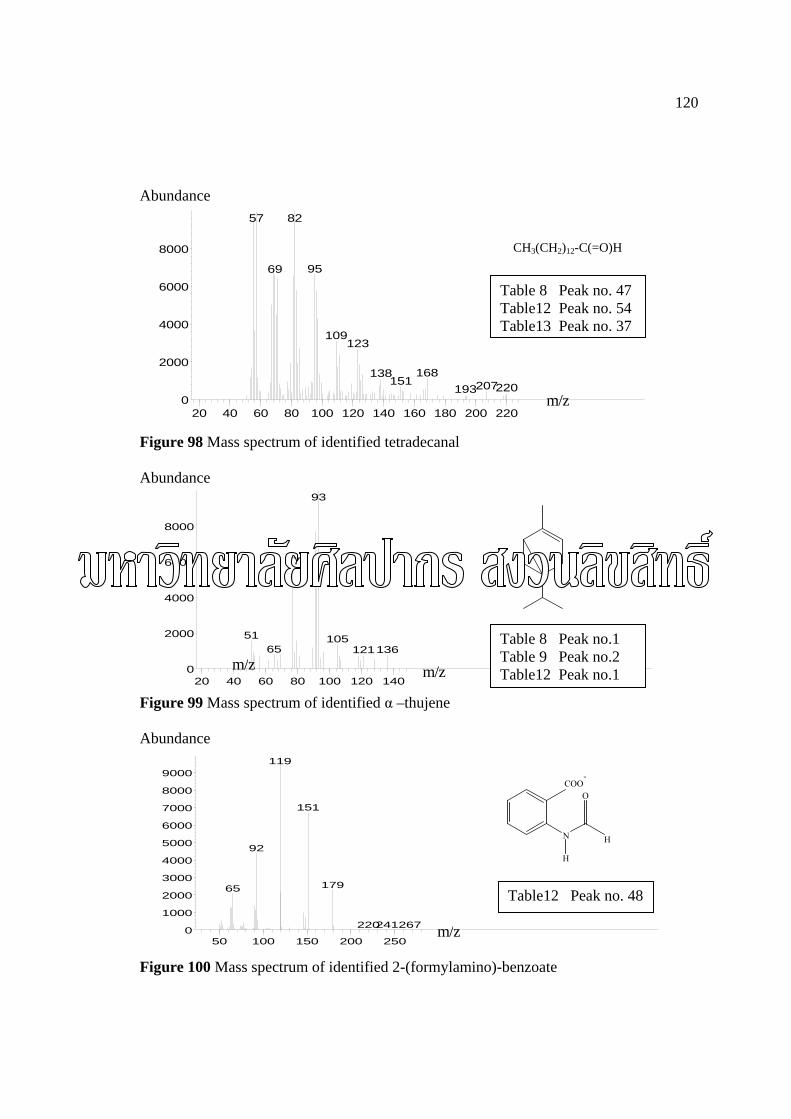
120
20 40 60 80 100 120 140 160 180 200 2200
2000
4000
6000
8000
8257
9569
109123
168138151 207220193
20 40 60 80 100 120 1400
2000
4000
6000
8000
93
77
51 10565 136121
50 100 150 200 2500
1000
2000
3000
4000
5000
6000
7000
8000
9000
>
119
151
92
17965
241267220
Abundance
CH3(CH2)12-C(=O)H
Figure 98 Mass spectrum of identified tetradecanal Abundance
Figure 99 Mass spectrum of identified α –thujene Abundance
Figure 100 Mass spectrum of identified 2-(formylamino)-benzoate
m/z
NH
H
OCOO-
m/z
m/z
m/z
Table12 Peak no. 48
Table 8 Peak no.1 Table 9 Peak no.2 Table12 Peak no.1
Table 8 Peak no. 47 Table12 Peak no. 54 Table13 Peak no. 37
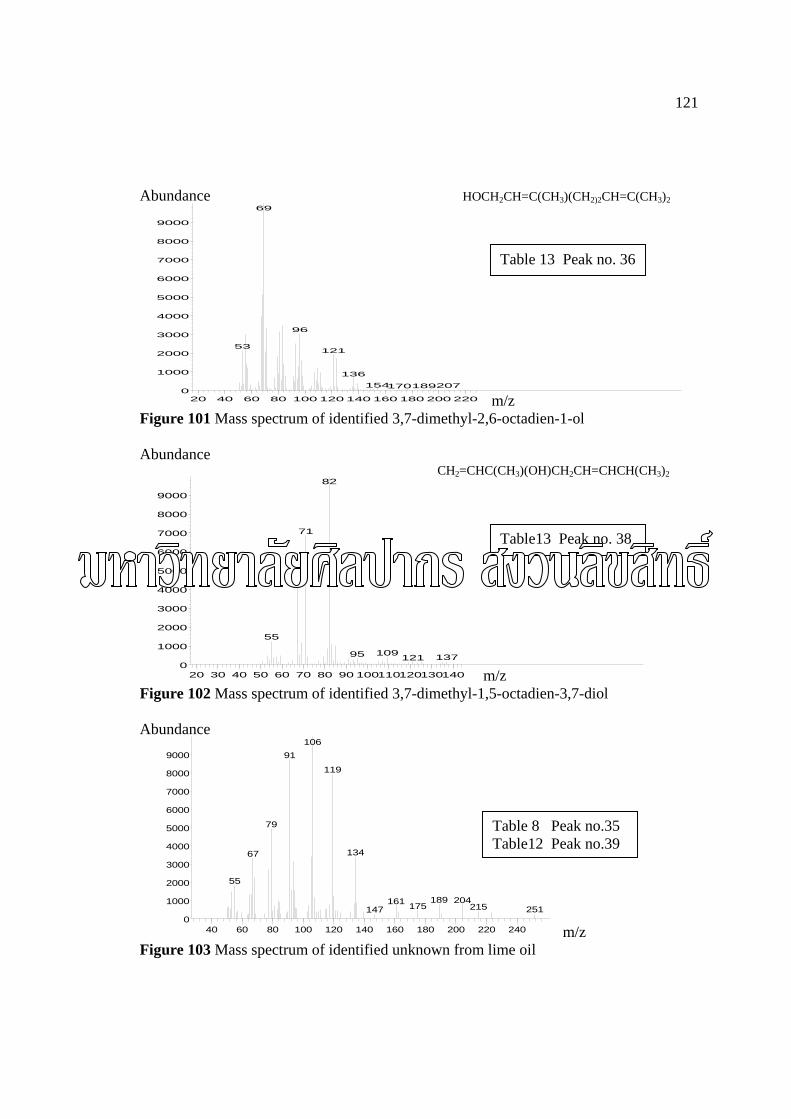
121
Abundance HOCH2CH=C(CH3)(CH2)2CH=C(CH3)2
20 40 60 80 100 120 140 160 180 200 2200
1000
2000
3000
4000
5000
6000
7000
8000
9000
69
96
53121
136
154 207189170
m/z Figure 101 Mass spectrum of identified 3,7-dimethyl-2,6-octadien-1-ol Abundance CH2=CHC(CH3)(OH)CH2CH=CHCH(CH3)2
20 30 40 50 60 70 80 90 1001101201301400
1000
2000
3000
4000
5000
6000
7000
8000
9000
82
71
55
10995 137121
m/z Figure 102 Mass spectrum of identified 3,7-dimethyl-1,5-octadien-3,7-diol Abundance
40 60 80 100 120 140 160 180 200 220 2400
1000
2000
3000
4000
5000
6000
7000
8000
9000
106
91
119
79
13467
55
189 204161 175 215 251147
m/z Figure 103 Mass spectrum of identified unknown from lime oil
Table13 Peak no. 38
Table 8 Peak no.35 Table12 Peak no.39
Table 13 Peak no. 36
122
VITA
NAME: Mrs. Napaporn Thavanapong
DATE OF BIRTH: 25 April 1972
PLACE OF BIRTH: Chaiang mai, Thailand
EDUCATION:
(1995) Bachelor of Pharmacy, Chiang mai University
WORK:
(1996-1998) Pharmacist, Samut-Sakhon Hospital, Samut-Sakhon Provice,
Thailand
(1998-1999) Pharmacist, Bangkok Christian-Nakhon Pathom Hospital,
Nakhon Pathom Provice, Thailand
(1999-2005) Pharmacist, Drug store, Samut-Sakhon Provice,
Thailand
HOME ADDRESS: 207/7 Dermbang Rd. Mahachai, Maung, Samut-Sakhon,
Thailand


