[ 375 ]
X. The Excitatory Process in the Dog’s Heart* P a rt I .— The Auricles.By Thomas L e w is , J ohn M e a k in s , and P a u l D. W h it e .
Communicated by Prof. E. H. S t a r l in g ,
(Received June 17,—Read June 25, 1914.)
(From the Cardiographic Department, University College Hospital Medical School, London.)
[P lates 40-43.]
The experiments, of which this paper is a report, were undertaken with the object of establishing more fully the point of origin of the contraction wave in the mammalian heart, and of unravelling the course which this contraction wave follows in the auricles. As the history of this subject has been summed up but recently by one of us (10), we do not propose to consider it in detail at present.
In studying the heart from these points of view, we have adopted the electrical method as being the most accurate at our command, and have investigated the wave of excitation which, though it actually precedes the wave of contraction, is closely associated with the latter. We deal, therefore, with the origin and propagation of the excitatory process in the heart, accepting the information which we so gather as an index of the origin and course of the contraction wave.
Gene ralMe th od.We employ dogs, ranging in weight from 8 to 14 kgrm. for the most part. The
animals are fully anaesthetised with morphia, paraldehyde, and ether. Both vagi are cut in the neck in all experiments. The heart is exposed by splitting the sternum and the ribs are held back on either side by tying them to the table, the animal being ventilated artificially meanwhile, and for the rest of the experiment. The dog lies, turned on its left side, in a constant position throughout. The pericardium is opened and stitched to the chest wall, and it is so arranged that the right auricle in its superficial parts lies fully exposed.
Recording Instrument.—As meter for the currents we employ the Einthoven string galvanometer as it is supplied by the Cambridge Scientific Instrument Company. This instrument is fitted with a special string carrier ; two fibres lie in the same magnetic held, side by side, at about half a millimetre distance, and the images are projected by a single series of lenses and are finally converged by prisms. The single beam of
* The expenses of these observations have been in part defrayed by grants from the Royal Society and Graham Research Funds.
(322.) [P u b lish ed separately, October 16, 1914.
on May 31, 2018http://rstb.royalsocietypublishing.org/Downloaded from
376 MESSRS. T. LEWIS, J. ME AKINS, AND P. D. WHITE ON THE
light, after passing through the galvanometer, is cut by a rotatory time-marker, governed by a tuning-fork which vibrates 50 times per second. The wheel of the time-marker rotates five times joer second and, according as it carries one or five spokes, it records 1/5 or 1/25 of a second, by ruling lines upon the moving plate as it travels. The spoke runs into the light from above downwards, and as the slit in the camera is horizontal, each line written photographically in this manner cuts across the images of the two strings, and gives an accurate record of a given instant in time across the whole plate. Thus our apparatus permits us to obtain simultaneous electrocardiograms and to examine the relation of any point in the one to any point in the other in a very precise fashion.
We pay attention to the qualities of our recording instrument in respect of the quickness of its response and the character of the deflection,# using fibres which give us very small deflection times and no over-riding, or no appreciable over-riding, in closed circuits of 15-25,000 ohms resistance. We also repeatedly test our fibres so as to be certain that their movements are absolutely independent, the one having no influence on the other; such influence we have never found.
Electrodes.—Of electrodes we employ two sets. In a great many of our observations we use a lead from the right shoulder to the left groin as a standard signal, and for this purpose we sew small copper discs beneath the skin. These electrodes polarise at first, but lose their polarisation early in the experiment; any polarisation current or current from the injured tissues is compensated, and the corresponding string is maintained at the zero; its sensitivity is maintained at such a point that 3 millivolts introduced into the circuit yield 3 cm. excursion. For direct examination of the heart we use non-polarisable electrodes, glass tubes containing salted kaolin and copper sulphate with bright copper rods. Our standard in direct heart leads is usually an excursion of 1 cm. at the introduction of 3 millivolts into circuit. The resistance of the electrodes and tissue varies in different experiments from 10,000 to 20,000 ohms; the resistance of the recording fibre and remainder of the circuit is approximately 5000 ohms. Our electrodes vary somewhat in pattern; for the exposed wall of the auricle the glass tube is continued into rubber, and small threads projecting a little from the latter and moistened with kaolin paste form the actual contact. For deeply seated structures, such as the left appendix, pulmonary veins, and septum of the auricles, we have employed specially constructed electrodes of twin glass tubing, shaped to follow the curves of the heart ; the contacts of these electrodes face in the desired direction. Rubber contacts in a double electrode lie 8 mm. apart; in the simple glass electrodes used over fixed points the distance is 5 mm. t *
* We have specially tested our recorder with a view to ascertaining whether the position of a given oscillation is altered by another oscillation immediately preceding it, but can detect no such alteration when the two oscillations are 0 ‘01 second or even less apart.
t Our reasons for employing twin contacts upon the investigated area will be apparent from our subsequent observations.
on May 31, 2018http://rstb.royalsocietypublishing.org/Downloaded from
EXCITATORY PROCESS IN THE DOG’S HEART. 3 77
In applying certain of these electrodes it becomes necessary to interfere temporarily with the position of the heart ; the application of such electrodes is left till the last stages of the experiment. The right pulmonary veins lie exposed in our dissection ; the left pulmonary veins are deeply seated ; we reach them around the right margin of the heart as it lies on its left side ; the appendices require fixation ; a stitch is passed through the extreme apex, and the appendix is fastened to the left chest wall ; the contacts are placed on the outer surface of the right or the inner or outer surface of the left, well away from the stitch. That the electrodes remain in place after fixation upon a deep contact is recognised with but little practice by inspection of the moving string and by the uniformity of the records obtained eventually the position and line of contact is confirmed as observation upon the particular point ends.
Tor septal leads we introduce an electrode with two contacts in line with the shaft through the right jugular vein. This lead when employed is always the last taken in the experiment.
Orientation.—The situations of contacts are noted during the experiment by measurements to fixed points, the measurements being charted upon an outline drawing. Eventually the heart is fixed in a position of diastolet and preserved for subsequent examination. The leads which require special attention for purposes of orientation are those along the sulcus and tamia The angle formed by theright appendix with the superior cava, the auricular branch of the right coronary artery, and its branches are often to be used as points which may be recognised with ease at later stages. A curious fusion of the auricular muscle bands near the upper end of the sulcus, which we describe later as the “ concentration ’’ point, also serves as a useful landmark (Plate 40, fig. 8). On the cavse the pericardial insertions or the junctions with auricular muscle are useful guides. In a very few instances where we feel uncertain of subsequently identifying our contact points we mark the endocardium, but this is avoided, as are all injuries of the heart, whenever possible. The septal contact is marked by feeling the end of the electrode through the auricular wall immediately after the curve is taken, and thrusting a long needle through the wall of the auricle and through the septum immediately beneath the electrode; this procedure terminates the corresponding experiment. So far, therefore, as the right auricle is concerned, we are left at the end of the experiment with a diagram constructed to scale and the heart itself. The auricular portion of this heart, after the whole has been hardened and dehydrated, is detached and carried en masse into paraffin. When saturated it is removed from the paraffin and allowed to cool. This impregnated auricle is then compared with the original scale drawing, and a new drawing to scale is made upon which the chief muscle bands of the chamber are
* Jumping of the contacts or of a contact is easily recognised.f Fixed with an internal distending pressure of 30 cm. of 10 per cent, formalin, the heart returns to
about its original size in the subsequent treatment.V O L . C C V .-----B . 3 B
on May 31, 2018http://rstb.royalsocietypublishing.org/Downloaded from
378 MESSRS. T. LEWIS, J. ME AKINS, AND P. D. WHITE ON THE
sketched, and also the original measured points.# Small blocks of' tissue are then cut from the sulcus with a razor after warming the impregnated tissue, each one as it is removed being accurately measured and charted. In this fashion we obtain from five to seven pieces of tissue, each containing about 3 mm. of the sulcus and having known relations to muscle bands and contacts. Each is separately imbedded and cut in serial sections from above downwards transversely to the sulcus. The sections are examined for the sino-auricular node, and this is charted on the original diagrams, a few of which, being of special interest, we publish (figs. 8, 21).
Measurements of Curves.—Our measurements of curves are made exclusively with the Lucas comparator. In the present work the majority of measurements have been taken from points on the electrocardiograms obtained from Lead Wehave used this lead as standard in preference to a direct heart lead because it remains constant, and is not subject to accidental shifting during the course of the experiment. It has been essential, consequently, to maintain the heart in a given position. The times at which deflections occur in direct auricular leads are ascertained relative to the upstroke of P, the auricular summit. P at its onset is often ill-defined, and if used unchecked introduces errors into the measurements.
We therefore ascertain the onset in the earliest curves and find its distance from the summit of P, or any constant, distinct, and sharp notch upon P, and use these checks throughout the remaining plates. In the majority of our experiments this has provided an almost perfect standard, rendering our measurements extremely constant, so that if we return to the same observations, after an interval, and measure the time between P and deflections from a given point of the auricular surface, the change is usually less than one or two thousandths of a second ; moreover, when the change is appreciably above our error, we can generally attribute it to slightly different position of the replaced contacts.
In some experiments small variations in the shape of P occur during the course of observations and these have proved bothersome in some cases, necessitating numerous checks. Change in the shape of P unquestionably forms a chief source of error ; we avoid it largely by making a given batch of observations in quick succession. Deflections in direct leads are almost always quite sharp and form admirable points upon which to fix the cross wires; the error here is always below 0‘0015 second and is often to be estimated at a few ten thousandths. After detailed consideration of possible sources of error, i.e. irregularities of plate travel, time-marker, point fixation, etc.,f we conclude our absolute and maximal error may be 0*002 second 4
* In the latest experiments we have found it easier to make the second diagram in the xylol stage, as the hands of muscle are then more readily discerned. There has been no shrinkage of our auricles in paraffin.
T The plate travel is so smooth over short distances as to introduce no measurable error; the time- marker read against a tuning-fork gives a maximal error of 0 • 0005 second for 0 • 04 second; our maximal error in measuring tuning-fork vibrations (50 per second) has been 0 • 0005 second.
I Independent measurements of the same plates give a range of error well within this limit (see Table VIII).
on May 31, 2018http://rstb.royalsocietypublishing.org/Downloaded from
EXCITATORY PROCESS IN THE DOG’S HEART. 379
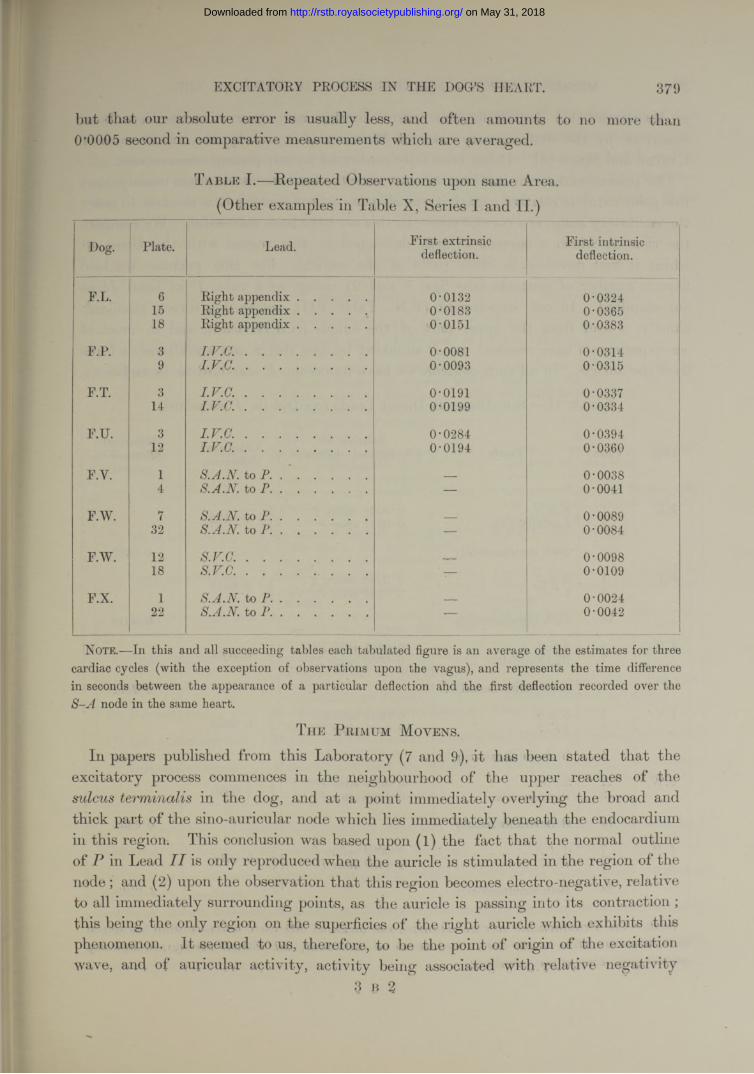
but that our absolute error is usually less, and often amounts to no more than 0*0005 second in comparative measurements which are averaged.
T able I.— Repeated Observations upon same Area. (Other examples in Table X, Series I and II.)
Dog. Plate. Lead. First extrinsic deflection.
First intrinsic deflection.
F.L. 6 Right appendix . . . . . 0-0132 0-032415 Right appendix ..................... 0-0183 0-036518 Right appendix ..................... 0-0151 0-0383
F.P. 3 I.V.C..................................... 0-0081 0-03149 L V .C . .................................... 0-0093 0-0315
F.T. 3 I .V .C . .................................... 0-0191 0-033714 I.V.C..................................... 0-0199 0-0334
F.U. 3 I.V.C..................................... 0-0284 0-039412 I .V .C . .................................... 0-0194 0-0360
F.Y. 1 S.A.N.to P. .*..... __ 0-00384 S.A.N. to P.............. — 0-0041
F.W. 7 S.A.N. to P.............. _ 0-008932 S.A.N.to P............... — 0-0084
F.W. 12 S.V.C..................................... _ 0-009818 S.V.C........................................ — 0-0109
F.X. 1 S.A.N. to P ............................. _ 0-002422 S.A.N. to P.............. — 0-0042
Note.—In this and all succeeding tables each tabulated figure is an average of the estimates for three cardiac cycles (with the exception of observations upon the vagus), and represents the time difference in seconds between the appearance of a particular deflection and the first deflection recorded over the S -A node in the same heart.
T h e P bim um M ovens.
In papers published from this Laboratory (7 and 9), it has been stated that the excitatory process commences in the neighbourhood of the upper reaches of the sulcus terminalis in the dog, and at a point immediately overlying the broad and thick part of the sino-auricular node which lies immediately beneath the endocardium in this region. This conclusion was based upon (l) the fact that the normal outline of P in Lead IIis only reproduced when the auricle is stimulated in the region of the node; and (2) upon the observation that this region becomes electro-negative, relative to all immediately surrounding points, as the auricle is passing into its contraction ; this being the only region on the superficies of the right auricle which exhibits this phenomenon. I t seemed to us, therefore, to be the point of origin of the excitation wave, and of auricular activity, activity being associated with relative negativity
3 B %
on May 31, 2018http://rstb.royalsocietypublishing.org/Downloaded from
380 MESSES. T. LEWIS, J. MEAKINS, AND P. D. WHITE ON THE
as M archand (11) showed for the heart. In this last observation we have been confirmed by the contemporary work of W y b a u w (14), and by the recent work of E yster and M eek (3). It has been fully confirmed by our present observations.
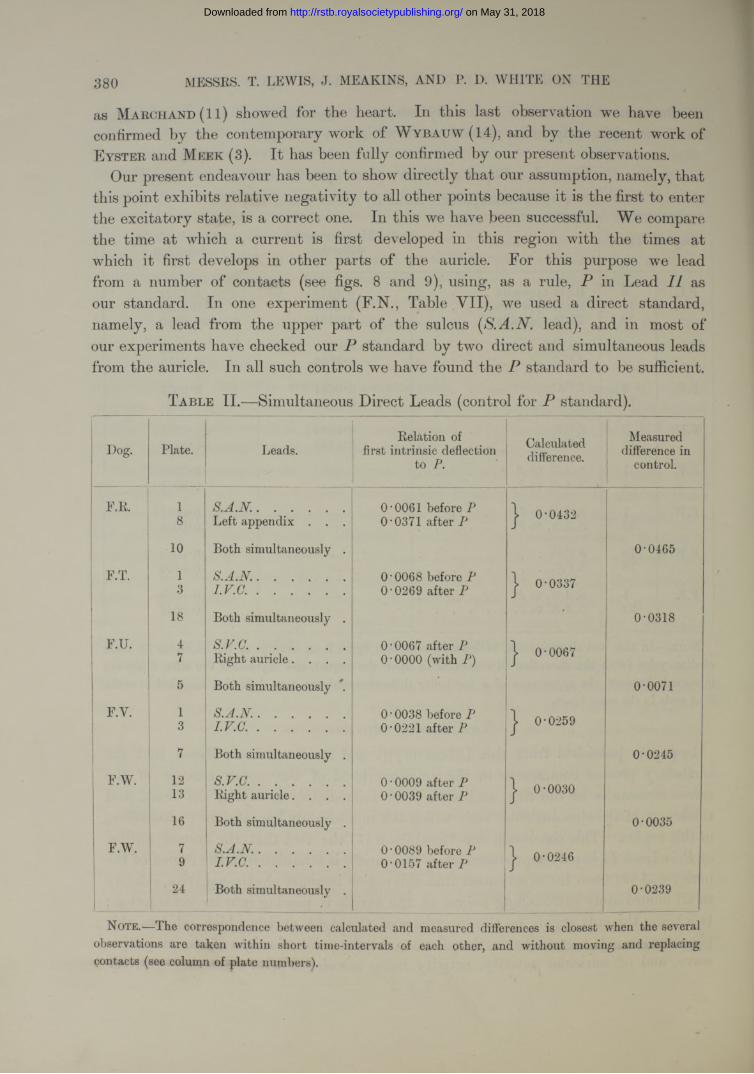
Our present endeavour has been to show directly that our assumption, namely, that this point exhibits relative negativity to all other points because it is the first to enter the excitatory state, is a correct one. In this we have been successful. We compare the time at which a current is first developed in this region with the times at which it first develops in other parts of the auricle. For this purpose we lead from a number of contacts (see figs. 8 and 9), using, as a rule, in Lead II as our standard. In one experiment (F.N., Table VII), we used a direct standard, namely, a lead from the upper part of the sulcus [S.A.N. lead), and in most of our experiments have checked our P standard by two direct and simultaneous leads from the auricle. In all such controls we have found the P standard to be sufficient.
T a ble II.—Simultaneous Direct Leads (control for P standard).
Dog. Plate. Leads.Eelation of
first intrinsic deflection to
Calculateddifference.
Measured difference in
control.
F.E. 1 S .A .N ........................... 0 ‘0061 before P | 0-04328 Left appendix . . . O '0371 after P
10 Both simultaneously . 0-0465
F.T. 1 S .A .N ........................... 0 ‘0068 before P COCOo©
3 I .V .C . .......................... O’0269 after P
18 Both simultaneously . • 0-0318
F.U. 4 s .v .a .......................... O’0067 after P J 0-00677 Eight auricle. . . . 0 • 0000 (with P)
5 Both simultaneously 0-0071
F.Y. 1 S .A .N ........................... 0*0038 before P | 0-02593 I .V .C . .......................... O’0221 after P
7 Both simultaneously . 0-0245
F.W. 12 s.v.c............................. 0 • 0009 after P J 0-0030S 13 Eight auricle. . . . 0 • 0039 after P
16 Both simultaneously . 0-0035
F.W. 7 ! S .A .N ........................... O’0089 before P j 0-02469 I .V .C . .......................... 0-0157 after P
24 Both simultaneously . 0-0239
Note.—rlhe correspondence between calculated and measured differences is closest when the several observations are taken within short time-intervals of each other, and without moving and replacing contacts (see column of plate numbers).
on May 31, 2018http://rstb.royalsocietypublishing.org/Downloaded from
EXCITATORY PROCESS IN THE DOG’S HEART. 381
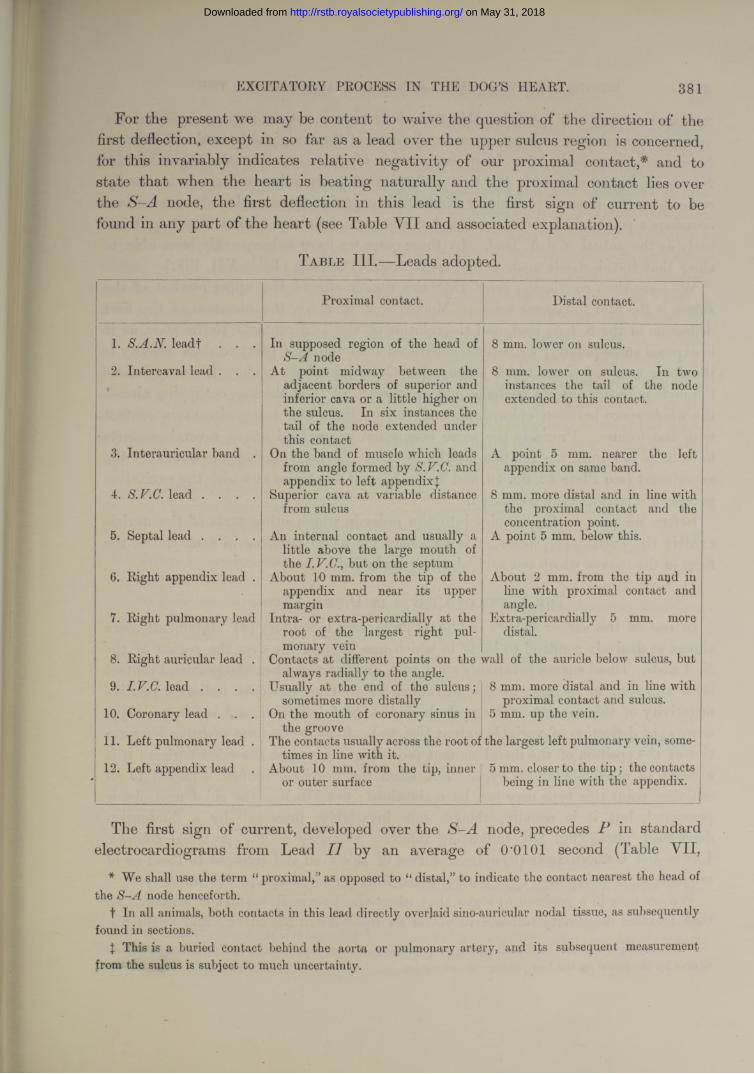
For the present we may be content to waive the question of the direction of the first deflection, except in so far as a lead over the upper sulcus region is concerned, for this invariably indicates relative negativity of our proximal contact,* * and to state that when the heart is beating naturally and the proximal contact lies over the S-A node, the first deflection in this lead is the first sign of current to be found in any part of the heart (see Table Y II and associated explanation).
T a b l e III .—Leads adopted.
Proximal contact. Distal contact.
1. S.A .N .leadf
2. Intercaval lead
3. Interauricular band .
4. S.F.C. lead . . . .
5. Septal lead . . . .
6. Right appendix lead .
7. Right pulmonary lead
8. Right auricular lead .
9. I.V.C. lead . . . .
10. Coronary lead . . .
11. Left pulmonary lead .
12. Left appendix lead
In supposed region of the head of S -A node
At point midway between the adjacent borders of superior and inferior cava or a little higher on the sulcus. In six instances the tail of the node extended under this contact
On the band of muscle which leads from angle formed by S.F.C. and appendix to left appendixJ
Superior cava at variable distance from sulcus
8 mm. lower on sulcus.
8 mm. lower on sulcus. In two instances the tail of the node extended to this contact.
A point 5 mm. nearer the left appendix on same band.
8 mm. more distal and in the proximal contact concentration point.
A point 5 mm. below this.
line with and the
An internal contact and usually a little above the large mouth of the I.F.C., but on the septum
About 10 mm. from the tip of the appendix and near its upper margin
Intra- or extra-pericardially at the root of the largest right pulmonary vein
Contacts at different points on the wall of the auricle below sulcus, but always radially to the angle.
About 2 mm. from the tip aqd in line with proximal contact and angle.
Extra-pericardially 5 mm. more distal.
Usually at the end of the sulcus;sometimes more distally
On the mouth of coronary sinus in the groove
The contacts usually across the root of the largest left pulmonary vein, some-
8 mm. more distal and in line with proximal contact and sulcus.
5 mm. up the vein.
times in line with it.About 10 mm. from the tip, inner
or outer surface5 mm. closer to the tip ; the contacts
being in line with the appendix.
The first sign of current, developed over the S-A node, precedes P in standard electrocardiograms from Lead I I by an average of O'OIOI second (Table VII,
* We shall use the term “ proximal,” as opposed to “ distal,” to indicate the contact nearest the head of the S -A node henceforth.
t In all animals, both contacts in this lead directly overlaid sino-auricular nodal tissue, as subsequently found in sections.
\ This is a buried contact behind the aorta or pulmonary artery, aiid its subsequent measurement from the sulcus is subject to much uncertainty.
on May 31, 2018http://rstb.royalsocietypublishing.org/Downloaded from
382 MESSRS. T. LEWIS, -T. MEAKINS, AND P. D. WHITE ON THE
20 experiments). It precedes the first deflection in other regions by intervals varying approximately according to the distance of these regions from the S-A node. Numerous cross leads have been used, many of them covering the region of the S-A node, but in no lead is the first deflection so early unless one contact actually comes into the immediate vicinity of the sulcus at its upper end. On one or two occasions a point a little off the sulcus has shown a deflection almost if not quite as early as the actual S.A.lV. lead. In these cases we have subsequently been able to show that the electrode made actual contact with the node (Table VII, F.F.).
We have then convincing proof that the region around the upper reaches of the sulcus is the first to become active. Moreover, if we study the direction of the first deflection in the S.A.N. lead, and the relation of the two contacts to the node, as it is exposed subsequently, we become convinced that the first point to show activity is the dense mass of tissue which constitutes the head of the node. In many hearts the node is broader at its cephalic end, in almost all it is thicker, occupying almost the whole space between epicardium and endocardium, and being always in contact with the former. Precisely the same conclusion is justified where several contacts have been in immediate relation to the head of the node during the course of the experiment (see Plate 42, fig. 16, and Table X), and the times at which the excitation process are recorded are compared.
Before we pass to the inquiry into the order in which other parts of the auricle exhibit the excitatory process, it is necessary for us to consider in some detail the form of the curves which our several direct leads yield.
T h e F orms of C u rv es in D irect L ea d s .
In one of the earlier papers published from this laboratory (9), statements were almost exclusively confined to leads in which one contact lay over the region of the S-A node. These curves invariably start with an upstroke when the proximal contact is so arranged in relation to the galvanometer that an upstroke indicates relative negativity of this contact. The upstroke is the chief deflection, and is followed by a downward deflection of variable extent (fig. 9a). Such is the form of curve irrespective of the position of the distal contact providing it lies upon the right auricle ; it is a curve of relatively simple type. But when the proximal contact is moved to an outlying point this type may not be maintained ; nevertheless the chief upstroke is preserved, but it is usually, though not invariably, preceded by a diminutive downward phase (fig. 9b), indicating relative positivity of the proximal contact. L e w is and O p p e n h e im e r (9) noticed curves of this kind and referred to them as of triphasic or of polyphasic type but refrained from commenting upon them.
We are now in a position to state that when the proximal contact is arranged so that relative negativity beneath it yields an upstroke in the curve, * and when the
* This arrangement has been maintained in practically all our experiments, and is indicated in our figures by the arrow on the line joining contact circles,
on May 31, 2018http://rstb.royalsocietypublishing.org/Downloaded from
e x c it a t o r y p r o c e s s in t h e Ho g 's h e a r t . 383
pair of electrodes is arranged radially to the S-A node, the chief deflection, by which we mean the first prominent and sharp deflection, is always upright in the curve ‘ that is to say, at the time when this chief deflection is recorded, the proximal contact is always negative relative to the distal one ; and this statement is true however far the contacts lie from the sulcus. The prominence of this chief deflection and its uniform direction aroused our curiosity and suggested further experiment. We have, we think, clear evidence that it is this deflection which indicates the arrival of the excitatory process at the point investigated. That the excitatory process in the auricle is first signalled by relative negativity of the tissue in which it first appears, is proved, if proof is still required, by the fact that leads from the region which first shows electrical disturbance, i.e. the region of the S-A node, invariably shows initial negativity. The excitatory process is accompanied by a considerable discharge, as shown by the amplitude (l'5-6 millivolts) of the chief excursion in the same leads.* A similar discharge is to be anticipated when the excitatory process reaches outside leads. Now the only deflection which, read as an expression of voltage,f is comparable in outlying leads to that of S.A.N. leads is the chief deflection. Its amplitude and sharpness give first hints of its origin.
S.A.N. Lead in 17 Animals—(a) Prominent upward spike followed by short downward phase in 11 instances (fig. 9a).
(b) Prominent upward spike followed by almost equally prominent downward phase in 5 instances.(c) Prominent upward deflection followed by several diminutive deflections in 1 instance.Voltage for first spike 3’0 and 5T millivolts. I
Intercaval Lead—(a) Diminutive downward deflection, prominent spike and short subsequent downward deflection in
5 instances.(b) The same, but the second downward deflection prominent, 7 instances.
(c) Prominent spike and prominent downward deflection, 5 instances.(d) Upward spike, followed by several deflections, 1 instance.
Voltage of chief deflections, 2’4 and 5*4 millivolts.I.V.C. Lead—
(a) Small downward deflection, prominent spike, followed by small downward deflection, in 15 instances (fig. 9b).
(b) Two anomalous curves.Voltage of chief deflections 4‘8 and 5‘1 millivolts.
Coronary Lead.—The usual type is similar to that of the I.V.C. lead (fig. 1 Ob).S.V.C. Lead.—The usual types are those described under (a), (b), and (c) of intercaval lead. Voltage of
chief deflections, 2‘4 and 5T millivolts.
* As we can show, this amplitude is not the full amplitude, because commencing negativity at the second contact produces a premature culmination of the curve.
t Inasmuch as we maintain 15,000-25,000 ohms of resistance in our circuit, the curves may evidently be read in terms of voltage. It is a matter of convenience to use this measure rather than that of current, for by so doing we rid our expression of the variable factor, resistance.
{ We give the voltages in two representative experiments.
on May 31, 2018http://rstb.royalsocietypublishing.org/Downloaded from
384 MESSRS. T. LEWIS, J. ME A KINS, AND P. D. WHITE ON THE
Right Auricular Lead.—Variable with site. Chief deflection upright. Voltage of chief deflections, 4*2 and 15*6 millivolts.
Right Appendix Lead.—Gave, with considerable uniformity, a small downward deflection, a tall spike, and a small or moderate depression. Voltage of chief deflections, 4*2 and 9‘3 millivolts.
Band Lead.—Variable. Chief deflection upright.Septum.— Usual type, a rather deep initial deflection (fig. 9c), a tall spike, followed by prominent
downward deflection. Voltage of chief deflections, 3'6 and 4‘2 millivolts.Right Pulmonary, Left Pulmonary, and Left Appendix Leads.—Chief deflection upright (fig. 10, a and c).
Variable types.
Evidently, in leading from the heart directly, the contacts may receive currents from two sources. They may receive currents from the muscle immediately beneath them when it passes into the excitatory condition; they may also receive currents from muscle lying at some little distance. The currents from these two sources must be regarded separately, and, if possible, the effects which they produce in the records must be recognised. We have already suggested tha t the prominent spike in a direct lead signals the receipt of the excitatory wave by the muscle immediately beneath the contacts ; presently we shall proceed to prove tha t this is the case ; the prominent spike will be spoken of, therefore, as the first intrinsic deflection, or, briefly, the intrinsic deflection ; the preliminary effect which precedes it will be spoken of on the contrary as the first extrinsic or briefly as the extrinsic deflection.
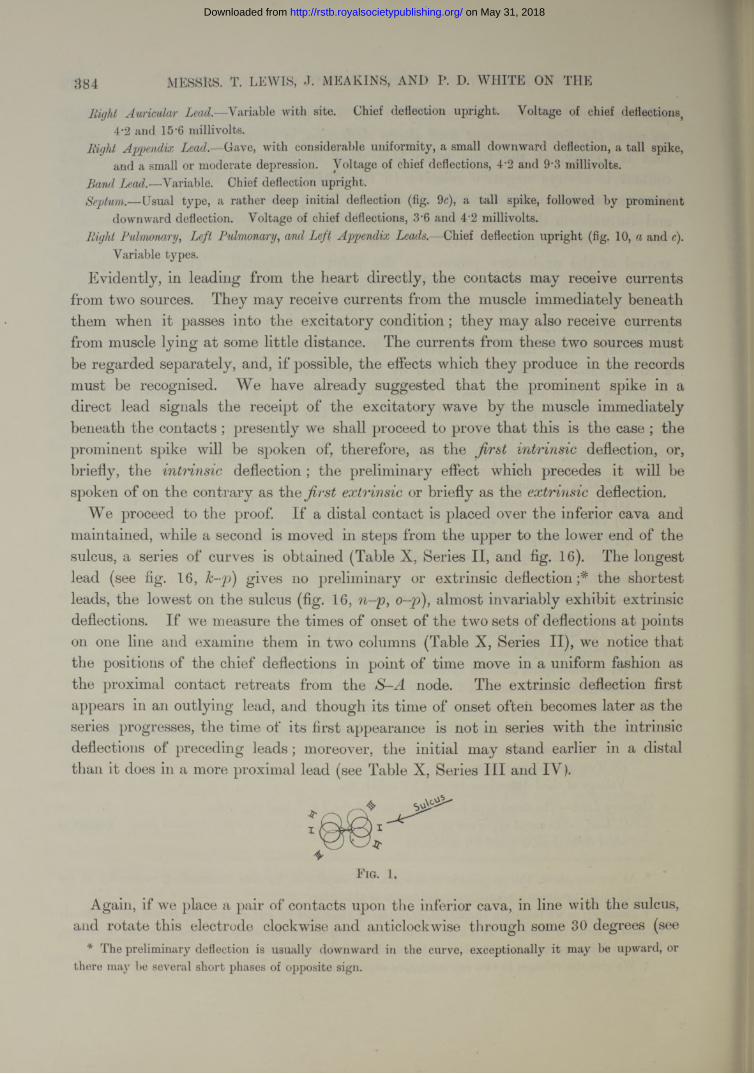
We proceed to the proof. I f a distal contact is placed over the inferior cava and maintained, while a second is moved in steps from the upper to the lower end of the sulcus, a series of curves is obtained (Table X, Series II, and fig. 16). The longest lead (see fig. 16, k-p) gives no preliminary or extrinsic deflection;* the shortest leads, the lowest on the sulcus ( f i g . 16, n-p, o ~ p ) , almost invariably exhibit extrinsic deflections. I f we measure the times of onset of the two sets of deflections a t points on one line and examine them in two columns (Table X, Series II), we notice that the positions of the chief deflections in point of time move in a uniform fashion as the proximal contact retreats from the S-A node. The extrinsic deflection first appears in an outlying lead, and though its time of onset often becomes later as the series progresses, the time of its first appearance is not in series with the intrinsic deflections of preceding leads; moreover, the initial may stand earlier in a distal than it does in a more proximal lead (see Table X, Series I I I and IV ).
F ig. 1.
Again, if we place a pair of contacts upon the inferior cava, in line with the sulcus, and rotate this electrode clockwise and anticlockwise through some 30 degrees (see
* The preliminary deflection is usually downward in the curve, exceptionally it may be upward, or there may be several short phases of opposite sign.
on May 31, 2018http://rstb.royalsocietypublishing.org/Downloaded from
EXCITATORY PROCESS IN THE DOG’S HEART. 385
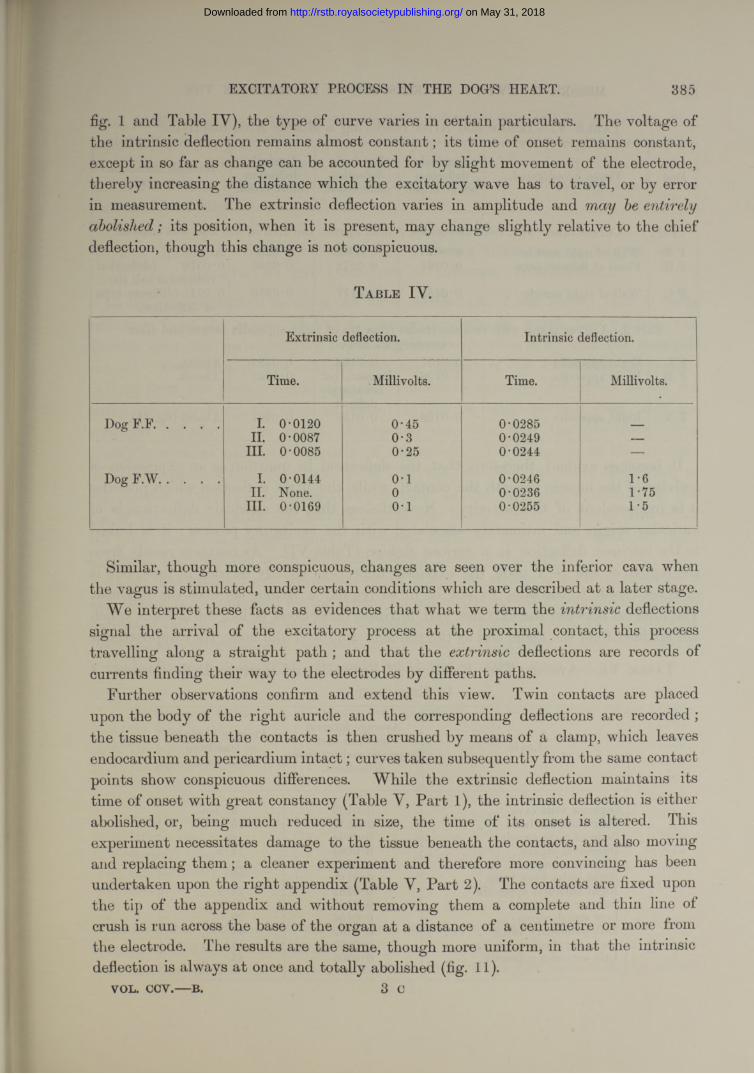
fig. 1 and Table IV), the type of curve varies in certain particulars. The voltage of the intrinsic deflection remains almost constant; its time of onset remains constant, except in so far as change can he accounted for by slight movement of the electrode, thereby increasing the distance which the excitatory wave has to travel, or by error in measurement. The extrinsic deflection varies in amplitude and entirelyabolished; its position, when it is present, may change slightly relative to the chief deflection, though this change is not conspicuous.
T a b l e IV .
Extrinsic deflection. Intrinsic deflection.
Time. Millivolts. Time. Millivolts.
Dog F.F................... I. 0-0120 0-45 0-0285 _II. 0-0087 0-3 0-0249 —
III. 0-0085 0-25 0-0244 —
Dog F.W .................. I. 0-0144 o -i 0-0246 1-6II. None. 0 0-0236 1-75
III. 0-0169 0-1 0-0255 1-5
Similar, though more conspicuous, changes are seen over the inferior cava when the vagus is stimulated, under certain conditions which are described a t a later stage.
We interpret these facts as evidences that what we term the intrinsic deflections signal the arrival of the excitatory process at the proximal contact, this process travelling along a straight path ; and that the extrinsic deflections are records of currents finding their way to the electrodes by different paths.
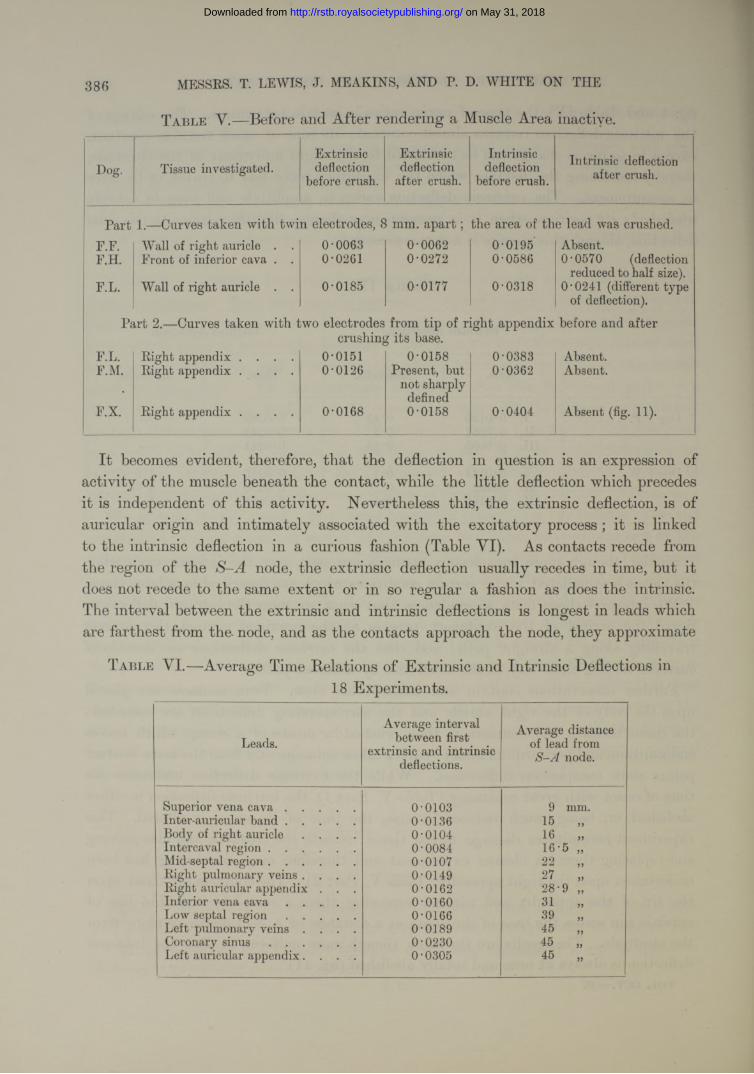
Further observations confirm and extend this view. Twin contacts are placed upon the body of the right auricle and the corresponding deflections are recorded ; the tissue beneath the contacts is then crushed by means of a clamp, which leaves endocardium and pericardium in ta c t; curves taken subsequently from the same contact points show conspicuous differences. While the extrinsic deflection maintains its time of onset with great constancy (Table Y, P art 1), the intrinsic deflection is either abolished, or, being much reduced in size, the time of its onset is altered. This experiment necessitates damage to the tissue beneath the contacts, and also moving and replacing them ; a cleaner experiment and therefore more convincing has been undertaken upon the right appendix (Table Y, Part 2). The contacts are fixed upon the tip of the appendix and without removing them a complete and thin line of crush is run across the base of tbe organ at a distance of a centimetre or more from the electrode. The results are the same, though more uniform, in that the intrinsic deflection is always a t once and totally abolished (fig. 11).
V O L . C C Y .— B . 3 C
on May 31, 2018http://rstb.royalsocietypublishing.org/Downloaded from
386 MESSRS. T. LEWIS, J. MEAKINS, AND P. D. WHITE ON THE
T a b l e V .— Before and After rendering a Muscle Area inactive.
Dog. Tissue investigated.Extrinsic deflection
before crush.
Extrinsic deflection
after crush.
Intrinsic deflection
before crush.Intrinsic deflection
after crush.
Part 1.—Carves taken with twin electrodes, 8 mm. a p a r t ; the area of the lead was crushed.F.F. Wall of right auricle . . 0-0063 0-0062 0-0195 Absent.F.H. Front of inferior cava . . 0-0261 0-0272 0-0586 0-0570 (deflection
reduced to half size).F.L. Wall of right auricle . . 0-0185 0-0177 0-0318 0-0241 (different type
of deflection).
Part 2.— Curves taken with two electrodes from tip of right appendix before and aftercrushing its base.
F.L. Right appendix . . . . 0-0151 0-0158 0-0383 Absent.F.M. Right appendix . . . . 0-0126 Present, but
not sharply defined
0-0362 Absent.
F.X. Right appendix . . . . 0-0168 0-0158 0-0404 Absent (fig. 11).
I t becomes evident, therefore, th a t the deflection in question is an expression of activity of the muscle beneath the contact, while the little deflection which precedes it is independent of this activity. Nevertheless this, the extrinsic deflection, is of auricular origin and intimately associated with the excitatory process ; it is linked to the intrinsic deflection in a curious fashion (Table VI). As contacts recede from the region of the S-A node, the extrinsic deflection usually recedes in time, but it does not recede to the same extent or in so regular a fashion as does the intrinsic. The interval between the extrinsic and intrinsic deflections is longest in leads which are farthest from the- node, and as the contacts approach the node, they approximate
T a b l e V I.—Average Time Relations of Extrinsic and Intrinsic Deflections in18 Experiments.
Leads.Average interval
between first extrinsic and intrinsic
deflections.
Average distance of lead from
S -A node.
Superior vena c a v a ..................... 0-0103 9 mm.Inter-auricular b a n d ..................... 0-0136 15Body of right auricle . . . . 0-0104 16Intercaval reg ion .......................... 0-0084 16-5 „Mid-septal region.......................... 0-0107 22Right pulmonary veins . . . . 0-0149 27Right auricular appendix . . . 0-0162 28-9 „Inferior vena c a v a .................... 0-0160 31Low septal r e g i o n ..................... 0-0166 39Left pulmonary veins . . . . 0-0189 45Coronary s i n u s .......................... 0-0230 45 „Left auricular appendix. . . . 0-0305 45 „
on May 31, 2018http://rstb.royalsocietypublishing.org/Downloaded from
EXCITATORY PROCESS IN THE DOC’S HEART. 387
until, finally, over the node itself the extrinsic deflection is no longer recorded. The explanation is simple. When the excitatory process reaches a region far removed from the pacemaker, a large area of muscle is already in the excitatory state ; when the first deflection is recorded over the node the whole of the outlying muscle is in a state of inactivity.
Th e Or d er of Onset of N e g a t iv it y an d t h e D irectio n of T r a v el as I ndicated by t h e D irectio n of I ntrinsic D eflection s.
In the communication to which we have referred (9), it was shown that in leads radiating from the region of the sino-auricular node, in which one contact was directly over the node, primary negativity is always shown by this the proximal contact. From this it was inferred that the spread of the excitation takes place radially from the node. Neglecting the diminutive extrinsic deflections, as we are now justified in doing, the same statement applies to outlying leads when they are arranged radially to the node. It appears, therefore, that the excitation wave travels in a radial fashion to all parts of the auricle. The direction of the intrinsic deflection indicates that the wave travels from the node, the tcenia , tothe inferior cava; vid the inter-auricular band to the base and eventually to the tip of the left appendix. It travels against the blood current at the mouths of all the great veins and coronary sinus ; it courses from the base to the tip of the right appendix, and from the angle downwards in the tissue of the septum.
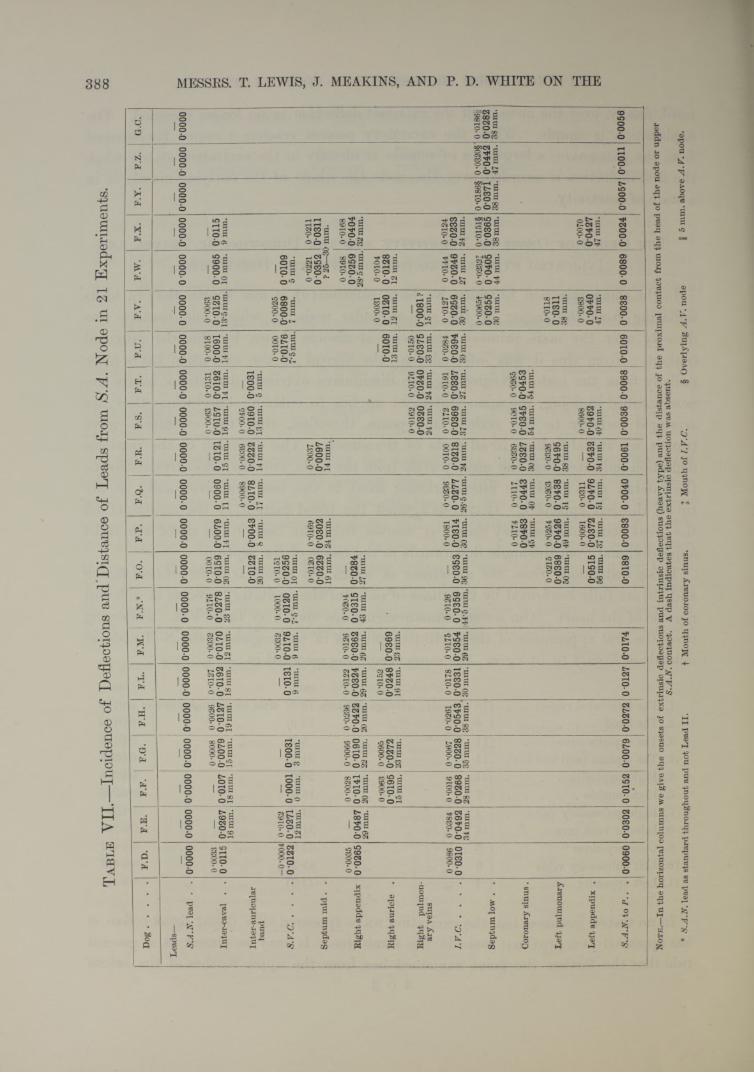
These deductions from the directions in which the string is def ected (see figs. 9 and 10) are fully confirmed by the times of onset of the excitatory process in different regions of the heart. Our actual measurements are shown in Table VII. Following upon the first appearance of the excitatory process in the region of the S-A node in animals of from 8 to 14 kgrm., the same event was recorded in :—
mm. sec.1. The intercaval region . . (18 animals ; average distance 15*2) after an average time of 0'01392. The h a n d .......................... ( 6 5 5 „ 12-9) 5 5 5 5 0-01263. The superior cava . . . (11 5 5 „ 8-2) 5 5 5 5 0-01364. The septum (mid and low) (11 5 5 „ 31-5) 5 5 5 5 0-03055. Right appendix . . . . (11 5 5 „ 28-0) 5 5 5 5 0-03146. Right auricle.................... ( 7 5 5 „ 16-0) 5 5 5 5 0-02067. Right pulmonary veins ( 4 5 5 „ 24-0) 5 5 5 5 0-02548. Inferior vena cava . . . (18 5 5 „ 31-5) 5 5 5 5 0-03259. Coronary sinus . . . . ( 5 5 5 „ 43-9) 5 5 5 5
0-041210. Left pulmonary veins . . ( 5 5 5 „ 45-2) 5 5 5 5 0-041211. Left appendix . . . . ( 7 5 5 » 44-6) 5 5 5 5 0-0446
In no tested instance has the excitation wave appeared in a distal focus before it has appeared at a proximal focus in the same line. I t may be stated as a general rule that the farther the point examined lies from the upper reaches of the sulcus
3 c 2
on May 31, 2018http://rstb.royalsocietypublishing.org/Downloaded from
Ta
bl
e V
II._
_Inc
iden
ce o
f D
efle
ctio
ns a
nd D
ista
nce
of L
eads
fro
m S
.A.
Nod
e in
21
Expe
rimen
ts.
Dog
......
......
......
...F
.D.
F.E
.F
.F.
F.G
.F
.H.
F.L
.F.
M.
F.N
.*F.
O.
F.P
.F.
Q.
jF.
R.
F.S
.F
.T.
F.U
.F
.V.
F.W
.F
.X.
F.Y
.F.
Z.
jG
.C.
Lea
ds—
S.A
.N.le
ad
. .
0 00
0000
000
0*00
000*
0000
0 00
000
0000
0*00
000*
0000
0*00
000*
0000
0*00
000*
0000
0*00
000*
0000
0*00
00
i
-
10*
0000
0*00
000*
0000
0*00
000*
0000
0*00
00
Inte
r-ca
val
. .
0 *00
330
0115
0*02
6716
mm
.0*
0107
18 m
m.
0 -0
008
0 00
7915
mm
.
0 -0
026
0*01
2719
mm
.
0 *0
127
0*01
9218
mm
.
0 -0
032
0*01
7012
mm
.
0-01
760*
0278
23 m
m.
0-o
ioo
0*01
5920
mm
.0*
0079
14 m
m.
0*00
60
11 m
m.
0*01
2115
mm
.
0 *0
063
0*01
5716
mm
.
0-01
31
0*01
92
14 m
m.
0 -0
018
0*00
9114
mm
.
0-00
630*
0125
13*5
mm
.0*
0065
10 m
m.
0*01
159
mm
.
Inte
r-au
ricu
lar
band
0*01
2220
mm
.0*
0043
8 m
m.
0 *0
068
0*01
7817
mm
.
0*00
390*
0222
14 m
m.
0 -0
045
0*01
6013
mm
.0*
0031
5 m
m.
S.V
.C.
..
..
-0*0
004
0*01
220
-016
20*
0271
12 m
m.
0*00
010
mm
.0*
0031
3 m
m.
0 01
319
mm
.
0 *0
032
0*01
769
mm
.
0 *0
001
0*01
207*
5 m
m.
0 -0
151
0*02
5610
mm
.
0 -0
100
0*01
767*
5 mm
.
0*00
250*
0089
7 m
m.
0*01
095
mm
.
Sept
um m
id .
.0
*012
00*
0229
19 m
m.
0-01
690*
0302
24 m
m.
0*00
370*
0097
14 m
m.
0 -0
221
0*03
52? 2
5—3(
0-02
110*
0311
) mm
.
Rig
ht a
ppen
dix
0*00
350*
0265
0*04
8729
mm
.
0 *0
028
0*01
4120
mm
.
0-00
660*
0190
22 m
m.
0 -0
236
0*04
2220
mm
.
0 *0
122
0*03
2429
mm
.
0 *0
126
0*03
6229
mm
.
0 -0
204
0*03
1543
mm
.0*
0284
27 m
m.
0 -0
168
0*02
5928
*5m
m.
0-01
680*
0404
32 m
m.
Rig
ht a
uric
le
.0
-006
30*
0195
15 m
m.
0 *0
095
0*02
7223
mm
.
0-01
520*
0248
16 m
m.
0*03
6923
mm
.0*
0109
13 m
m.
0 *0
031
0*01
2012
mm
.
0*01
040*
0128
12 m
m.
Rig
ht
pulm
on
ary
vein
s
0-01
620*
0320
24 m
m.
0-01
760*
0240
24 m
m.
0*01
500*
0375
33 m
m.
0*00
81?
15 m
m.
I.V
.C...
......
......
.....
0 -0
086
0*03
100*
0384
0*04
9234
mm
.
0 -0
016
0*02
6828
mm
.
0 -0
067
0*02
2835
mm
.
0 -0
261
0*05
43,
38 m
m.
0-01
780*
0331
30 m
m.
0-01
750*
0354
29 m
m.
0 -0
126
0*03
59!4
4*5m
m.
0*03
5336
mm
.
0-00
810*
0314
30 m
m.
0 *0
236
0*02
7726
*5 m
m.
o-oi
oo0*
0218
24 m
m.
0*01
720*
0369
37 m
m.
0*01
91
0*03
37
27 m
m.
0*02
840*
0394
30 m
m.
0-01
270*
0259
30 m
m.
0 *0
144
0*02
46
27 m
m.
0 -0
124
0*02
3324
mm
.
Sept
um lo
w .
.
0 *0
065f
0*02
5530
mm
.
i 0-0
232J
0 *0
405
44 m
m.
0*01
51§
0*03
6538
mm
.
0 *0
186§
0*03
7138
mm
.
0-0
320§
0*04
4247
mm
.
0 *0
186 ij
0*02
8238
mm
.
Cor
onar
y si
nu
s.0
-017
40*
0483
45 m
m.
0-01
170*
0443
40 m
m.
0-02
390*
0327
30 m
m.
0-01
060*
0345
54 m
m.! 0
-026
500
453
' 54
mm
.
Lef
t pu
lmon
ary
0-02
150*
0389
50 m
m.
0 -0
254
0*04
2649
mm
.
0*02
030*
0438
51 m
m.
0*03
260*
0495
38 m
m.
0-01
180*
0311
38 m
m.
Lef
t ap
pend
ix
.0*
0515
56 m
m.
0 *0
091
0*03
7237
mm
.
0-03
110*
0476
51 m
m.
0*04
3234
mm
.
0 *0
098
0*04
6240
mm
.
0 -0
083
0 *0
440
47 m
m.
0 *0
070
0*04
2747
mm
.
S.A
.N. t
o P
.. .
0*00
600*
0302
0*01
520*
0079
0*02
720*
0127
0*01
740*
0189
0*00
830*
0040
0*00
610*
0036
0*00
680*
0109
0*00
380*
0089
0*00
240
0057
0*00
110*
0056
No
te
.—In
the
hori
zont
al c
olum
ns w
e gi
ve t
he o
nset
s of
ext
rins
ic d
efle
ctio
ns a
nd i
ntri
nsic
def
lect
ions
(he
avy
type
) an
d th
e di
stan
ce o
f th
e pr
oxim
al c
onta
ct f
rom
the
hea
d of
the
nod
e or
upp
erS.
A.N
. con
tact
. A
das
h in
dica
tes
that
the
ext
rins
ic d
efle
ctio
n w
as a
bsen
t.
* S.
A.N
. lea
d as
sta
ndar
d th
roug
hout
and
not
Lea
d II
. f
Mou
th o
f co
rona
ry s
inus
. J
Mou
th o
f I.
V.C
. §
Ove
rlyi
ng A
.V.
node
I
5 m
m. a
bo\e
A. V
. nod
e.
388 MESSRS. T. LEWIS, J. MEAKINS, AND P. D. WHITE ON THE
on
May
31,
201
8ht
tp://
rstb
.roy
also
ciet
ypub
lishi
ng.o
rg/
Dow
nloa
ded
from
EXCITATORY PROCESS IN THE DOG’S HEART. 389
the longer will the appearance of the excitation wave at this point be delayed. The spread from the node is radial in every direction.
We draw attention at this stage to the architecture of the auricle, and would ask if there is any point upon its surface or deeply seated within it which would serve more efficiently as a centre of distribution ? Lying in the angle between right appendix and superior cava a radial spread at once involves the superior cava, the tcenia terminalis, the right appendix, the septum, and the band which leads to the
left appendix. The tcenia, taking a straight course to the inferior cava, forms a base from which the pectinate bands sweep slightly away around the body of the right auricle; it terminates above near the head of the node where muscle bands stream in like the ribs of a fan and concentrate from appendix, body of right auricle, septum and inter-auricular band, eager to act as outgoing messengers (figs. 8, 13, 16, and 21). The collection of fibres at this region is remarkable ; we name this focus the “ concentration point.”
A discussion as to whether right or left auricle first contracts is evidently unprofitable in the face of our facts. Certain portions of the right auricle contract before certain portions of the left auricle, and vice versd.
R ate of P ropaga tio n of t h e E xcitatory P rocess.
Preliminary Observation s.The rate at which the excitatory process travels through the musculature of the
heart has been measured by earlier workers in one of two ways. We may, in describing them, conveniently follow S anderson and P a g e ’s description (12), for the methods as they describe them are the most accurate. The ventricle is excited “ at the apex (x), and led off by one contact (f) at the base and by one of two contacts (m and m'),which occupy different distances between x and f ” The leads taken are alternately from f and m and from f and m!“ In the first case the excitatory-wave has to travel from x to m, in the second from x to mr, consequently the difference between the times after excitation at which the first effect appears corresponds to the distance between m and mV’
The second method, which according to these writers is equally reliable, makes use of a single pair of contacts in line with the point of stimulation. The time lost in travelling between these two contacts is measurable from the beginning to the culmination of the first or negative phase (upward deflection in the present galvano- metric curves). When the excitatory process reaches the first contact, that contact develops relative negativity, and this electrical disturbance, being unbalanced by similar disturbance at the second contact, which rests upon inactive muscle, produces an abrupt and large movement in the recording instrument. When the excitatory process reaches the second contact, this, too, develops relative negativity, and soon a balance between the two contacts becomes established; the first sign of its
on May 31, 2018http://rstb.royalsocietypublishing.org/Downloaded from
390 MESSRS. T. LEWIS, J. MEAKINS, AND P. D. WHITE ON THE
reaching the second contact is a commencing diminution or a “ culmination ” of the variation first recorded.
These methods have been applied to the frog’s heart, artificially excited (2), and the second, by G otch (5), to the naturally beating rabbit’s ventricle quite recently. But evidently neither the one nor the other method can give an accurate measure unless it is known that the contacts lie in the line of the excitationwave.
If we are to investigate the progress of this wave in the naturally excited heart, and wTe adopt a method similar to the first described, it is necessary first to ascertain the order in which different points upon its surface enter the excitatory state, so that our contacts may be placed as nearly as possible in the line of travel. In the case of the auricle, the starting point of the excitatory process is now known, and there is evidence to show that the wave travels in approximately radiating lines from this centre. From the theoretical standpoint, a convenient test that two contacts lie approximately in the line of conduction is the record of a simple diphasic effect as the wave travels over and past them. These simple diphasic curves are recorded most readily by placing our contacts in the line of the tomia terminalis. T^is line in the auricle is therefore especially convenient for observations upon the propagation of the excitatory state. If we adopt the second method of measurement, it is evidently quite as necessary that we know beforehand the general line of conduction in relation to the contacts for purposes of computation; it is also imperative, because measurements of the kind cannot be undertaken in polyphasic curves, such as are obtained when the path of excitation and the contact line are very oblique to each other, or when the muscle path is complex.
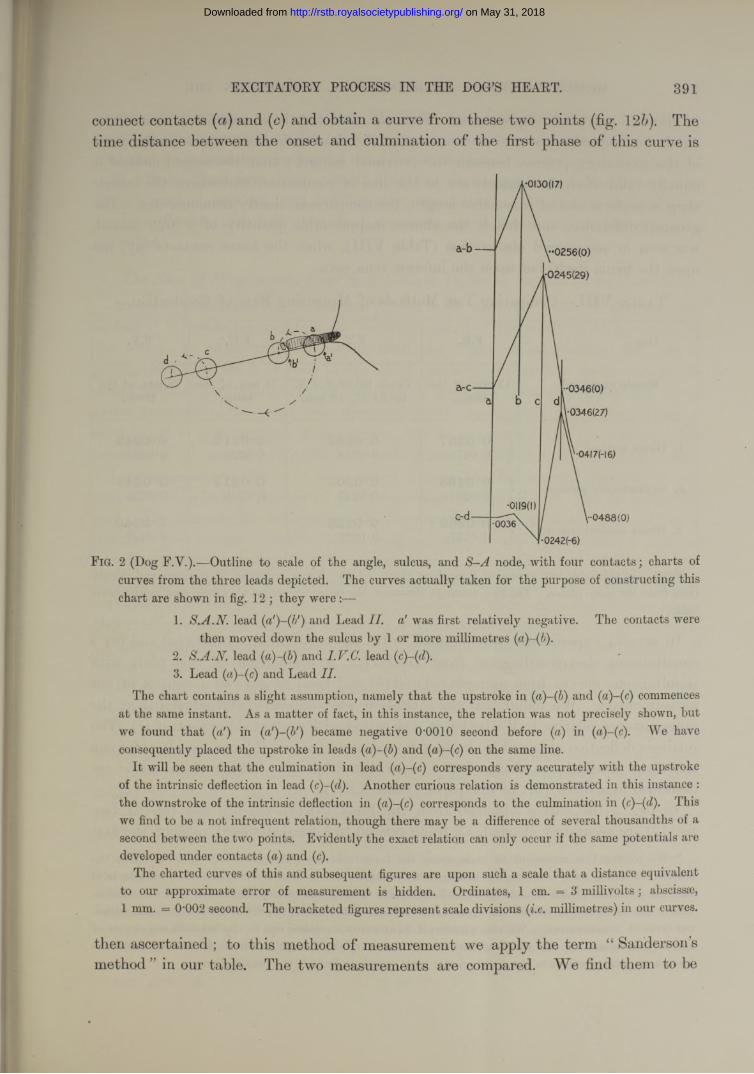
In our present observations we have employed two methods, and have instituted a comparison between them. Having in the first instance ascertained that the excitatory process arises primarily in the immediate neighbourhood of the angle between appendix and superior cava, and having found from the direction of the deflections that the wave travels radially from this point, we arrange two pairs of contacts along the most favourable line, the tcenia The arrangement ofthese contacts is as shown in the accompanying figure (fig. 2). Contact (a) is placed a little below the point which first shows relative negativity ; ( ), (c), and ( ) are placed upon the same line of the sulcus at more distal points.
Simultaneous curves are taken with these paired contacts (fig. 12). The curve given by contacts (a) and (b) is in the main diphasic (fig. 12a) ; that yielded by contacts (c) and (d) is in the main diphasic (fig. 12c), but may be preceded by a brief extrinsic phase. The two first intrinsic phases of the separate curves are in the same direction (upward), and the distance between their onsets gives us the time taken for the excitatory process to travel over the measured distance (a) to (c). This, for descriptive purposes, we speak of as the “ direct method ” upon which the measure of the conduction rate is based. Without altering the position of these four contacts, we now
on May 31, 2018http://rstb.royalsocietypublishing.org/Downloaded from
EXCITATORY PROCESS IN THE DOG’S HEART. 391
connect contacts (a) and (c) and obtain a curve from these two points (fig. 12b). The time distance between the onset and culmination of the first phase of this curve is
•0130(17)
a-b — ,••0256(0)
,•0245(29)
••0346(0)
1-0346(27)
•04I7H6)
•0119(1)1-0488(0)
•0242(-6)
' ------------- ---
F ig. 2 (Dog F.Y.).—Outline to scale of the angle, sulcus, and node, with four contacts; charts of curves from the three leads depicted. The curves actually taken for the purpose of constructing this chart are shown in fig. 12 ; they were :—
1. S.A.N. lead (a')-(b') and Lead II. a' was first relatively negative. The contacts werethen moved down the sulcus by 1 or more millimetres
2. S.A.N. lead (a)-(fi) and I.V.C. lead (3. Lead ( a)~(c)and Lead II.
The chart contains a slight assumption, namely that the upstroke in ( ) and (a)-(c) commencesat the same instant. As a matter of fact, in this instance, the relation was not precisely shown, but we found that («') in (a')-(b') became negative O’OOlO second before ( ) in (a)-(c). We have consequently placed the upstroke in leads (a)-(b) and (a)-(c) on the same line.
It will be seen that the culmination in lead (a)-(c) corresponds very accurately with the upstroke of the intrinsic deflection in lead (c)-(d). Another curious relation is demonstrated in this instance : the downstroke of the intrinsic deflection in (a)-(c) corresponds to the culmination in ( ). Thiswe find to be a not infrequent relation, though there may be a difference of several thousandths of a second between the two points. Evidently the exact relation can only occur if the same potentials are developed under contacts ( a)and (c).
The charted curves of this and subsequent figures are upon such a scale that a distance equivalent to our approximate error of measurement is hidden. Ordinates, 1 cm. — 3 millivolts; abscissae, 1 mm. = 0-002 second. The bracketed figures represent scale divisions (i.e. millimetres) in our curves.
then ascertained ; to this method of measurement we apply the term “ Sanderson’s method ” in our table. The two measurements are compared. We find them to be
on May 31, 2018http://rstb.royalsocietypublishing.org/Downloaded from
392 MESSRS. T. LEWIS, J. MEAKINS, AND P. D. WHITE ON THE
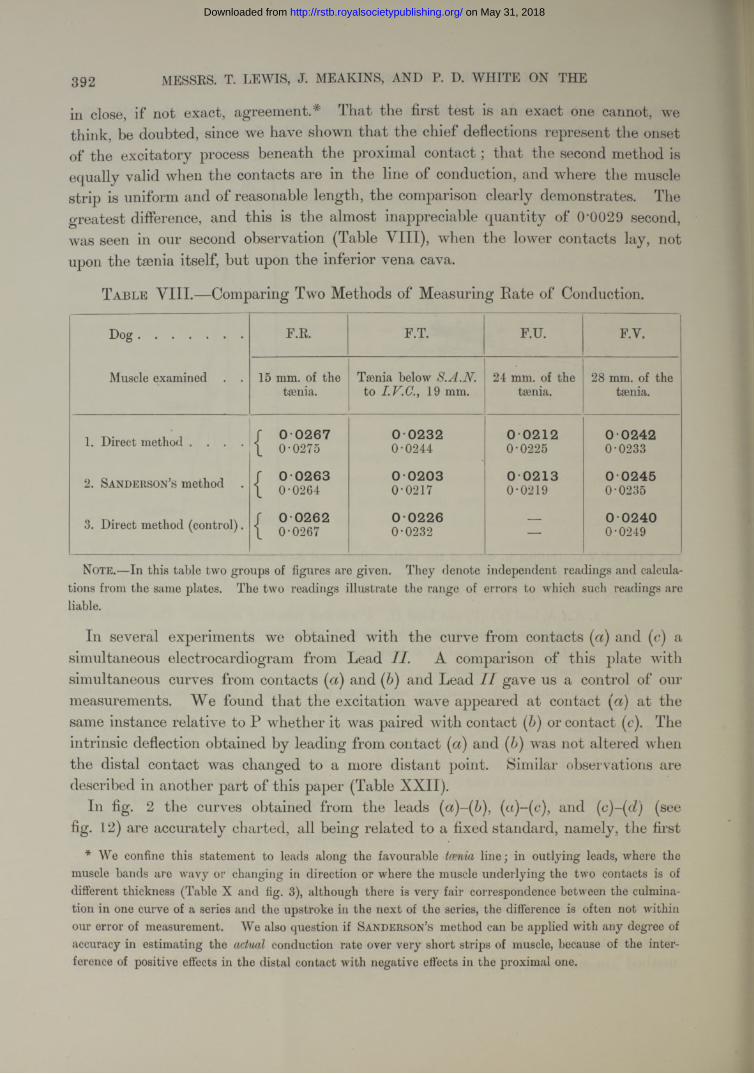
in close, if not exact, agreement.* That the first test is an exact one cannot, we think, be doubted, since we have shown that the chief deflections represent the onset of the excitatory process beneath the proximal contact ; that the second method is equally valid when the contacts are in the line of conduction, and where the muscle strip is uniform and of reasonable length, the comparison clearly demonstrates. The greatest difference, and this is the almost inappreciable quantity of 0'0029 second, was seen in our second observation (Table VIII), when the lower contacts lay, not upon the tsenia itself, but upon the inferior vena cava.
T a ble V III.—Comparing Two Methods of Measuring Bate of Conduction.
D o g ............................... F.R. F.T. F.U. F.v.
Muscle examined . . 15 mm. of the tsenia.
Tsenia below S.A.N. to I.V.C., 19 mm.
24 mm. of the tsenia.
28 mm. of the tsenia.
1. Direct method . . . . / 0 0 2 6 7\ 0-0275
0 0 2 3 20-0244
0 0 2 1 20-0225
0 02 4 20-0233
2. Sanderson’s method . r 0 0 2 6 3\ 0-0264
0 0 2 0 30-0217
0 0 2 1 30-0219
0 02 4 50-0235
3. Direct method (control). / 0 0 2 6 2\ 0-0267
0 0 2 2 60-0232 —
0 0 2 4 00-0249
Note.—In this table two groups of figures are given. They denote independent readings and calculations from the same plates. The two readings illustrate the range of errors to which such readings are liable.
In several experiments we obtained with the curve from contacts (a) and (c) a simultaneous electrocardiogram from Lead II. A comparison of this plate with simultaneous curves from contacts ( a)and and Lead I I gave us a control of our measurements. We found tha t the excitation wave appeared at contact at the same instance relative to P whether it was paired with contact ( ) or contact (e). The intrinsic deflection obtained by leading from contact (a) and (b) was not altered when the distal contact was changed to a more distant point. Similar observations are described in another part of this paper (Table XXII).
In fig. 2 the curves obtained from the leads (a)-(b), (a)-(c), and (c)-(d) (see fig. 12) are accurately charted, all being related to a fixed standard, namely, the first
* We confine this statement to leads along the favourable tcenia line; in outlying leads, where the muscle bands are wavy or changing in direction or where the muscle underlying the two contacts is of different thickness (Table X and fig. 3), although there is very fair correspondence between the culmination in one curve of a series and the upstroke in the next of the series, the difference is often not within our error of measurement. We also question if Sanderson’s method can be applied with any degree of accuracy in estimating the actual conduction rate over very short strips of muscle, because of the interference of positive effects in the distal contact with negative effects in the proximal one.
on May 31, 2018http://rstb.royalsocietypublishing.org/Downloaded from
EXCITATORY PROCESS IN THE DOC'S HEART.
appearance of current in the auricle. It will be seen that the intrinsic deflection oflead commences at the same time as the intrinsic deflection of leadand that its culmination lies on the same line as the intrinsic deflection of lead (c)-(cl).
It will be clear from these results that the direct method or S a n d er so n and P a g e ’s method may be used indifferently; the latter we have used in excluding changes of conduction rate over short distances, special observations presently to be described.
The Rate of Propagation from S-A Node to Different Regions of the Auricle.Accurate measurements of the conduction rates to many points of the auricular
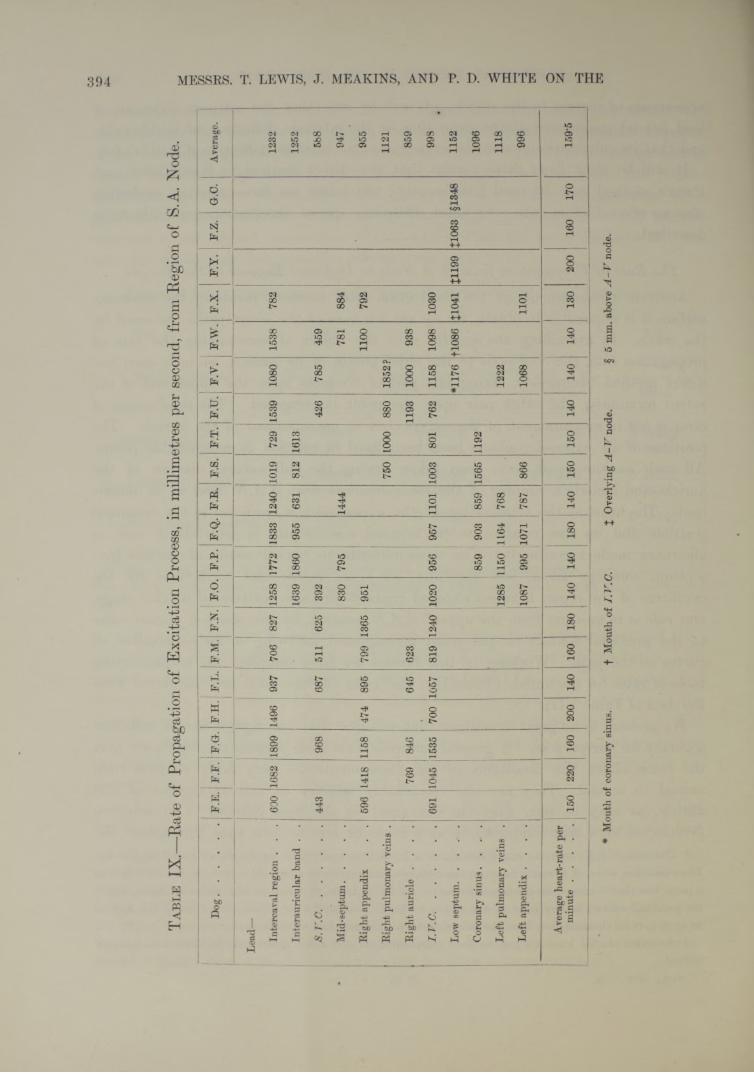
surface it is impossible to obtain, for we are unaware of the exact paths traversed by the wave. In examining the auricle with the object of ascertaining the rate of propagation from the S-A node to the chief points of its surface, we have used the direct method exclusively, fixing one pair of contacts upon the upper end of the sulcus terminalis, the other pair upon the point investigated. The chief source of error is not in measurement of the curves, but in measurement of the auricle. The positions of all exposed contacts have been fixed in relation to recognisable points. All such measurements have been taken during the full natural diastole of the auricle, and include a number of the measurements from S.A.N. lead to an outside lead. The heart at the termination of the experiment is hardened in the distended position, and its size relative to its original size in situ is ascertained, and an allowance made accordingly. The measurements to buried points of contact septum, coronary sinus, left appendix, etc.) are made, and corrections for the curvature of the organ between exposed contacts are also introduced at this stage. Our rule is to measure from the upper* S.A.N. contact, by the shortest muscle route to the proximal contact on the point investigated, following so far as possible all curves on the path. Working in this fashion we have compiled the accompanyingtable of rates for the auricle (Table IX ; the rates of this table are calculated fromthe data of Table VII).
We pretend to no great exactitude, but consider that the figures are of sufficient accuracy for our purpose. A general survey of this table permits the conclusion that the rates under the conditions of our experiments are very fairly uniform from animal to animal. They are also remarkably uniform to various regions of the auricle, as may be seen from the averages! in the final column. Our evidencefavours the view that conduction is at a more or less uniform rate throughout the
* The two S.A.N. contacts stand 8 mm., or a little less, apart; the upper shows initial negativity. The excitation wave, if it starts between the contacts and travels at equal rates to both, has its origin at a point less than 4 mm. from the upper contact. In S.V.C. leads, and also in the auricular leads, where the proximal contact is very near to the sulcus we have introduced a correction after cutting the auricle, so as to give its distance, not from the sulcus, but from the mid-line of the node.
t Averages of this kind are not entirely comparable, as only a few points may be taken from a single animal.
393
3 DVOL. CCV.— B.
on May 31, 2018http://rstb.royalsocietypublishing.org/Downloaded from
Ta
bl
e I
X.—
Rat
e of
Pro
paga
tion
of E
xcita
tion
Proc
ess,
in m
illim
etre
s pe
r se
cond
, fr
om R
egio
n of*
S.A
. N
ode.
Do
g...
......
......
......
......
....F
.E.
F.F
.F
.G.
F.H
.F
.L.
F.M
.F
.N.
F.O
.F
.P.
F.Q
.F
.R.
F.S
.F
.T.
F.U
. F
.y.
1F
.W.
F.X
.F
.Y.
F.Z
.G
.C.
Ave
rage
.
Lea
d—
Inte
rcav
al r
egio
n .
. .
600
1682
1899
1496
937
706
827
1258
1772
1833
1240
1019
729
1539
1080
1538
782
1232
Inte
raur
icul
ar b
and
. .
1639
1860
955
631
812
1613
1252
S.T'
.C...
......
......
......
......
......
...44
396
868
751
162
5 j
392
426
785
459
588
Mid
-sep
tum
......
......
......
......
830
795
1444
781
884
947
Rig
ht a
ppen
dix
. .
.59
614
1811
5847
489
579
913
6595
111
0079
295
5
Rig
ht p
ulm
onar
y ve
ins
.75
010
0088
018
52?
1121
Rig
ht a
uric
le
..
..
769
846
645
623
1193
1000
938
859
I.V
.C...
......
......
......
......
......
....
691
1045
j1
535
700
1057
819
1240
1020
956
957
1101
1003
801
762
1158
1098
1030
998
Low
sep
tum
......
......
......
......
*117
6+1
086
£104
1£1
199
£106
3§1
348
1152
Cor
onar
y si
nus.
..
.85
990
385
915
6511
9210
96
Lef
t pu
lmon
ary
vein
s .
1285
1150
1164
768
1222
1118
Lef
t ap
pend
ix .
..
.10
8799
510
7178
786
610
6811
0199
6
Ave
rage
hea
rt-r
ate
per
min
ute
......
......
......
......
150
220
160
200
140
160
180
140
140
; 18
014
01
150
150
140
140
140
130
200
160
170
159-
5
# M
outh
of
coro
nary
sin
us.
+ M
outh
of
I.V
.C.
£ O
verl
ying
A-V
nod
e.
§ 5
mm
. ab
ove
A -
V n
ode.
394 MESSRS. T. LEWIS, J. MEAKINS, AND P. D. WHITE ON THE
on
May
31,
201
8ht
tp://
rstb
.roy
also
ciet
ypub
lishi
ng.o
rg/
Dow
nloa
ded
from
EXCITATORY PROCESS IN THE DOG’S HEART. 395
whole auricle, and that the excitation wave spreads in every direction from its starting point at similar speeds. The rates to the intercaval and band region are relatively high ; in the main, we attribute these to the straight courses which the muscle fibres pursue to these regions. They may also appear high to these regions for another reason. The calculated rates will be too great if the actual starting point of the excitation wave lies sometimes a little above and sometimes a little below the upper S.A.N. contact ; in the first instance, the estimated rate to the band will be exaggerated, in the last instance the estimated rate to the intercaval region will be exaggerated. The rates to the inferior cava and left appendix will not be subject to so great an error, for the muscle stretches are much longer.
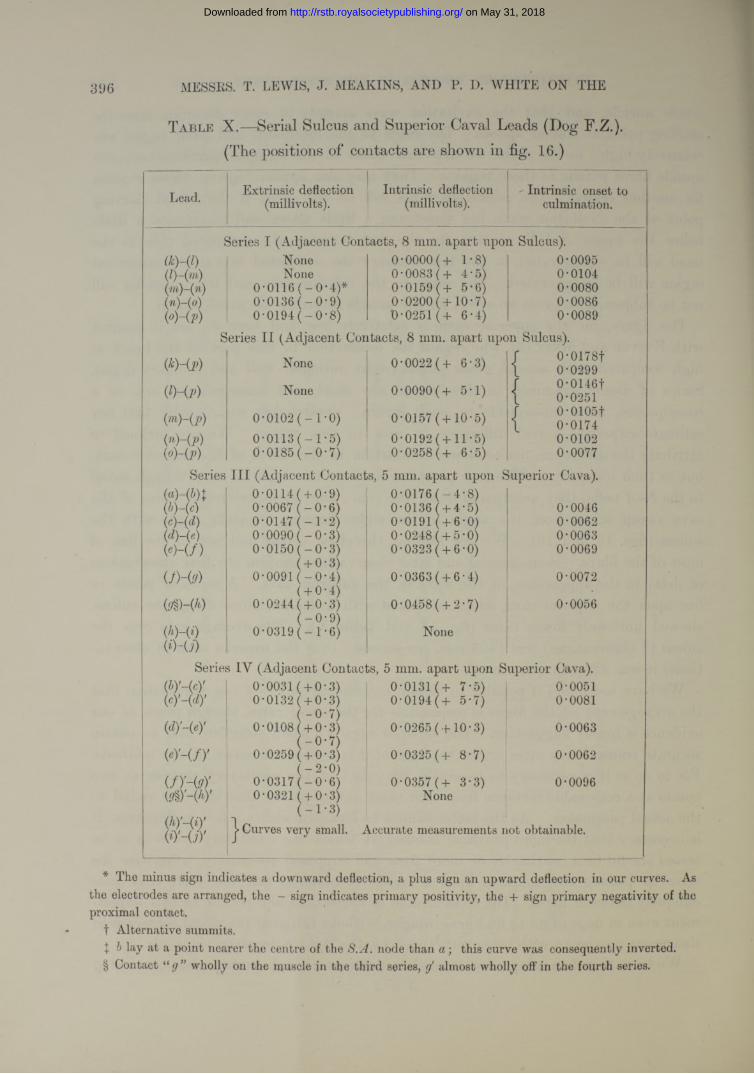
The figure, for the superior cava, is relatively low, and here we are in conflict with E yster and M eek (3), who regard the conduction to this part of the heart as high compared with several other points (right auricular wall and coronary sinus). Strips of tissue examined in this region are short, and measurements are, as a consequence, more susceptible to small errors ; nevertheless we consider that our estimate expresses a real difference in rate to this region. We are inclined to attribute the difference, not to slower conduction in the fibres of the superior cava, but to their obliquity. When we place contacts on the superior cava, though radial to the S—A node, they are up and down the vein ; the intra-pericardial fibres of the cava sweep across from the angle to the right, forming an acute angle with the sulcus (figs. 13 and 16). We are leading, therefore, across and not in the line of most of the fibres. Some special and later observations confirm our first observations of delay in the appearance of the wave in the superior cava. A series of points in line upon the superior cava, when compared with a similar series along the sulcus, showed uniformly lower rates (fig. 16 and Table X). The average rate over the sulcus (8 observations) was 1426 mm. per second ; over the superior cava (8 observations) it was 820 mm. per second.
We have not found it possible to obtain convincing proof of our supposition that the arrangement of the fibres is responsible for the lower rates, though much of our evidence is highly suggestive. The superior cava is a small structure and to obtain accurate transmission rates across the base of it is beyond the scope of our methods. For to do so it is necessary to ascertain the onset of the excitatory process at two points at a reasonable distance from each other and so placed that they are radial to the actual pacemaker. As the latter cannot be localised within a few millimetres, it is necessary that the more proximal contact at which the excitatory wave is to be tested should lie a centimetre or more from the supposed pacemaker, otherwise the error in placing the contacts upon a radius is material and the wave may pass obliquely between them. The cross stretch of tissue does not permit of this experiment even in dogs of 25 to 30 kgrm. weight, without bringing the distal contact into dangerous proximity with other structures, i.e. the right pulmonary veins, etc.
We have therefore adopted a somewhat different though perhaps less convincing3 d 2
on May 31, 2018http://rstb.royalsocietypublishing.org/Downloaded from
396 MESSRS. T. LEWIS, J. MEAKINS, AND P. D. WHITE ON THE
T able X.—Serial Sulcus and Superior Caval Leads (Dog F.Z.). (The positions of contacts are shown in fig. 16.)
Lead. Extrinsic deflection Intrinsic deflection ' Intrinsic onset to(millivolts). (millivolts). culmination.
Series I (Adjacent Contacts, 8 mm. apart upon Sulcus).<*H i) None 0*0000(+ 1*8) 0*0095(Z)-(m) None 0*0083 (+ 4*5) 0*0104(7n)-(n) 0*0116 ( - 0*4)* 0*0159 (+ 5*6) 0*0080(n)-(o) 0*0136 (-0 * 9 ) 0*0200 ( + 10*7) 0*0086(o)-(p) 0*0194 ( - 0*8) 0*0251 (+ 6*4) 0*0089
Series I I (Adjacent Contacts, 8 mm. apart upon Sulcus).
(*H p) None 0*0022 (+ 6*3) / 0*0178ft 0*0299
(9-00 None 0*0090(+ 5*1) / 0*0146tL 0*0251
{in)-(p) 0*0102 (-1 * 0 ) 0*0157 (+10*5) / 0*01051\ 0*0174
(n ) - (p ) 0*0113 ( - 1*5) 0*0192 (+11*5) 0*0102(°Hp) 0*0185 ( - 0*7) 0*0258 (+ 6*5) 0*0077
Series I I I (Adjacent Contacts, 5 mm. apart upon Superior Cava).
(b) ~(c)(c) -(d)(d) -(e)(e) - ( f )
Uh(9)
&§>-(*)
(i)~U)
(c) ' - W
(d) -(ey
(e.) - ( / ) '
(/)'-(<?)'
(hy~(iyW-UY
0*0114( + 0*9) 0*0176 ( - 4*8)0*0067 ( -0*6) 0*0136 ( + 4*5) 0*00460*0147 (-1 * 2 ) 0*0191 ( + 6*0) 0*00620*0090 ( - 0*3) 0*0248 ( + 5*0) 0*00630*0150 (-0 * 3 ) 0*0323 ( + 6*0) 0*0069
( + 0*3)0*0091 (-0 * 4 ) 0*0363 ( + 6 *4) 0*0072
( + 0*4)0*0244 ( + 0*3) 0*0458( + 2*7) 0*0056
(-0 * 9 )
r-H1Oir—1
COoo
None
s IY (Adjacent Contacts, 5 mm. apart upon Superior Cava).0*0031 ( + 0*3) 0*0131 (+ 7*5) 0*00510*0132 ( + 0*3) 0*0194 (+ 5*7) 0*0081
(-0 * 7 )0*0108 ( + 0*3) 0*0265 (+10*3) 0*0063
(-0 * 7 )0*0259 ( + 0*3) 0*0325 (+ 8*7) 0*0062
(-2 * 0 )0*0317 (-0 * 6 ) 0*0357 (+ 3*3) 0*00960*0321 ( + 0*3) None
(-1 * 3 ); j> Curves very small. Accurate measurements not obtainable.
* The minus sign indicates a downward deflection, a plus sign an upward deflection in our curves. As the electrodes are arranged, the - sign indicates primary positivity, the + sign primary negativity of the proximal contact.
t Alternative summits.\ b lay at a point nearer the centre of the S.A. node than a ; this curve was consequently inverted.§ Contact “ g ” wholly on the muscle in the third series, almost wholly off in the fourth series.
on May 31, 2018http://rstb.royalsocietypublishing.org/Downloaded from
EXCITATORY PROCESS IN THE DOG’S HEART. 397
procedure and have used large animals of 25 to 30 kgrm. Of two experiments we illustrate one in fig. 13. In this figure the superior cava and the angle between it and the appendix are shown. We first isolated, so far as possible, the point of primar}" negativity by noticing the direction of deflection while moving two closely set contacts over the region above the angle. The point of primary negativity appeared to be at F, or a little to the left of it in the heart. Regarding this point as centre we set four electrodes (A), (B), (C) and (Z>) upon an arc of a circle as shown, leading from each to an indifferent point (F on the chest wall. The excitation wave reached these points at the following times after its first appearance in the region of F.
Point (A), distance 15 mm., in 0‘0306 sec.„ (B), > > 14*5 „ 0*0311 „
„ (O), 14*5 „ 0-0253 „» (D), >> 15*5 „ 0-0162 „
The fastest lines of conduction appeared therefore to be between ( ) and (Z)) and (F) and ((7), between the former especially. In confirmation of this result we found that upon leading from (O) to (ZZ), the intrinsic deflection appeared at a time 0'0168 second and its direction showed ( D ) negative before ( ). In this same animal, the conduction rate was determined between (/) and (K ) in an up and down lead upon the superior cava (the times of onset at these points being 0’277 and 0"0510 second and the distance 12‘5 mm.) and was found to be 536 mm. per second; and also upon the taenia between points ( G)and (H) (the times of onset being 0"0021 and 0*0171 second, and the distance 20 mm.) and the rate was here found to be 1333 mm. per second.
The excitation wave spreads upon the base of the superior cava in radiating lines, although the rates of travel are uneven. That there is this radiation is shown not only by the times of onset, for a distal point always receives the excitation wave sooner than a point more proximal, but by two other* circumstances. First, the voltages are greatest in radial leads. Second, if a pair of outlying contacts are placed up and down the cava in the neighbourhood of (d) (fig. 13) and are gradually rotated anti-clockwise around their own centre, and are at the same time carried along a semicircle stretching from this point to the taenia, the rotation relative to the axis of the cava may reach and surpass 180° before the direction of the intrinsic deflection becomes reversed.
Passage of Wave from Node to Surrounding Tissue. — The delay in the appearance of the excitation wave as we have described it comprises the delay in passage from node to surrounding tissue and delay in the muscle of the auricle itself. E yster and M e ek (3) believe they have found evidence of a natural line of block between node and auricular muscle. The method adopted by these writers will be referred to again ; we believe it to be open fo serious fallacy. At all events, we
on May 31, 2018http://rstb.royalsocietypublishing.org/Downloaded from
398 MESSRS. T. LEWIS, J. MEAKINS, AND P. D. WHITE ON THE
are unable to detect any sign of the line of obstruction of which they speak. If serial leads are taken in line along the sulcus (Table X, Series I and II) or along the superior cava (Table X, Series III and IV), so that the proximal contacts in each series are in relation to the node, no constant or material differences are to be found between the rates along the individual stretches of muscle examined.* Our belief is that the excitation passes in all directions from the node by similar connections with the surrounding muscular tissue ; that it passes with equal facility along all these paths, and tha t there are no paths which may be demonstrated as of specially high or low conducting power ; and that, once in the auricular muscle, the general course of the muscle fibre bands is taken a t uniform speeds.
Special Leads f rom the Veins.From many points of view we wished to determine more exactly the manner
in which the excitation wave progresses along the great veins. For this purpose we have employed a specially devised “ organ-pipe” electrode. We take a number of straight pieces of small glass tubing (see scale drawing in fig. 14) and partially seal the mouths at one end, selecting from a quantity those in which the mouths are of the same size and centrally placed. These tubes are then laid in line and are embedded in hard paraffin. Each tube is subsequently used as a contact, so that we possess an electrode with a series of contacts, the corresponding edges lying at distances of 5 to 5|- mm. apart. Nine such contacts are placed on the line of the taenia, and extending on to the inferior cava to a variable extent (fig. 14), or the same contacts are placed on the superior cava (fig. I 6), extending from the sulcus opposite the concentration point, well up over the pericardial margin. The exact positions of the contacts relative to the surrounding tissues, and especially to the terminal fans of auricular muscle, which are clearly visible in the exposed heart of the dog, are charted at the time, and at the end of the observation one or more points may be marked on the epicardium for reference. Curves are taken from each pair of adjacent contacts akjng the whole line, a curve from a fixed pair of contacts or from Lead I I being used as the standard. A complete example of our results is shown in figs. 14 and 3. Fig. 14 is a diagram constructed from a scale drawing taken at the time and checked in the hardened heart. The details of the muscle bands have been filled in subsequently, though their outlines were charted at the time. The positions of two lines of contacts are accurately depicted. The vein was marked with India ink between contacts (m) and The curves from the pairedcontacts (a)-(b), (h)-(c), etc., and (j)^(k), (k)~(l), etc., are charted in fig. 3. Charts of this kind are peculiarly instructive. If in the first series we follow the onsets of the intrinsic deflections, which represent the appearance of the excitation wave beneath the proximal contacts of given leads, we observe that they are placed in a
* The tables referred to are not the only ones which we could produce in favour of this argument; they are published in illustration of other points, but they sufficiently support our present contention.
on May 31, 2018http://rstb.royalsocietypublishing.org/Downloaded from
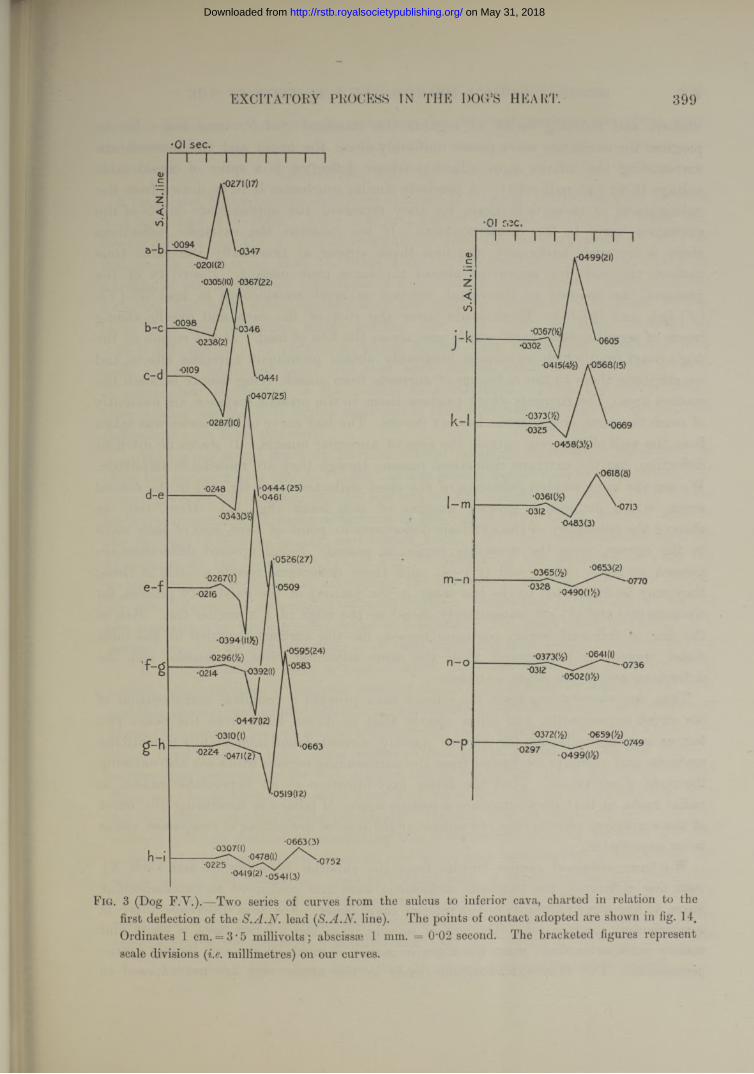
EXCITATORY PROCESS IN THE DOC’S HEART. 399
•01 sec.
1-0271(17)
•0094•0347
•0201( 2)
•0305(10) 0367(221
•0098 ‘•0346•0238(2)
•0441
•0407(25)
•0287(10)
•0 4 4 4 (25)'•0461
•0248
•0526(27)
•0267(1)•0509
.•0595(24)\-0583.-0392(1)•0214
•0310(1)
'022^047K 2!'•0663
•0519(12)
•0663(3)•0307(1)\ - 0478(l) /
•0419(2) -0541(3)•0752
.•0499 (21)
•0302
0415(4)9 *0568(15)
•06690325
<0618(8)
•036109
0483(3)
•0653(2)m -n 0328
•037309 -0641(0VU?
0502(|V2)n -o •0736
0372(/z) 0659(/£)------------------- H3 7 • 0 4 9 9 ( 1 ) 2 )
Fig. 3 (Dog F.V.).—Two series of curves from the sulcus to inferior cava, charted in relation to the first deflection of the S.A.N. lead ( S . A . N . .line). The points of contact adopted are shown in fig. 14.Ordinates 1 cm. = 3• 5 millivolts; abscissae 1 mm. = 0'02 second. The bracketed figures represent scale divisions ( i.e . millimetres) on our curves.
on May 31, 2018http://rstb.royalsocietypublishing.org/Downloaded from
400 MESSRS. T. LEWIS, J. MEAKlNS, AND P. I). WHITE ON THE
uniform and receding series as regards the standard S.A.N. time line. In its progress the excitation wave passes uniformly along the and the musculaturesurrounding the inferior cava. Each intrinsic deflection is a spike of considerable voltage (3 to 9’45 millivolts). A precisely similar conclusion is to be drawn from the culminations of these deflections, for they represent the approximate onsets of the excitation wave in the distal contacts. If we examine the extrinsic deflections there is no such uniformity, the first three appear at practically the same time instant, the last five appear at almost the same time instant. Positivity of the proximal, as opposed to the distal, contact is most conspicuous in lead (e)-(f), (f)-(g), and (g)-(h).These leads cover the root of the cava and overlie strong bands of septal musculature, which pass across the line of lead. It is a region of the dog’s heart from which we almost invariably obtain prominent extrinsic effects, and we attribute them to the radiation of currents from muscle lying deeply beneath the contact area. The currents which produce them, in the present instance, are evidently of much the same origin in the last six curves. The last curve of this series was taken from the wall of the vein outside the area of auricular muscle. I t shows no intrinsic deflection, but the extrinsic deflections remain, though they are reduced in amplitude. We see the same sudden reduction of the chief deflection (see fig. 15) in the second series, which includes a greater number of vein leads (fig. 14). Here, too, we observe the constancy of the extrinsic deflections in point of time, and of each wave in the curves, once the muscular region is passed. Small upward deflections are present in leads (h)-(i)and (m)-(n), and these deflections recede a little in time; they may be attributed to the last stage in the journey of the excitatory process, for contacts (m) and (/?) are immediately distal to the edge of a muscular fan. But, as the line is followed lower, recession ceases, for the current recorded in the most distal regions is but spread from the same adjoining piece of muscle, and the deflections are, in our sense, extrinsic.
Thus, our observations upon the inferior cava provide a complete corroboration of our crush experiments, and show clearly that in direct leads from the heart two factors are responsible for the curves ; namely, currents found immediately beneath the contacts, and currents conducted from the surrounding regions which are also entering the state of excitation. That the latter may interfere to an appreciable extent in radial leads, or that they introduce a serious source of fallacy in measuring the onset of the excitatory process once the nature o f the several deflections is , seemsto us improbable.
We have obtained similar results from the superior cava (fig. 16 and Table X), with this difference, the extrinsic deflections were not continued in extrainuscular leads, to the same extent as in the inferior caval leads. For this difference there is a satisfactory explanation. The cuff of muscle upon the inferior cava is short and mainly intrapericardial; upon the superior cava it is much longer and largely extra- pericardial. The first extramuscular leads in the upper vein are not exposed to
on May 31, 2018http://rstb.royalsocietypublishing.org/Downloaded from
EXCITATORY PROCESS IN THE DOG’S HEART. 401
closely adjoining auricular muscle, excepting the thin cuff itself, as are those upon the lower vein.
Observations upon the Node.E y st e r and M e e k believe they have evidence of a special conducting path between
S-A node and A -V node. They interpret curves obtained by diagonal leads, i.e., from a contact over the A -V node to a contact upon the coronary sinus or body of the auricle, as showing that the node receives the excitation wave materially in advance of the last-named structures in a number of experiments. These diagonal leads we deal with subsequently ; they are open to objection. The same writers state that the excitation wave reaches the A -V node in time intervals of 0*02-0*005 second ; in obtaining which figures they adopt single contacts over node and an indifferent point and take such curves simultaneously with a curve of mechanical shortening in the auricle as a standard. From the curves which they publish we think it highly improbable that accurate readings of the intrinsic deflections have been obtained.
In taking our septal leads we have on several occasions successfully attempted to place our contacts over the A -V node ; as has been demonstrated to us by subsequent examination of the contact and by sections of the underlying tissue. We obtain early and prominent extrinsic deflections in this region of the heart, but the onset of the intrinsic deflection is late, and occurs from 0*0317 to 0*0442 second after its appearance at the S-A node (Table VII).# Measuring the distances between the nodes along the septum and estimating the conduction rate to A -V nodal region, we can discover no material divergence between conduction to this region and to the remainder of the auricular walls and septum. We think that this result is a natural one, for we lead, not from A -V node itself, but from septal muscle overlying it. It is not possible to place a contact upon the node itself, this structure being buried. Nevertheless, if the node received the excitation wave by some special path and this wave spread immediately to the surrounding auricular muscle, as E y ste r and M e e k (3) suppose, then we should anticipate an early appearance of the wave in the region from which we lead. As a matter of fact we fail to find it. But this negative answer does not entirely preclude a quick line of conduction, for it is conceivable that there may be no spread to auricle from A -V node but only spread to ventricle once the excitation wave has reached the node. Having this in mind, we have used an entirely different method of estimating the transmission interval between the two nodes. If a lead tube, through which iced water may be conveyed, is laid along the whole line of the sulcus and well in contact with it, upon cooling the sulcus the rhythm of the heart alters and the pacemaker is transferred from S-A node to A - V node, and auricle and ventricle beat simultaneously. But at the transition there are contractions of the auricle of a peculiar kind (fig. 17). The rate of the S-A rhythm
* A control S.A.N. lead was always taken after the introduction of the internal contacts.V O L . C C Y .— B . 3 E
on May 31, 2018http://rstb.royalsocietypublishing.org/Downloaded from
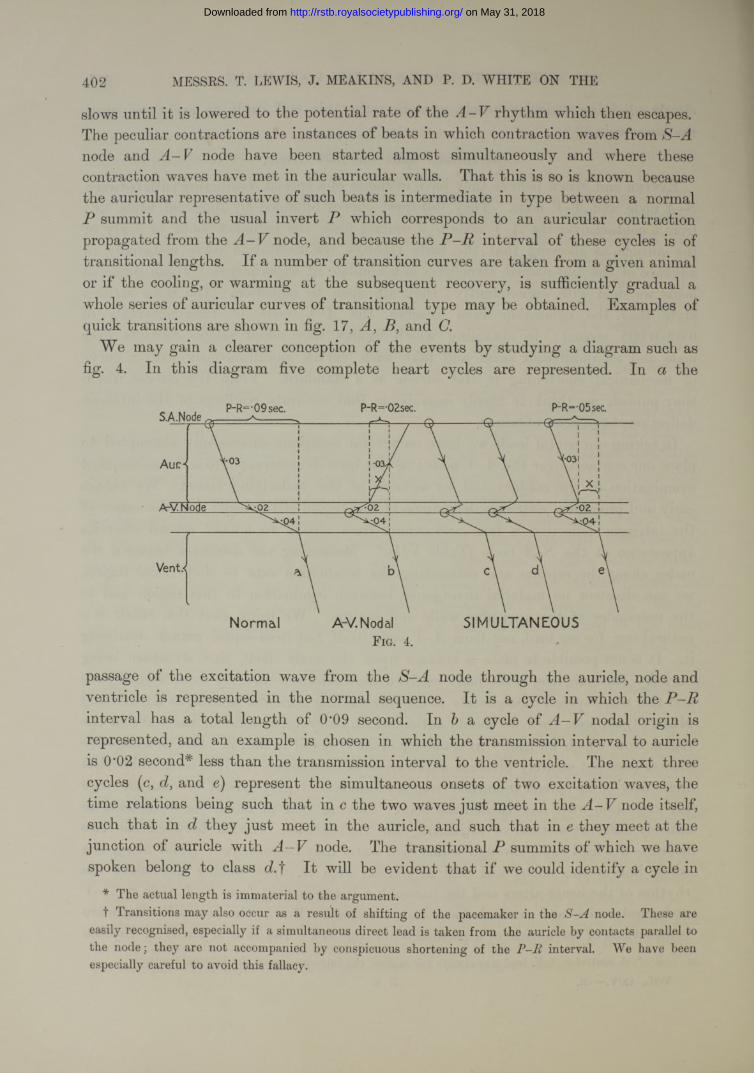
402 MESSRS. T. LEWIS, J. MEAKINS, AND P. D. WHITE ON THE
slows until it is lowered to the potential rate of the A -V rhythm which then escapes. The peculiar contractions are instances of beats in which contraction waves from S-A node and A -V node have been started almost simultaneously and where these contraction waves have met in the auricular walls. That this is so is known because the auricular representative of such beats is intermediate in type between a normal P summit and the usual invert P which corresponds to an auricular contraction propagated from the A -V node, and because the P -R interval of these cycles is of transitional lengths. If a number of transition curves are taken from a given animal or if the cooling, or warming at the subsequent recovery, is sufficiently gradual a whole series of auricular curves of transitional type may be obtained. Examples of quick transitions are shown in fig. 17, A, B, and C.
We may gain a clearer conception of the events by studying a diagram such as fig. 4. In this diagram five complete heart cycles are represented. In a the
S.A.Node
A-V. Node < 0 2 r
SIMULTANEOUSNormal A-V. NodalF ig. 4.
passage of the excitation wave from the S-A node through the auricle, node and ventricle is represented in the normal sequence. It is a cycle in which the P—R interval has a total length of 0*09 second. In a cycle of nodal origin isrepresented, and an example is chosen in which the transmission interval to auricle is 0'02 second* less than the transmission interval to the ventricle. The next three cycles (c, d, and e) represent the simultaneous onsets of two excitation waves, the time relations being such that in c the two waves just meet in the A -V node itself, such that in d they just meet in the auricle, and such that in e they meet at the junction of auricle with A -V node. The transitional summits of which we have spoken belong to class d.f It will be evident that if we could identify a cycle in
* The actual length is immaterial to the argument.T Transitions may also occur as a result of shifting of the pacemaker in the node. These are
easily recognised, especially if a simultaneous direct lead is taken from the auricle by contacts parallel to the node; they are not accompanied by conspicuous shortening of the interval. We have been especially careful to avoid this fallacy.
on May 31, 2018http://rstb.royalsocietypublishing.org/Downloaded from
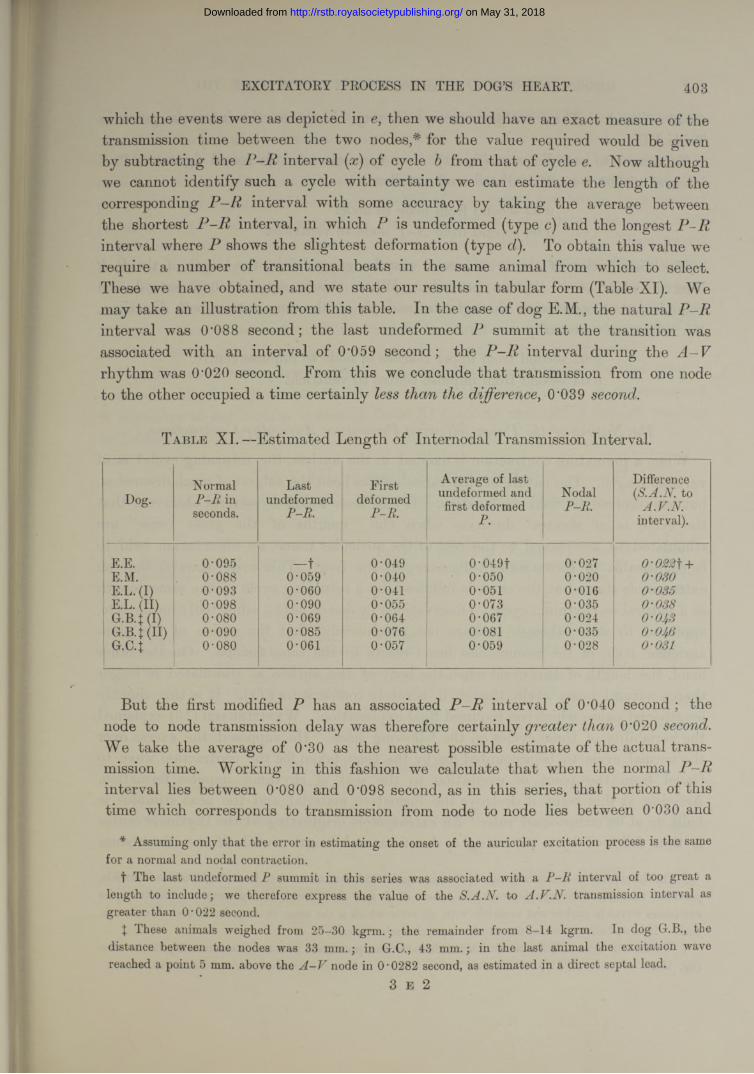
EXCITATORY PROCESS IN THE DOG’S HEART. 403
which the events were as depicted in e, then we should have an exact measure of the transmission time between the two nodes,* for the value required would be given by subtracting the P-Rinterval (x) of cycle b from that of cycle Now although we cannot identify such a cycle with certainty we can estimate the length of the corresponding P -R interval with some accuracy by taking the average between the shortest P -R interval, in which P is undeformed (type c) and the longest P -R interval where P shows the slightest deformation (type To obtain this value we require a number of transitional beats in the same animal from which to select. These we have obtained, and we state our results in tabular form (Table XI). We may take an illustration from this table. In the case of dog E.M., the natural P-R interval was (P088 second; the last undeformed summit at the transition was associated with an interval of 0*059 second; the P -R interval during the rhythm was 0’020 second. From this we conclude that transmission from one node to the other occupied a time certainly less t the difference, 0'039 second.
T a ble XL —Estimated Length of Internodal Transmission Interval.
Dog.Normal
P -R in seconds.
Lastundeformed
P-R.
Firstdeformed
P-R.
Average of last undeformed and first deformed
P.
NodalP-R.
Difference (S.A.N. to
A.V.N. interval).
E.E. 0-095 —t 0-049 0-049f 0-027 0-022 f +E.M. 0-088 0-059 0-040 0-050 0-020 0-030E.L. (I) 0-093 0-060 0-041 0-051 0-016 0-035E.L. (II) 0-098 0-090 0-055 0-073 0-035 0-088G.B.J (I) 0-080 0-069 0-064 0-067 0-024 0-053
1 G.B.J(II) 0-090 0-085 0-076 0-081 0-035 0-056G.C.J 0-080 0-061 0-057 0-059 0-028 0-031
But the first modified P has an associated P -R interval of 0*040 second ; the node to node transmission delay was therefore certainly greater than 0*020 second. We take the average of 0*30 as the nearest possible estimate of the actual transmission time. Working in this fashion we calculate that when the normal P -R interval lies between (P080 and 0*098 second, as in this series, that portion of this time which corresponds to transmission from node to node lies between 0*030 and
* Assuming only that the error in estimating the onset of the auricular excitation process is the same for a normal and nodal contraction.
t The last undeformed P summit in this series was associated with a P -R interval of too great a length to include; we therefore express the value of the S.A.N. to A.V.N. transmission interval as greater than O'022 second.
t These animals weighed from 25-30 kgrm .; the remainder from 8-14 kgrm. In dog G.B., the distance between the nodes was 33 mm.; in G.C., 43 mm.; in the last animal the excitation wave reached a point 5 mm. above the A - V node in O’0282 second, as estimated in a direct septal lead.
3 E 2
on May 31, 2018http://rstb.royalsocietypublishing.org/Downloaded from
404 MESSES. T. LEWIS, J. MEAKINS, AND P. D. WHITE ON THE
0*046 second. These values correspond very closely to the intervals given in Table VII.
To return to our diagram (fig. 4), in a type case and in round figures a interval of 0*09 second"' is distributed as follows :—
0*03 second from node to node.0*06 second from A —V node to ventricle.
The distribution of the 0*06 second may be gauged from the length of the P -R interval while A -V rhythm prevails. When this is equal to 0*02 second, and assuming that conduction through the node is at the same rate in both directions,
t]le values are necessarily—
0*02 second from upper reaches of node to impulse centre.0*04 second from impulse centre to ventricle.
The Nature of the Pause following Premature Auricular Contractions.
When a premature contraction is excited in the auricle, the returning eyelet is of variable length. The nature of this variation has been the subject of much discussion, but has received no final explanation. It has been found by several observers that the cycle is of shortest duration when the “ mouths of the great veins ” are stimulated (6), as opposed to the rest of the auricular tissue, an observation held to be comparable to E n g elm a nn’s discovery in the frog. This writer showed that an extrasystole started at the sinus is followed by a returning cycle of the same length as a natural or rhythmic cycle. Observations by one of us (8), admittedly incomplete, appeared to show, though perhaps not conclusively, that the region of the sino- auricular node of . the mammalian heart reacts in the same fashion. On the other hand, the length of this cycle when the body of the auricle is stimulated is longer than a natural heart cycle, though it is rarely compensatory (1). It is this slightly lengthened pause which has required final explanation. W en ck eba ch (13) explained the variability of these cycles on the following lines. He supposed the excess over the normal cycle to be accounted for by the time taken for the contraction wave to travel from the point of excitation to the seat of rhythmic impulse formation. Arriving at this point it destroys the formative material, and the next stimulus is built up at its accustomed rate. An extrasystole originating at the rhythmic centre is thus followed by a returning cycle of natural length ; while if the disturbance
* This interval is an accurate gauge of the passage of the excitation wave from S -A node to ventricle, provided that the difference between the onsets of P and in Lead I I represent the onsets of the excitation waves in auricle and ventricle with an error which is the same in magnitude and direction in both. This we believe we can show to be approximately the case.
t We use this term to indicate the interval between the premature beat and the succeeding contraction (fig. 18).
on May 31, 2018http://rstb.royalsocietypublishing.org/Downloaded from
EXCITATORY PROCESS IN THE DOG’S HEART. 405
starts in some extraneous point, the natural duration is increased by the transmission time from the point stimulated to the pacemaker.
This view we have put to the direct test in our vagotomised dogs. Our experiments have been conducted as follows :—We measure the time lost in transmission from the point of initial negativity, the upper reaches of the sulcus to a desiredpoint, as a rule the right appendix. Subsequently, we stimulate this point with single induction shocks and obtain a number of forced beats from it. These forced beats have varying degrees of prematurity ; and, as the length of the returning cycle varies to some slight extent according to its prematurity, being longer the more premature the contraction,* we chose from our series the latest premature contractions (tig. 18). The cycles are then measured and the difference between the length of the returning cycle and the average of two initial or normal cycles is estimated.
This difference is compared with the transmission time estimated for the point in question. We find the values to be the same within small errors of measurement. A summary of our results is seen in Table XIV and an example of the full readings in Tables X II and X III.
T a ble X II.—Length of Returning Cycle.(R.C. = returning cycle; I.C., initial cycle; P.B., premature beat.)
Site of stimulation.
Initial cycles,P-P.
Forcedcycle,P-P.
Returningcycle,P-P.
Excess of R.C. over
I.C.
Excess in case of
latest P.R.
S.A.N. to point
stimulated (see Table
XIII).
Right appendix . 0-3933 0-3922 0-3186 0-4269 0-03421Right appendix . 0-3897 0-3890 0-3485 0-4120 0-0227
0-0227 0-0190LV.C. . . . . 0-4016 0-4054 0-3628 0-4365 0-0330fI.F.C. . 0-4133 0-4159 0-3772 0-4375 0-0229
0-0229 0-0228
T a b le X III.—Transmission Interval.
Deflections of simultaneous leads. Cycle I. Cycle II. Cycle III. Average.S.A.N. to
pointinvestigated.
S.A.N. deflection to P....P to intrinsic deflection of right appendix . P to intrinsic deflection of lead
0-00770-01180-0157
0-00790-01140-0140
0-00820-01020-0149
0-0079 00111 0-0149
0-01900-0228
* The reason for the greater delay is, according to the supposition, decreased rate of conduction, t Discarded because the forced beats in the other instances were less premature.
on May 31, 2018http://rstb.royalsocietypublishing.org/Downloaded from
T able XIV.—Length of Returning Cycle and corresponding Transmission Interval.
406 MESSRS. T. LEWIS, J. MEAKINS, AND P. D. WHITE ON THE
Dog.Time lost
in travelling.Excess of returning
over initial cycle. Point of stimulation.
F.D. 0-0265 0-0255 Right appendix.F.E. 0-0487 0-0446 77 77F.F. 0-0141 0-0088 77 7)F.G. { 0-0190 0-0227 77 77
0-0228 0-0229 I.V.C.F.H. 0-0422 0-0442 Right appendix.F.L. 0-0324 0-0278 77 77F.M. 0-0363 0-0424 77 77
Averages. . 0-0302 0-0298
On the assumption that the speed of travel through the auricle is the same in both directions, the time so lost is, according to our findings, sufficient to account for the lengthening of the returning cycle. W e n c k e b a c h ’s explanation holds good, therefore, in so far as it applies to hearts undisturbed by changes in vagal tone over the temporary period of disordered heart action.
Observations upon the Vagus.We were anxious during the course of our experiments to ascertain the degree of
variation in the rate of conduction to various points as a result of possible change in the condition of the h e a r t; for sufficient changes might possibly occur to vitiate our comparisons of different muscle regions. Eventually we have been able to exclude this source of fallacy by repeated observations upon the same area during the course of an experiment (see Table I), and by multiplying our experiments. But, at an earlier stage, we thought it desirable to test the effect of vagal stimulation upon the heart and to compare the rates of conduction before and during stimulation. For this purpose we first used the left vagus, because it has a relatively small effect upon the rate of the auricle and because under stimulation of this nerve conduction defects at the A-Vjunction are well displayed for comparison. Using the S.A.N. and left appendicular leads together* we estimated the transmission interval from node to appendix before and during vagal stimulation.
In some experiments, and upon stimulating the left nerve, we could detect no change in the transmission time from node to left appendix, though A -V heart- block was conspicuous in our curves. In others, we found a slight increase in the time, and at first regarded it as the result of defective conduction. But further observation has proved that this is not the case ; for, when we investigated the
* Lead II, across the whole body, was found to be unsuitable for these experiments on account of the almost constant distortion of P ,which accompanies vagal stimulation. This summit forms an inaccurate standard in the circumstances.
on May 31, 2018http://rstb.royalsocietypublishing.org/Downloaded from
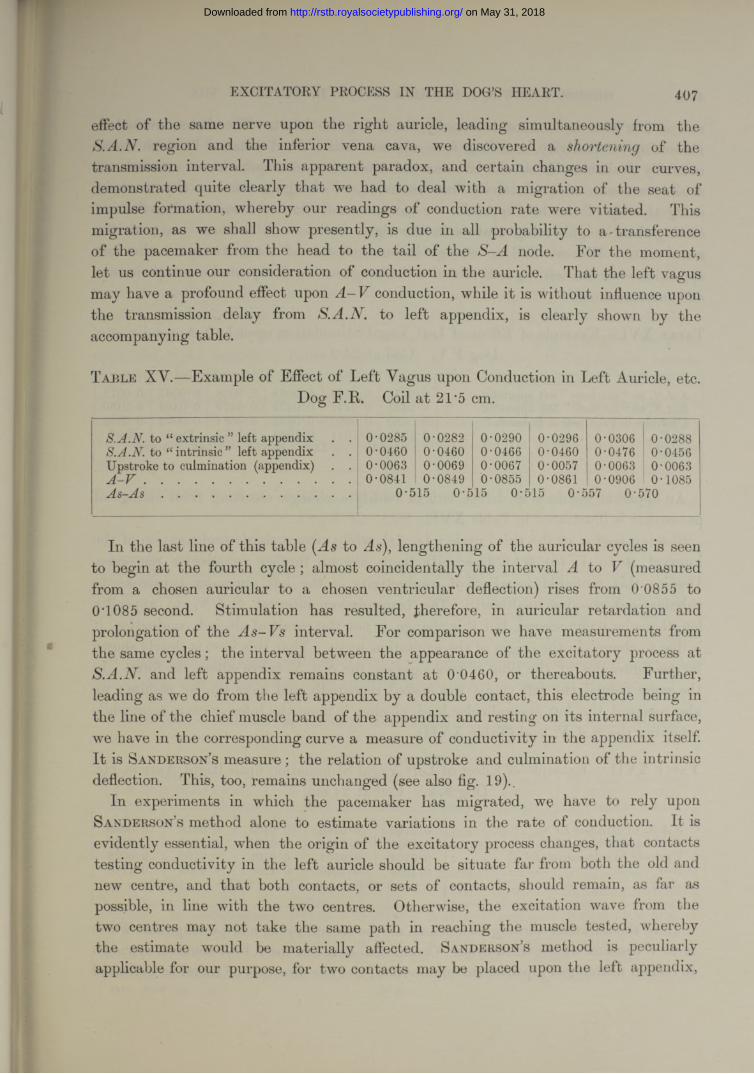
EXCITATORY PROCESS IN THE DOG’S HEART. 407
effect of the same nerve upon the right auricle, leading simultaneously from the S.A.N. region and the inferior vena cava, we discovered a shortening of the transmission interval. This apparent paradox, and certain changes in our curves, demonstrated quite clearly that we had to deal with a migration of the seat of impulse formation, whereby our readings of conduction rate were vitiated. This migration, as we shall show presently, is due in all probability to a - transference of the pacemaker from the head to the tail of the S-A node. For the moment, let us continue our consideration of conduction in the auricle. That tbe left vagus may have a profound effect upon A -V conduction, while it is without influence upon the transmission delay from S.A.N.to left appendix, is clearly shown by the accompanying table.
T a b l e XY.—Example of Effect of Left Vagus upon Conduction in Left Auricle, etc.Dog F.R. Coil at 21*5 cm.
S.A.N. to “ extrinsic ” left appendix . . 0-0285 0-0282 0-0290 0-0296 0-0306 0-0288S.A .N .to “ intrinsic ” left appendix . . 0-0460 0-0460 0-0466 0-0460 0-0476 0-0456
Upstroke to culmination (appendix) . . 0-0063 0-0069 0-0067 0-0057 0-0063 0-0063A - V .............................................................. 0-0841 0-0849 0-0855 0-0861 0-0906 0-1085A s - A s ........................................................ 0-515 0-515 0-515 0-557 0-570
In the last line of this table (As to As), lengthening of the auricular cycles is seen to begin at the fourth cycle ; almost coincidentally the interval A to V (measured from a chosen auricular to a chosen ventricular deflection) rises from 0 0855 to 0'1085 second. Stimulation has resulted, therefore, in auricular retardation and prolongation of the As-Vs interval. For comparison we have measurements from the same cycles; the interval between the appearance of the excitatory process at S.A.N. and left appendix remains constant at 0 0460, or thereabouts. Further, leading as we do from the left appendix by a double contact, this electrode being in the line of the chief muscle band of the appendix and resting on its internal surface, we have in the corresponding curve a measure of conductivity in the appendix itself. It is Sanderson’s measure ; the relation of upstroke and culmination of the intrinsic deflection. This, too, remains unchanged (see also fig. 19)..
In experiments in which the pacemaker has migrated, we have to rely upon Sanderson’s method alone to estimate variations in the rate of conduction. It is evidently essential, when the origin of the excitatory process changes, that contacts testing conductivity in the left auricle should be situate far- from both the old and new centre, and that both contacts, or sets of contacts, should remain, as far as possible, in line with the two centres. Otherwise, the excitation wave from the two centres may not take the same path in reaching the muscle tested, whereby the estimate would be materially affected. Sanderson’s method is peculiarly applicable for our purpose, for two contacts may be placed upon the left appendix,
on May 31, 2018http://rstb.royalsocietypublishing.org/Downloaded from
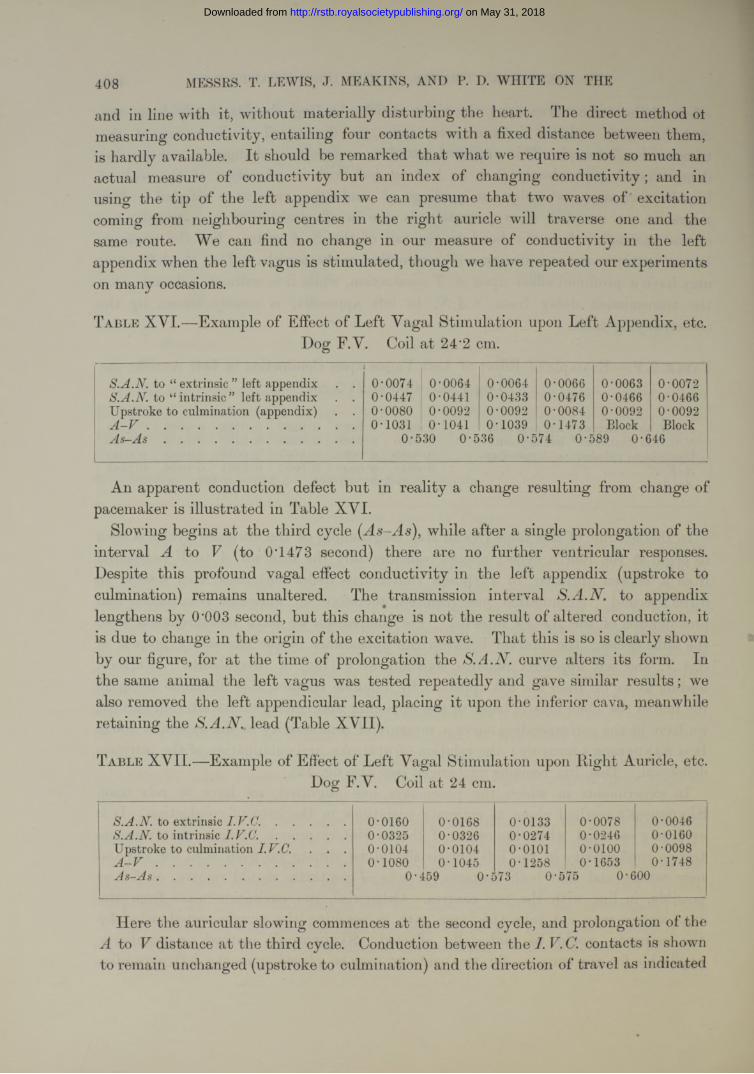
408 MESSRS. T. LEWIS, J. MEAKINS, AND P. D. WHITE ON THE
and in line with it, without materially disturbing the heart. The direct method ot measuring conductivity, entailing four contacts with a fixed distance between them, is hardly available. I t should be remarked tha t what we require is not so much an actual measure of conductivity but an index of changing conductivity; and in using the tip of the left appendix we can presume that two waves of excitation coming from neighbouring centres in the right auricle will traverse one and the same route. We can find no change in our measure of conductivity in the left appendix when the left vagus is stimulated, though we have repeated our experiments on many occasions.
T a b l e XVI.—Example of Effect of Left Vagal Stimulation upon Left Appendix, etc.Dog F.V. Coil at 24‘2 cm.
S.A.N. to “ extrinsic ” left appendix . .1
0-0074 0-0064 0-0064 0-0066 0-0063 0-0072S.A.N. to “ intrinsic ” left appendix . . 0-0447 0-0441 0-0433 0-0476 0-0466 0-0466Upstroke to culmination (appendix) . . 0-0080 0-0092 0-0092 0-0084 0-0092 0-0092A - V .............................................................. 0-1031 0-1041 0-1039 0-1473 Block BlockA s - A s ......................................................... 0-530 0-536 0-574 0-589 0-646
An apparent conduction defect but in reality a change resulting from change of pacemaker is illustrated in Table XVI.
Slowing begins at the third cycle ( As-As), while after a single prolongation of the interval A to V(to 0T473 second) there are no further ventricular responses.Despite this profound vagal effect conductivity in the left appendix (upstroke to culmination) remains unaltered. The transmission interval S.A.N. to appendix lengthens by 0'003 second, but this change is not the result of altered conduction, it is due to change in the origin of the excitation wave. That this is so is clearly shown by our figure, for at the time of prolongation the curve alters its form. Inthe same animal the left vagus was tested repeatedly and gave similar results; we also removed the left appendicular lead, placing it upon the inferior cava, meanwhile retaining the S.A.N. lead (Table XVII).
T a b l e XV II.— Example of Effect of Left Vagal Stimulation upon Light Auricle, etc.Dog F.V. Coil at 24 cm.
S.A.N. to extrinsic ..................... 0-0160 0-0168 0-0133 0-0078 0-0046S.A.N. to intrinsic I.V.C .......................... 0-0325 0-0326 0-0274 0-0246 0-0160Upstroke to culmination I.V.C.. . . 0-0104 0-0104 0-0101 o-oioo 0-0098A - V ......................................................... 0-1080 0-1045 0-1258 0-1653 0-1748A s - A s ........................................................ 0-459 0-573 0-575 0*600
Here the auricular slowing commences at the second cycle, and prolongation of the A to V distance at the third cycle. Conduction between the I. C. contacts is shown to remain unchanged (upstroke to culmination) and the direction of travel as indicated
on May 31, 2018http://rstb.royalsocietypublishing.org/Downloaded from
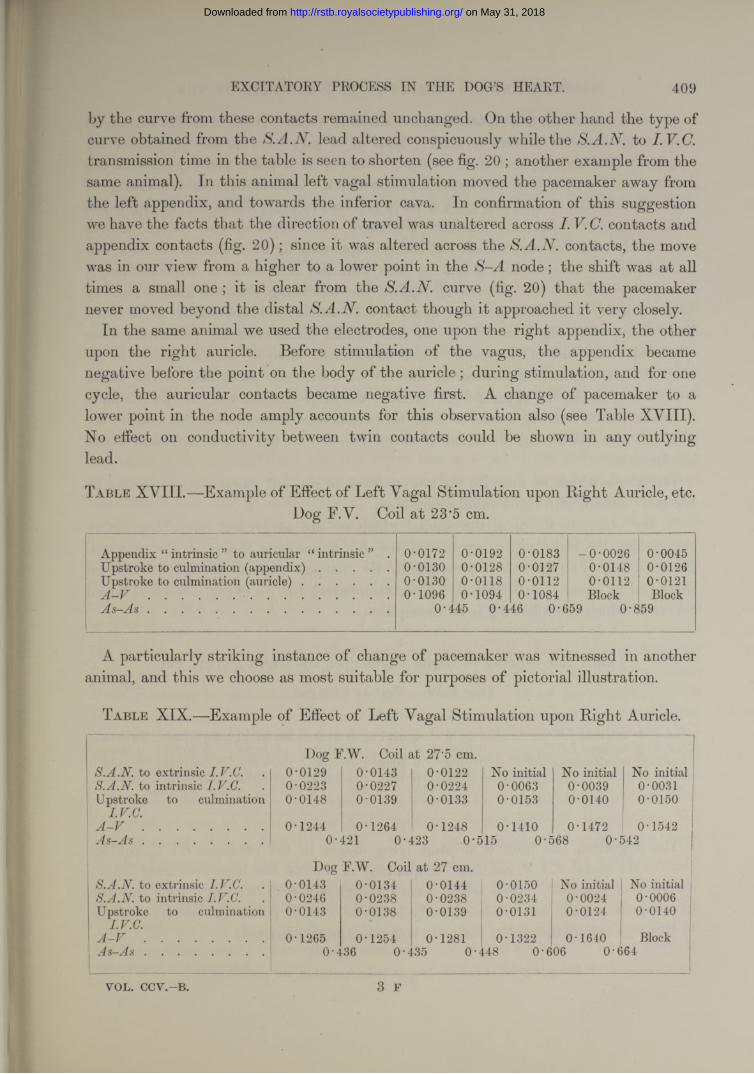
EXCITATORY PROCESS IN THE DOG’S HEART. 409
by the curve from these contacts remained unchanged. On the other hand the type of curve obtained from the S.A.N.lead altered conspicuously while the S.A.N. to I.V.C. transmission time in the table is seen to shorten (see fig. 20 ; another example from the same animal). In this animal left vagal stimulation moved the pacemaker away from the left appendix, and towards the inferior cava. In confirmation of this suggestion we have the facts that the direction of travel was unaltered across I. contacts and appendix contacts (fig. 20); since it was altered across the S.A.N. contacts, the move was in our view from a higher to a lower point in the S-A node; the shift was at all times a small one ; it is clear from the S .curve (fig. 20) that the pacemaker never moved beyond the distal S.A.N .contact though it approached it very closely.
In the same animal we used the electrodes, one upon the right appendix, the other upon the right auricle. Before stimulation of the vagus, the appendix became negative before the point on the body of the auricle; during stimulation, and for one cycle, the auricular contacts became negative first. A change of pacemaker to a lower point in the node amply accounts for this observation also (see Table XVIII). No effect on conductivity between twin contacts could be shown in any outlying lead.
T a b l e XVIII.—Example of Effect of Left Vagal Stimulation upon Bight Auricle, etc.Dog F.V. Coil at 23*5 cm.
Appendix “ intrinsic ” to auricular “ intrinsic ” . 0-0172 0-0192 0-0183 -0-0026 0-0045Upstroke to culmination (ap p e n d ix ) ..................... 0-0130 0-0128 0-0127 0-0148 0-0126Upstroke to culmination (au ric le).......................... 0-0130 0-0118 0-0112 0-0112 0-0121A - V ........................................................................ 0-1096 0-1094 0-1084 Block BlockA s - A s ........................................................................ 0-445 0-446 0-659 0-859
A particularly striking instance of change of pacemaker was witnessed in another animal, and this we choose as most suitable for purposes of pictorial illustration.
T a b l e XIX.—Example of Effect of Left Vagal Stimulation upon Right Auricle.
Dog F.W. Coil at 27’5 cm.S.A.N. to extrinsic I.V.C. 0-0129 0-0143 0-0122 No initial No initial No initialS.A.N. to intrinsic I.V.C. 0-0223 0-0227 0-0224 0-0063 0-0039 0-0031Upstroke to culmination 0-0148 0-0139 0-0133 0-0153 0-0140 0-0150
i I.V.C.' A - V .................................... 0-1244 0-1264 0-1248 0-1410 0-1472 0-1542
A s - A s .................................... 0-421 0-423 0-515 0-568 0-542
Dog F.W. Coil at 27 cm.S.A.N. to extrinsic I.V.C. 0-0143 0-0134 0-0144 0-0150 No initial No initialS.A.N. to intrinsic I.V.C. 0-0246 0-0238 0-0238 0-0234 0-0024 0-0006Upstroke to culmination 0-0143 0-0138 0-0139 0-0131 0-0124 0-0140
I.V.C.A - V .................................... 0-1265 0-1254 0-1281 0-1322 0-1640 Blockj4s—a4.s .................................... 0-436 0-435 0-448 0 ‘606 0-664
3 FVOL. CCV.-B.
on May 31, 2018http://rstb.royalsocietypublishing.org/Downloaded from
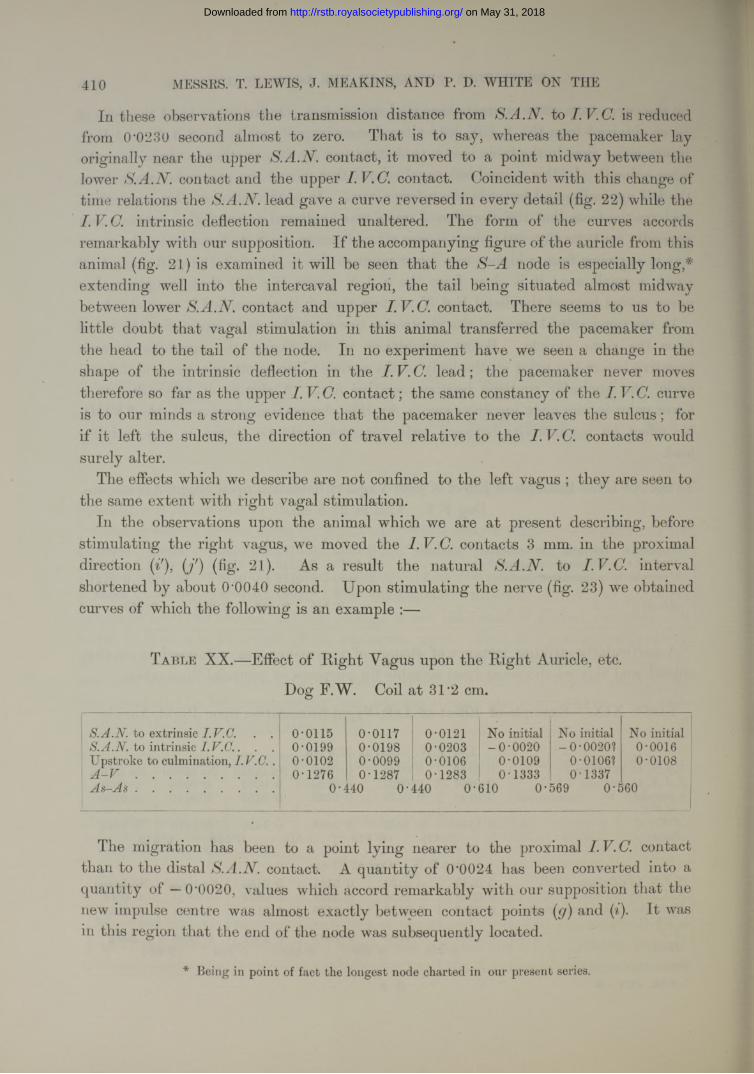
410 MESSRS. T. LEWIS, J. MEAKINS, AND P. D. WHITE ON THE
In these observations the transmission distance from S.A.N. is reducedfrom 0'0230 second almost to zero. That is to say, whereas the pacemaker lay originally near the upper S.A.N. contact, it moved to a point midway between the lower S.A.N. contact and the upper I. V.C. contact. Coincident with this change of time relations the S.A.N. lead gave a curve reversed in every detail (fig. 22) while the I. V.C. intrinsic deflection remained unaltered. The form of the curves accords remarkably with our supposition. If the accompanying figure of the auricle from this animal (fig. 21) is examined it will be seen that the S-A node is especially long,* extending well into the intercaval region, the tail being situated almost midway between lower S.A.N.contact and upper I.V.C. contact. There seems to us to be little doubt that vagal stimulation in this animal transferred the pacemaker from the head to the tail of the node. In no experiment have we seen a change in the shape of the intrinsic deflection in the I. V. C. lead; the pacemaker never moves therefore so far as the upper I. V.C. contact; the same constancy of the I. V.C. curve is to our minds a strong evidence that the pacemaker never leaves the sulcus; for if it left the sulcus, the direction of travel relative to the I. V. C. contacts would surely alter.
The effects which we describe are not confined to the left vagus ; they are seen to the same extent with right vagal stimulation.
In the observations upon the animal which we are at present describing, before stimulating the right vagus, we moved the 1. V. C. contacts 3 mm. in the proximal direction (if), (j') (fig. 21). As a result the natural S.A.N. to I.V.C. interval shortened by about (P0040 second. Upon stimulating the nerve (fig. 23) we obtained curves of which the following is an example :—
T a b l e XX.— Effect of Right Vagus upon the Right Auricle, etc.
Dog F.W. Coil at 31*2 cm.
S.A.N. to extrinsic I.V.C. . . 0-0115 0-0117 0-0121 No initial No initial No initialS.A .N .to intrinsic I.V .C .. . . 0-0199 0-0198 0-0203 -0-0020 -0-0020? 0-0016
Upstroke to culmination, I.V .C .. 0-0102 0-0099 0-0106 0-0109 0-0106? 0-0108A - V ......................................... 0-1276 0-1287 0-1283 0-1333 0-1337A s - A s ......................................... 0-440 0-440 0-i610 0-569 0-560
The migration has been to a point lying nearer to the proximal 1. V. C. contact than to the distal S.A.N. contact. A quantity of 0'0024 has been converted into a quantity of — 0’0020, values which accord remarkably with our supposition that the new impulse centre was almost exactly between contact points (g) and (i). It was in this region that the end of the node was subsequently located.
* Being in point of fact the longest node charted in our present series.
on May 31, 2018http://rstb.royalsocietypublishing.org/Downloaded from
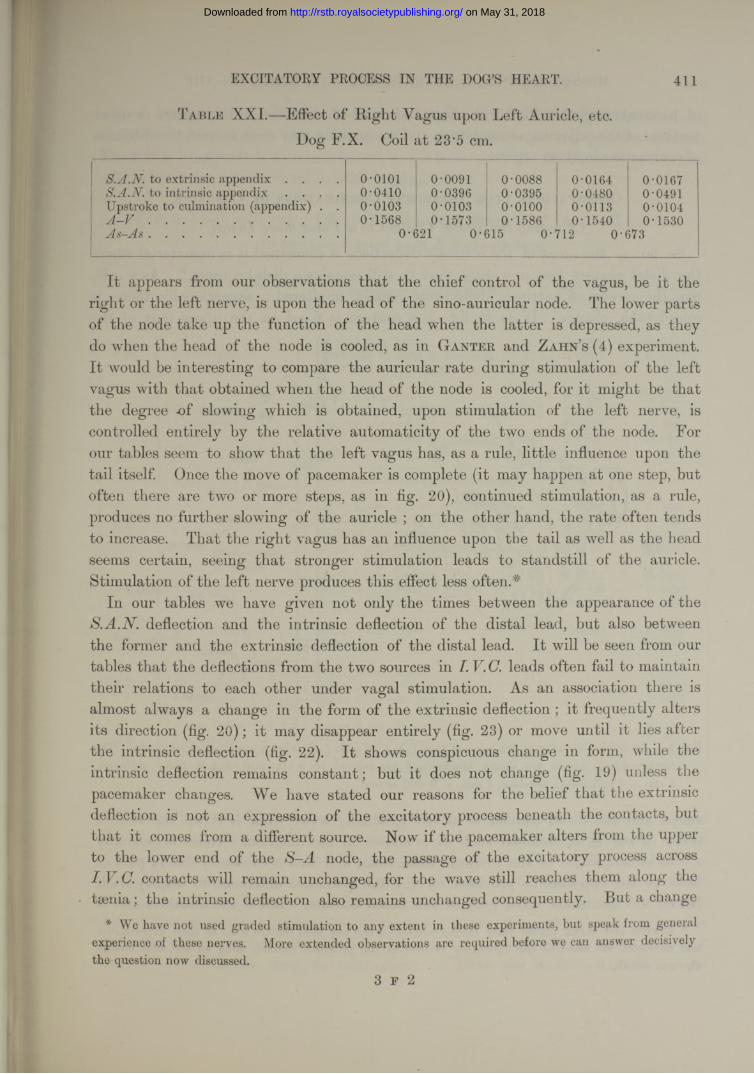
EXCITATORY PROCESS IN THE DOG’S HEART. 411
T a b l e XXI.—Effect of Eight Vagus upon Left Auricle, etc. Dog F.X. Coil at 23'5 cm.
S.A.N. to extrinsic appendix . . . . 0-0101 0-0091 0-0088 0-0164 0-0167S.A.N. to intrinsic appendix . . . . 0-0410 0-0396 0-0395 0-0480 0-0491Upstroke to culmination (appendix) . . 0-0103 0-0103 o-oioo 0-0113 0-0104
A -V ......................................................... 0-1568 0-1573 0-1586 0-1540 0-1530j1s—a4.s . . ............................................... 0-621 0-615 0-712 0-673
I t appears from our observations that the chief control of the vagus, be it the right or the left nerve, is upon the head of the sino-auricular node. The lower parts of the node take up the function of the head when the latter is depressed, as they do when the head of the node is cooled, as in Ganter and Zahn’s (4) experiment. I t would be interesting to compare the auricular rate during stimulation of the left vagus with that obtained when the head of the node is cooled, for it might be that the degree -of slowing which is obtained, upon stimulation of the left nerve, is controlled entirely by the relative automaticity of the two ends of the node. For our tables seem to show that the left vagus has, as a rule, little influence upon the tail itself. Once the move of pacemaker is complete (it may happen at one step, but often there are two or more steps, as in fig. 20), continued stimulation, as a rule, produces no further slowing of the auricle ; on the other hand, the rate often tends to increase. That the right vagus has an influence upon the tail as well as the head seems certain, seeing that stronger stimulation leads to standstill of the auricle. Stimulation of the left nerve produces this effect less often.*
In our tables we have given not only the times between the appearance of the S.A.N. deflection and the intrinsic deflection of the distal lead, but also between the former and the extrinsic deflection of the distal lead. It will be seen from our tables that the deflections from the two sources in leads often fail to maintaintheir relations to each other under vagal stimulation. As an association there is almost always a change in the form of the extrinsic deflection ; it frequently alters its direction (fig. 20); it may disappear entirely (fig. 23) or move until it lies after the intrinsic deflection (fig. 22). It shows conspicuous change in form, while the intrinsic deflection remains constant; but it does not change (fig. 19) unless the pacemaker changes. We have stated our reasons for the belief that the extrinsic deflection is not an expression of the excitatory process beneath the contacts, but that it comes from a different source. Now if the pacemaker alters from the upper to the lower end of the S-A node, the passage of the excitatory process across I. V.C.contacts will remain unchanged, for the wave still reaches them along thetaenia; the intrinsic deflection also remains unchanged consequently. But a change
* We have not used graded stimulation to any extent in these experiments, but speak from general experience of these nerves. More extended observations are required before we can answer decisively the question now discussed.
3 F 2
on May 31, 2018http://rstb.royalsocietypublishing.org/Downloaded from
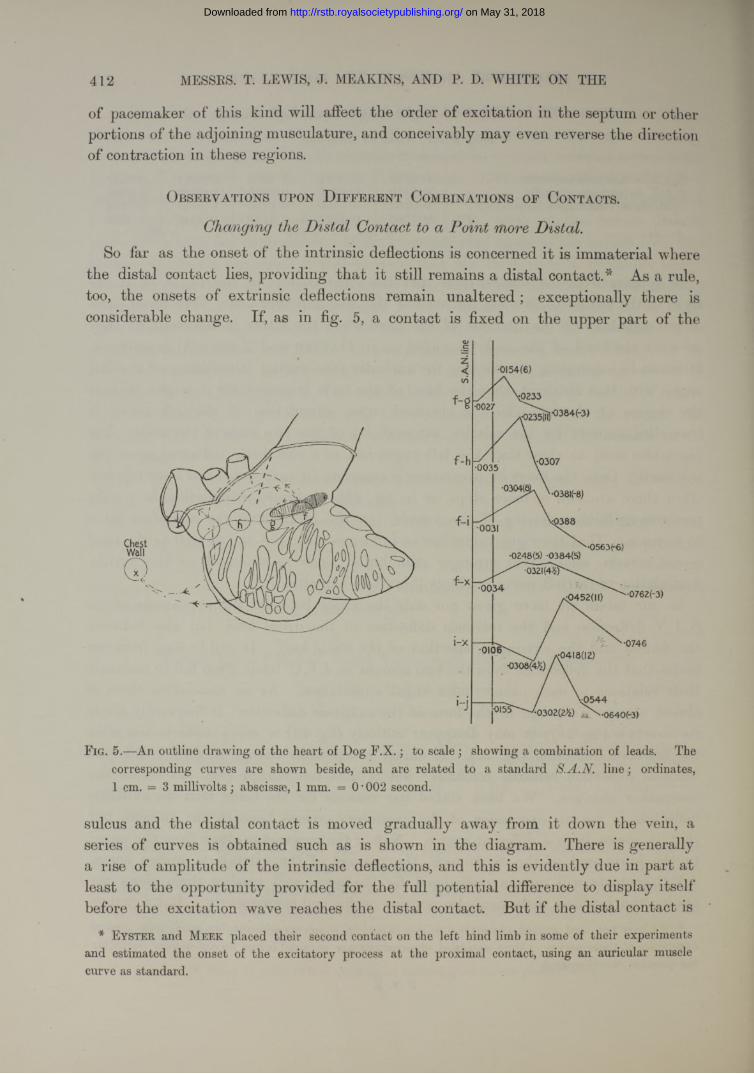
412 MESSRS. T. LEWIS, J. MEAKINS, AND P. D. WHITE ON THE
of pacemaker of this kind will affect the order of excitation in the septum or other portions of the adjoining musculature, and conceivably may even reverse the direction of contraction in these regions.
Observations upon D ifferent Combinations of Contacts.
Changing the Distal Contact to a Point more Distal.So far as the onset of the intrinsic deflections is concerned it is immaterial where
the distal contact lies, providing that it still remains a distal contact.* As a rule, too, the onsets of extrinsic deflections remain unaltered ; exceptionally there is considerable change. If, as in fig. 5, a contact is fixed on the upper part of the
•0154(6)
V-0307
•0248(5) -0384(5)
^032if4^p\•0 0 3 4 •0762(-3)
•0746
/ \ 0 5 4 4'•0302(2^) ^ \ - 0 6 4 0 ( - 3 )
F ig. 5.—An outline drawing of the heart of Dog F .X .; to scale ; showing a combination of leads. The corresponding curves are shown beside, and are related to a standard S.A.N. line; ordinates, 1 cm. = 3 millivolts; abscissae, 1 mm. = 0 • 002 second.
sulcus and the distal contact is moved gradually away from it down the vein, a series of curves is obtained such as is shown in the diagram. There is generally a rise of amplitude of the intrinsic deflections, and this is evidently due in part at least to the opportunity provided for the full potential difference to display itself before the excitation wave reaches the distal contact. But if the distal contact is
* E y s t e r and M e e k placed their second contact on the left hind limb in some of their experiments and estimated the onset of the excitatory process at the proximal contact, using an auricular muscle curve as standard.
on May 31, 2018http://rstb.royalsocietypublishing.org/Downloaded from
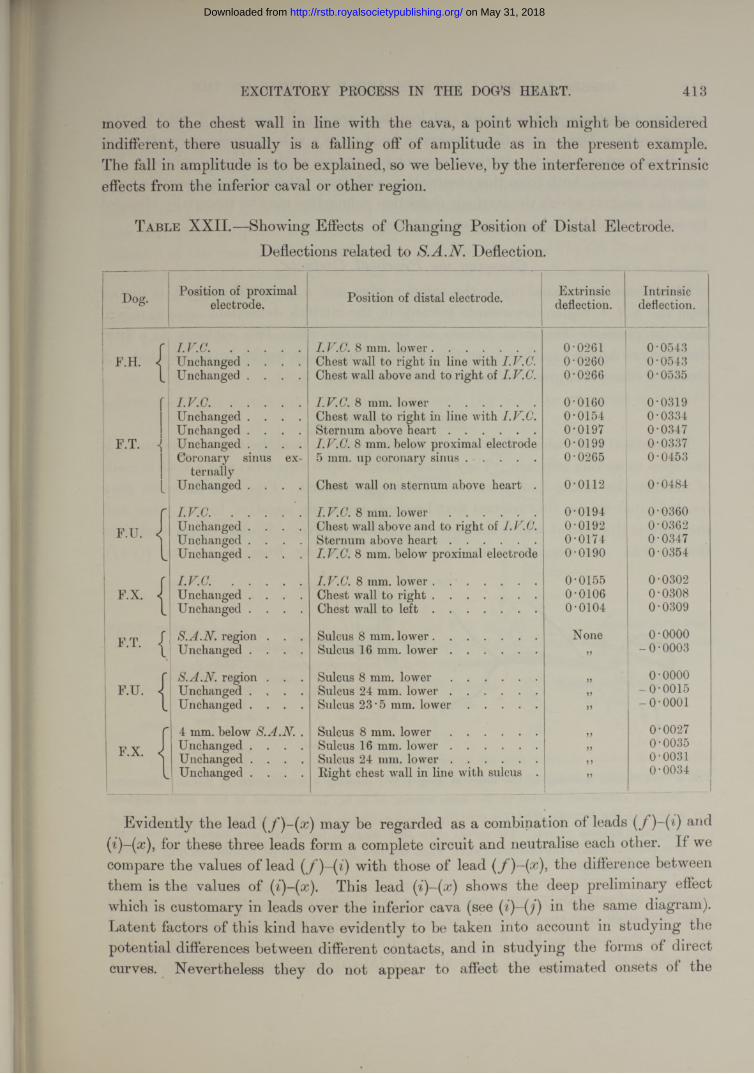
EXCITATORY PROCESS IN THE DOG’S HEART. 413
moved to the chest wall in line with the cava, a point which might be considered indifferent, there usually is a falling off of amplitude as in the present example. The fall in amplitude is to be explained, so we believe, by the interference of extrinsic effects from the inferior caval or other region.
Table XX II.—Showing Effects of Changing Position of Distal Electrode. Deflections related to Deflection.
I ~Dog. Position of proximal
electrode. Position of distal electrode. Extrinsicdeflection.
Intrinsicdeflection.
r I . V . C . ..................... I.V.C. 8 mm. lower............................... 0-0261 0-0543F.H. 1 Unchanged . . . . Chest wall to right in line with I.V.C. 0-0260 0-0543
1Unchanged . . . . Chest wall above and to right of I.V.C. 0-0266 0-0535
f I .V .C . ..................... I.V.C. 8 mm. l o w e r .......................... 0-0160 0-0319Unchanged . . . . Chest wall to right in line with I.V.C. 0-0154 0-0334Unchanged . . . . Sternum above h e a r t .......................... 0-0197 0-0347
: f .t . <> Unchanged . . . . I.V.C. 8 mm. below proximal electrode 0-0199 0-0337Coronary sinus ex 5 mm. up coronary s in u s ..................... 0-0265 0-0453
ternally- Unchanged . . . . Chest wall on sternum above heart . 0-0112 0-0484
r I.V.C. . . . . . I.V.C. 8 mm. l o w e r .......................... 0-0194 0-03601 F.U. J Unchanged . . . . Chest wall above and to right of 0-0192 0-0362
Unchanged . . . . Sternum above h e a r t .......................... 0-0174 0-0347l Unchanged . . . . I.V.C. 8 mm. below proximal electrode 0-0190 0-0354
r I . V . C . ..................... I.V.C. 8 mm. lower . .......................... 0-0155 0-0302F.X. 1 Unchanged . . . Chest wall to r ig h t ............................... 0-0106 0-0308
| l Unchanged . . . . Chest wall to l e f t ............................... 0-0104 0•0309
F.T. | S.A.N. region . . .Unchanged . . . .
Sulcus 8 mm. lower...............................Sulcus 16 mm. l o w e r ..........................
None>>
o-oooo- 0•0003
r S.A.N. region . . . Sulcus 8 mm. l o w e r .......................... J5 0-0000F.U. 1 Unchanged . . . . Sulcus 24 mm. lo w e r .......................... )> -0-0015
l Unchanged . . . . Sulcus 23 • 5 mm. l o w e r ..................... )> -o -o o o i
r 4 mm. below S.A.N. . Sulcus 8 mm. l o w e r .......................... >> 0-0027
F.X. J Unchanged . . . . Sulcus 16 mm. lo w e r .......................... >> 0-0035Unchanged . . . . Sulcus 24 mm. lo w e r .......................... ) 5
0-0031l Unchanged . . . . Right chest wall in line with sulcus . J 5
0-0034____ 1
Evidently the lead ( f )~{x) may be regarded as a combination of leads an(lfor these three leads form a complete circuit and neutralise each other. If we
compare the values of lead (f)-(i) with those of lead the difference betweenthem is the values of (i)-(x). This lead shows the deep preliminary effectwhich is customary in leads over the inferior cava (see in the same diagram).Latent factors of this kind have evidently to be taken into account in studying the potential differences between different contacts, and in studying the forms of direct curves. Nevertheless they do not appear to affect the estimated onsets of the
on May 31, 2018http://rstb.royalsocietypublishing.org/Downloaded from
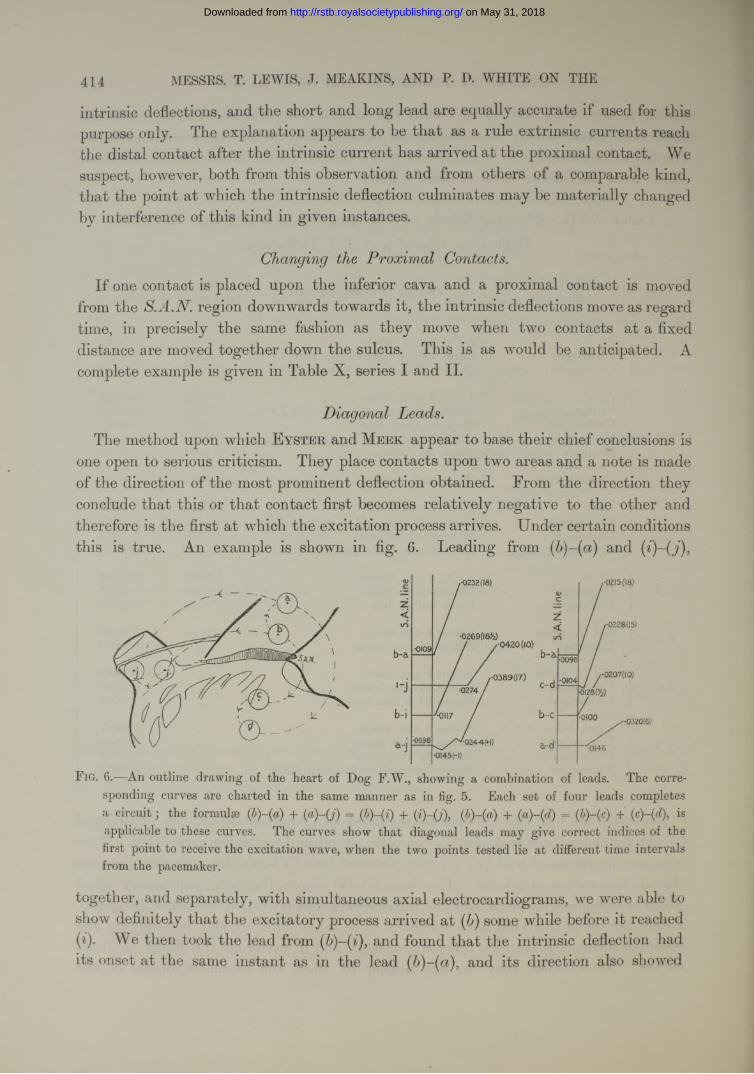
414 MESSRS. T. LEWIS, J. MEAKINS, AND P. D. WHITE ON THE
intrinsic deflections, and the short and long lead are equally accurate if used for this purpose only. The explanation appears to be tha t as a rule extrinsic currents reach the distal contact after the intrinsic current has arrived a t the proximal contact. We suspect, however, both from this observation and from others of a comparable kind, that the point at which the intrinsic deflection culminates may be materially changed by interference of this kind in given instances.
Changing the Proximal Contacts.If one contact is placed upon the inferior cava and a proximal contact is moved
from the S.A.N. region downwards towards it, the intrinsic deflections move as regard time, in precisely the same fashion as they move when two contacts at a fixed distance are moved together down the sulcus. This is as would be anticipated. A complete example is given in Table X, series I and II.
Diaaonal Leads.1/The method upon which E y ste r , and M e e k appear to base their chief conclusions is
one open to serious criticism. They place contacts upon two areas and a note is made of the direction of the most prominent deflection obtained. From the direction they conclude that this or tha t contact first becomes relatively negative to the other and therefore is the first a t which the excitation process arrives. Under certain conditions this is true. An example is shown in fig. 6. Leading from and (i)-(j),
1-0232(18)
•0420(10)
.-0389(17)
•0I45H)
,-0215(18)
,-0228(15)
-0090
- 0207(10)•0104
•0320(6)
•0146
F i g . 6.—An outline drawing of the heart of Dog F.W., showing a combination of leads. The corresponding curves are charted in the same manner as in fig. 5. Each set of four leads completes a circuit; the formulae (b)-(a) + (a)-(j) = (b)-(i) + (i)-(j), (b)-(a) + (a)-(d) = ( + isapplicable to these curves. The curves show that diagonal leads may give correct indices of the first point to receive the excitation wave, when the two points tested lie at different time intervals from the pacemaker.
together, and separately, with simultaneous axial electrocardiograms, we were able to show definitely that the excitatory process arrived at ( ) some while before it reached (i). We then took the lead from (b)-(i), and found that the intrinsic deflection had its onset a t the same instant as in the lead and its direction also showed
on May 31, 2018http://rstb.royalsocietypublishing.org/Downloaded from
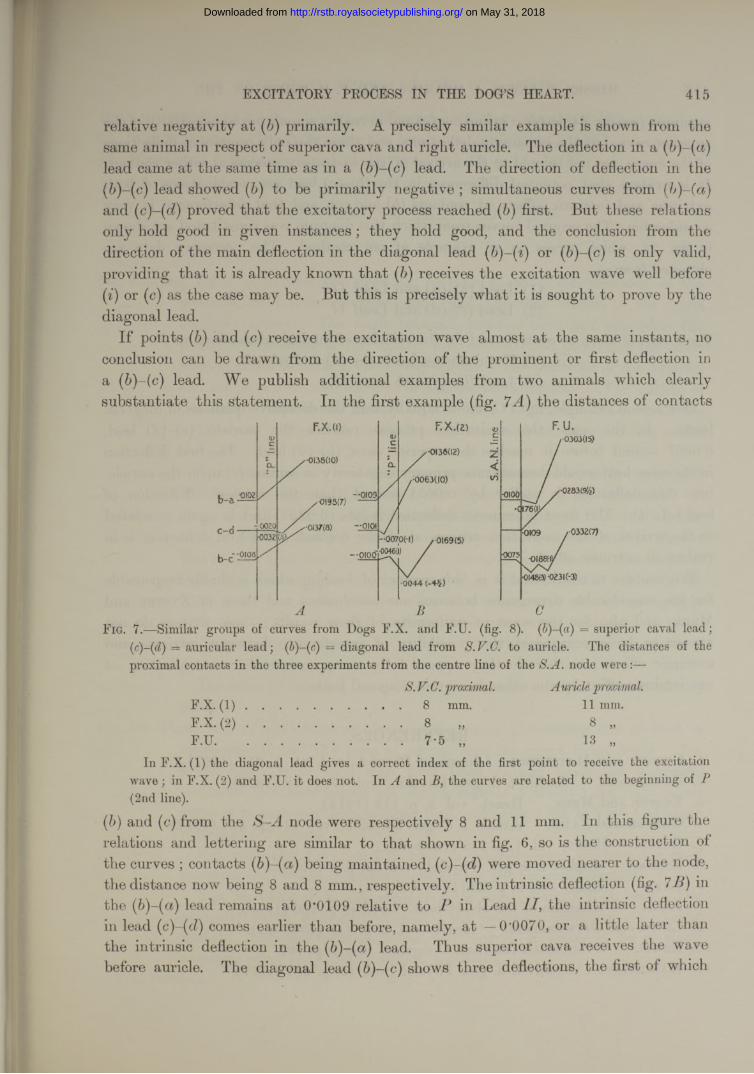
EXCITATORY PROCESS IN THE DOC’S HEART. 415
relative negativity at (b)primarily. A precisely similar example is shown from the same animal in respect of superior cava and right auricle. The deflection in a (b)-(a) lead came at the same time as in a (6)-(c) lead. The direction of deflection in the ( b)-(c) lead showed ( b) to be primarily negative; simultaneous curves from and (c)-(d) proved that the excitatory process reached first. But these relations only hold good in given instances ; they hold good, and the conclusion from the direction of the main deflection in the diagonal lead (b)-(i) or (b)-(c ) is only valid, providing that it is already known that ( b) receives the excitation wave well before (i) or (c) as the case may be. But this is precisely what it is sought to prove by the diagonal lead.
I f points ( b) and (c) receive the excitation wave almost at the same instants, no conclusion can be drawn from the direction of the prominent or first deflection in a (b)-(c) lead. We publish additional examples from two animals which clearly substantiate this statement. In the first example (fig. the distances of contacts
•0133(10)
-0193(7)
-oioo
A B
F.U./■O3O305)
r0332(7)
CF ig. 7.—Similar groups of curves from Dogs F.X. and F.U. (fig. 8). (p)-{a) = superior caval lead;
(■ c)-(d) — auricular lead; (J)-(c) = diagonal lead from S.V.G. to auricle. The distances of theproximal contacts in the three experiments from the centre line of the node were :—
S. V. C. proximal. A uricle proximal.F.X. ( I ) ..................... .....................8 mm. 11 mm.F.X. ( 2 ) ..................... .....................8 „ 8 „F.U.............................. .................... 7*5 „ 13 „
In F.X. (1) the diagonal lead gives a correct index of the first point to receive the excitation wave ; in F.X. (2) and F.U. it does not. In A and B, the curves are related to the beginning of (2nd line).
{!)) and (c) from the S-A node were respectively 8 and 11 mm. In this figure the relations and lettering are similar to that shown in fig. 6, so is the construction of the curves ; contacts (fr)-(ct) being maintained, were moved nearer to the node,the distance now being 8 and 8 mm., respectively. The intrinsic deflection (fig. 7 in the (b)-(a) lead remains at 0’0109 relative to P in Lead the intrinsic deflection in lead (c)-(d) comes earlier than before, namely, at — 0'0070, or a little later than the intrinsic deflection in the (b)-(a) lead. Thus superior cava receives the wave before auricle. The diagonal lead (b)-(c) shows three deflections, the first of which
on May 31, 2018http://rstb.royalsocietypublishing.org/Downloaded from
416 MESSRS. T. LEWIS, J. MEAKINS, AND P. D. WHITE ON THE
is minute (see fig. 24, letter a in end curve) and in reality signals initial negativity of the superior cava, but the remaining deflections, and these the only prominent deflections of the curve, are not related to the arrival of the excitatory process at either contact. It is evident that potential differences in the (6)-(c) lead are combinations of both extrinsic and intrinsic effects at contacts and (c), and that interference is very considerable. The original curves from which this diagram was constituted are shown in fig. 24, which serves as an example of our method. The necessary data are obtained from—
(1) Lead (b)-(a) and Lead(2) Lead (c)-(d) and Lead II.
These curves serve as controls and fix the relation of intrinsic deflections to P.(3) Simultaneous leads and(4) Lead (b)-(c)and Lead II.
Our second example, fig. 7 C, shows equally well the deceptive qualities of diagonal leads. In this case the excitation process reaches the auricle, (c)-(d) lead, 0*0067 second before it reaches the superior cava, (b)-(a) lead. The first deflection in the cross lead would demonstrate primary negativity in contact (c) upon the auricle, but this deflection is earlier by 0*0034 second than the intrinsic deflection of lead (c)-((7). The most prominent deflection is late (0*0231) and is again unrelated to the arrival of the excitation process at either contact. The first deflection is in reality an extrinsic effect.
We venture to think that it is this manner of leading which is chiefly responsible for the considerable divergence between our conclusions and those of E yster and Meek, and also for the want of uniformity of their results ; these writers do notappear to have recognised the possibility of interference between intrinsic andextrinsic effects ; neither do they appear fully to appreciate the neutralisation of one intrinsic effect by the other in certain diagonal leads.
REFERENCES.1. Cushny and Matthews. ‘ Journ. of Physiol./ vol. 21, p. 213 (1897).2. E ngelmann. ‘ Archiv f. d. ges. Physiol./ vol. 17, p. 68 (1878).3. Eyster and Meek. ‘Heart/ vol. 5, p. 119 (1914).4. Ganter and Zahn. ‘Archiv f. d. ges. Physiol./ vol. 141, p. 335 (1912).5. Gotch. ‘Heart,’ vol. 1, p. 235 (1909-10).6. H ering. ‘Archiv f. d. ges. Physiol., vol. 82, p. 1 (1900).7. Lewis. ‘Heart,’ vol. 2, p. 23 (1910-11).8. Idem. ‘Mechanism of the Heart-beat,’ London, p. 130 (1910).9. Lewis and Oppenheimer. ‘Heart,’ vol. 2, p. 147 (1910-11).
10. L ewis. ‘ Seventeenth Internat. Congress,’ Sec. I, p. 107.11. Marchand. ‘Archiv f. d. ges. Physiol.,’vol. 15, p. 511 (1877).
on May 31, 2018http://rstb.royalsocietypublishing.org/Downloaded from
EXCITATORY PROCESS IN THE DOG’S HEART. 417
12. Sanderson and Page. ‘ Journ. of Physiol.,’ vol. 2, p. 384 (1879-80).13. W enckebach. ‘ Die Arhythmie als Ausdruck,’’etc., Leipzig (1903).14. W ybauw. £ Archiv Internat. d. Physiol.,’ vol. 10, p. 78 (1910).
EXPLANATION OF PLATE FIGURES.
P late 40.
Fig. 8.—Dog F.U. A natural size drawing to scale, showing the relations of the contacts, S-A node, muscle bands, and auricular branch of the right coronary artery. The angle between superior cava and appendix, the points of branching of the artery, the concentration point, and the taenia were charted to scale in the living animal. The positions of the arteries and contacts were also filled in to scale at the same time. The outline of the auricle and small muscle bands were accurately filled in at the xylol stage. The S-A (shaded) node was charted after cutting serial sections.
The concentration point, as we term it, is seen beneath contact (e). The contacts depicted illustrate a row of leads (e)-(y’), (g)-(h), and along the sulcus, and a special experiment, comparing S. C. and auricle,
{a)-{b), {c)-{d), and (b)-(c), the curves from which are charted in fig. 7c. The arrows upon the lines joining the contacts indicate the directions of lead ; the contact from which the arrow is directed is that which gives, when connected to the zinc terminal of a copper-zinc couple, an upright deflection in the electrocardiogram ; the same statement applies to all leads subsequently figured. Contacts (6), (c), (e), (g), and ( ) we term proximal contacts.
The error in charting in this figure is no greater than 1 mm. at any point.
Fig. 9.—Three sets of simultaneous electrocardiograms, illustrating the method of measurement and the type of curves in three direct heart leads. The lower curve is in each case from Lead I I and forms the standard; ordinates for these curves are on the scale of 1 cm. to 1 mv. ; the upper curve is in each case from a direct lead, ordinates 1 cm. to 3 mv. ; abscissae represent 0*2 second.
Fig. 9 a.—Dog F.V. S.A.N. lead ; a diphasic curve starting in a chief upstroke {in.) which indicates negativity of the proximal contact.
Fig. 9b.—Dog F.X. A characteristic curve from IV.C. lead. The auricular curve is mainly diphasic, the intrinsic deflection {in.) being upright (proximal contact negative); but it is preceded by a small extrinsic effect {ex.) (distal contact negative).
V O L . C C V .— B . 3 G
on May 31, 2018http://rstb.royalsocietypublishing.org/Downloaded from
418 MESSRS. T. LEWIS, J. ME AKINS, AND P. D. WHITE ON THE
Fig. 9c.—Dog F.W. Septal lead. The curve opens with a deep extrinsic effect and a tall spike, the intrinsic deflection.
Fig. 10 .—Examples of curves from direct leads, showing negativity of the proximal contact at the time of the intrinsic deflection {in.), in the left pulmonary veins (flg. 10a), coronary sinus (fig. 106), and right pulmonary veins (fig. 10c). Abscissae in these curves 0‘2 and 0*04 second.
Fig. 11.—Dog F.X. Simultaneous curves from right appendix and Lead before (fig. 11a) and after (fig. 116) rendering the appendix inactive. After the crush the intrinsic deflection (/) disappears from the appendix curve, as does the broad terminal phase of the auricular effect; the extrinsic deflection (E) persists and occurs at precisely the same time relative to the S.A.N. standard (obtained in the same animal by a simultaneousS. A.N. lead and Lead II) ; the ventricular effects 2, and v3) also remain. Ordinates in direct leads, 1 cm. = 3 mv. ; in Lead 1 cm. = 1 mv. ; abscissae = 0'2 second.
Plate 41.Fig. 12.—Dog F.Y. The actual curves from which fig. 2 was constructed. Ordinates
of direct leads, 1 cm. = 3 mv. ; of Lead II, 1 cm. = 1 mv. ; abscissae = 0’2 second.
Fig. 13.—Dog G.D. A diagram to scale, showing the arrangement of the muscle fibres around the base of the superior cava, and a combination of leads from cava and chest wall ( E ). {F) = point in immediate neighbourhood of pacemaker. {I)-{K) and ( G)-{H), leads taken for comparison of rates on superior cava and sulcus.
Fig. 14.—Dog F.Y. A diagram constructed to scale after the manner of fig. 8, showing the relations of two series of contacts to the inferior cava and adjoining muscle bands. The type of electrode employed (organ-pipe) is drawn above. The contacts were small and lay at an average distance of 5 mm. from each other (variation mm.). The curves obtained from these contacts are charted in fig. 3, and examples are shown in fig. 15. The pericardial insertion, the rim of the fan of muscle, and an ink mark upon the heart between contacts ( and ( ) served as landmarks.T. T. = Tcenia terminalis.
Fig. 15.—Four sets of simultaneous curves from a series of contacts on the inferior cava. In each curve the same standard, a lead from the intercaval region, was maintained. The other curves in figs. 15a, 156, 15c, and 1 are from leads (j)-(k), (k)-{l), {l)-{m) (one contact on and one off the muscle) and {m) {n)(both contacts off the muscle), respectively. The contacts are shown in fig. 14. Ordinates in all leads, 1 cm. = 3 mv. abscissae = 0’2 second.
on May 31, 2018http://rstb.royalsocietypublishing.org/Downloaded from
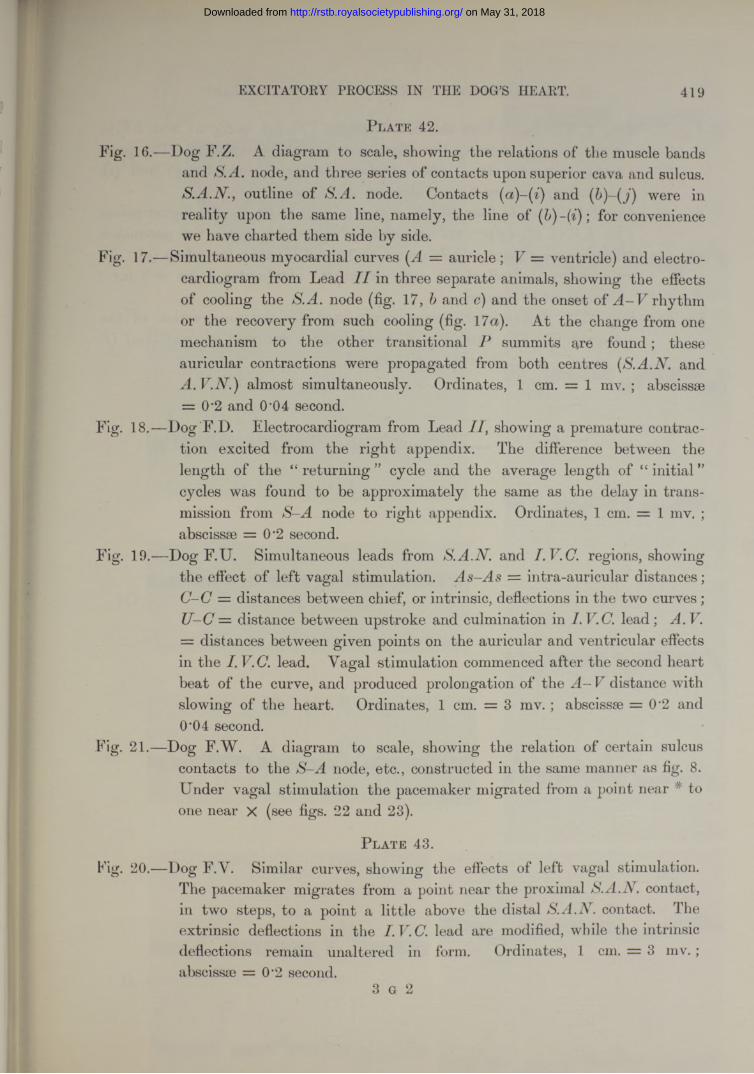
EXCITATORY PROCESS IN THE DOG’S HEART. 419
P late 42.Fig. 16.—Dog F.Z. A diagram to scale, showing the relations of the muscle bands
and S.A. node, and three series of contacts upon superior cava and sulcus. S.A.N., outline of S.A. node. Contacts and (b)-(j) were inreality upon the same line, namely, the line of for conveniencewe have charted them side by side.
Fig. 17.—Simultaneous myocardial curves (A = auricle; V = ventricle) and electrocardiogram from Lead I I in three separate animals, showing the effects of cooling the S.A. node (fig. 17, b and c) and the onset of rhythm or the recovery from such cooling (fig. 17a). At the change from one mechanism to the other transitional P summits are found; these auricular contractions were propagated from both centres (S.A.A and
A.V.N.)almost simultaneously. Ordinates, 1 cm. = 1 mv. ; abscissae= 0*2 and 0'04 second.
Fig. 18.—Dog F.D. Electrocardiogram from Lead II, showing a premature contraction excited from the right appendix. The difference between the length of the “ returning ” cycle and the average length of “ initial ” cycles was found to be approximately the same as the delay in transmission from S-A node to right appendix. Ordinates, 1 cm. = 1 mv. ; abscissae = 0-2 second.
Fig. 19.—Dog F.U. Simultaneous leads from and regions, showingthe effect of left vagal stimulation. As-As = intra-auricular distances;
C-C = distances between chief, or intrinsic, deflections in the two curves; U—C — distance between upstroke and culmination in I. lead ; A. V. = distances between given points on the auricular and ventricular effects in the I. V.C. lead. Yagal stimulation commenced after the second heart beat of the curve, and produced prolongation of the A— V distance with slowing of the heart. Ordinates, 1 cm. = 3 mv.; abscissae = 0‘2 and 0'04 second.
Fig. 21.—Dog F.W. A diagram to scale, showing the relation of certain sulcus contacts to the S-A node, etc., constructed in the same manner as fig. 8. Under vagal stimulation the pacemaker migrated from a point near # to one near X (see figs. 22 and 23).
P late 43.Fig. 20.—Dog F.Y. Similar curves, showing the effects of left vagal stimulation.
The pacemaker migrates from a point near the proximal S.A.N. contact, in two steps, to a point a little above the distal S.A.N. contact. The extrinsic deflections in the I.V.Clead are modified, while the intrinsic deflections remain unaltered in form. Ordinates, 1 cm. = 3 mv. ; abscissm = 0’2 second.
3 g 2
on May 31, 2018http://rstb.royalsocietypublishing.org/Downloaded from
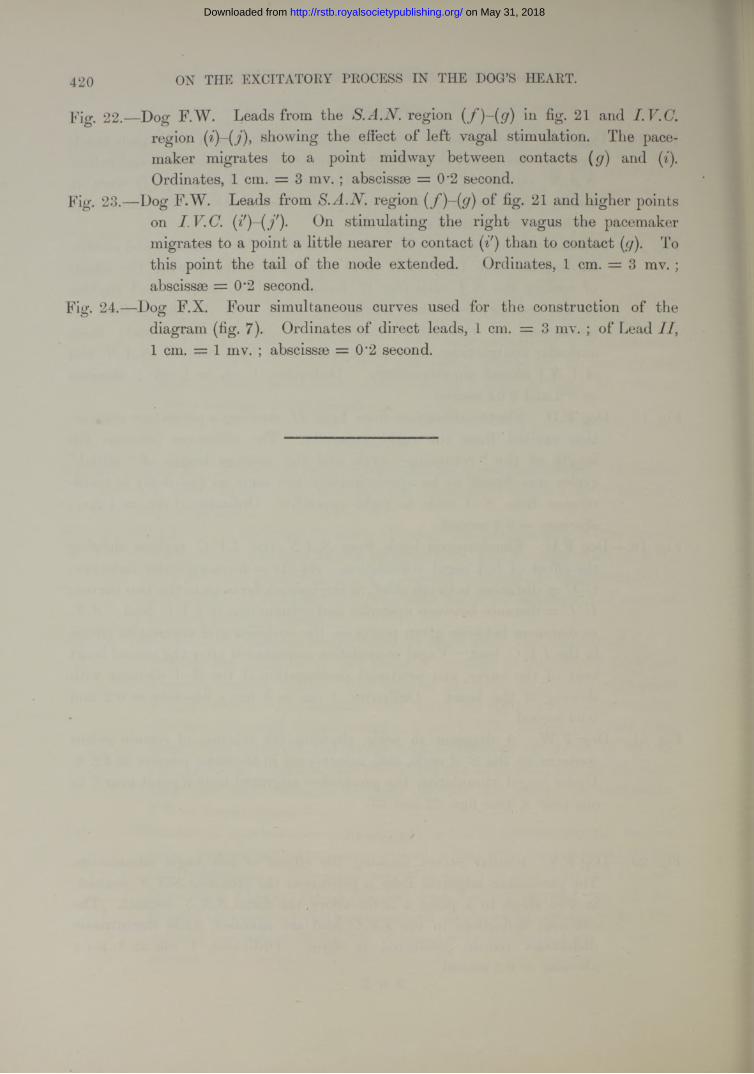
420 ON THE EXCITATORY PROCESS IN THE DOG’S HEART.
Fig. 22.—Dog F.W. Leads from the S.A.N. region (f)-(g) in fig. 21 and I.V.C.region showing the effect of left vagal stimulation. The pacemaker migrates to a point midway between contacts (g) and (i). Ordinates, 1 cm. = 3 mv. ; abscissae = 0*2 second.
Fig. 23.—Dog F.W. Leads from S.A.N. region (f)-(g) of fig. 21 and higher points on I.V.C. (i')-(f)- On stimulating the right vagus the pacemaker migrates to a point a little nearer to contact than to contact (g). To this point the tail of the node extended. Ordinates, 1 cm. = 3 mv. ; abscissae = 0*2 second.
Fig. 24.—Dog F.X. Four simultaneous curves used for the construction of the diagram (fig. 7). Ordinates of direct leads, 1 cm. = 3 mv. ; of Lead 1 cm. = 1 mv. ; abscissae = 0*2 second.
on May 31, 2018http://rstb.royalsocietypublishing.org/Downloaded from
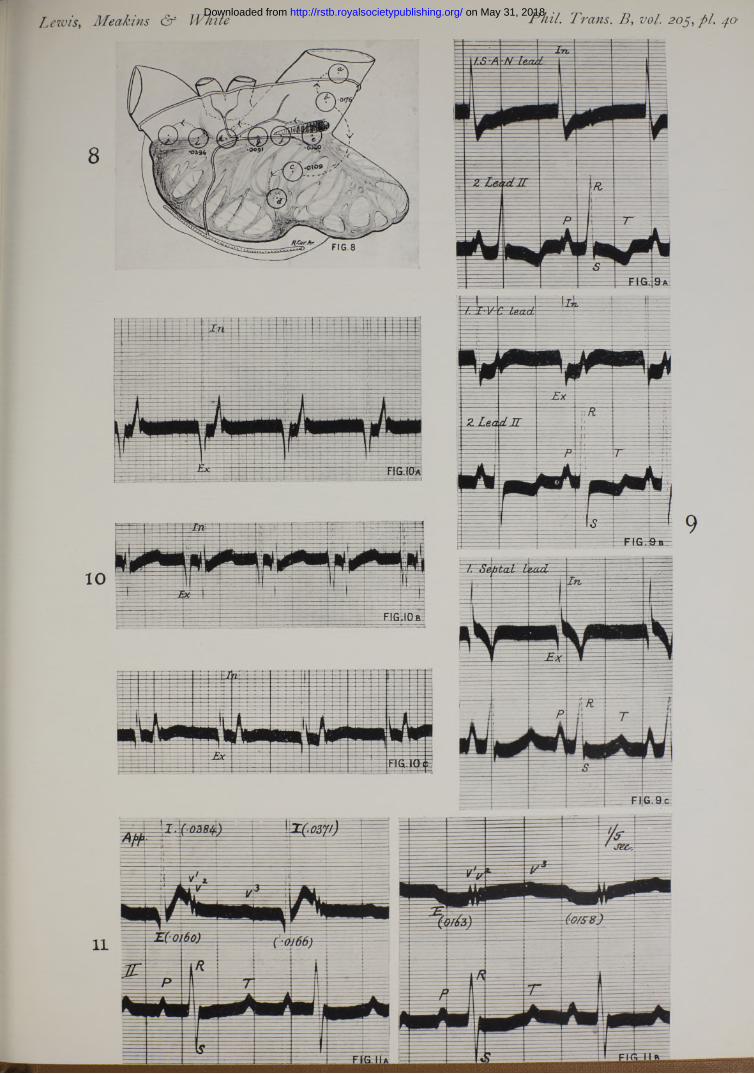
Lewis, Meakins & White Phil. Trans. B, vol. 205, pi. 40 on May 31, 2018http://rstb.royalsocietypublishing.org/Downloaded from
Lewis, Meakins & White Phil. Trans. B, vol. 205, pi. 41.
1 3
— ■— 'ty/ttt*f/ *"*' *— " — — , / < Si(ZT idard
ip = i l j f e p £ i | i p g i i i p
B i i i M $ f * m f a * r *
\p̂ jp?hyi -T f----------- | f— 2. f A- 41 § ||£
£E3'S t t t iZ tz r a EM M
2. Vein only (^n ~rt)
FIG-15.
15
on May 31, 2018http://rstb.royalsocietypublishing.org/Downloaded from
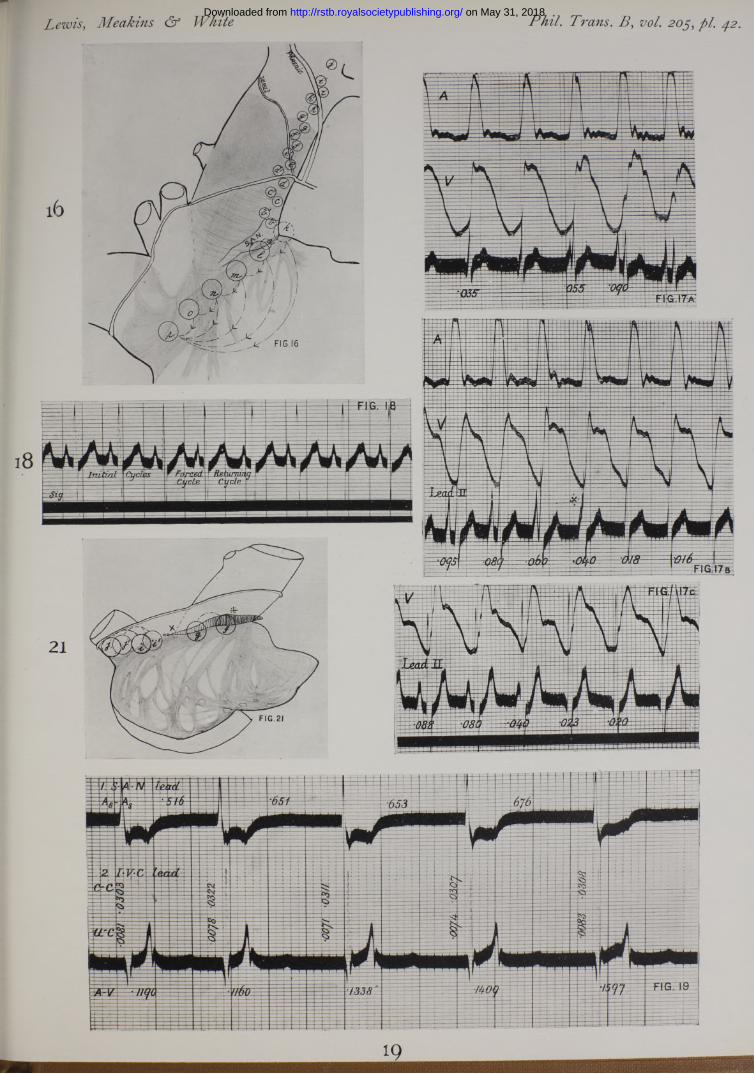
Lewis, Meakins & White Phil. Trans. B, vol. pi.
1 9
on May 31, 2018http://rstb.royalsocietypublishing.org/Downloaded from
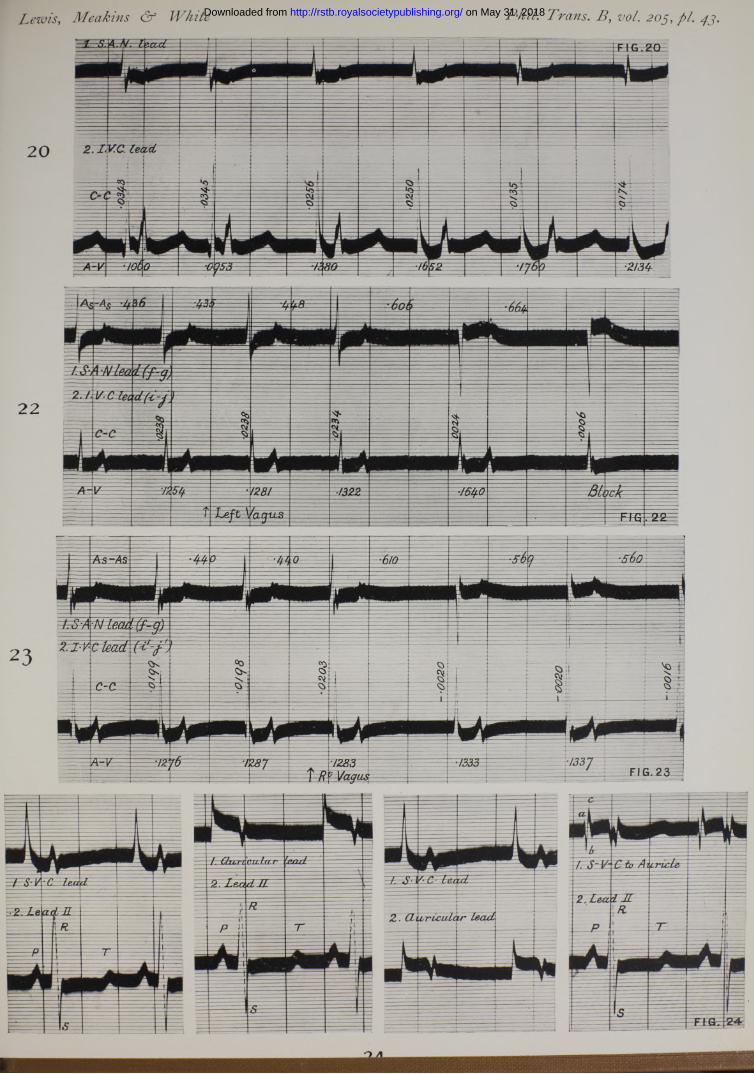
Lewis, Meakins & White Phil. Trans. B, vol. on May 31, 2018http://rstb.royalsocietypublishing.org/Downloaded from


