The Fall of Facebook’s Organic Reach
(and why it’s okay)W

10k
8k
6k
4k
2k
0
Disney BMW Intel Starbucks Mercedes HarleyDavidson
Ferrari
-77% -53% -31% -33% -61% -45%
May ‘13 May ‘14
Average engagement per post for the most engaging brands on Facebook
+48%

18%16%14%12%10%8%6%4%2%0%
Feb 2012 Sept 2013 Nov 2013 Dec 2013 Mar 2014
Facebook’s Organic ReachFeb 2012 - March 2014
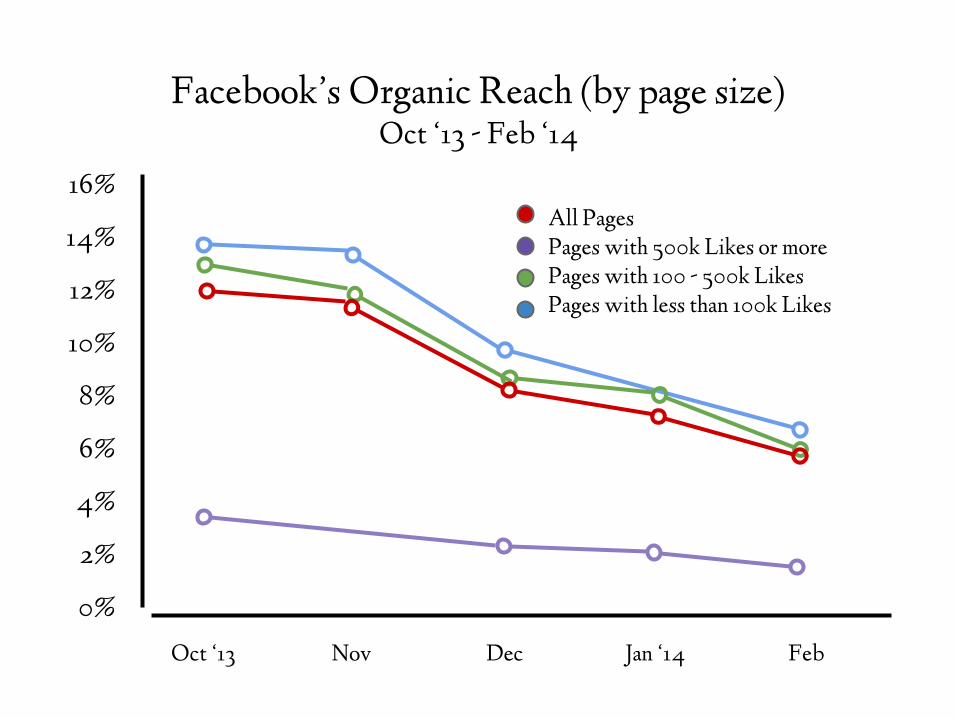
16%
12.4%10.15%
7.83%6.51%
16%
14%
12%
10%
8%
6%
4%
2%
0%
Oct ‘13 Nov Dec Jan ‘14 Feb
Facebook’s Organic Reach (by page size)Oct ‘13 - Feb ‘14
All PagesPages with 500k Likes or morePages with 100 - 500k LikesPages with less than 100k Likes

Facebook Status Update Reach ChangeReach/Fan between Jan 7 and Feb 4th, 2014
25%
20%
15%
10%
5%
0%
1/7 1/9 1/11 1/13 1/17 1/19 1/211/15 1/23 1/25 1/27 1/31 2/2 2/41/29
Jan 20th’s Algorithm Change

Why That’s all Okay...

Cost to Reach 1000 People with Facebook Ads(vs other ad platforms)
$32.00
$20.00
$8.00
$7.00
$2.75
$0.25
Newspaper
Magazine
Radio
Cable TV
Google AdWords
Facebook Ads

Facebook Ad Click-Through-Rates(Q3 2012 - Q3 2013)
.25%
.20%
.15%
.10%
.05%
.00%
07/1
208
/12
09/1
210
/12
11/1
212
/12
01/1
302
/13
03/1
304
/13
05/1
306
/13
07/1
308
/13
09/1
2

Q3 ‘12 Q4 ‘12 Q1 ‘13 Q2 ‘13 Q3 ‘13
Facebook Ads Overall CPC and CTRUS Q3, 2012 - Q3, 2013
Facebook CPC is down 40% Year-on-
Year
Facebook CTR is up 171% Year-on-Year
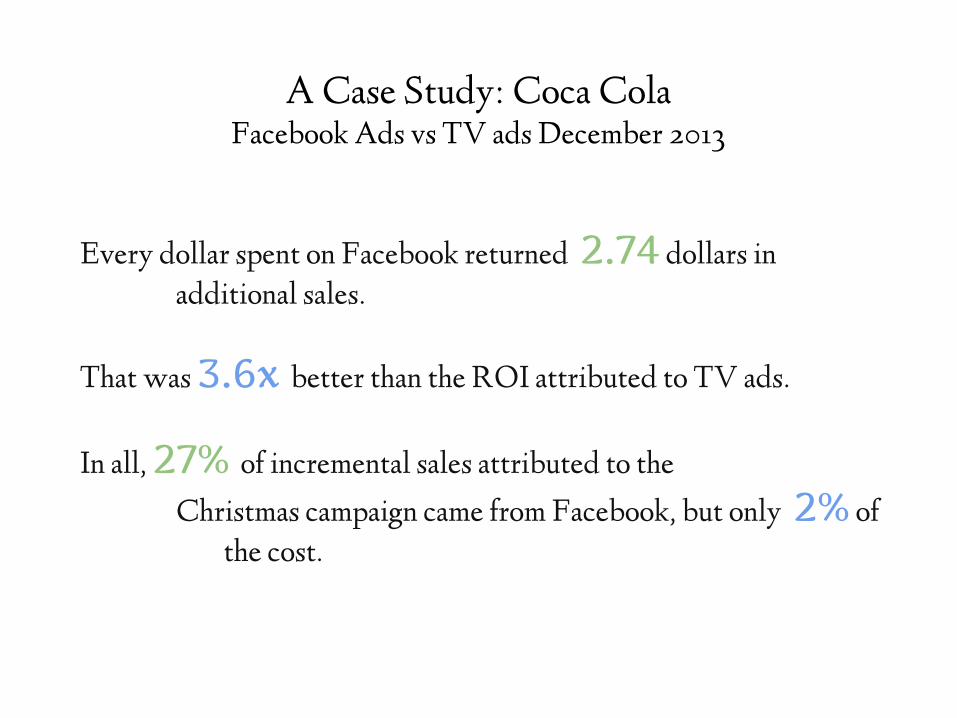
Every dollar spent on Facebook returned 2.74 dollars in additional sales.
That was 3.6x better than the ROI attributed to TV ads.
In all, 27% of incremental sales attributed to the
Christmas campaign came from Facebook, but only 2% of the cost.
A Case Study: Coca Cola Facebook Ads vs TV ads December 2013

Sources
● http://edgerankchecker.com/blog/tag/organic-reach/
● http://johnmuldoon.ie/2014/03/facebook-zero-organic-reach-on-facebook-to-join-dodo-dinosaur/
● http://venturebeat.com/2013/10/16/200-billion-facebook-ads-say-click-throughs-up-375-roi-at-152-study/#jp-carousel-838924
● http://adage.com/article/digital/facebook-roi-beat-tv-france/292055/

Thank you for viewing!
Wishpond
One Easy Tool for All of Your Online Marketing
create online ads, contests, landing pages & email automation campaigns
Did you like this presentation?
Check out blog.wishpond.com for more!


