
@ Speaker twitter handle
The Farr Institute – Delivering new evidence and risk prediction tools through data analysis Professor Marion Bennie, Professor of Pharmacy / Chief Pharmacist, University of Strathclyde, Gasgow / NHS National Services Scotland, Edinburgh

© HIMSS Europe GmbH 2
OUTLINE
• Our data – the Scottish national datasets (individual level)
• Our network - Farr Institute of Health Informatics Research
• Our applications - pharmacoepidemiology exemplars – Predicting risk of healthcare associated infection
@ Speaker twitter handle

Dornie Castle
A&E Maternity
BIRTH
DEATH
Child health surveillance
Immunisation
GP consultations
Outpatients Hospital Admissions
Mental Health
Prescribing Screening
Continuing care census
Cancer registry
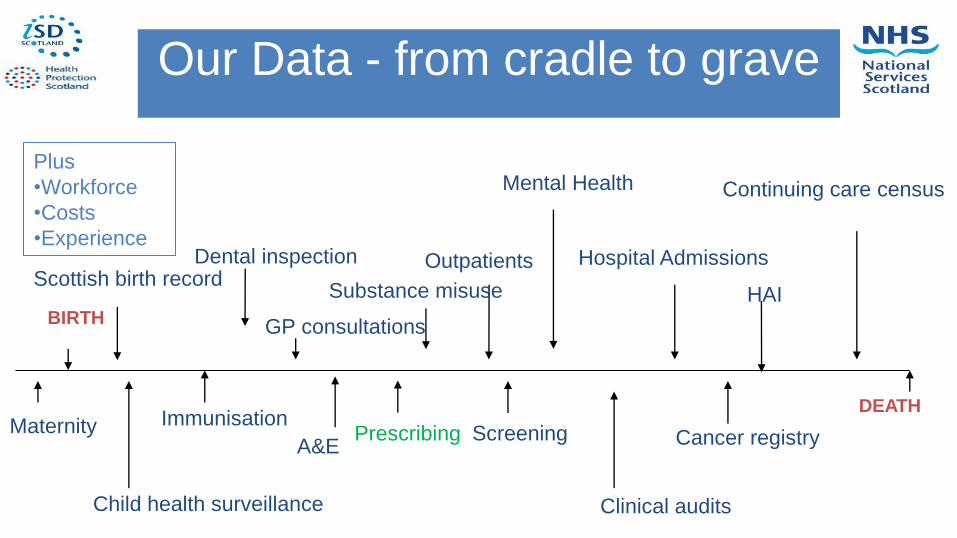
Our Data - from cradle to grave
Dental inspection Scottish birth record
Substance misuse
Clinical audits
Plus
•Workforce
•Costs
•Experience
HAI

Scottish Prescription
Community
Health
Index
(CHI)
Patient’s details
Drug details
Prescriber details

Prescribing Information system
Alvarez-Madrazo S, McTaggart S, Nangle C, Nicholson E, Bennie M. Data Resource Profile: The Scottish National Prescribing Information System (PIS)Int. J Epidemiology, 2016, 1–8 doi: 10.1093/ije/dyw060

Primary care prescribing data
• Total population coverage - 5.3million • A unique patient identifier applied (completeness
raising from 88% in 2009 to 96% by 2014) • Over 345 million items dispensed from 2009 to
2014.
Alvarez-Madrazo S, McTaggart S, Nangle C, Nicholson E, Bennie M. Data Resource Profile: The Scottish National Prescribing Information System (PIS)Int. J Epidemiology, 2016, 1–8 doi: 10.1093/ije/dyw060

Farr Institute, London
UCL, LSHTM, Queen Mary, UCL
Partners, Public Health England
Farr Institute, Scotland
Dundee, Aberdeen, Edinburgh, Glasgow, St Andrews, Strathclyde, MRC HGU, NHS NSS
Farr Institute, CIPHER
Swansea, Brighton, Bristol, Cardiff, Exeter, Oxford, Sussex, NWIS, Public Health Wales
Farr Institute, HeRC Manchester, Bradford, Durham, Lancaster, Liverpool, Newcastle, Sheffield, York, AHSNs
Our Research Network – The UK Farr Institute

STRATHCLYDE INSTITUTE OF PHARMACY & BIOMEDICAL SCIENCES
New Medicines, Better Medicines, Better Use of Medicines
Research
New Medicines – Fundamentals
New Medicines – Drug Discovery
Better Medicines Better Use of
Medicines Teaching
UG: MPharm UG: Biomedical
Sciences Masters degrees Doctoral study Knowledge Exchange
New drugs New formulations New imaging – the
Centre for Biophotonics
Industrial links
Application of predictive modelling to
estimate the risk of community associated
Clostridium difficile infection using routine
health data
Jiafeng Pan, Kim Kavanagh, Chris Robertson, Charis Marwick, Peter Davey, Camilla Wiuff, Scott Bryson, Marion Bennie

Create prediction models for the risk of acquiring a healthcare associated infection (HAI)
Vision: real time data were available, could aid clinical decision making at point of GP consultation/hospital admission
Study aim
11
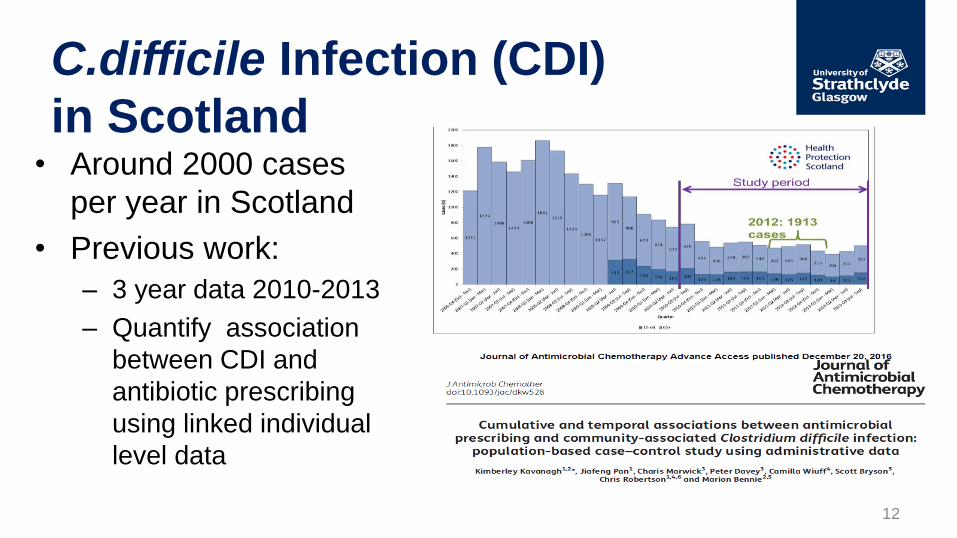
• Around 2000 cases
per year in Scotland
• Previous work:
– 3 year data 2010-2013
– Quantify association
between CDI and
antibiotic prescribing
using linked individual
level data
C.difficile Infection (CDI)
in Scotland
12

Data Linkage
13
Up to 6 controls are
matched on the basis of
age, gender and location.
(n=7945)
CA-CDI: tested in the
community or tested
within 48 hours of
hospital admission
& no admission in previous
3 months (n=1439)
All CDI cases with
linked hospital records
ECOSS: Laboratory
confirmed CDI cases
SMR01: Hospital
Admissions
All the cases and controls will be linked to :
• SMR01 – comorbidity markers
• PIS: Prescriptions
• Antimicrobials
• Proton pump inhibitors/H2 antagonists
• Drug counts
CA-CDI
matched
population
based controls
Analysed with
conditional logistic
regression
HA-CDI

14
Adjusted
OR (95% CI) p-value
Exposed to antibiotics in the previous 6 months, No 1 -
Exposed to antibiotics in the previous 6 months, Yes 2.80 (2.41- 3.25) <0.0001
SIMDa 1: most deprived 1 -
SIMD 2 0.85 (0.67-1.08) 0.178
SIMD 3 0.88 (0.68-1.14) 0.329
SIMD 4 0.95 (0.72-1.24) 0.696
SIMD 5: least deprived 0.98 (0.73-1.31) 0.872
Charlson score 0 1 -
Charlson score 1 2.42 (1.82-3.21) <0.0001
Charlson score 2 2.60 (1.89-3.57) <0.0001
Charlson score 3 2.23 (1.33-3.74) 0.002
Charlson score 4+ 2.83 (1.48-5.44) 0.002
Charlson score Unknown 0.80 (0.67-0.96) 0.016
Any hospital admission in previous year, No 1 -
Any hospital admission in previous year, Yes 2.15 (1.80-2.56) <0.0001
Number different items dispensed in previous year 1.03 (1.01-1.04) 0.002
Care home residence, No 1 -
Care home residence, Yes 1.15 (0.89-1.48) 0.283
PPI exposure, No 1 -
PPI exposure, Yes 1.02 (0.86-1.21) 0.819
H2 antagonist exposure, No 1 -
H2 antagonist exposure, Yes 1.41 (1.02-1.96) 0.036

Cumulative exposure in 6 months
17.9 (7.6, 42.2) 4.4 (3.4, 5.6) 9.2 (2.3, 37.1)
2.3 (1.9, 2.9)
2.1 (1.7, 2.7)
3.6 (2.8, 4.6) 7.2 (4.3, 12.3)
7.6 (5.1, 11.4)
2.2 (1.9, 2.6)
7.3 (2.3, 23.2)
3.8 (2.4, 6.1)
2.6 (2.3, 3.1)
4.6 (3.4, 6.2)
10.1 (5.0, 20.4)
15

• Use existing matched (on age, gender) case-control study focusing on community acquired cases
• Data are split into training (2/3) and test sets (1/3) maintaining matches
• Prediction models are built using conditional logistic regression on training data
• Performance assessed on test data – Area Under Curve (AUC), sensitivity and specificity of model
Making predictions
16

• Measures of cumulative exposure modelled rather than categorised – i.e. trend fitted to antibiotic DDD exposure rather
than groups
– Trend assessed using fractional polynomials to define trend and then explicitly defined in model
• Use individual risk factors rather than Charlson score
Method
17

Full model Health care variables • Total number of dispensed items last year (square root)
• Total number of different dispensed items last year (square root)
• Number of hospital admission in the previous year (inverse square root)
• Number of emergency hospital admission in the previous year (inverse)
• Days of hospital stay in the previous year (log+1)
Prescribing variables • PPI in the community last 6 month (y/n)
• H2 antagonist in the community last 6 month (y/n)
• DDDs of 4C exposure in the community last 6 month (log)
• DDDs of non-4C antimicrobial exposure in the community last 6 month (log)
• DDDs of FQ exposure in the community last 6 month (log)
Demographic variables • SIMD (socioeconomic quintile)
• Resident in care home
• (age, gender, location matched)
Comorbidities • Congestive heart failure, cardiomyopathy
• Atherosclerosis, aortic aneurysm, vascular disease
• Stroke
• Dementia
• Bronchitis, pneumoconiosis
• Gout, lupus, rheumatoid arthritis
• Gastro ulcers
• Liver problems
• Renal problems
• Cancer
• Alcohol-related liver failure
• Metastatic cancer
• Inflammatory bowel disease
• Diabetes
• Diabetes with complications
• Hemiplegia, paraplegia
18

Sensitivity 65.8%
Specificity 78.5%
AUC
0.789
Correctly classified as non case
Correctly
classified as CDI
Cut point
0.869
19

Reduced Model
*For every ~2.7 fold increase in DDD, odds of CDI increases by 1.85. For every 2 fold increase in DDD, odds CDI
increase by 1.53.
4DDD OR=2.4, 8 DDD OR=3.6, 16 DDD OR=5.5, 32 DDD OR=8.4
Adjusted OR 95% CI p value
Liver problems 4.16 (2.02, 8.55) 0.0001
Renal problems 2.84 (1.89, 4.27) <0.0001
Metastatic cancer 7.02 (2.90, 17.02) <0.0001
Inflammatory bowel disease 1.68 (1.14, 2.47) 0.009
Total number of dispensed items last year (square root) 1.26 (1.23, 1.30) <0.0001
Days of hospital stay in the previous year (log) 1.45 (1.33, 1.57) <0.0001
DDDs of 4C exposure in the community last 6 months
(log)* 1.85 (1.63, 2.09) <0.0001
DDDs of non-4C antimicrobial exposure in the
community last 6 months (log) 1.25 (1.17, 1.33) <0.0001
20
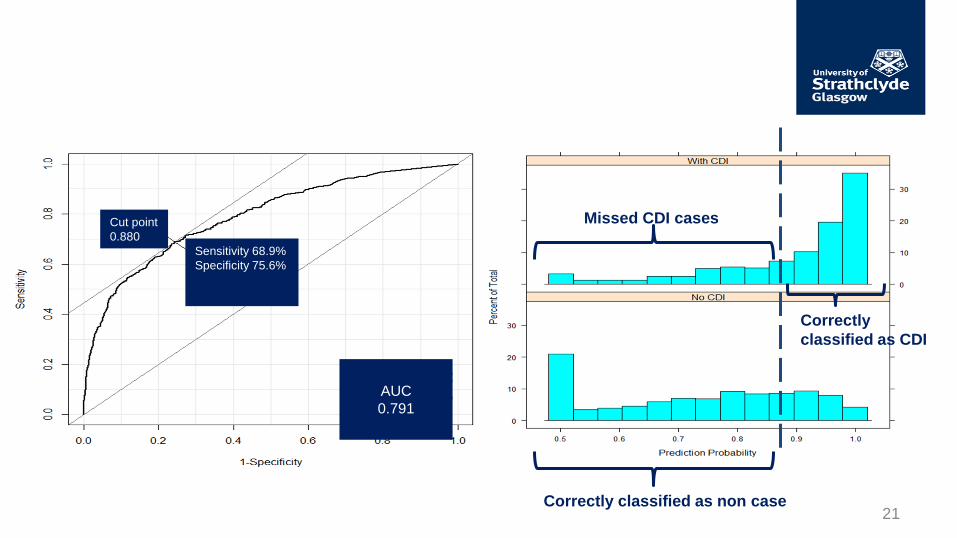
Sensitivity 68.9%
Specificity 75.6%
AUC
0.791
Cut point
0.880
Missed CDI cases
Correctly
classified as CDI
Correctly classified as non case 21

Missed CDI cases
• Younger – mean age 53 vs. 72
• Healthier – 1.3 days in hospital vs. 13.8
– 5.8 different items vs. 16.3
• Less antibiotic exposure – 3.1 DDDs (sd 6.3) vs. 30 DDDs (sd 40.3)
– 67% no antibiotic prescribing vs. 23%
• 39% of missed cases no risk factors (care-home, PPI, H2, Antibiotics, no hospital admission, no unknown comorbidity)
22

Considering other modelling
approaches….
• Machine Learning
• Random Forest
23
Data Prediction

Comparing performance
• Random Forest – AUC: 0.81
– Sensitivity: 70%
– Specificity: 81%
• Logistic – AUC: 0.79
– Sensitivity: 69%
– Specificity: 76%
24

Summary
• Models perform well but miss “healthy” CDI cases which have few risk factors recorded
• The risk models are good for population stratification – Putting individuals into groups for the
management of their screening/treatment
– Not so good if used to predict if a specified individual will get a disease or not
25

Future work
• Recalibrate the model with more recent
data
• Create a realistic (based on data
availability at point of care) v.s. optimal
versions of the model
26

Other Applications
Examination of phenotype characteristics on drug use and clinical outcome in
• DOACs (new cardiovascular drugs) in Atrial Fibrillation
• Cancer therapies for prostate and melanoma
27

European Drug Utilization Research Group (EuroDURG) Conference 2017:
Patients, Medicines, Bytes: Drug Utilization and E-health
15 – 17 November 2017, Glasgow, UK
www.EuroDURG2017.com

@ Speaker twitter handle
Thank you!
Professor Marion Bennie, Professor of Pharmacy / Chief Pharmacist, University of Strathclyde, Gasgow / NHS National Services Scotland, Edinburgh [email protected]

Aim: To increase the evidence from clinical practice regarding these new oral anticoagulants (NOACs)
Objectives: To analyse the use and prescribing trends over time of traditional and new anticoagulants in Scotland
To determine the clinical effectiveness and adverse events associated with different treatment options in AF patients with variable phenotype characteristics
Mueller T1, Alvarez-Madrazo S1, Robertson C2, Bennie M1,3 1Strathclyde Institute of Pharmacy and Biomedical Sciences, University of Strathclyde, Glasgow 2Department of Mathematics and Statistics, University of Strathclyde, Glasgow 3Public Health and Intelligence Strategic Business Unit, NHS National Services Scotland, Edinburgh
The use of new oral anticoagulants in patients with
atrial fibrillation in Scotland

Initiation
•First drug intake
Implementation
•Continuous process
Discontinuation
•Last drug intake
First prescription
Last prescription
Adherenc
e
persistence
Vrijens et al (2012). A new taxonomy for describing and defining adherence to medication. Br J Clin Pharmacol 73(5), 691-705
ESPACOM framework
NHS Scotland Cancer Medicines
Outcome Programme - Study Aims
• To co-ordinate an incremental program of planned studies to test the connectivity and linkage of current and evolving local and national datasets to determine clinical outcome data for cancer medicines.
• To test the feasibility of collecting and analysing quality of life data from clinical practice, aligned to the early exemplar studies, to inform a potential enhanced data strategy for collection and analysis of patient reported outcome measures (PROMs).

Qu
anti
tati
ve W
ork
Str
eam
Qu
alitative W
ork Stream

Year one exemplar projects
Prostate Cancer
- Abiraterone and Enzalutamide
- Baseline characteristics including PS,
co-morbidities
- Outcomes: duration of therapy, stop
reason, OS, time to PSA progression,
time to chemo/radio, Opiate prescribing
- PROMs
Melanoma
- BRAF inhibitors/MEK inhibitors and
immunotherapy
- Baseline characteristics including BRAF
status, depcat score, prognostic scores,
co-morbidities
- Outcomes: duration of therapy, OS, stop
reason, toxicities including supportive
meds and hospital admissions


