The Financial Impact on Student Success
1
Using Data to Create Strategies in a Disruptive Marketplace
Sarah BauderThe Alecxih Group

Agenda01
National Landscape: Impacts on Financing Education
02The Angst of the Middle Class
03Financial Aid Behavioral Loan Default Study
04Student Success Initiatives and Best Practices

NATIONAL LANDSCAPE
3
Future of
Higher
Education?
ChangingEconomics
ChangingTechnology
Changing Demography
Changing Perceptions and Expectations
-17%
-13%
-15%
-10%
12%
6%
1%
14%
-20%
-15%
-10%
-5%
0%
5%
10%
15%
20%
West Midwest Northeast South
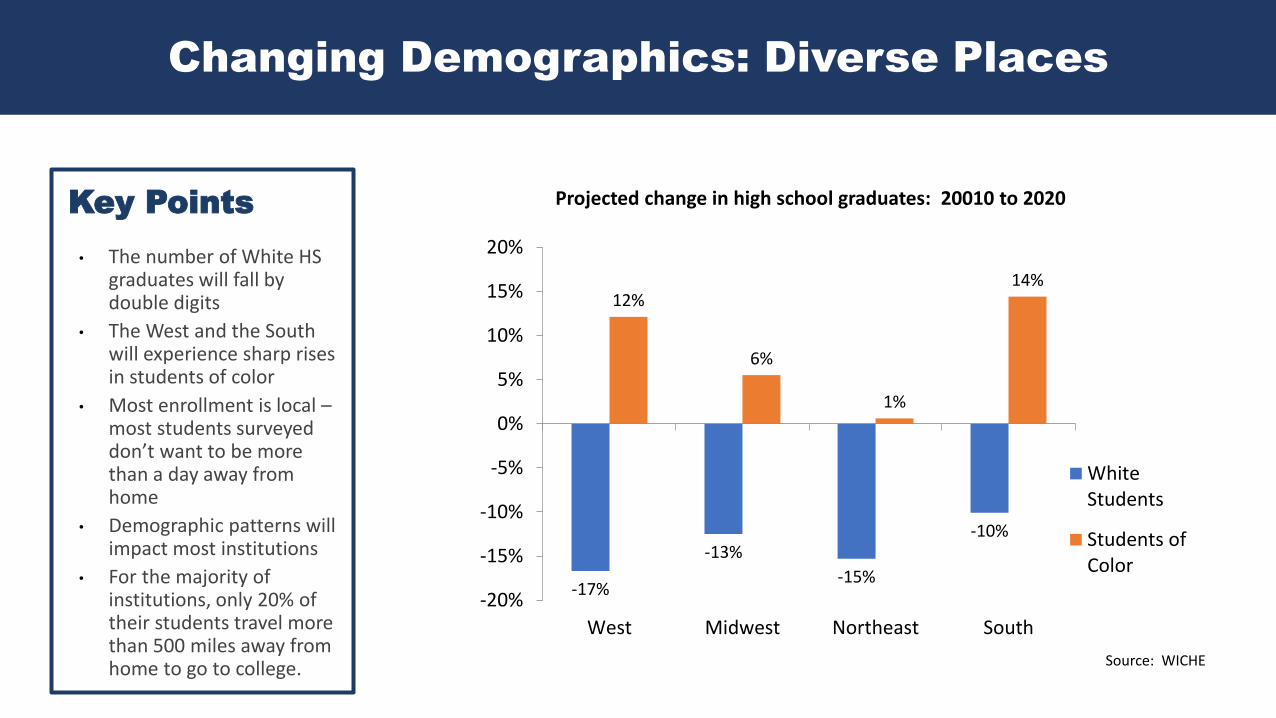
Projected change in high school graduates: 20010 to 2020
WhiteStudents
Students ofColor
Source: WICHE
Key Points
• The number of White HS graduates will fall by double digits
• The West and the South will experience sharp rises in students of color
• Most enrollment is local –most students surveyed don’t want to be more than a day away from home
• Demographic patterns will impact most institutions
• For the majority of institutions, only 20% of their students travel more than 500 miles away from home to go to college.
Changing Demographics: Diverse Places
(0)
200,000
400,000
600,000
800,000
1,000,000
1,200,000
1,400,000
1,600,000
1,800,000
2,000,000
White, Non-Hispanic
Hispanic Black, Non-Hispanic
Asian AmericanIndian
TotalStudents of
Color
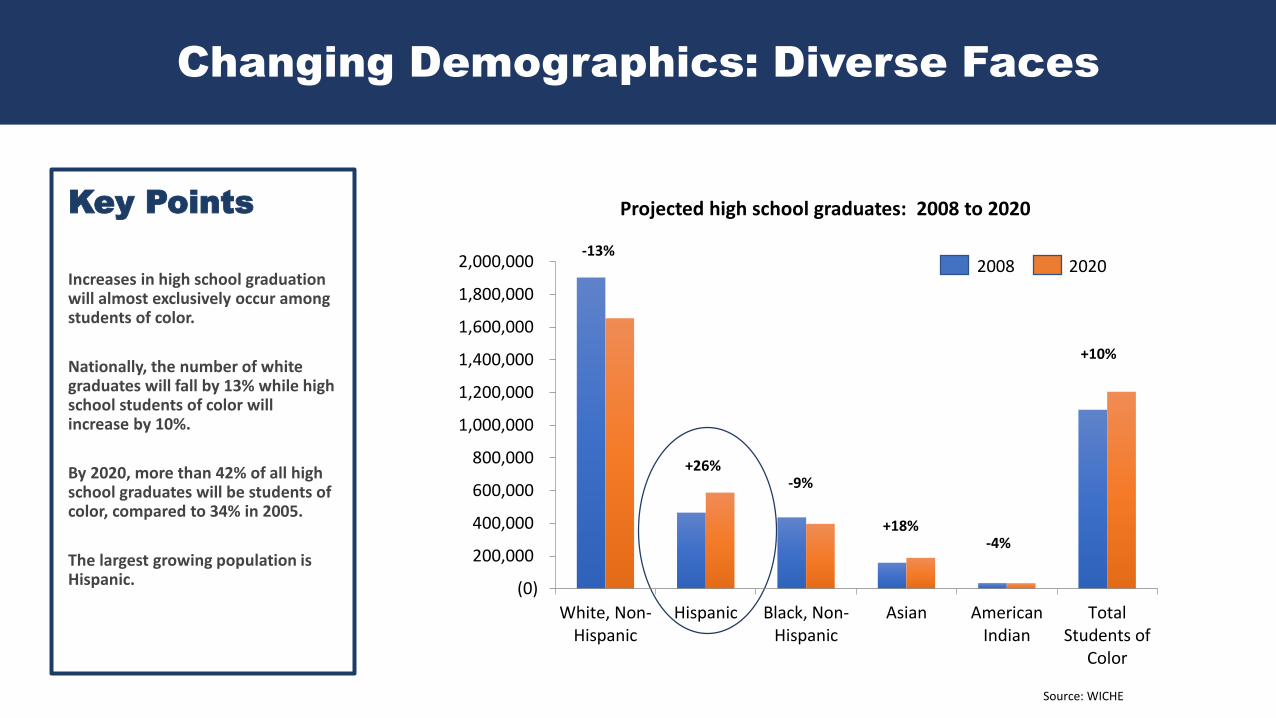
Projected high school graduates: 2008 to 2020
-13%
+26%-9%
+18%-4%
+10%
2008 2020
Source: WICHE
Changing Demographics: Diverse Faces
Key Points
Increases in high school graduation will almost exclusively occur among students of color.
Nationally, the number of white graduates will fall by 13% while high school students of color will increase by 10%.
By 2020, more than 42% of all high school graduates will be students of color, compared to 34% in 2005.
The largest growing population is Hispanic.
Source: WICHE

Bienvenido al Futuro de los Estados Unidos
Key Points
There are 50 million people of Hispanic descent in the US today; nearly equal to the sum total of the nation’s black and Asian populations which totals 53 million.
The number of Hispanics in the US alone rose by 43 percent between 2000 and 2010.
Only 8 states experienced growth of less than 40 percent in their Hispanic population between 2000-2010 and 12 states experiences 90 percent or more.
63% were born in the US.
67% attend non-selective colleges with low graduation rates.
Sources: Breakpoint; Georgetown Center on Education and the Workforce
Latino completion rates for bachelor’s and associate’s degrees lag behind Whites, but Latino’s have higher certificate completion rates.
Source: WICHE
Latino first-time enrollees at two and four year colleges increased while white enrollment decreased.

Key Points
• The rapid advancement of technology is
linked to and mirrors human knowledge
growth, creating a society in which
transformational new technology is
introduced frequently- expect change
• Ubiquitous hardware, artificial
intelligence, digitization of data, advanced
robotics, deep learning, and the internet
of things are fundamentally transforming
how Americans live, learn, and work and
majors on campuses
• In previous eras, moderate to highly
skilled workers would have to learn new
technology two or three times over the
course of their lifetime. Today,
transformational new technologies are
appearing at an increasing pace,
outdating former technology as quickly as
three to five years.
Changing Technology
7
14501400 1500 1550 1600 1650 1700 1750 1800 1850 1900 1950 2000 2050
Printing Press Telescope Steam Engine
Telegraph
Lightbulb
Telephone
Car
Man on the moon
Microprocessor
WWW
iPhone
Internet of Things
Advanced Robotics
3D Organ Printing
Self-Aware AI
Ac
ce
lera
tin
g G
row
th i
n T
ech
no
log
y
Source: INED + Entangled analysis
Changing Expectations of Higher Education
8
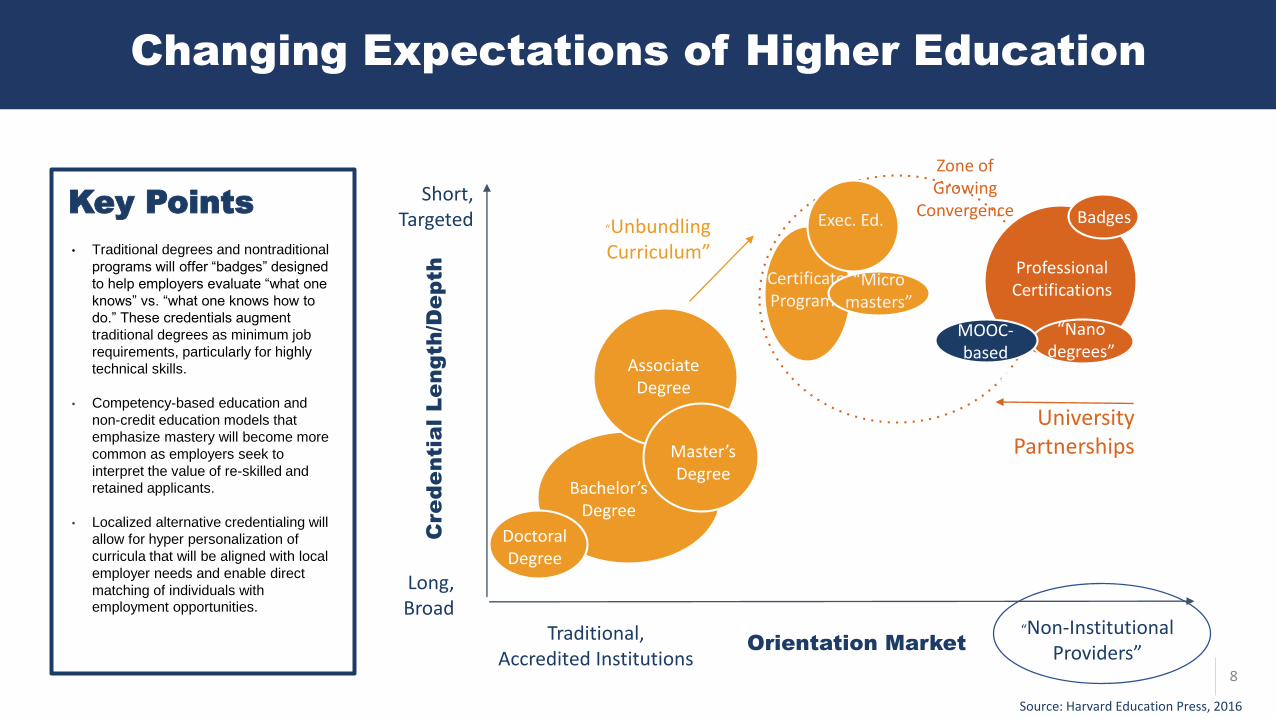
Key Points
• Traditional degrees and nontraditional
programs will offer “badges” designed
to help employers evaluate “what one
knows” vs. “what one knows how to
do.” These credentials augment
traditional degrees as minimum job
requirements, particularly for highly
technical skills.
• Competency-based education and
non-credit education models that
emphasize mastery will become more
common as employers seek to
interpret the value of re-skilled and
retained applicants.
• Localized alternative credentialing will
allow for hyper personalization of
curricula that will be aligned with local
employer needs and enable direct
matching of individuals with employment opportunities.
Source: Harvard Education Press, 2016
Cre
de
nti
al
Le
ng
th/D
ep
th
Short, Targeted
Long, Broad
Orientation Market“Non-Institutional
Providers”Traditional,
Accredited Institutions
Zone of Growing
Convergence
University Partnerships
“Unbundling Curriculum”
Certificate Programs
Exec. Ed.
Professional Certifications
Badges
“Nanodegrees”
MOOC-based
certificates
“Micromasters”
Associate Degree
Master’s Degree
Bachelor’sDegree
DoctoralDegree

U.S. Companies Spent $9.7 Billion in 2017 for Training or Upskilling Employees!
Source: Training Magazine
Skills most needed for the future: • Critical Thinking• Complex Problem Solving• Leadership• Emotional Intelligence• Teamwork/Collaboration
Source: World Economic Forum
Globalization has increased workforce diversity. Economic pressures have resulted in workers remaining in the labor force longer than previous generations.
Source: World Economic Forum
Changing Partnerships and Collaboration
By 2024, 25 percent of the workforce is projected to be age 55 or older. Older workers are expected to be disproportionately affected by the effects of automation, needing more training.
Source: Entangled Solutions
Millennials will soon represent more than half the workforce, drastically shifting workplace culture and expectations.
Source: Gallup

The Angst of the Middle Class
Changing Economics
Key Points
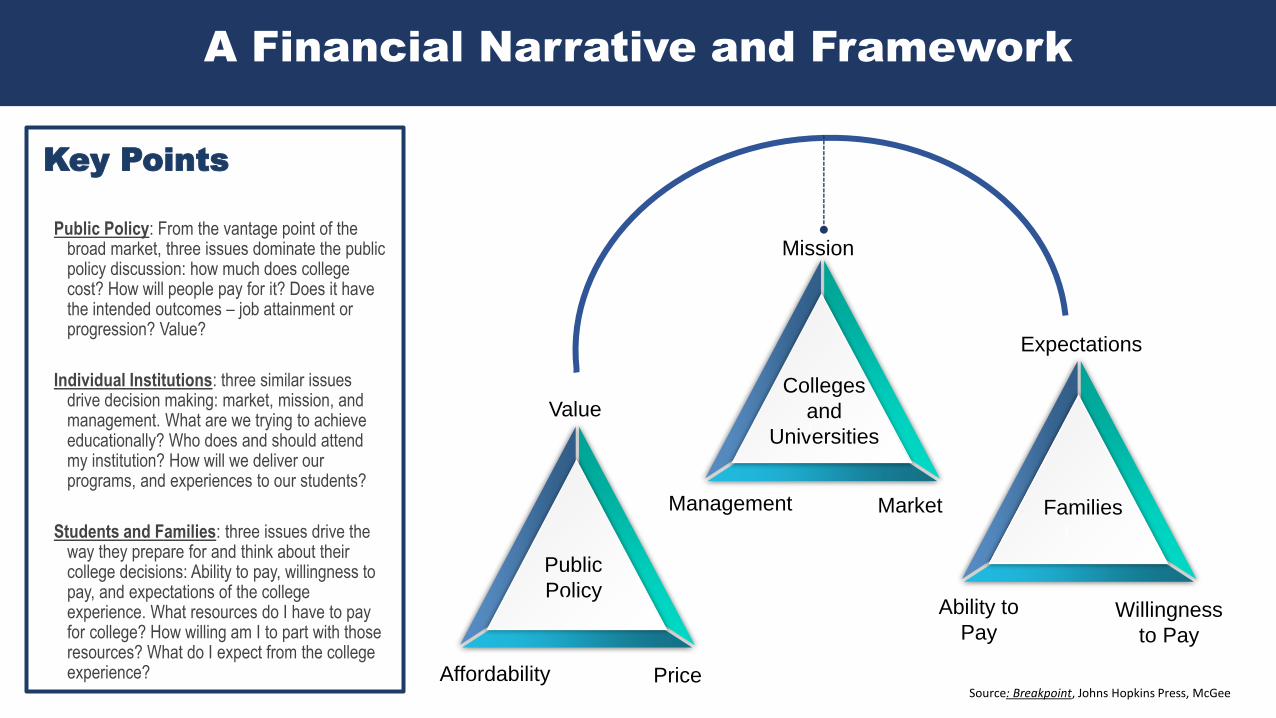
Public Policy: From the vantage point of the broad market, three issues dominate the public policy discussion: how much does college cost? How will people pay for it? Does it have the intended outcomes – job attainment or progression? Value?
Individual Institutions: three similar issues drive decision making: market, mission, and management. What are we trying to achieve educationally? Who does and should attend my institution? How will we deliver our programs, and experiences to our students?
Students and Families: three issues drive the way they prepare for and think about their college decisions: Ability to pay, willingness to pay, and expectations of the college experience. What resources do I have to pay for college? How willing am I to part with those resources? What do I expect from the college experience?
Source: Breakpoint, Johns Hopkins Press, McGee
A Financial Narrative and Framework
Public
Policy
Affordability Price
ValueColleges
and
Universities
Management Market
Mission
Families
Ability to
PayWillingness
to Pay
Expectations

77%
35%
7%
11%
38%
48%
0%
20%
40%
60%
80%
100%
Struggling a Lot Struggling a Little Not Struggling
How worried are you that you will havetrouble paying for your children’s college education?
Not Worried At All
Not Too Worried
Somewhat Worried
Very Worried
Source: Public Agenda, 2011
Anxiety Heavy
Key Points
4 in 10 Americans identified themselves as “struggling a lot”
42% said they were “struggling a little”. Only 17% said they weren’t struggling at all
4 in 10 Americans said they were very worried or somewhat worried about losing their job in the next year
In total, nearly 80% of all parents said they were worried that they would have trouble paying for their children’s college education
Pew Report shows that 75% of
Americans believe college is
unaffordable

$-
$20,000
$40,000
$60,000
$80,000
$100,000
White, Non-Hispanic
Black Asian Hispanic
Median Family Income, 2017
All Families with School-Age Children
Married Couple Families with School-Age Children
37%
88%
46%
63%
0% 20% 40% 60% 80% 100%
Hispanic
Asian
Black
White, Non-Hispanic
% 19 Year Olds Enrolled in College
Source: US Census Bureau
Changing Economics
Key Points
There are enormous differences in family incomes by race and ethnicity, differences that influence opportunity.
The financial aid challenges are immediately apparent.
Family structure matters: for each group, married couple families with children have substantially higher incomes than the incomes for all families with school age children.
Higher Education will face enormous enrollment challenges in this new era of changing demography and economics.
Source: https://nces.ed.gov/pubs2017/2017051.pdf

0%
20%
40%
60%
80%
100%
120%
140%
Lowest 20% SecondQuintile
ThirdQuintile
FourthQuintile
Top 20% Top 5%
2012-2013 Tuition, Fees, Room, and Board as % of mean family income by quintile
Private Four-Year Colleges
Public Four-Year Colleges
Source: US Census Bureau, College Board. Percentages displayed reflect average price as a percent of the mean of each income quintile..
Who Needs Financial Aid, Anyway?
Key Points
• According to Pew Research, only 53% of families with children have saved anything for their kids college
• 46% say they haven’t saved enough.
• We have an efficacy problem with needs analysis and college costs as income rises into and through the middle class

Source: https://trends.collegeboard.org/sites/default/files/2017-trends-in-college-pricing_0.pdf
Average Net Price by Family Income
Key Points
• Students who are financial aid recipients with family incomes below $48,001 received enough grant aid on average to cover tuition and fees with funds left over for expenses.
• Middle income families between $48,001 and $110,000 had to pay on average $5,800 to cover just tuition and fees.
• On average tuition and fees comprises 39% of an institutional cost of attendance.

16
● 39% of Black borrowers drop out of college,
compared to 29% of white borrowers.
● 38% of low-income borrowers drop out
compared to less than a quarter of their higher-
income peers.
● 30% of all students who began their
postsecondary education in 2011-2012, left
without a credential within 3 years. 40% of
African Americans, 32% of Hispanic students and
38% of low-income students had left.
● 50% of students who drop out come from
families that earn less than $35,000.
● Between 10% and 35% of students who drop out
owe $1500 or less and are in good academic
standing.
Finances Impacts Student Success and Diversity Initiatives
Source: BPS 04/09 Beginning Postsecondary Longitudinal Landscape 2011-12 National Postsecondary Student Aid Study (NPSAS: 12)
Less than $1500More than $1500
% of stopouts with $1,500 or more of unmet financial need.
% of 1st time student stopouts who reported a financial reason for doing so.

https://nces.ed.gov/pubs2017/2017051.pdf
Completion is the New Normal for Student Success
Key Points
Increases in salary were evident in all races as education attainment increases.
Black and Hispanics earn less than Asian or White counterparts, with Asian having the most earning power.

Financial Aid Longitudinal Study
1999-2011
University of Maryland

Method and Purpose
• All Undergraduate degree seeking students who borrowed any federal loan in the years 1999-2009
• Matched that data to institutional campus data by department – bursar, registrar, development, athletics
• Matched that report to NSLDS to all students who defaulted on a federal loan from 1999-2013
• Determine indices related to default
• Define the academic, demographic, and financial characteristics of students who default
• Identify which characteristics are highly associated with defaults
• Examine graduation with characteristics of default
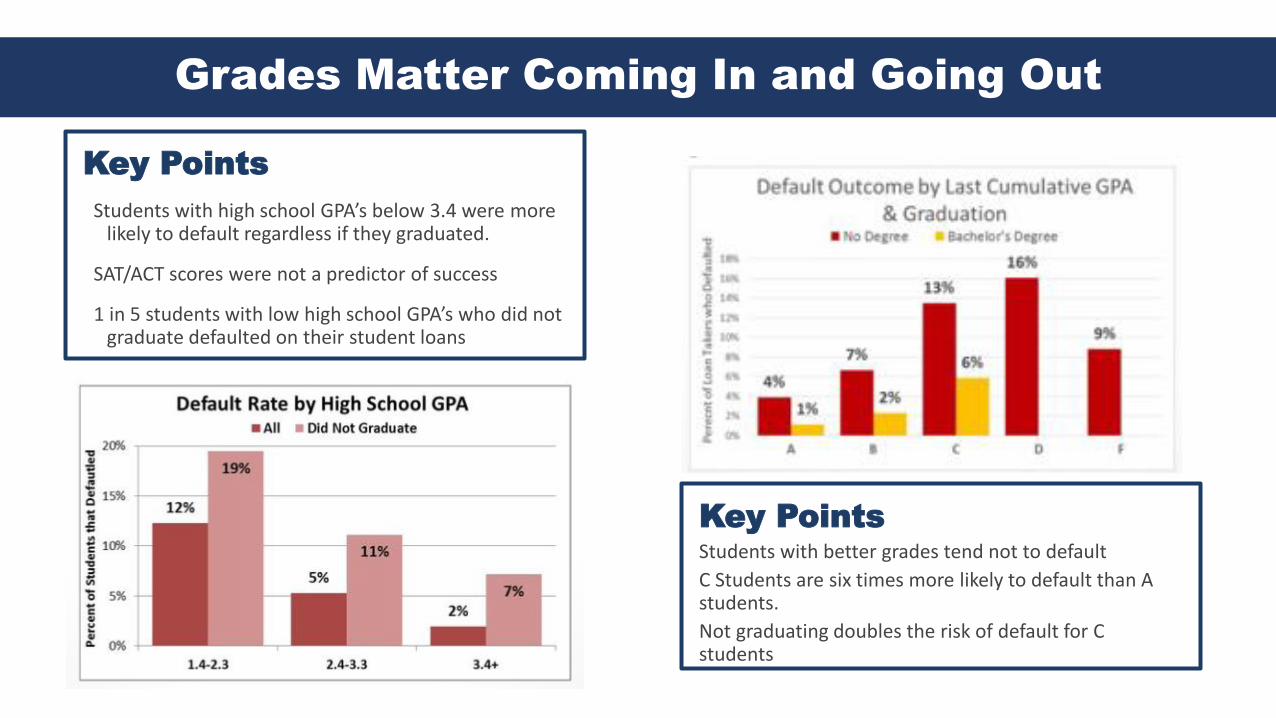
Key PointsStudents with better grades tend not to default
C Students are six times more likely to default than A students.
Not graduating doubles the risk of default for C students
Key Points
Students with high school GPA’s below 3.4 were more likely to default regardless if they graduated.
SAT/ACT scores were not a predictor of success
1 in 5 students with low high school GPA’s who did not graduate defaulted on their student loans
Grades Matter Coming In and Going Out

Key Points
Students enrolled in 13+ terms were more likely to default regardless of their graduation outcome.
Those that did not graduate were almost three times more likely to default than those that did graduate.
Key PointsIn general, students with high loan amounts, have a higher risk of default.
For students who graduated, the risk of default did not increase until the student’s total loan amount exceeded $20,000.
Students who do not graduate and have over $20K in loans have a 3.6x greater risk of default
Time to Degree Matters
Key Points
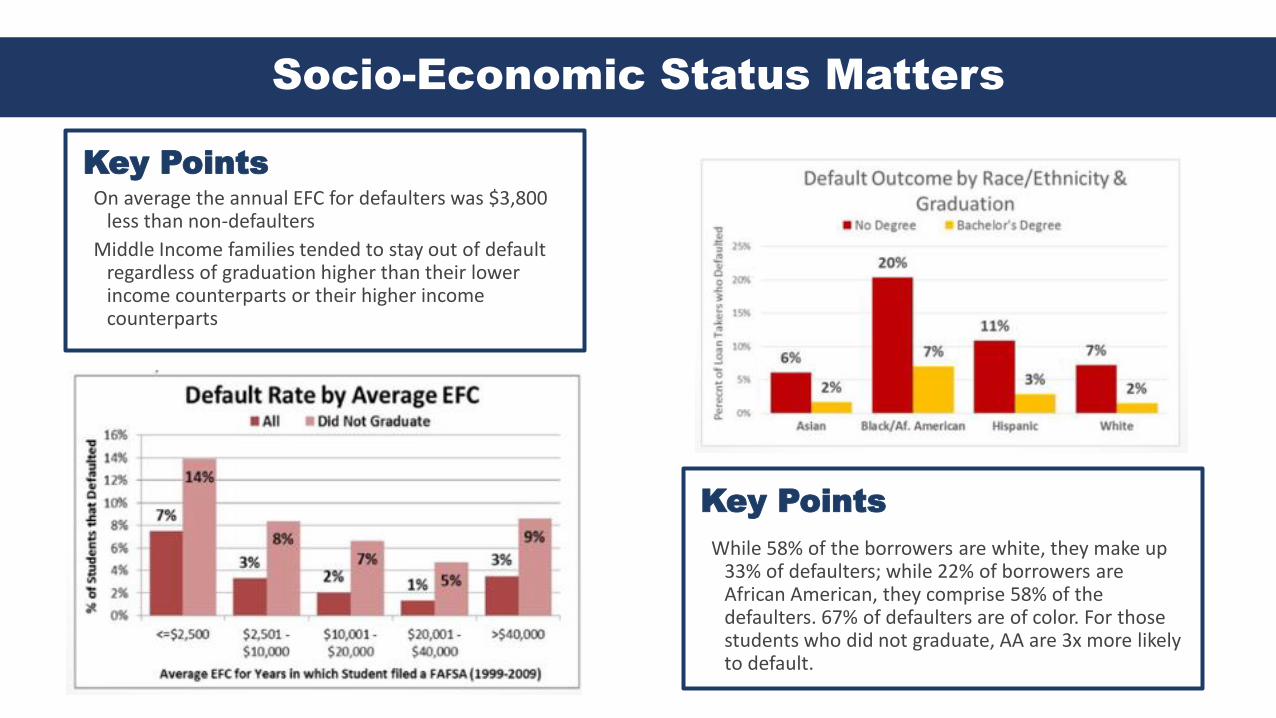
While 58% of the borrowers are white, they make up 33% of defaulters; while 22% of borrowers are African American, they comprise 58% of the defaulters. 67% of defaulters are of color. For those students who did not graduate, AA are 3x more likely to default.
Key PointsOn average the annual EFC for defaulters was $3,800
less than non-defaulters
Middle Income families tended to stay out of default regardless of graduation higher than their lower income counterparts or their higher income counterparts
Socio-Economic Status Matters

Key Points
Students in undeclared majors had a higher percentage of defaults regardless of graduation
Students who declared a major after the three semester defaulted at a rate 5 times their peers
Students in Science, Math, Computer Science, Engineering, Business, Journalism and Architecture had negligible default rates if the student graduated. And similar default rates if they didn’t graduate
Side note: This information is important for institutions interested in Income Share Agreement Programs
Major Matters

Take Aways
• Among student who default, 57% do so within the first five years.
• Student who do not graduate have default rates 4 times higher than those that do graduate
• Males have a slightly higher risk of default
• Failure to graduate increases risk of default among males but not females
• 15% of loan borrowers were independent students; these students had 2.3 times higher default rates than
dependent students
• Transfer students had default rate doubled that of first time enrollees regardless if they graduated
• Instate and out of state students had very similar default rates unless they did not graduate. Then out of
state student’s default rate was four percentage points higher.

STUDENT AFFAIRS
.
. REGISTRAR
FINANCIAL AIDINFORMATION TECHNOLOGY
DEANS AND COLLEGESBURSAR
Data Collection and Student Behaviors

Incomplete gradesLate fines
Parking feesQualitative Survey Data
Assignments
Stopped outCan’t enroll next semester
Owes Money after drop/add
Small Sample of Information Gathered
Date Registered for Classes
Repeated Classes
Changed majors (how many times)
Study Abroad
Dates of applications

What We Learned
Did Not Graduate
• Declared major after third semester• More than six procrastination indicators in any one
semester
• HS GPA below 3.2 unweighted (SAT has no significance)• Single parent household• Part Time• Transfer• More than 13 semesters• African American male• Worked off campus• Off campus housing first two years• No Study Abroad• Repeated Introductory Math and/or English• Owed $; Academically qualified
Graduated
• Declared major at orientation or before third semester
• Less than 3 procrastination indicators in any one semester
• Full time over 15 credits continuously• Graduated before 12th semester• Studied Abroad in sophomore and/or junior year• Worked on campus or only over breaks • On campus housing first two years• Asked for help: tutoring; mentor; • Appealed for additional funding – emergency aid
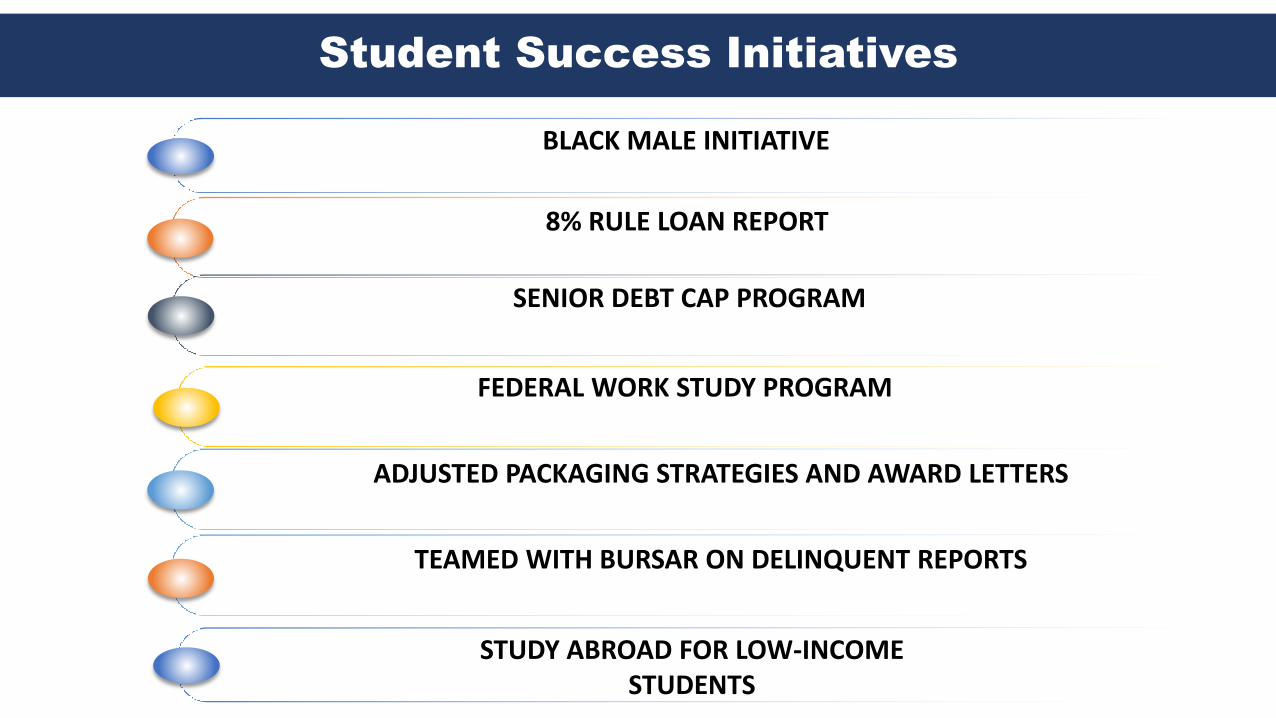
BLACK MALE INITIATIVE
8% RULE LOAN REPORT
SENIOR DEBT CAP PROGRAM
FEDERAL WORK STUDY PROGRAM
ADJUSTED PACKAGING STRATEGIES AND AWARD LETTERS
Student Success Initiatives
TEAMED WITH BURSAR ON DELINQUENT REPORTS
STUDY ABROAD FOR LOW-INCOME STUDENTS

29
KEY POINTS
• High ROI; small dollars
• Improves Collaboration Across Divisions
• Promotes Donor Support – Real-time Impact on Funds
• Teaches Data Mining and Predictive Analytic Skills
• Creates an Environment for Innovation
• Paves the Path for more Impactful Programs
Emergency Aid Team
Shared Data
Shared Policies
Shared Technology
Shared Resources
Aid / Crisis
Coordinator
Coordination
Technology
Emergency Aid