
The Gender Wage Gap
IFS Briefing Note BN186
Monica Costa DiasWilliam ElmingRobert Joyce

The gender wage gap
Institute for Fiscal Studies 1
The Gender Wage Gap
Monica Costa Dias William Elming Robert Joyce
Copy-edited by Judith Payne
Published by The Institute for Fiscal Studies, 2016 ISBN 978-1-911102-21-2 The authors would like to thank Helen Barnard, Richard Blundell, Carl Emmerson and Paul Johnson for helpful comments on an earlier draft. Funding for the research from the Joseph Rowntree Foundation and the ESRC-funded Centre for the Microeconomic Analysis of Public Policy at IFS (grant number ES/M010147/1) is gratefully acknowledged. The Labour Force Survey (LFS) and British Household Panel Survey (BHPS) data were supplied through the UK Data Archive. The LFS data are Crown Copyright and reproduced with the permission of the Controller of HMSO and Queen’s Printer for Scotland. The BHPS is copyright Institute for Social and Economic Research. Any errors and all views expressed are those of the authors.

The gender wage gap
Institute for Fiscal Studies 2
Executive summary
Differences in hourly wages between men and women remain substantial, despite some convergence.
The hourly wages of female employees are currently about 18% lower than men’s on average, having been 23% lower in 2003 and 28% lower in 1993.
The gender wage gap has not been falling among graduates or those with A levels.
Only among the lowest-educated individuals has the gender wage gap continued to shrink over the past two decades. The other driver of a falling overall gender wage gap has been an increase in the education levels of women relative to men.
The gender wage gap widens gradually but significantly from the late 20s and early 30s.
Men’s wages tend to continue growing rapidly at this point in the life cycle (particularly for the high-educated), while women's wages plateau.
The arrival of children accounts for this gradual widening of the gender wage gap with age.
There is, on average, a gap of over 10% even before the arrival of the first child. But this gap is fairly stable until the child arrives and is small relative to what follows: there is then a gradual but continual rise in the wage gap and, by the time the first child is aged 12, women’s hourly wages are a third below men’s.
The gradual nature of the increase in the gender wage gap after the arrival of children suggests that it may be related to the accumulation of labour market experience.
A big difference in employment rates between men and women opens up upon arrival of the first child and is highly persistent. By the time their first child is aged 20, women have on average been in paid work for four years less than men and have spent nine years less in paid work of more than 20 hours per week.

The gender wage gap
Institute for Fiscal Studies 3
Taking time out of paid work is associated with lower wages when returning, except for women who are low-educated.
Looking at women who leave paid work, hourly wages for those who subsequently return are, on average, about 2% lower for each year that they have taken out of employment in the interim. This relationship is stronger, at 4% per year, for women with at least A-level qualifications. We do not see such a relationship for the lowest-educated women, which is likely because they have less wage progression to miss out on or fewer skills to depreciate.
Working low numbers of hours is associated with slower hourly wage growth for women.
There is no immediate hourly wage drop on average when women reduce their hours to 20 or fewer per week. But women working no more than that amount see less growth in wages, on average, than other women. Hence, the lower hourly wages observed in lower-hours jobs appear to be the cumulative effect of a lack of wage progression.

The gender wage gap
Institute for Fiscal Studies 4
If you’re a woman, you will earn less than a man.
From Theresa May’s first statement as Prime Minister1
Last year Britain was ranked 18th in the world for its gender pay gap ... We can and must do far better.
From Jeremy Corbyn’s campaign speech in July 20162
Gender wage differentials remain substantial and, as evidenced by the quotations above, a hot topic in policy debate. Inequalities between men and women are clearly of direct interest in their own right. In addition, poverty is increasingly a problem of low pay rather than lack of employment. The proportion of people in paid work is at a record high, and female employment has risen especially quickly, particularly among lone parents. Two-thirds of children in poverty now live in a household with someone in paid work.3 In an age when the main challenge with respect to poverty alleviation is to boost incomes for those in work, and when so many more women are in work than in the past, understanding the gender wage gap is all the more important.
This briefing note is the first output in a programme of work seeking to understand the gender wage gap and its relationship to poverty. Section 1 sets out what we mean by the gender wage gap, how it differs according to education level and how it has evolved over time and across generations. Section 2 provides some descriptive evidence on how the gender wage gap relates to the presence of dependent children and the employment outcomes associated with that.
The analysis uses two data sets: the Labour Force Survey (LFS) and the British Household Panel Survey (BHPS). The LFS is the leading UK source of data on employment circumstances and it is the largest household survey in the UK. We use it to analyse the size of the gender age gap for different groups and how it has changed over time. It has been conducted in every quarter since 1993 and we use data up to the third quarter of 2015. To analyse the dynamics of the gender wage gap as individuals move through their life cycle, we use the BHPS, which ran from 1991 to 2008. This is a long-running ‘panel’ survey – that is, it follows the circumstances of the same representative sample of people over time. It gives us a sample of several thousand individuals each year.
Subsequent work in this research programme will estimate an economic model of the causal relationships between men’s and women’s wages and career patterns in order to identify some of the key causes of the gender wage gap, and hence to provide clear guidance to policymakers who seek to reduce it.
1 https://www.gov.uk/government/speeches/statement-from-the-new-prime-minister-theresa-may. 2 http://www.newstatesman.com/politics/staggers/2016/07/jeremy-corbyns-campaign-speech-full-i-came-
politics-stand-against. 3 C. Belfield, J. Cribb, A. Hood and R. Joyce, Living Standards, Poverty and Inequality in the UK: 2016, Report 117,
2016, http://www.ifs.org.uk/publications/8371.

The gender wage gap
Institute for Fiscal Studies 5
1. The gender wage gap: what is it and how has it changed?
Figure 1 plots the average weekly earnings of male and female employees over time and (in black and on the right axis) the proportional difference between the two. It shows that this earnings gap is very substantial indeed, although the gap is smaller now than it was two decades ago. Female employees currently earn about a third less than male employees, on average.
Figure 1. Average real weekly earnings of men and women over time
Note: The graph shows real (CPI-deflated) weekly earnings in January 2016 prices. Individuals in the bottom two and top one percentiles of the gender- and year-specific hourly wage distributions are excluded.
Source: LFS 1993Q1–2015Q3.
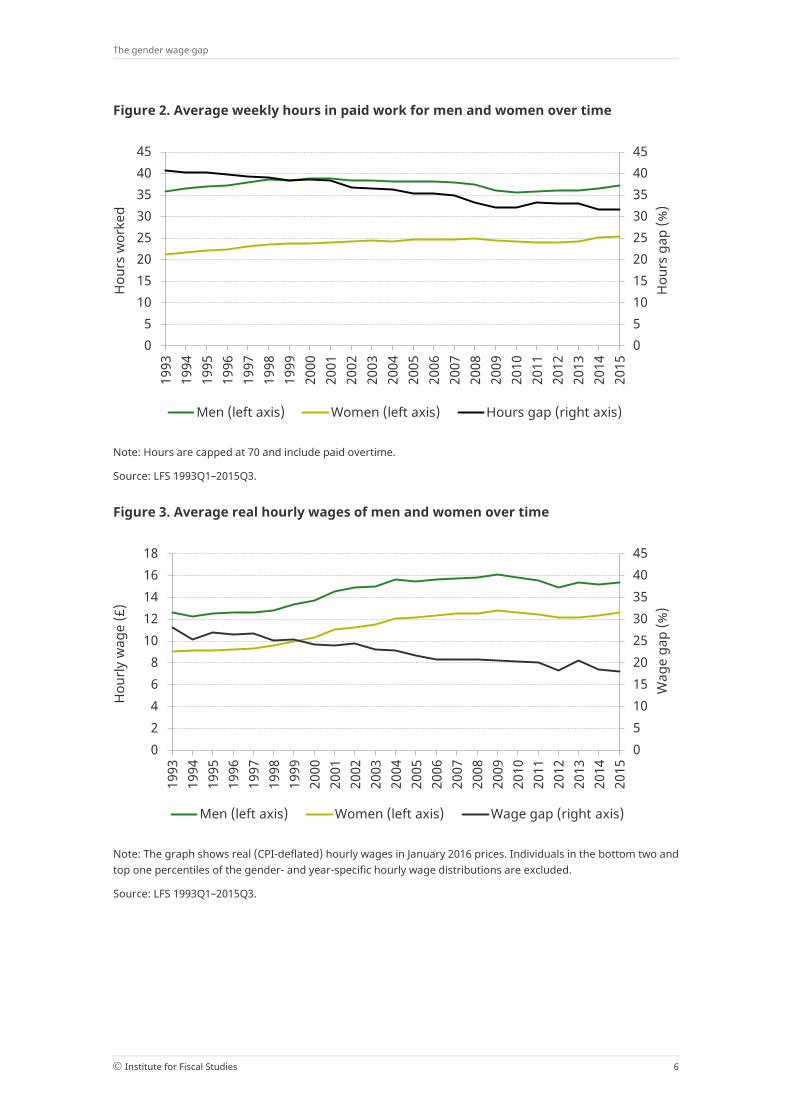
This simple weekly earnings gap is so large because Figure 1 is not really comparing ‘like with like’. One of the most obvious reasons why this is the case is that women, on average, spend fewer hours per week in paid employment than men (and in particular are less likely to work full-time). Figure 2 shows the large difference in average weekly hours in paid work. It also shows that this difference has declined over time as women have increased their weekly hours, which partly explains why the weekly earnings gap is smaller than it was two decades ago.
Figure 3 gets rid of earnings differences driven simply by differences in the current number of hours in paid work, by plotting the gender gap in hourly wages. This hourly wage gap is the gap that is of primary interest in everything that follows (though trends in hours worked for men and women are also important in their own right and well worthy of further research). The hourly wage gap is far smaller than the weekly earnings gap: women currently earn about a fifth less per hour than men, on average (compared with a third less for weekly earnings). It has also fallen over time. But there is still a substantial gap.
0
10
20
30
40
50
60
70
0
100
200
300
400
500
600
700
1993
19
94
1995
19
96
1997
19
98
1999
20
00
2001
20
02
2003
20
04
2005
20
06
2007
20
08
2009
20
10
2011
20
12
2013
20
14
2015
Earn
ings
gap
(%)
Wee
kly
earn
ings
(£)
Men (left axis) Women (left axis) Earnings gap (right axis)
The gender wage gap
Institute for Fiscal Studies 6
Figure 2. Average weekly hours in paid work for men and women over time
Note: Hours are capped at 70 and include paid overtime.
Source: LFS 1993Q1–2015Q3.
Figure 3. Average real hourly wages of men and women over time
Note: The graph shows real (CPI-deflated) hourly wages in January 2016 prices. Individuals in the bottom two and top one percentiles of the gender- and year-specific hourly wage distributions are excluded.
Source: LFS 1993Q1–2015Q3.
0 5 10 15 20 25 30 35 40 45
0 5
10 15 20 25 30 35 40 45
1993
19
94
1995
19
96
1997
19
98
1999
20
00
2001
20
02
2003
20
04
2005
20
06
2007
20
08
2009
20
10
2011
20
12
2013
20
14
2015
Hou
rs g
ap (%
)
Hou
rs w
orke
d
Men (left axis) Women (left axis) Hours gap (right axis)
0 5 10 15 20 25 30 35 40 45
0 2 4 6 8
10 12 14 16 18
1993
19
94
1995
19
96
1997
19
98
1999
20
00
2001
20
02
2003
20
04
2005
20
06
2007
20
08
2009
20
10
2011
20
12
2013
20
14
2015
Wag
e ga
p (%
)
Hou
rly w
age
(£)
Men (left axis) Women (left axis) Wage gap (right axis)

The gender wage gap
Institute for Fiscal Studies 7
Even when comparing hourly wages rather than weekly earnings, there are likely to be many reasons why these simple comparisons between men and women are not like-for-like comparisons. Figure 4 illustrates that the apparent size of the gender wage gap can be reduced substantially by looking at subsets of male and female employees who are likely to be more comparable in terms of the characteristics of those employees and the kinds of jobs they do.
Figure 4. Gap in weekly earnings or hourly wages between different groups of men and women
Note: ‘Children’ here means individuals aged under 19 living in the same family as the adult in question (it does not include adult children and/or those outside the home). ‘Young’ adults are defined as those aged between 22 and 35. Individuals in the bottom two and top one percentiles of the gender- and year-specific hourly wage distributions are excluded.
Source: LFS 2013Q1–2015Q3.
If we compare only men and women working more than half-time (those working more than 20 hours per week),4 the hourly wage gap falls from 19% to 16%. Of course, even among these workers, there may still be important differences in job types between men and women; we plan to explore the role of occupation choices in further work. In addition, men and women who work similar numbers of hours per week now may have had different past career patterns and therefore different levels of skills and experience. If we further restrict the sample to young workers who have not yet had children, and who have therefore not in the past reduced their labour supply in order to care for children, the wage gap falls further to 6%.
In sum, Figure 4 suggests that differences in labour market experience may be an important driver of gender wage differences. This does not necessarily mean, however, that the gender wage gap would be only 6% if women’s career patterns were unaffected
4 The conclusions of this briefing note also hold if we use an hours threshold of 30 per week, which is a typical
threshold used to distinguish ‘part-time’ from ‘full-time’ workers.
36%
19% 16% 10% 6%
0 5
10 15 20 25 30 35 40
Weekly earnings
Hourly wages Hourly wages if work more than
20 hours per week
... and do not have children
... and are young
Gap
(%)

The gender wage gap
Institute for Fiscal Studies 8
by having children. It is possible that other factors could drive the divergence of wages as men and women age or after they have children, such as employers exercising market power or gender differences in choice of occupations.
Returning to the hourly wage gap between all male and female employees, Figure 5 shows how the gap has changed across ‘birth cohorts’ – that is, people born in particular years. It shows the size of the gap between people in the same cohort, tracing the gap for four cohorts as they have aged. For example, we see that by the age of 35 the gender wage gap was on average 10 percentage points lower for men and women born in the 1970s than it had been for men and women born in the 1950s when they were the same age. Overall, we see a fairly consistent narrowing of the gender wage gap across cohorts, though a clear gap remains even for those born in the 1980s. This pattern is also observed in the US.5
Figure 5. Gender wage gap by age, for people born in different decades
Note: Individuals in the bottom two and top one percentiles of the gender- and year-specific hourly wage distributions are excluded.
Source: LFS 1993Q1–2015Q3.
One reason why wage differentials between men and women might change is that their relative levels of education change. Figure 6 shows that the population has become more highly educated at a rapid rate over the past 20 years, with a rapid rise in the proportion of graduates and a rapid fall in the proportion of people with no more than GCSE-level qualifications. It also shows that women have experienced the more rapid increase in education levels. In fact, in the late 2000s, they ‘overtook’ men in this respect: women are now more highly educated than men. These differential trends in educational attainment have contributed to the closing of the gender wage gap.
5 C. Goldin, ‘The rising (and then declining) significance of gender’, in F. Blau, M. Brinton and D. Grusky (eds),
The Declining Significance of Gender?, Russell Sage Foundation, New York, 2006.
C. Goldin, ‘A grand gender convergence: its last chapter’, American Economic Review, 2014, 104, 1091–119.
0
5
10
15
20
25
30
35
20 25 30 35 40 45 50
Gap
(%)
Age 1950s 1960s 1970s 1980s
The gender wage gap
Institute for Fiscal Studies 9
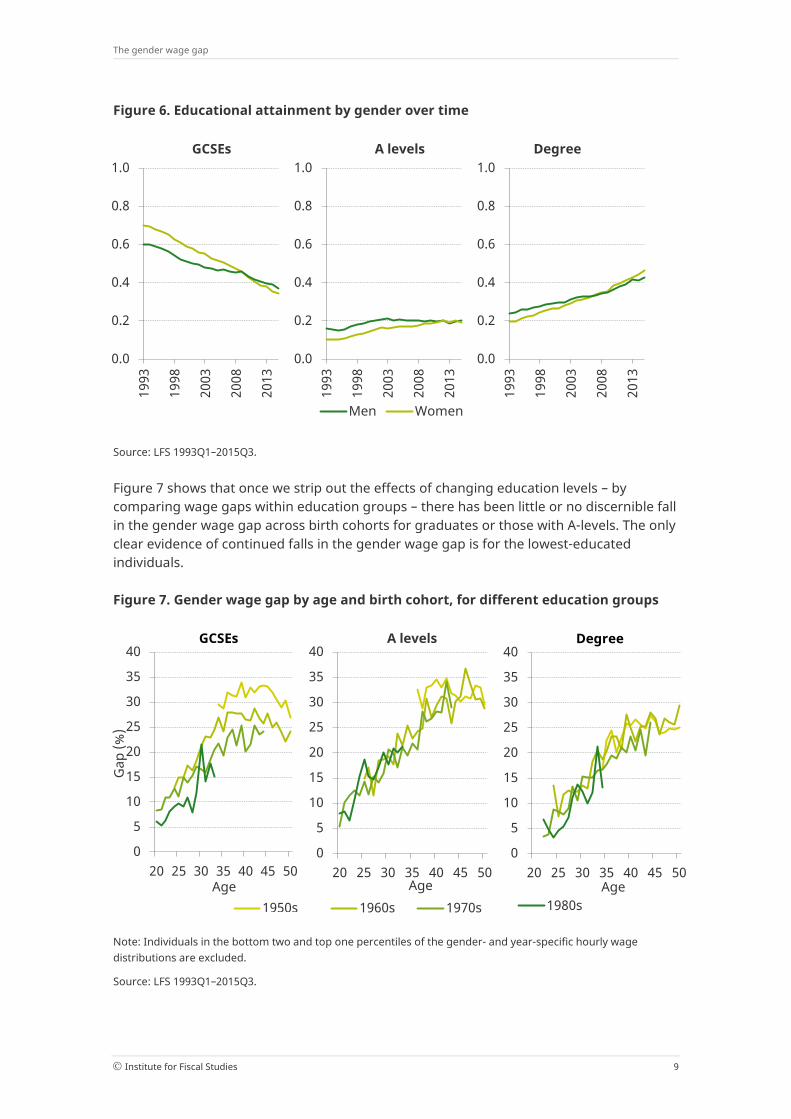
Figure 6. Educational attainment by gender over time
Source: LFS 1993Q1–2015Q3.
Figure 7 shows that once we strip out the effects of changing education levels – by comparing wage gaps within education groups – there has been little or no discernible fall in the gender wage gap across birth cohorts for graduates or those with A-levels. The only clear evidence of continued falls in the gender wage gap is for the lowest-educated individuals.
Figure 7. Gender wage gap by age and birth cohort, for different education groups
Note: Individuals in the bottom two and top one percentiles of the gender- and year-specific hourly wage distributions are excluded.
Source: LFS 1993Q1–2015Q3.
0.0
0.2
0.4
0.6
0.8
1.0
1993
1998
2003
2008
2013
GCSEs
0.0
0.2
0.4
0.6
0.8
1.0
1993
1998
2003
2008
2013
A levels
Men Women
0.0
0.2
0.4
0.6
0.8
1.0
1993
1998
2003
2008
2013
Degree
0
5
10
15
20
25
30
35
40
20 25 30 35 40 45 50
Gap
(%)
Age
GCSEs
1950s
0
5
10
15
20
25
30
35
40
20 25 30 35 40 45 50 Age
A levels
1960s 1970s
0
5
10
15
20
25
30
35
40
20 25 30 35 40 45 50 Age
Degree
1980s

The gender wage gap
Institute for Fiscal Studies 10
Figure 8 makes a similar point by simply plotting the gender wage gap over time for the three different education groups. This confirms that the wage gap among the lowest-educated individuals has been falling steadily for the past two decades, but in contrast the gap for those with A levels and degrees is approximately the same as it was 20 years ago. This implies that the fall in the overall gender wage gap over the past 20 years has been driven by the lowest-educated individuals, and by an increase in the number of women who are highly educated. Interestingly it is now the mid-educated (those with A levels) among whom the gender wage gap is highest.
Figure 8. Gender wage gap by education level over time
Note: Individuals in the bottom two and top one percentiles of the gender- and year-specific hourly wage distributions are excluded.
Source: LFS 1993Q1–2015Q3.
2. How does the gender wage gap relate to children and career patterns?
We now look at how the gender wage gap evolves over the life cycle and, crucially, how this relates to the arrival of children and the changes in labour market behaviour associated with that. Figure 9 shows how average wages for male and female employees relate to their age (pooling all cohorts who are observed at the relevant ages between 1993 and 2015). It is important to note that the sets of individuals who are employed at each age are different. It is possible, for example, that women with low levels of experience return to employment in their 40s, thereby dragging down average wages at that age. Wages are shown in 2008 constant-wage terms – that is, the effects of general wage growth over time are stripped out. For example, if the figure shows wages
0%
5%
10%
15%
20%
25%
30%
35%
1993
19
94
1995
19
96
1997
19
98
1999
20
00
2001
20
02
2003
20
04
2005
20
06
2007
20
08
2009
20
10
2011
20
12
2013
20
14
2015
Gap
(%)
GCSEs A levels Degree

The gender wage gap
Institute for Fiscal Studies 11
increasing with age, this means that wages increase by more than would be expected simply due to economy-wide growth.
The figure shows that wages are typically positively associated with age, for both men and women. It also shows that this wage profile is significantly steeper for the high-educated – that is, not only are wages higher on average for the higher-educated at the start of a career, but they also increase more rapidly with age after that point.
Figure 9. Mean hourly wages across the life cycle by gender and education
Note: Wages are shown in 2008 constant-wage terms. Individuals in the bottom two and top one percentiles of the gender- and year-specific hourly wage distributions are excluded.
Source: LFS 1993Q1–2015Q3.
The gender wage gap is relatively small or non-existent at around the time of labour market entry and it widens only slowly up to the mid 20s (and especially slowly for graduates). The gap then opens up more from around the late 20s and gets gradually wider over the next 20 years of the life cycle. This is because male wages continue to increase, especially for the high-educated, while female wages completely flatline on average. (Again, recall that this does not mean literally no change in female wages as women age; it means that there is no association with age once the effect of general, economy-wide wage growth over time has been stripped out.)
The fact that the gender wage gap begins to open up more when people reach their late 20s suggests that the arrival of children may have something to do with it.6 Figure 10 plots the wage gap not by age, but by time to or since the birth of the first child in a family (where zero is the year in which that child is born). The figure shows that the gender wage gap widens dramatically in the years after the arrival of the first child. There is, on average, a wage gap of over 10% even before the arrival of the first child, but this gap appears fairly stable until the child arrives and is small relative to what follows: after the
6 As also documented in G. Paull, ‘Children and women’s hours of work’, Economic Journal, 2008, 118, F8–27.
0
5
10
15
20
25
20 25 30 35 40 45 50
Hou
rly w
age
(£)
Age
GCSEs
0
5
10
15
20
25
20 25 30 35 40 45 50 Age
A levels
Men Women
0
5
10
15
20
25
20 25 30 35 40 45 50 Age
Degree

The gender wage gap
Institute for Fiscal Studies 12
child arrives, there is a gradual but continual rise in the wage gap over the following 12 years, until it reaches a plateau of around 33%.
Figure 10. Gender wage gap by time to/since birth of first child
Note: Individuals in the bottom two and top one percentiles of the gender- and year-specific hourly wage distributions are excluded.
Source: BHPS 1991–2008.
It is important to remember that we are analysing hourly wages here, not weekly earnings. Therefore this is not a simple mechanical effect of women working fewer hours in order to care for children and hence missing out on extra hours of pay.
However, for more subtle reasons, Figure 10 suggests that changes in women’s working patterns after the arrival of children may well be important in explaining this wage gap. The crucial observation is that the gap opens up gradually after the first child arrives and continues to widen for many years after that point. This suggests a potentially important role for the accumulation of labour market experience in the determination of wages: as women are likely to do less paid work after the arrival of children, the level of labour market experience they have falls further and further behind that of their male counterparts, and the wage gap therefore widens (though there are other potential explanations as well, such as differences in occupational choice or employers exercising market power). We further investigate this possible experience mechanism below.
Before proceeding to that, it is worth noting that this story cannot explain the (much smaller) gender wage gap that already exists before the arrival of the first child. The reasons for that gap are certainly worthy of more investigation. But Figure 10 clearly shows that, to explain the bulk of the gender wage gap that ultimately opens up, we need to consider what happens after the arrival of children.
Figure 11 shows the employment rates of men and women by the time to or since the birth of the first child. Before the arrival of the first child, there are no differences in
0
5
10
15
20
25
30
35
40
-5 0 5 10 15 20
Wag
e ga
p (%
)
Years before/since birth of first child
Before first child
After birth of first child
The gender wage gap
Institute for Fiscal Studies 13
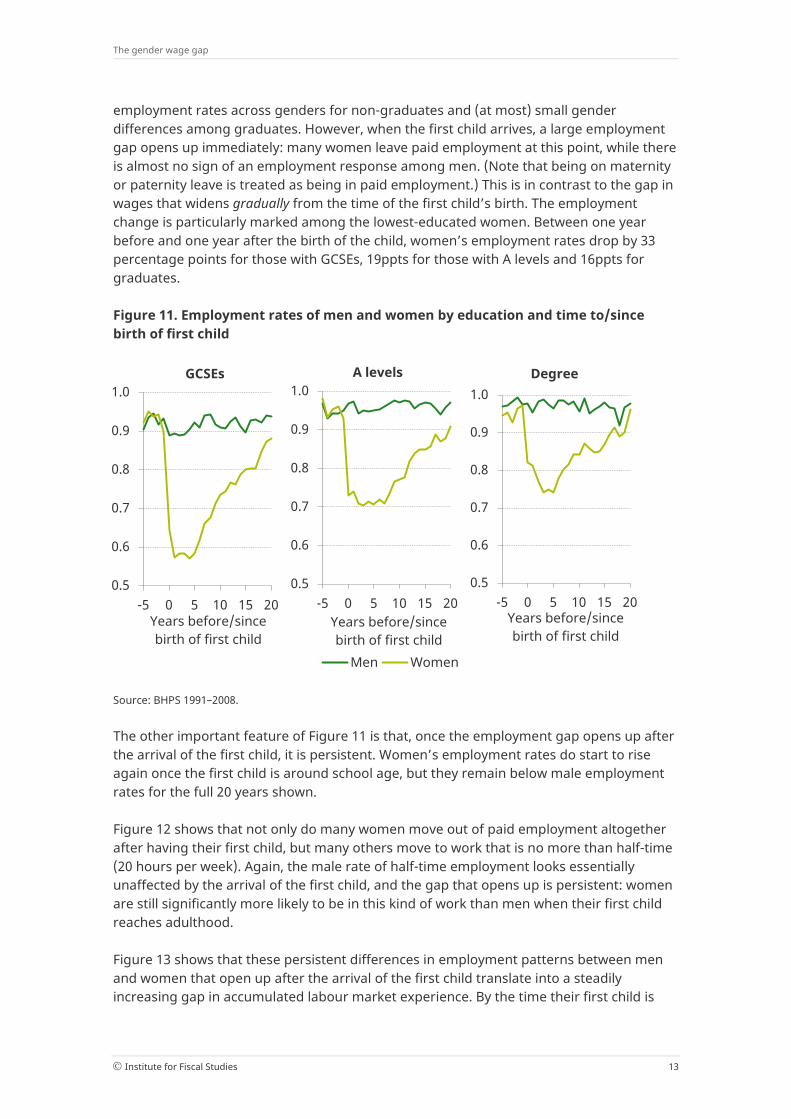
employment rates across genders for non-graduates and (at most) small gender differences among graduates. However, when the first child arrives, a large employment gap opens up immediately: many women leave paid employment at this point, while there is almost no sign of an employment response among men. (Note that being on maternity or paternity leave is treated as being in paid employment.) This is in contrast to the gap in wages that widens gradually from the time of the first child’s birth. The employment change is particularly marked among the lowest-educated women. Between one year before and one year after the birth of the child, women’s employment rates drop by 33 percentage points for those with GCSEs, 19ppts for those with A levels and 16ppts for graduates.
Figure 11. Employment rates of men and women by education and time to/since birth of first child
Source: BHPS 1991–2008.
The other important feature of Figure 11 is that, once the employment gap opens up after the arrival of the first child, it is persistent. Women’s employment rates do start to rise again once the first child is around school age, but they remain below male employment rates for the full 20 years shown.
Figure 12 shows that not only do many women move out of paid employment altogether after having their first child, but many others move to work that is no more than half-time (20 hours per week). Again, the male rate of half-time employment looks essentially unaffected by the arrival of the first child, and the gap that opens up is persistent: women are still significantly more likely to be in this kind of work than men when their first child reaches adulthood.
Figure 13 shows that these persistent differences in employment patterns between men and women that open up after the arrival of the first child translate into a steadily increasing gap in accumulated labour market experience. By the time their first child is
0.5
0.6
0.7
0.8
0.9
1.0
-5 0 5 10 15 20 Years before/since birth of first child
GCSEs
0.5
0.6
0.7
0.8
0.9
1.0
-5 0 5 10 15 20 Years before/since birth of first child
A levels
Men Women
0.5
0.6
0.7
0.8
0.9
1.0
-5 0 5 10 15 20 Years before/since birth of first child
Degree

The gender wage gap
Institute for Fiscal Studies 14
aged 20, women have on average been in paid work for four years less than men, comprising nine years less paid work at more than 20 hours per week and five years more paid work at no more than half-time. The gap is larger still for the low-educated.
Figure 12. Proportion of all men and women in jobs of no more than 20 hours per week, by education and time to/since birth of first child
Source: BHPS 1991–2008.
Figure 13. Gender gap in years spent working more than half-time and half-time or less, since birth of first child
Note: Individuals in the bottom two and top one percentiles of the gender- and year-specific hourly wage distributions are excluded.
Source: BHPS 1991–2008.
0.0
0.1
0.2
0.3
0.4
-5 0 5 10 15 20 Years before/since birth of first child
GCSEs
0.0
0.1
0.2
0.3
0.4
-5 0 5 10 15 20 Years before/since birth of first child
A levels
Men Women
0.0
0.1
0.2
0.3
0.4
-5 0 5 10 15 20 Years before/since birth of first child
Degree
0
2
4
6
8
10
0 5 10 15 20
Gen
der g
ap (y
ears
)
Years since birth of first child
More than 20 hours per week
GCSEs A levels
-10
-8
-6
-4
-2
0
0 5 10 15 20 Years since birth of first child
20 hours per week or less
Degree All

The gender wage gap
Institute for Fiscal Studies 15
Previous research7 suggests that the four years less spent in any form of paid work understates the gender differences in accumulated ‘human capital’ (i.e. skills and experience that employers value). This is because it is only full-time paid work which has substantial benefits in terms of the accumulation of experience that allows workers to command higher wages in future.
Taken together, the descriptive analysis above strongly suggests that differences in career patterns stemming from the birth of children have a key role to play in explaining the evolution of the gender wage gap across the life cycle. To understand rigorously how specific kinds of career paths affect the evolution of women’s wages, we need a model to carefully distinguish the causal impacts of these outcomes from ‘selection effects’ – the fact that women who are in different employment situations are not the same, and that they may therefore have seen different patterns of wage growth regardless of those employment patterns. That modelling work is the next phase of this project. However, below we briefly describe some of the key patterns in the data using simple statistical regression analysis. This helps to highlight some of the potential mechanisms that link women’s career patterns to their wages.
Consider first those women who take time out of the labour market altogether. Table 1 takes women observed moving out of paid work and then back into employment, and it looks at what happens, on average, to their hourly wages either side of that ‘gap’ in labour market experience. It shows that hourly wages for those who return to work are, on average, about 2% lower for each year that they have taken out of employment in the interim.
Table 1. Association between changes in (log) hourly wages and length of time out of paid work in the interim, for women who move out of employment and then return
Dependent variable: change in log(wage)
GCSEs A levels / Degree All
Additional year out of employment –0.004 –0.045*** –0.021** Number of women 431 307 738
Note: *** p<0.01, ** p<0.05, * p<0.1. Only women observed in work, out of work, and moving back into work are included in the regression. In addition to the reported coefficients, the regressions control for working half-time after and before the gap (separately), number of years spent working more than half-time and number of years spent working no more than half-time. Individuals in the bottom two and top one percentiles of the gender- and year-specific hourly wage distributions are excluded.
Source: BHPS 1991–2008.
Table 1 further shows that this strong and statistically significant association between periods not in employment and changes in hourly wages is not present when we look only at women with no more than GCSE-level qualifications. This is consistent with the findings of Figure 9, which showed that there is a much weaker positive association between experience and wages for low-educated women than for high-educated women. This suggests that experience may not be as valuable for low-educated individuals, in which 7 R. Blundell, M. Costa-Dias, C. Meghir and J. Shaw, ‘Female labour supply, human capital and welfare reform’,
IFS Working Paper W16/03, 2016, http://www.ifs.org.uk/publications/8170 (forthcoming in Econometrica).
The gender wage gap
Institute for Fiscal Studies 16
case the resulting wage penalty from spending time not in employment would be smaller. Hence, while low-educated women tend to take more time out of the labour market after childbirth, the costs to them of doing so – in terms of loss of wage progression – may be lower.
Now consider women who are in half-time paid work (no more than 20 hours per week). These women earn, on average, 25% (£3) less per hour than other female employees. Of course, one reason for this may be that the kinds of women doing half-time paid work are just different from those doing more paid work. However, even if that were not the case, one could think of two possible reasons for the association between low hours of paid work and lower hourly wages. First, it might be that half-time jobs are different from other jobs and individuals working few hours have a lower average wage because of these differences in the types of jobs that they do. Second, working half-time this year may lead to slower wage growth, and hence lower wages next year than would otherwise have been the case, by inhibiting the accumulation of human capital. Tables 2 and 3 investigate these two channels separately.
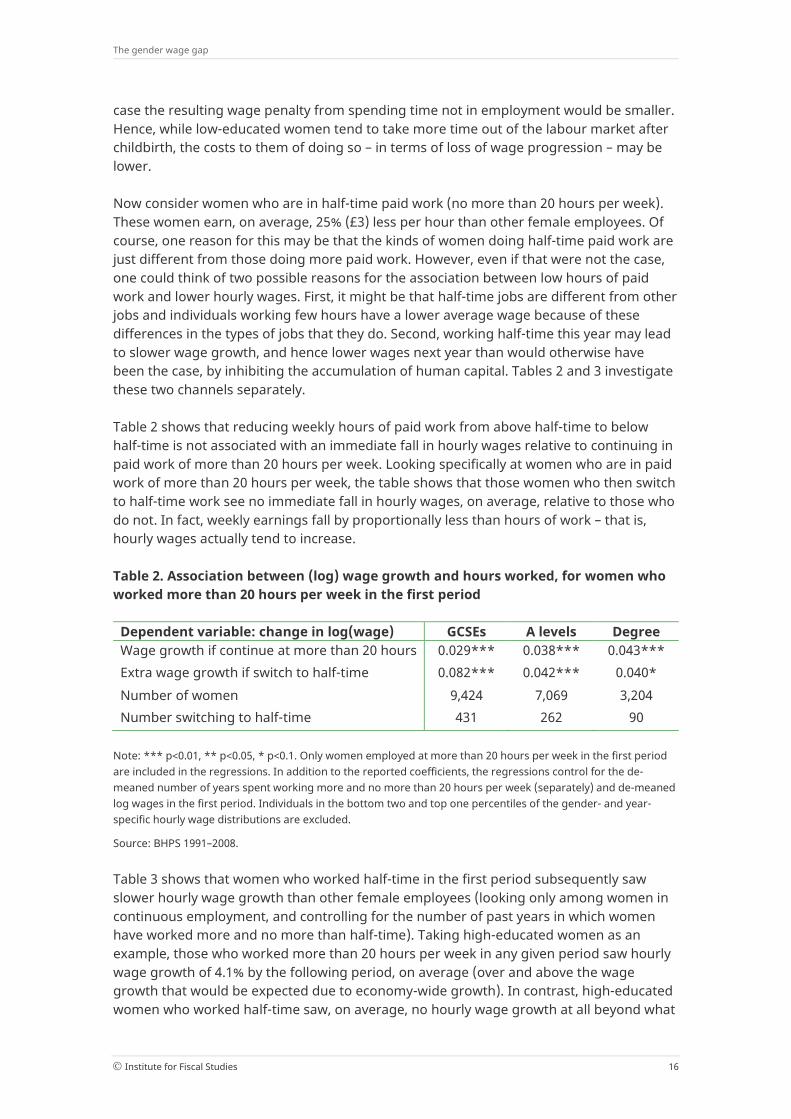
Table 2 shows that reducing weekly hours of paid work from above half-time to below half-time is not associated with an immediate fall in hourly wages relative to continuing in paid work of more than 20 hours per week. Looking specifically at women who are in paid work of more than 20 hours per week, the table shows that those women who then switch to half-time work see no immediate fall in hourly wages, on average, relative to those who do not. In fact, weekly earnings fall by proportionally less than hours of work – that is, hourly wages actually tend to increase.
Table 2. Association between (log) wage growth and hours worked, for women who worked more than 20 hours per week in the first period
Dependent variable: change in log(wage) GCSEs A levels Degree Wage growth if continue at more than 20 hours 0.029*** 0.038*** 0.043*** Extra wage growth if switch to half-time 0.082*** 0.042*** 0.040* Number of women 9,424 7,069 3,204 Number switching to half-time 431 262 90
Note: *** p<0.01, ** p<0.05, * p<0.1. Only women employed at more than 20 hours per week in the first period are included in the regressions. In addition to the reported coefficients, the regressions control for the de-meaned number of years spent working more and no more than 20 hours per week (separately) and de-meaned log wages in the first period. Individuals in the bottom two and top one percentiles of the gender- and year-specific hourly wage distributions are excluded.
Source: BHPS 1991–2008.
Table 3 shows that women who worked half-time in the first period subsequently saw slower hourly wage growth than other female employees (looking only among women in continuous employment, and controlling for the number of past years in which women have worked more and no more than half-time). Taking high-educated women as an example, those who worked more than 20 hours per week in any given period saw hourly wage growth of 4.1% by the following period, on average (over and above the wage growth that would be expected due to economy-wide growth). In contrast, high-educated women who worked half-time saw, on average, no hourly wage growth at all beyond what

The gender wage gap
Institute for Fiscal Studies 17
would be predicted simply due to economy-wide growth (i.e. the estimated wage growth ‘penalty’ from working half-time is about 4 percentage points per year among high-educated women).
Table 3. Association between women’s (log) wage growth and hours worked in the first period
Dependent variable: change in log(wage)
GCSEs A levels Degree All
Wage growth if work more than 20 hours
0.030*** 0.038*** 0.041*** 0.030***
Extra wage growth if work half-time
–0.032*** –0.040*** –0.044*** –0.037***
Number of women 12,923 8,531 3,695 25,149 Number working half-time 3,499 1,462 491 5,452
Note: *** p<0.01, ** p<0.05, * p<0.1. In addition to the reported coefficients, the regressions control for the de-meaned number of years spent working more and no more than 20 hours per week (separately). Individuals in the bottom two and top one percentiles of the gender- and year-specific hourly wage distributions are excluded.
Source: BHPS 1991–2008.
Taken together, Tables 2 and 3 suggest that reducing hours of paid work may tend to reduce hourly wages via dynamic effects on the accumulation of human capital, rather than a simpler story that says low-hours jobs just pay less per hour. The common observation of a ‘part-time wage penalty’, for example, may arise because people who are working part-time now also tend to have worked part-time in the past – and it is that past lower work intensity which explains the lower wage now.
It is worth reiterating that these tables are essentially just descriptions of what happens to the hourly wages of groups of women who have different career patterns. This does not in itself prove that the differences in career patterns are the cause of all such wage differences, because we cannot rule out ‘selection effects’. For example, women who work half-time may be the kind of women who would have experienced slower wage growth even if their hours of work were higher.
In the next stage of this research programme, we will directly estimate the causal links between career patterns and the dynamics of the gender wage gap. We will do this by developing and estimating a model of the career choices of men and women, and how these relate to the presence of dependent children and the build-up of labour market experience.


