
THE HEALTH SECTOR IN GHANA
FACTS AND FIGURES
2017

i
FOREWORD
The Ghana Health Service (GHS) together with other health Agencies of the Ministry of Health
(MoH) and its Development Partners are committed to the provision of quality and adequate
health care services to the people of Ghana. This involves the planning, implementation,
monitoring and evaluation of health programmes and services in accordance with approved
national policies. In order to fulfill this part of its mandate, timely, accurate and relevant
information on the health status and health services in Ghana is essential.
The production of ‘The Health Sector in Ghana: Facts and Figures’ since 2005 has become a
handy reference on the performance of the health sector as an information tool for policy
makers, health service/programme managers, health partners, stakeholders, researchers and
students. ‘Facts and Figures’ is a document developed by the Centre for Health Information
Management (CHIM) under the Policy Planning Monitoring and Evaluation Division
(PPMED) of the GHS in collaboration with other Agencies and Development Partners. CHIM
is the focal unit responsible for the collection, analysis, reporting and presentation of health
service information of the Health Sector. This document is developed annually after the first
quarter of a calendar year, with conclusion of the GHS Regional and Headquarters Annual
Performance Reviews that culminate in writing of a GHS Annual Report for the previous year.
The information contained in this document is mainly summaries and population-based
indicators. Precisely its information are mainly summaries of service data from all the regions,
districts, health facilities (Government, Christian Health Association of Ghana – CHAG and
Private), population-based data from Ghana’s Demographic Health and Survey (GDHS) - a
document produced by Ghana Statistical Service, and other sources data.
I am confident that this information tool would provide readers with an excellent glimpse or
preview of the health sector performance. However, readers are further directed to the “The
Ghana Health Service Annual Report” and “Ghana Health Service Annual Statistical Report”
for detailed presentation of the performance of the health sector.
DR. ANTHONY NSIAH-ASARE
Director General
Ghana Health Service

ii
ACKOWLEDGEMENTS
The Health Sector in Ghana: Facts and Figures 2017 was developed by a Technical Working
Group (TWG) mainly from the Centre for Health and Information Management (CHIM) of the
Policy Planning, Monitoring, and Evaluation Division (PPMED) of the Ghana Health Service
(GHS) in collaboration with the World Health Organization (WHO). The TWG was ably led
by Dr. Koku Awoonor-Williams, Director PPMED of the GHS.
In no special order the Technical Working Group members are:
1. Dr. Koku Awoonor-Williams, Director, PPMED/GHS, Accra
2. Dr. Anthony Ofosu, Deputy Director, M&E, PPMED/GHS, Accra
3. Dr. K. Boateng Boakye, Public Health Specialist, PPMED/GHS, Accra
4. Mr. Denis Leonard Adaletey, Deputy Head, CHIM, PPMED, GHS, Accra
5. Mrs. Emma Hammond, PPMED, IME, GHS, Accra
6. Mr. Ben Benasco Sackey WHO, Accra
7. Miss. Patience Kumi, CHIM, PPMED, GHS, Accra
8. .Mr. Atsu Bon Ayi, CHIM, PPMED, GHS, Accra
9. Mr. James Makpa, CHIM, PPMED, GHS, Accra
10. Mr.Kingsley Baah, CHIM, PPMED, GHS, Accra
11. Dominic Kwabena Atweam IME, PPMED, GHS, Accra
12. Mrs. Cecilia Lamptey CHIM, PPMED, GHS, Accra
13. Miss. Joyce Odonkor CHIM, PPMED, GHS, Accra
The 2017 Facts and Figures was developed by the Policy Planning, Monitoring and Evaluation
Division (PPMED) of the GHS as a result of the collaboration between Ministry of Health,
World Health Organization, Ghana Statistical Services, other Health Implementing Agencies
and Development Partners
The Ghana Health Service would like to specially acknowledge the support and rich
contribution of Ghana Statistical Services in the provision of health-related statistics to the
general public and other Health Implementing Agencies and Development Partners.

iii
List of Acronyms
BMC Budget Management Centre
CFR Case Fatality Rate
CHAG Christian Health Association of Ghana
CHIM Centre for Health Information Management
CHPS Community-based Health Planning and Services
DHIMS 2 District Health Information Management System 2
EPI EPI, GHS
GGDHS Ghana Demographic and Health Survey
GHS Ghana Health Service
GSS Ghana Statistical Services
GSGDA Ghana Shared Growth and Development Agenda
HRDD Human Resource Development Division
HSMTDP Health Sector Medium Term Development Plan
IME Information, Monitoring & Evaluation
NACP National AIDS Control Programme
NHIS National Health Insurance Scheme
PHC Primary Health Care
PHD Public Health Division
PPME Policy Planning Monitoring and Evaluation

iv
TABLE OF CONTENTS TABLE OF CONTENTS .......................................................................................................... iv
List of Acronyms ..................................................................... Error! Bookmark not defined.
INTRODUCTION ..................................................................................................................... 1
2014 HEALTH SECTOR OBJECTIVES .................................................................................. 1
1.0 Demography ........................................................................................................................ 1
1.1 Population Distribution by Region – 2016 ...................................................................... 3
1.2 Population Distribution by District, Ashanti Region – 2016 ........................................... 3
1.3 Population Distribution by District, Brong Ahafo Region – 2016 .................................. 5
1.4 Population Distribution by District, Central Region – 2016............................................ 6
1.5 Population Distribution by District, Eastern Region – 2016 ........................................... 7
1.6 Population Distribution by District, Greater Accra – 2016 ............................................. 8
1.7 Population Distribution by District, Northern Region – 2016 ......................................... 9
1.8 Population Distribution by District, Upper East Region – 2016 ................................... 10
1.9 Population Distribution by District, Upper West Region – 2016 .................................. 11
1.10 Population Distribution by District, Volta Region – 2016 .......................................... 11
1.11 Population Distribution by District, Western Region – 2016 ...................................... 12
2.0 Vital Statistics ...................................................................................................................... 1
2.1 Health Status Indicators ................................................................................................. 13
2.2 Total Fertility Rate by Region ....................................................................................... 13
2.3 Percentage of Population with no Education ................................................................. 14
2.4 Infant and Under Five Mortality Rate ............................................................................ 15
2.5 Demographic and Socioeconomic Indicators ................................................................ 16
2.6 Health-Related Millennium Development Goals........................................................... 18
2.7 Health Expenditure Indicators ....................................................................................... 19
3.0 Health Infrastructure .......................................................................................................... 20
3.1 Health Facilities by Type and Ownership, 2015 ............................................................ 20
3.2 Number of Hospital Beds by Region and Ownership - 2015 ........................................ 21
3.3 Distribution of Health Professionals by Region – 2015 ................................................ 22
3.4 Doctor to Population Ratio ............................................................................................ 26
3.5 Nurse to Population Ratio .............................................................................................. 28
3.6 Hospital Bed Utilisation Statistics ................................................................................. 29
4.0 Health Service Outputs ...................................................................................................... 31
4.1 Number of Outpatient Attendance by Region ............................................................... 31
4.2 Outpatient Attendance per Capita .................................................................................. 32
4.3 Number of Inpatient Admissions by Region ................................................................. 33
4.4 Hospital Admission Rate ............................................................................................... 34
4.5 Case Fatality Rate for Malaria ....................................................................................... 35
4.5 Top Twenty Causes of Outpatient Morbidity 2002 -2015 ............................................. 36
5.0 PUBLIC HEALTH SERVICES ........................................................................................ 42
5.1 HIV Prevalence among pregnant women attending ANC clinics ................................. 42
5.2 HIV Prevalence among pregnant women by Age Groups ............................................. 42
5.3 Guinea Worm Cases ...................................................................................................... 42
5.4 Tuberculosis Case Notification per 100,000 Population ............................................... 43
5.5 Tuberculosis Cure Rate .................................................................................................. 43
5.6 Tuberculosis Success Rate ............................................................................................. 44
6.0 EPI, GHS............................................................................................................................ 45
7.0 Reproductive Health Services ............................................................................................ 49
APPENDIX 1 ........................................................................................................................... 54
APPENDIX 2 ........................................................................................................................... 56

1
INTRODUCTION
The Health Sector in Ghana: Facts and Figures serves as an information tool for policy makers,
health service/programme managers, health partners, stakeholders, researchers and students on
health sector performance. Facts and Figures for a particular year have population estimates,
human resource, and health facilities list for the year of the facts and figures. However for the
service data available figures provided are up to that of the previous year and indicator estimates
from WHO/UNDP are the most recent Global estimate figures for the particular year.
The need for complete, accurate, timely and for that matter reliable health information for
decision making at all levels of the health service, inclusive of effective and efficient planning
cannot be overemphasized. The DHIMS2 database manned by Ghana Health Service (GHS)
provides the framework for gathering and managing health service data in Ghana.
The Health Sector Medium Term Development Plan (HSMTDP), 2014–2017, provides an
outline of the health sector response to governments Medium Term Development Policy
Framework (2014-2017). It also provides the basis for planning within the health sector in Ghana
and defines the sector’s contribution to the achievement of national medium term development
goals and objectives. The HSMTDP builds on the general principles of providing affordable
Primary Health Care (PHC) to all people living in Ghana, underpinned by the desire to attain
Universal Health Coverage for basic health services in Ghana. It also aims to improve the health
status of Ghanaians in line with the country’s Lower Middle Income Status. In this regard, the
plan provides a framework for cost-effective general health systems development, bridging
current equity gaps in access to health care services and a reinforcement of the principle of
continuum of care. It builds on lessons and experiences of the Ghana Shared Growth and
Development Agenda (GSGDA), which had a focus on human development, productivity and
employment and attempts to hasten the achievements of the goals of the better Ghana Agenda.
Over the years capturing outpatient and inpatient data from the Teaching Hospitals have been a
challenge which situation has improved over the years. Ongoing collaborative discussions would
eventually make it a thing of the past. Similarly the degree of capture of private sector service
data although has witnessed some improvement over the years needs to be further enhancement.
Though data is readily available online, generated Facts and Figures provides instant access of
reliable data to managerial, especially in times when their busy schedules make any savings on
time worth the effort no matter how minute. Therefore, it is expected that this document which
has become an easy source of reference will support managerial leaders to make timely and
appropriate decisions to improve service delivery.
Mandate The Mandate of the Service is to:
Implement approved national policies for health delivery in the country; Increase access to improved health services; and Manage prudently resources available for provision of health services.
Mission

2
The Mission of the Service is to:
Provide and prudently manage comprehensive and accessible quality health services with
emphasis on Primary Health Care in accordance with approved national policies.
2017 HEALTH SECTOR OBJECTIVES
The Health Objectives within the Sector Medium Term Development Plan 2014-2017 are to:
1. Bridge the equity gaps in geographical access to health services.
2. Ensure sustainable financing for health care delivery and financial protection for the poor.
3. Improve efficiency in governance and management of the health system.
4. Improve quality of health services delivery including mental health services.
5. Enhance national capacity for the attainment of the health related MDGs and sustain the
gains.
6. Intensify prevention and control of non-communicable and other communicable diseases.
GHS Core Values
In pursuit of its mission, the GHS is guided by these core values:
1. Professionalism
2. People-Centredness/Client Focus
3. Discipline
4. Teamwork
5. Innovation and Excellence
6. Integrity
In addition to above core values the GHS is partner-friendly, collaborating effectively with all
its partners to harness their capacity and competitive advantage. Furthermore, the GHS ensures
that its programmes and activities are driven by evidence-based decisions.

3
1.0 Demography
1.1 Population Distribution by Region – 2017
No. Region Regional
Projection
Target Population
<1 year and
Expected
Pregnancies (4%)
Target Population
for WIFA (24%)
No. of
Districts
per
Region
1 Ashanti 5,552,177 222,087 1,332,522 30
2 Brong Ahafo 2,732,479 109,299 655,795 27
3 Central 2,503,619 100,145 600,868 20
4 Eastern 3,110,369 124,415 746,489 26
5 Greater Accra 4,738,205 189,528 1,137,169 16
6 Northern 2,935,980 117,439 704,635 26
7 Upper East 1,220,898 48,836 293,015 13
8 Upper West 813,933 32,557 195,344 11
9 Volta 2,499,936 99,997 599,985 25
10 Western 2,965,029 118,601 711,607 22
National 29,072,625 1,162,905 6,977,430
Source: GSS 2010 Census (Projection)
1.2 Population Distribution by District, Ashanti Region – 2017
No. District District
Projection
Target
Population <1
year and
Expected
Pregnancies
(4%)
Target Population
for WIFA (24%)
All districts 5,552,177 222,087 1,332,522
1 Atwima Mponua
139,188
5,568 33,405
2 Amansie West
155,898
6,236 37,415
3 Amansie Central
105,857
4,234 25,406
4 Adansi South
133,622
5,345 32,069
5 Obuasi Municipal
194,864
7,795 46,767
6 Adansi North
122,489
4,900 29,397
7 Bekwai Municipal
123,640
4,946 29,673
8 Bosome Freho
72,378
2,895 17,371

4
9 Asante Akim South
139,200
5,568 33,408
10 Asante Akim Central
Municipal
83,505
3,340 20,041
11 Ejisu Juaben
167,035
6,681 40,088
12 Bosomtwi
111,357
4,454 26,726
13 Atwima Kwanwoma
105,785
4,231 25,388
14 Kumasi Metro
2,015,497
80,620 483,719
15 Atwima Nwabiagya
172,596
6,904 41,423
16 Ahafo Ano South
139,188
5,568 33,405
17 Ahafo Ano North
111,361
4,454 26,727
18 Offinso Municipal
89,091
3,564 21,382
19 Afigya Kwabre
155,893
6,236 37,414
20 Kwabre East
133,625
5,345 32,070
21 Sekyere South
111,357
4,454 26,726
22 Mampong Municipal
100,216
4,009 24,052
23 Sekyere East
72,379
2,895 17,371
24 Sekyere Kumawu
77,948
3,118 18,708
25 Sekyere Central
83,515
3,341 20,044
26 Ejura Sekye Dumasi
100,214
4,009 24,051
27 Offinso North
66,808
2,672 16,034
28 Asokore Mampong
Municipal
356,331
14,253 85,519
29 Asante Akim North
77,934
3,117 18,704
30 Sekyere Afram Plains North
33,407
1,336 8,018
Source: GSS 2010 Census (Projection)

5
1.3 Population Distribution by District, Brong Ahafo Region – 2017
No. District District
Projection
Target
Population <1
year and
Expected
Pregnancies
(4%)
Target Population
for WIFA (24%)
All Districts
2,732,485
109,299
655,797
1 Asunafo South 112,259 4,490 26,942
2 Asunafo North 147,794 5,912 35,470
3 Asutifi North 63,031 2,521 15,127
4 Dormaa Municipal 134,151 5,366 32,196
5 Dormaa Central Municipal 60,242 2,410 14,458
6 Tano South District 93,093 3,724 22,342
7 Tano North District 95,830 3,833 22,999
8 Sunyani Municipal 145,110 5,804 34,826
9 Sunyani West District 101,307 4,052 24,314
10 Berekum Municipal 153,331 6,133 36,799
11 Jaman South District 109,527 4,381 26,287
12 Jaman North District 98,560 3,942 23,654
13 Tain District 104,037 4,161 24,969
14 Wenchi Municipal 106,779 4,271 25,627
15 Techiman Municipal 175,210 7,008 42,050
16 Nkoranza South District 109,517 4,381 26,284
17 Nkoranza North District 79,407 3,176 19,058
18 Atebubu Amantin District 125,940 5,038 30,226
19 Sene West District 68,456 2,738 16,429
20 Pru District 153,328 6,133 36,799
21 Kintampo South District 95,832 3,833 23,000
22 Kintampo North District 112,260 4,490 26,942
23 Dormaa West District 57,503 2,300 13,801
24 Asutifi South District 62,974 2,519 15,114
25 Techiman North District 71,183 2,847 17,084
26 Banda District 24,643 986 5,914
27 Sene East District 71,179 2,847 17,083
Source: GSS 2010 Census (Projection)

6
1.4 Population Distribution by District, Central Region – 2017
No. District District
Projection
Target
Population <1
year and
Expected
Pregnancies
(4%)
Target Population
for WIFA (24%)
All Districts 2,500,695 100,028 600,167
1 Abura Asebu 125,806
5,032
30,194
2 Agona East 100,087
4,003
24,021
3 Agona West 133,742
5,350
32,098
4 Ajumako Enyan Essiam 149,108
5,964
35,786
5 Asikuma Odoben Brakwa 130,855
5,234
31,405
6 Assin North 188,548
7,542
45,252
7 Assin South 118,824
4,753
28,518
8 Awutu Senya East 126,583
5,063
30,380
9 Cape Coast Municipal 185,202
7,408
44,448
10 Effutu Municipal 79,979
3,199
19,195
11 Ekumfi 59,327
2,373
14,238
12 Ewutu Senya 100,625
4,025
24,150
13 Gomoa East 241,992
9,680
58,078
14 Gomoa West 154,976
6,199
37,194
15 KEEA 156,813
6,273
37,635
16 Mfantsiman 158,119
6,325
37,949
17 Twifo Heman Lower
Denkyira
64,155
2,566
15,397
18 Twifo Ati Morkwa 71,980
2,879
17,275
19 Upper Denkyira East 84,604
3,384
20,305
20 Upper Denkyira West 69,369
2,775
16,648
Source: GSS 2010 Census (Projection)

7
1.5 Population Distribution by District, Eastern Region – 2017
No. District District
Projection
Target Population <1
year and Expected
Pregnancies (4%)
Target
Population
for WIFA
(24%)
All Districts 3,110,369 124,415 746,489
1 Birim South 140,250 5,610
33,660
2 Birim Municipal 171,434 6,857
41,144
3 West Akim Municipal 127,784 5,111
30,668
4 Suhum Municipal 105,956 4,238
25,429
5 Nsawam Adoagyiri 102,844 4,114
24,683
6 Akwapim North 162,072 6,483
38,897
7 New Juaben 218,133 8,725
52,352
8 Yilo Krobo 102,858 4,114
24,686
9 Lower Manya 105,970 4,239
25,433
10 Asuogyaman 115,313 4,613
27,675
11 Upper Manya 84,153 3,366
20,197
12 Fanteakwa 127,771 5,111
30,665
13 East Akim 199,469 7,979
47,873
14 Kwabibrem 134,004 5,360
32,161
15 Akyem Mansa 115,313 4,613
27,675
16 Birim North 93,496 3,740
22,439
17 Atiwa 130,902 5,236
31,417
18 Kwahu South 81,023 3,241
19,446
19 Kwahu East 90,383 3,615
21,692
20 Kwahu West 112,208 4,488
26,930
21 Kwahu Afram Plains 121,541 4,862
29,170
22 Upper West Akyem 102,846 4,114
24,683

8
23 Akwapim South 43,635 1,745
10,472
24 Ayensuano 90,380 3,615
21,691
25 Denkyembuor 93,497 3,740
22,439
26 Kwahu Afram Plains South 137,133 5,485
32,912
Source: GSS 2010 Census (Projection)
1.6 Population Distribution by District, Greater Accra – 2017
No. District District
Projection
Target Population <1
year and Expected
Pregnancies (4%)
Target
Population
for WIFA
(24%)
All Districts 4,738,205 189,528 1,137,169
1 Ga South 501,872 20,075 120,449
2 Ga West 257,690 10,308 61,846
3 Ga East 172,243 6,890 41,338
4 Accra Metropolis 1,989,131 79,565 477,391
5 Adenta Municipal 90,012 3,600 21,603
6 Ledzokoku Municipal 264,938 10,598 63,585
7 Ashaiman Municipal 222,327 8,893 53,358
8 Tema Metropolis 340,002 13,600 81,600
9 Shai Osudoku 60,007 2,400 14,402
10 Ada East 82,920 3,317 19,901
11 Ga Central 135,953 5,438 32,629
12 La Dade Kotopon 213,075 8,523 51,138
13 La Nkwantang Madina 129,905 5,196 31,177
14 Kpone Katamanso 127,325 5,093 30,558
15 Ningo Prampram 82,261 3,290 19,743
16 Ada West 68,544 2,742 16,451
Source: GSS 2010 Census (Projection)

9
1.7 Population Distribution by District, Northern Region – 2017
No. District District
Projection
Target Population <1
year and Expected
Pregnancies (4%)
Target
Population
for WIFA
(24%)
All Districts 2,935,622 117,425 704,549
1 Bole
73,375
2,935 17,610
2 East Gonja
161,299
6,452 38,712
3 Central Gonja
102,680
4,107 24,643
4 Gushiegu
131,972
5,279 31,673
5 Karaga
90,929
3,637 21,823
6 Kpandai
129,054
5,162 30,973
7 Nanumba North
167,160
6,686 40,118
8 Nanumba South
111,456
4,458 26,749
9 Salvelugu Nantom
164,243
6,570 39,418
10 Sawla Tuna Kalba
117,323
4,693 28,158
11 Tamale Metropolis
263,979
10,559 63,355
12 Tolon
85,062
3,402 20,415
13 West Gonja
49,855
1,994 11,965
14 Yendi Municipal
140,800
5,632 33,792
15 Zabzugu
76,269
3,051 18,305
16 Saboba
79,194
3,168 19,007
17 Chereponi
64,528
2,581 15,487
18 Bunkpurugu Yonyo
143,720
5,749 34,493
19 Mamprusi East
143,720
5,749 34,493
20 Mamprusi West
143,725
5,749 34,494
21 North Gonja
52,798
2,112 12,672
22 Kumbumgu
46,934
1,877 11,264

10
23 Sagnerigu Municipal
172,988
6,920 41,517
24 Mion
96,793
3,872 23,230
25 Tatale
70,397
2,816 16,895
26 Mamprugu Moagduri
55,728
2,229 13,375
Source: GSS 2000 Census (Projection)
1.8 Population Distribution by District, Upper East Region – 2017
No. District District
Projection
Target Population
<1 year and
Expected
Pregnancies (4%)
Target
Population
for WIFA
(24%)
All District
1,220,898
48,836 293,015
1 Builsa North
65,874
2,635 15,810
2 Kasena Nankana West
82,934
3,317 19,904
3 Kasena Nankana East
128,062
5,122 30,735
4 Bolgatanga Municipal
153,667
6,147 36,880
5 Talensi
95,131
3,805 22,831
6 Bongo
98,796
3,952 23,711
7 Bawku West
109,771
4,391 26,345
8 Garu Tempane
151,238
6,050 36,297
9 Bawku Municipal
114,650
4,586 27,516
10 Builsa South
42,688
1,708 10,245
11 Nabdam
39,038
1,562 9,369
12 Binduri
71,964
2,879 17,271
13 Pusiga
67,084
2,683 16,100
Source: GSS 2010Census (Projection)
11
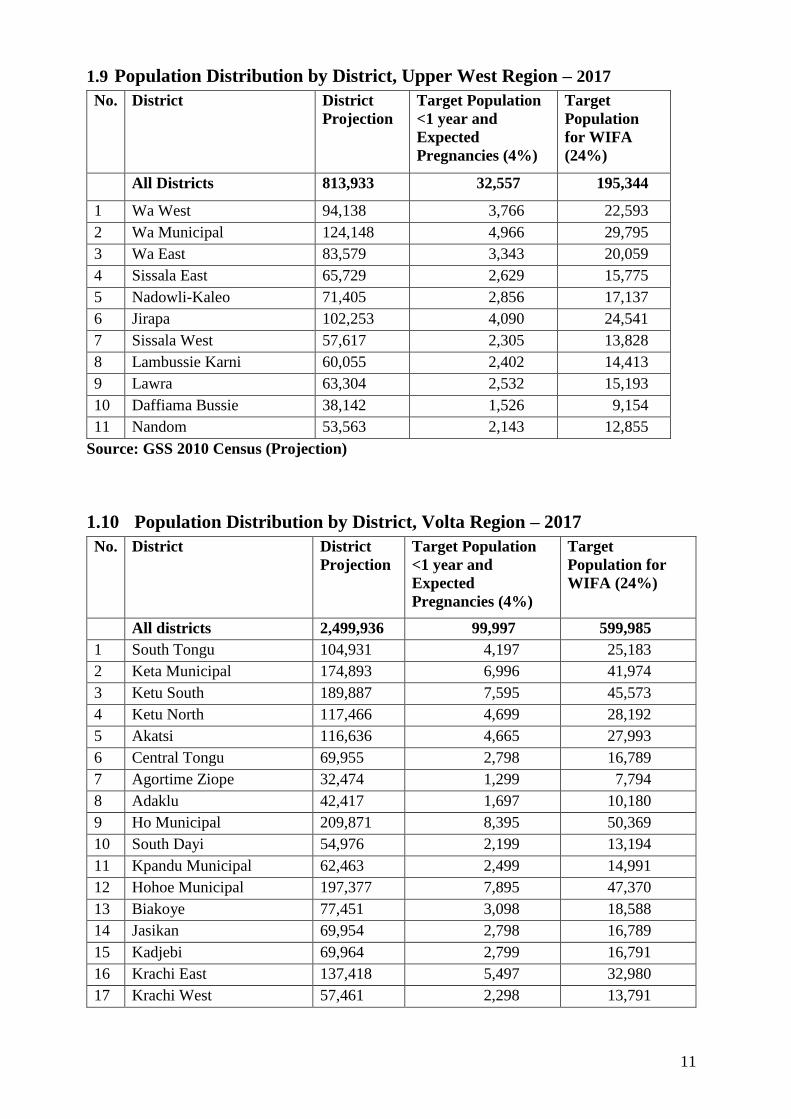
1.9 Population Distribution by District, Upper West Region – 2017
No. District District
Projection
Target Population
<1 year and
Expected
Pregnancies (4%)
Target
Population
for WIFA
(24%)
All Districts 813,933 32,557 195,344
1 Wa West 94,138 3,766 22,593
2 Wa Municipal 124,148 4,966 29,795
3 Wa East 83,579 3,343 20,059
4 Sissala East 65,729 2,629 15,775
5 Nadowli-Kaleo 71,405 2,856 17,137
6 Jirapa 102,253 4,090 24,541
7 Sissala West 57,617 2,305 13,828
8 Lambussie Karni 60,055 2,402 14,413
9 Lawra 63,304 2,532 15,193
10 Daffiama Bussie 38,142 1,526 9,154
11 Nandom 53,563 2,143 12,855
Source: GSS 2010 Census (Projection)
1.10 Population Distribution by District, Volta Region – 2017
No. District District
Projection
Target Population
<1 year and
Expected
Pregnancies (4%)
Target
Population for
WIFA (24%)
All districts 2,499,936 99,997 599,985
1 South Tongu 104,931 4,197 25,183
2 Keta Municipal 174,893 6,996 41,974
3 Ketu South 189,887 7,595 45,573
4 Ketu North 117,466 4,699 28,192
5 Akatsi 116,636 4,665 27,993
6 Central Tongu 69,955 2,798 16,789
7 Agortime Ziope 32,474 1,299 7,794
8 Adaklu 42,417 1,697 10,180
9 Ho Municipal 209,871 8,395 50,369
10 South Dayi 54,976 2,199 13,194
11 Kpandu Municipal 62,463 2,499 14,991
12 Hohoe Municipal 197,377 7,895 47,370
13 Biakoye 77,451 3,098 18,588
14 Jasikan 69,954 2,798 16,789
15 Kadjebi 69,964 2,799 16,791
16 Krachi East 137,418 5,497 32,980
17 Krachi West 57,461 2,298 13,791

12
18 Nkwanta South 139,909 5,596 33,578
19 Nkwanta North 74,950 2,998 17,988
20 North Tongu 104,932 4,197 25,184
21 Akatsi North 37,279 1,491 8,947
22 Ho West 112,426 4,497 26,982
23 Afadjato South 112,425 4,497 26,982
24 North Dayi 47,469 1,899 11,393
25 Krachi Nchumuru 84,951 3,398 20,388
Source: GSS 2010 Census (Projection)
1.11 Population Distribution by District, Western Region – 2017
No. District District
Projection
Target Population
<1 year and
Expected
Pregnancies (4%)
Target
Population for
WIFA (24%)
All Districts 2,965,029 118,601 711,607
1 Jomoro 186,752 7,470 44,820
2 Ellembello 109,704 4,388 26,329
3 Nzema East 77,135 3,085 18,512
4 Ahanta West 133,428 5,337 32,023
5 Sekondi Takoradi 696,777 27,871 167,227
6 Shama 100,816 4,033 24,196
7 Wassa East 100,811 4,032 24,195
8 Tarkwah Nsuam
Municipal
112,672 4,507 27,041
9 Prestea Huni Valley 198,656 7,946 47,677
10 Wassa Amenfi East 103,780 4,151 24,907
11 Wassa Amenfi West 115,639 4,626 27,753
12 Aowin 148,242 5,930 35,578
13 Sefwi Akontombra 103,775 4,151 24,906
14 Sefwi Wiawso 174,946 6,998 41,987
15 Sefwi Bibiani Ahwiaso
Bekwai
154,187 6,167 37,005
16 Sefwi Juaboso 74,116 2,965 17,788
17 Bia West 106,747 4,270 25,619
18 Mpohor 53,377 2,135 12,811
19 Wassa Amenfi Central 85,980 3,439 20,635
20 Suaman 26,685 1,067 6,404
21 Bodi 65,227 2,609 15,654
22 Bia East 35,575 1,423 8,538
Source: GSS 2010 Census (Projection)

13
2.0 Vital Statistics
2.1 Health Status Indicators
Indicator 1988 1993 1998 2003 2008 2014
Infant Mortality Rate (per 1,000 live births) 77 66 57 64 50 41
Under 5 Mortality Rate (per 1,000 live births) 155 119 108 111 80 60
Neonatal Mortality Rate (per 1,000 live births) 44 41 30 43 30 29
Post-Neonatal Mortality Rate (per 1,000 live births) 33 26 27 21 21 13
Child Mortality 84 57 54 50 31 19
Crude Birth Rate (per 1,000) 47 44 39 33 29 30.6
Crude Death Rate (per 1,000) 17 12.5 10 10 9.4 8.5
Life Expectancy at birth (in years) 54 55.7 57 58 60 62
Total Fertility Rate 6.4 5.5 4.6 4.4 4.0 4.2
Source: GGDHS, 1988, 1993, 1998, 2003, 2008, 2014
: WHO – Atlas Health Statistics 2014, World Data Atlas
2.2 Total Fertility Rate by Region
Region 1988 1993 1998 2003 2008 2014
Western 6.1 5.5 4.7 4.5 4.2 3.6
Central 6.6 5.6 4.8 5.0 5.4 4.7
Greater Accra 4.6 3.6 2.7 2.9 2.5 2.8
Volta 6.7 5.4 4.4 4.4 3.8 4.3
Eastern 5.7 5.1 4.4 4.3 3.6 4.2
Ashanti 5.9 5.6 4.5 4.1 3.6 4.2
Brong Ahafo 6.9 5.5 5.4 4.8 4.1 4.8
Northern 6.8 7.4 7.0 7.0 6.8 6.6
Upper East 6.8 6.4 5.0 4.7 4.1 4.9
Upper West 6.8 6.0 6.1 5.5 5.0 5.2
National 6.4 5.5 4.6 4.4 4.0 4.2
Rural 6.6 6.4 5.4 5.6 4.9 5.2
Urban 5.1 4.0 3.0 3.1 3.1 3.4
Source: GDHS 1988, 1993, 1998, 2003, 2008, 2014

14
2.3 Percentage of Population with no Education
Region 1988 1993 1998 2003 2008 2014
Female Male Female Male Female Male Female Male Female Male Female
Western 43.6 17.8 34.1 11.8 29.6 7.3 22.3 6.1 13.9 5.1 14.2
Central 47.6 18.5 35.6 13.4 32.7 9.3 25.2 6.6 16.2 5.1 15.1
Greater
Accra
21.9 9.8 19.4 9.4 19.6 5.8 12.4 3.5 7.7 2.9 8.3
Volta 38.0 20.8 34.3 19.3 31.4 7.9 20.7 8.4 22.9 4.7 19.1
Eastern 27.6 16.9 27.1 12.1 22.8 7.9 15.9 2.5 10.7 1.8 10.4
Ashanti 30.0 17.4 33.0 13.2 30.0 9.4 16.8 6.6 9.9 4.6 10.8
Brong
Ahafo
42.8 21.7 30.8 20.4 32.6 14.2 27.4 17.1 24.9 10.1 20.5
Northern 81.7 62.0 75.9 63.8 79.7 59.5 78.8 48.4 65.7 47.4 65.8
Upper
East
81.7 50.9 66.5 57.4 69.4 48.9 72.4 34.4 49.0 23.5 40.0
Upper
West
81.7 56.9 67.9 59.0 68.4 44.9 63.3 30.2 48.1 30.7 48.7
National 39.7 26.2 38.3 20.6 34.0 17.6 28.2 13.3 21.2 9.4 19.1
Rural 46.4 32.9 46.8 25.5 39.8 25.4 39.5 19.9 30.8 15.3 28.5
Urban 26.7 12.2 22.3 10.4 22.4 8.0 16.3 5.6 10.9 4.1 11.0
Source: GDHS 1988, 1993, 1998, 2003, 2008, 2014

15
2.4 Infant and Under Five Mortality Rate
Source: GDHS 1988, 1993, 1998, 2003, 2008 2014
Region Infant Mortality Rate Under Five Mortality Rate
1988 1993 1998 2003 2008 2014 1988 1993 1998 2003 2008 2014
Western 76.9 76.3 68.0 66.0 51.0 40.0 151.2 131.8 109.7 109.0 65.0 56.0
Central 138.3 71.6 83.8 50.0 73.0 48.0 208.2 128.0 142.1 90.0 108.0 69.0
Greater
Accra 57.7 58.4 41.4 45.0 36.0 37.0 58.4 41.4 45.0 36.0 50.0 47.0
Volta 73.5 77.8 53.8 75.0 37.0 42.0 132.7 116.4 98.0 113.0 50.0 61.0
Eastern 70.1 55.9 50.2 64.0 53.0 43.0 138.1 93.2 89.1 95.0 81.0 68.0
Ashanti 69.8 65.2 41.9 80.0 54.0 63.0 144.2 97.6 78.2 116.0 80.0 80.0
Brong
Ahafo 65.0 48.7 77.3 58.0 37.0 38.0 122.6 94.6 128.7 91.0 76.0 57.0
Northern 103.1 113.7 70.1 69.0 70.0 53.0 221.8 237.0 171.3 154.0 137.0 111.0
Upper East 103.1 105.0 81.5 33.0 46.0 46.0 221.8 180.1 155.3 79.0 78.0 72.0
Upper
West 103.1 84.5 70.6 105.0 97.0 64.0 221.8 187.7 155.6 208.0 142.0 92.0
National 77 66 57 64 50 41 155 119 108 111 80 60
Rural 86.8 82.2 67.5 70.0 56.0 46.0 162.5 149.2 122.0 118.0 90.0 75
Urban 66.9 54.9 42.6 55.0 49.0 49.0 131.1 89.9 76.8 93.0 75.0 64

16
2.5 Demographic and Socioeconomic Indicators
Indicator Ghana
Value
Africa
Averag
e§
Global
Average
§
1 Population density (per sq. km) (2010 pop census) 103.4 N/A N/A
2 Population age structure (%) (male)(2010 pop
census) 49.0 N/A N/A
3 Population age structure (%) (female)(2010 pop
census) 51.0 N/A N/A
4 Median age of population (2010 pop census) 20 19.0 30.0
5 Proportion of population below 15 years (%) (2010
pop census) 39.3 42.0 26.0
6 Proportion of population above 60 years (%) (2010
pop census) 6.5 5.0 12.0
7 Proportion of population living in urban areas (%)
(2010 pop census) 49.0 38.0 53.0
8 Coverage of birth registration (%) (2014)* 70.5 N/A N/A
9 ^Coverage of death registration (%) (2012) 21.0 N/A N/A
10 Adult mortality rate (15 - 60 years) per 1,000
population – male (2013)§ 261 343 124
11 Adult mortality rate (15 - 60 years) per 1,000
population – female (2013)§ 222 298 187
13 Life expectancy at birth (male) (2013)§ 62 56 70
14 Life expectancy at birth (female) (2010)§ 64 59 68
15 Life expectancy at birth (both sexes) (2010)§ 62 58 73
16 Net primary school attendance ratio - male (%)
(2014)* 69.6 80.0 92
17 Net primary school attendance ratio - female (%)
(2014)* 69.6 76.0 90
18 Total gross domestic product (2014)§ $90.41bil
l N/A N/A
19 Gross domestic product per capita (2014)§ $4,100 N/A N/A
20 Annual economic growth rate (%) (2014)§ 4.2 N/A N/A
22 Population living on less than 1 US$ dollar per day
(2014)§ 28.6 47.0 14.6
NA: Not available
Source:
§World Health Statistics 2015 – WHO;
**Population and Housing Census 2010 GSS (2013)
* GDHS 2014

17
§The World Fact book: www.cia.gov/library/publications/the-world-factbook/geos/GH

18
2.6 Health-Related Millennium Development Goals
Indicator Ghana
Value
Africa
Averag
e§
Global
Averag
e§
1 Adolescent fertility rate (per 1,000 girls aged
15-19 years) (2014)* 76.3
2 Unmet need for family planning (%) (2014)* 29.9 25 12
3 Prevalence of HIV among adults aged 15 -
24years (2014) 0.8 N/A N/A
4
Proportion of males aged 15-24 years with
comprehensive correct knowledge of
HIV/AIDS (%)(2014)*
27.2 N/A N/A
5
Proportion of females aged 15-24 years with
comprehensive correct knowledge of
HIV/AIDS (%) (2014)*
19.9 N/A N/A
6 Antiretroviral therapy coverage among people
with advanced HIV infection (%) (2012) 58 63 61
7 Malaria mortality rate per 100,000 population
(2012)§ 69 63 11
8
Children aged less than 5 years sleeping
under insecticide-treated bed-nets (%)
(2014)*
47.0 25 N/A
9
Children aged less than 5 years who received
any antimalarial treatment for fever (%)
(2014)*
48.5 N/A N/A
10 Access to improved drinking-water sources
(%) (2014)* 89.8 66.0 90.0
11 Access to improved sanitation (%) (2014)* 14.0 33.0 64.0
12 Infants exclusively breastfed for the first
6 months of life (2014)* 36.2
13
Alcohol consumption among adults aged 15
years and above (liters per person per year)
(2010)§
4.8 6.0 6.2
14 Prevalence of tobacco use – male (%) (2014)* 5.1 24.2 36.1
15 Prevalence of tobacco use – female (%)
(2014)* 0.4 2.4§ 6.8
NA: Data Not Available
Source: *GDHS 2014, §World Health Statistics 2015 - WHO

19
2.7 Health Expenditure Indicators
Indicator Ghana
Value
Africa
Average
Global
Average
1 Total expenditure on health as % of gross domestic
product (2012) 5.2 5.6 8.6
2 General government expenditure on health as % of
total expenditure on health (2011) 68.3 50.8 38.8
3 Private expenditure on health as % of total
expenditure on health (2011) 31.7 49.2 42.3
4 General government expenditure on health as % of
total government expenditure (2011) 10.6 11.4 14.1
5 Out-of-pocket expenditure on health as % of private
expenditure on health (2011) 91.9 60.6 52.6
6 Per capita total expenditure on health at average
exchange rate (US$) (2011) 86.0 105 1,025
7 Per capita government expenditure on health at
average exchange rate (US$) (2011) 59 53 615
Source: World Health Statistics 2015 - WHO

20
3.0 Health Infrastructure
3.1 Health Facilities by Type, 2016
Region CHPS Clinic
District
Hospital
Health
Centre Hospital
Midwife /
Maternity Mines Polyclinic
Psychiatric
Hospital
Ashanti 1041 130 25 135 96 73 0 1 0
Brong Ahafo 458 102 18 90 12 41 0 4 0
Central 235 67 12 61 16 35 0 2 1
Eastern 611 116 17 99 14 25 0 2 0
Greater Accra 201 283 6 28 76 85 0 13 2
Northern 386 56 15 96 13 9 0 4 0
Upper East 225 50 6 53 1 2 0 0 0
Upper West 208 14 3 68 8 5 0 5 0
Volta 350 40 17 161 11 16 0 3 0
Western 470 145 18 64 20 37 3 0 0
National 4185 1003 137 855 267 328 3 34 3

21
3.2 Number of Hospital Beds by Region and Ownership – 2016
Organisation unit
CHAG Government
Other
Faith-
Based
Private Quasi-
Government Total
%By
Region
Ashanti 64 764 0 244 3 1075 15.2
Brong Ahafo 28 687 0 108 0 823 11.6
Central 37 353 0 73 3 466 6.6
Eastern 20 873 0 80 2 975 13.8
Greater Accra 5 375 1 423 24 828 11.7
Northern 21 585 0 34 4 644 9.1
Upper East 18 321 0 29 1 369 5.2
Upper West 20 323 0 11 1 355 5.0
Volta 20 594 0 48 1 663 9.4
Western 24 706 0 149 12 891 12.6
Ghana 257 5581 1 1199 51 7089 100.0
%BY Ownership 3.6 78.7 0.0 16.9 0.7 100.0
Source: CHIM/PPME-GHS
NB: Data for Quasi Government, Islamic and Private Hospitals are incomplete

22
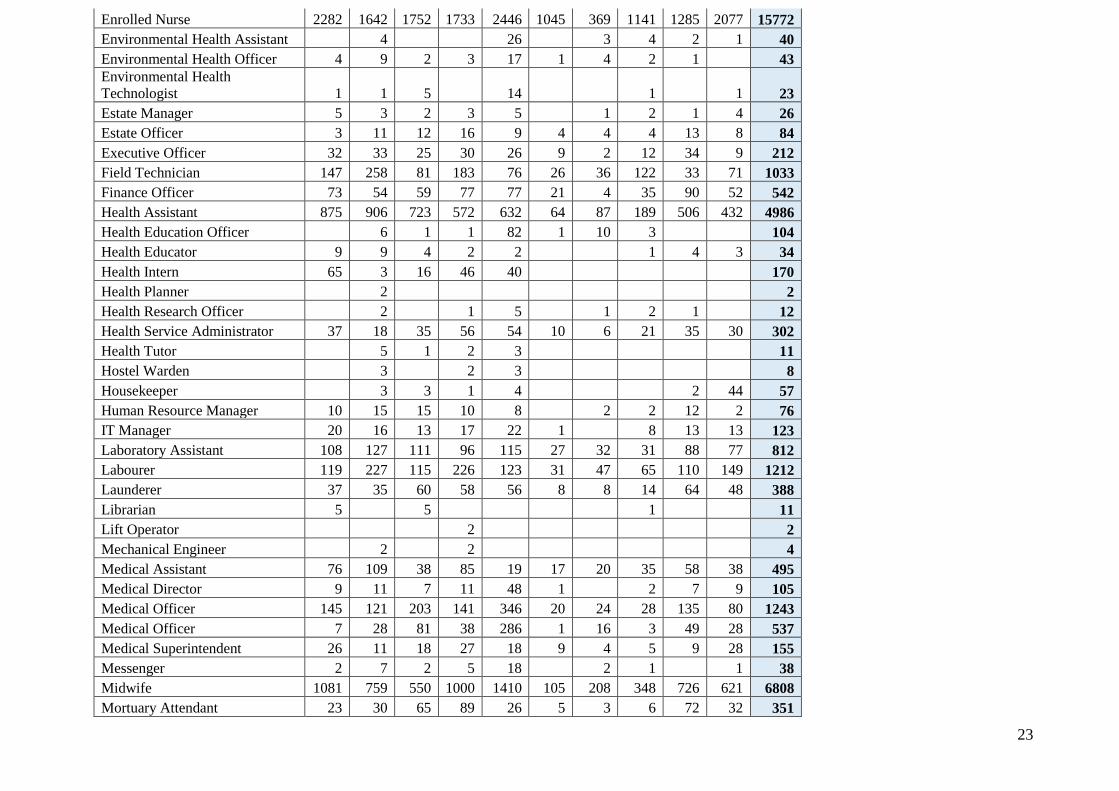
3.3 Distribution of Health Professionals by Region – 2015
CATEGORIES 2015 ASH BAR CR ER GAR NR UER UER VR WR Total
Accountant 168 104 62 95 192 17 16 29 76 68 827
Accounts Officer 142 164 118 236 278 26 20 47 134 85 1250
Administrative Manager 41 41 38 33 48 5 4 2 25 22 259
Architect 1 1 14 5 2 5 28
Artisan 59 60 94 84 63 6 20 18 165 59 628
Audiologist 4 4
Audit Officer 12 3 7 8 10 3 1 1 2 3 50
Auditor 17 18 15 23 30 5 4 5 20 22 159
Biomedical Scientist 99 59 88 104 146 12 8 33 94 73 716
Biostatistics Assistant 143 134 145 171 258 21 33 48 161 173 1287
Biostatistics Officer 31 25 20 15 6 9 1 3 21 22 153
Blood Bleeder 1 2 6 1 1 2 6 4 23
Blood Donor Organiser 1 4 7 2 2 3 4 23
Caretaker 1 2 4 2 9 8 26
Catering Officer 2 27 17 29 2 1 4 14 13 109
Chief Executive Officer 7 4 5 5 14 1 5 41
Clinical Engineering Manager 2 1 3 6 2 15 3 32
Clinical Psychologist 19 1 5 3 7 1 1 5 3 45
Community Health Nurse 2312 2170 1685 3078 2565 357 696 1005 2383 1546 17797
Consultant (Doctors) 38 22 18 7 45 7 4 2 11 10 164
Cook 8 4 104 92 107 8 8 31 66 57 485
Dental Clinic Assistant 11 3 4 12 39 2 2 15 13 101
Dental Technician 12 7 15 12 14 1 3 8 10 82
Dental Technologist 4 2 4 2 5 2 2 21
Dental Therapist 16 2 4 1 23
Deputy Director 3 9 4 10 21 4 4 12 67
Diet Cook 12 1 26 1 40
Dietician 5 1 6 5 7 1 4 1 30
Director 4 7 5 4 8 1 4 1 4 38
Dispensing Assistant 131 150 116 288 161 42 38 44 291 145 1406
District Director 6 35 4 12 4 1 1 2 4 69
Driver 89 124 93 165 126 22 18 49 91 68 845
Emergency Medical Technician 3 22 2 31 58
23
Enrolled Nurse 2282 1642 1752 1733 2446 1045 369 1141 1285 2077 15772
Environmental Health Assistant 4 26 3 4 2 1 40
Environmental Health Officer 4 9 2 3 17 1 4 2 1 43
Environmental Health
Technologist 1 1 5 14 1 1 23
Estate Manager 5 3 2 3 5 1 2 1 4 26
Estate Officer 3 11 12 16 9 4 4 4 13 8 84
Executive Officer 32 33 25 30 26 9 2 12 34 9 212
Field Technician 147 258 81 183 76 26 36 122 33 71 1033
Finance Officer 73 54 59 77 77 21 4 35 90 52 542
Health Assistant 875 906 723 572 632 64 87 189 506 432 4986
Health Education Officer 6 1 1 82 1 10 3 104
Health Educator 9 9 4 2 2 1 4 3 34
Health Intern 65 3 16 46 40 170
Health Planner 2 2
Health Research Officer 2 1 5 1 2 1 12
Health Service Administrator 37 18 35 56 54 10 6 21 35 30 302
Health Tutor 5 1 2 3 11
Hostel Warden 3 2 3 8
Housekeeper 3 3 1 4 2 44 57
Human Resource Manager 10 15 15 10 8 2 2 12 2 76
IT Manager 20 16 13 17 22 1 8 13 13 123
Laboratory Assistant 108 127 111 96 115 27 32 31 88 77 812
Labourer 119 227 115 226 123 31 47 65 110 149 1212
Launderer 37 35 60 58 56 8 8 14 64 48 388
Librarian 5 5 1 11
Lift Operator 2 2
Mechanical Engineer 2 2 4
Medical Assistant 76 109 38 85 19 17 20 35 58 38 495
Medical Director 9 11 7 11 48 1 2 7 9 105
Medical Officer 145 121 203 141 346 20 24 28 135 80 1243
Medical Officer 7 28 81 38 286 1 16 3 49 28 537
Medical Superintendent 26 11 18 27 18 9 4 5 9 28 155
Messenger 2 7 2 5 18 2 1 1 38
Midwife 1081 759 550 1000 1410 105 208 348 726 621 6808
Mortuary Attendant 23 30 65 89 26 5 3 6 72 32 351

24
Nutrition Officer 16 35 9 8 11 1 8 4 4 6 102
Occupational Therapist 1 1
Occupational Therapist Assistant 9 9
Optician 11 4 11 8 4 2 1 3 44
Optometrist 23 14 20 30 22 2 3 14 5 133
Orderly 575 384 467 1256 777 100 84 152 992 379 5166
Others 204 576 251 379 308 70 58 105 289 255 2495
Personnel Officer 1 4 9 5 1 9 29
Pharmacist 93 48 59 88 140 10 14 14 55 49 570
Pharmacy Technician 238 122 83 115 126 13 24 16 51 110 898
Physician Assistant 195 118 124 224 256 36 39 46 116 170 1324
Physiotherapist 8 5 12 17 21 4 3 13 13 96
Physiotherapist Assistant 23 16 27 28 23 7 8 12 11 155
Porter 12 2 8 28 1 51
Private Secretary 4 7 5 10 14 1 3 16 11 71
Procurement Manager 7 7 15 17 46 2 4 4 13 7 122
Professional Nurse 1672 859 1315 1785 2829 273 439 495 1438 538 11643
Prosector 3 1 1 3 2 2 12
Quantity Surveyor 2 2
Radiographer 8 7 20 14 20 1 1 5 13 8 97
Receptionist/Telephonist 16 6 22 19 35 2 1 3 25 12 141
Records Officer 67 102 121 146 136 38 35 51 63 140 899
Revenue Collector 47 11 41 97 74 15 4 11 23 42 365
Seamstress 13 8 8 9 8 5 10 4 65
Security Guard 129 77 187 204 181 14 15 24 109 74 1014
Specialist (Doctors) 69 25 89 42 185 6 10 5 54 34 519
Statistician 2 3 3 2 4 2 2 1 4 23
Stenographer 53 25 26 29 66 5 7 8 15 21 255
Sterilisation Machine Operator 11 11 15 6 19 1 8 17 4 92
Storekeeper 32 36 25 31 47 5 6 11 30 35 258
Supply Officer 39 24 25 82 53 3 1 9 27 29 292
Technical Assistant 14 12 15 17 13 1 2 4 10 14 102
Technical Officer CDC 0
Technical Officer 53 62 48 60 47 5 2 8 78 32 395
Technical Officer 0
Technical Officer 30 122 17 42 20 6 6 21 3 16 283

25
Technical Officer 39 72 42 86 39 8 17 16 49 25 393
Technical Officer 60 77 48 113 113 12 13 24 86 58 604
Technical Officer 24 48 6 16 24 1 1 9 5 3 137
Technical Officer 12 1 13
Technical Officer 9 11 10 20 23 1 7 8 18 107
Technician 1 1 5 11 1 3 1 23
Technician 3 2 6 8 1 1 14 6 41
Technologist 1 1 3 8 1 1 1 16
Technologist 2 1 4 3 2 2 14
Transport Manager 2 1 3
Transport Officer 1 9 2 2 2 3 3 22
Typist 41 58 19 42 14 2 10 8 44 16 254
Watchman 140 343 96 246 121 60 60 185 196 133 1580
Source: DHIMS2-HRD-GHS
NB: Data includes Korle Bu Teaching Hospital, Komfo Anokye Teaching Hospital and CHAG facilities

26
3.4 Doctor to Population Ratio
REGION
2016 2015 2014 2013
Number of
Doctors
Doctor
Population
Ratio
Number of Doctors Doctor
Population Ratio
Number of
Doctors
Doctor
Population
Ratio
Number
of
Doctors
Doctor
Population
Ratio
Ashanti 708 7,848 673 7,139 541 9,830 558 9,280
Brong Ahafo 231 11,495 226 15,621 145 17,455 148 16,695
Central 266 9,732 246 18,588 114 21,823 111 21,700
Eastern 218 13,798 214 16,052 171 16,733 159 17,582
Greater Accra 1316 3,582 1258 3,136 1651 2,744 1356 3,240
Northern 216 13,419 208 18,380 117 23,759 131 20,685
Upper East 45 25,878 45 24,722 34 32,285 40 27,391
Upper West 42 18,986 41 31,148 21 36,048 19 38,692
Volta 192 12,749 187 18,389 114 20,510 111 20,625
Western 131 20,659 137 27,530 108 23,814 97 26,048
National 3365 8481 3263 8,808 3016 9,043 2,730 9,749
REGION
2012 2011 2010 2009 2008
Number
of
Doctors
Doctor
Population
Ratio
Number of
Doctors
Doctor
Population
Ratio
Number of
Doctors
Doctor
Population
Ratio
Number of
Doctors
Doctor
Population
Ratio
Number
of
Doctors
Doctor
Population
Ratio
Ashanti 630 7,793 630 7,793 684 7,184 589 8,288 495 9,861
Brong Ahafo 154 15,352 154 15,352 99 22,967 134 16,919 103 22,012
Central 107 21,216 107 21,216 113 18,218 84 22,877 72 26,689
Eastern 166 16,195 166 16,195 163 15,801 148 16,132 134 17,817
Greater Accra 1085 3,810 1085 3,810 935 4,099 839 5,103 827 5,177
Northern 117 21,801 117 21,801 134 18,257 46 50,751 33 70,744
Upper East 27 39,226 27 39,226 33 31,214 29 35,010 30 33,843
Upper West 18 39,747 18 39,747 25 27,050 14 47,932 15 44,736
Volta 91 23,859 91 23,859 64 32,605 73 26,538 68 28,490
Western 91 26,632 91 26,632 75 31,190 77 33,187 78 32,761
National 2,477 10,209 2,477 10,209 2,325 10,423 2,033 11,929 1855 13,074
Source: HRD, GHS

27
Regions Community
Health Nurses
Enrolled
Nurses Midwife
Medical
Officers Pharmacist
Registered
General Nurses Total
Ashanti 2,292 3,278 1,631 847 154 2,400 10,602
Brong Ahafo 1,359 1,589 774 229 44 1,119 5,114
Central 1,562 1,691 615 272 36 1,330 5,506
Eastern 1,939 1,371 762 218 55 1,095 5,440
Greater Accra 1,882 2,288 1,135 1,259 184 3,243 9,991
Northern 898 2,735 626 211 32 1,333 5,835
Upper East 1,029 1,041 398 41 13 811 3,333
Upper West 659 1,031 369 40 14 403 2,516
Volta 1,613 1,220 714 206 43 866 4,662
Western 1,558 1,863 638 110 44 639 4,852
Total 14,791 18,107 7,662 3,433 619 13,239 57,851
Regions Population Total nurses Population to nurse
ratio
Population to
Doctor Ratio
Pharmacist to
population ratio Midwife WIFA
Ashanti 5490543.7 7,970 689 6,482 35,653 808
Brong Ahafo 2723048 4,067 670 11,891 61,887 844
Central 2507668 4,583 547 9,219 69,657 979
Eastern 3099637 4,405 704 14,219 56,357 976
Greater Accra 4721891 7,413 637 3,751 25,662 998
Northern 2927959 4,966 590 13,877 91,499 1,123
Upper East 1216681 2,881 422 29,675 93,591 734
Upper West 811122 2,093 388 20,278 57,937 528
Volta 2491439 3,699 674 12,094 57,940 837
Western 2954789 4,060 728 26,862 67,154 1,112
Total 28,944,778 46,137 627 8,431 46,761 907
Source: HRD-GHS, Half Year 2017
Medical Officers include Specialist, Consultants, Medical Supt., Medical Directors, Medical Officers and House Officers

28
3.5 Nurse to Population Ratio
REGION
2016 2015 2014 2013 2012
Number
of
Nurses
Nurse
Populatio
n Ratio
Number
of
Nurses
Nurse
Population
Ratio
Number
of
Nurses
Nurse
Population
Ratio
Number
of
Nurses
Nurse
Population
Ratio
Number
of
Nurses
Nurse
Population
Ratio
Ashanti 9,182 605 8,572 633 7170 1,088 2,308 2,244 2,096 1,550
Brong Ahafo 4,629 574 4,006 647 2993 1,132 815 1,072 720 1,470
Central 5,214 496 4,570 553 3735 996 960 1,046 858 1,250
Eastern 4,901 614 4,618 636 4142 900 1,117 1,214 1,019 1,237
Greater Accra 8,785 537 8,540 539 7722 764 3,508 1,904 3,336 917
Northern 5,557 522 5,214 543 4438 1,255 1,067 1,170 900 1,601
Upper East 3,291 354 3,017 377 2256 669 604 470 505 930
Upper West 2,273 351 2,103 370 1397 813 311 322 288 941
Volta 4,211 581 3,869 618 3237 925 785 988 712 1,244
Western 4,562 593 4,430 597 3772 1,077 770 1,092 691 1,422
National 52,605 542 48,939 569 40859 959 2,308 2,172 11,125 1,251
REGION
2011 2010 2009 2008
Number of
Nurses
Nurse
Population
Ratio
Number of
Nurses
Nurse
Population
Ratio
Number of
Nurses
Nurse
Population
Ratio
Number of
Nurses
Nurse
Population
Ratio
Ashanti 1,789 1,568 4,252 1,156 4,161 1,173 3,533 1,382
Brong Ahafo 672 1,495 1,826 1,245 2,283 993 1,940 1,169
Central 713 1,309 1,715 1,200 2,369 881 2,104 913
Eastern 921 1,173 2,703 953 2,871 832 2,454 973
Greater Accra 2,941 1,255 4,793 800 4,897 874 4,656 919
Northern 785 1,547 1,716 1,426 1,708 1,367 1,480 1,577
Upper East 424 914 1,112 926 1,262 805 1,051 966
Upper West 259 950 803 842 895 750 758 885
Volta 659 1,242 1,914 1,090 2,421 800 2,132 909
Western 614 895 1,673 1,398 2,107 1,213 1,753 1,458
National 9,777 1,240 22,507 1,077 24,974 971 21,861 1,109
Source: CHIM/HRD, GHS
29
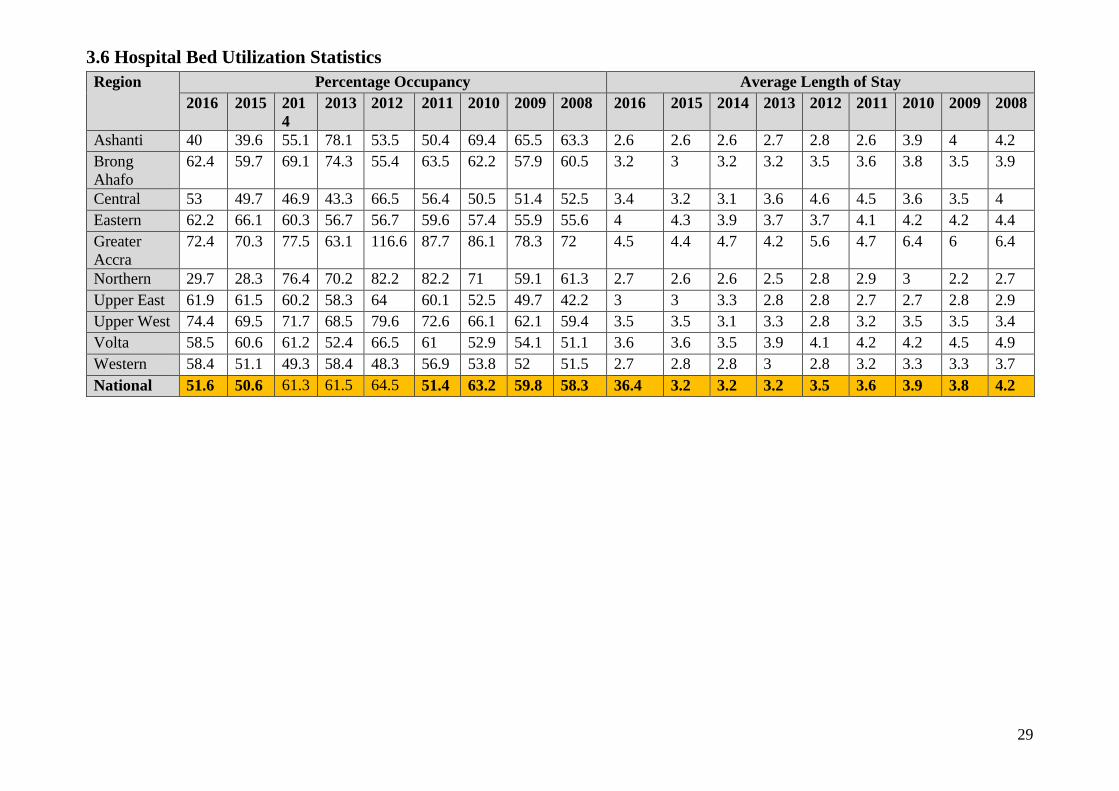
3.6 Hospital Bed Utilization Statistics
Region Percentage Occupancy Average Length of Stay
2016 2015 201
4
2013 2012 2011 2010 2009 2008 2016 2015 2014 2013 2012 2011 2010 2009 2008
Ashanti 40 39.6 55.1 78.1 53.5 50.4 69.4 65.5 63.3 2.6 2.6 2.6 2.7 2.8 2.6 3.9 4 4.2
Brong
Ahafo
62.4 59.7 69.1 74.3 55.4 63.5 62.2 57.9 60.5 3.2 3 3.2 3.2 3.5 3.6 3.8 3.5 3.9
Central 53 49.7 46.9 43.3 66.5 56.4 50.5 51.4 52.5 3.4 3.2 3.1 3.6 4.6 4.5 3.6 3.5 4
Eastern 62.2 66.1 60.3 56.7 56.7 59.6 57.4 55.9 55.6 4 4.3 3.9 3.7 3.7 4.1 4.2 4.2 4.4
Greater
Accra
72.4 70.3 77.5 63.1 116.6 87.7 86.1 78.3 72 4.5 4.4 4.7 4.2 5.6 4.7 6.4 6 6.4
Northern 29.7 28.3 76.4 70.2 82.2 82.2 71 59.1 61.3 2.7 2.6 2.6 2.5 2.8 2.9 3 2.2 2.7
Upper East 61.9 61.5 60.2 58.3 64 60.1 52.5 49.7 42.2 3 3 3.3 2.8 2.8 2.7 2.7 2.8 2.9
Upper West 74.4 69.5 71.7 68.5 79.6 72.6 66.1 62.1 59.4 3.5 3.5 3.1 3.3 2.8 3.2 3.5 3.5 3.4
Volta 58.5 60.6 61.2 52.4 66.5 61 52.9 54.1 51.1 3.6 3.6 3.5 3.9 4.1 4.2 4.2 4.5 4.9
Western 58.4 51.1 49.3 58.4 48.3 56.9 53.8 52 51.5 2.7 2.8 2.8 3 2.8 3.2 3.3 3.3 3.7
National 51.6 50.6 61.3 61.5 64.5 51.4 63.2 59.8 58.3 36.4 3.2 3.2 3.2 3.5 3.6 3.9 3.8 4.2

30
Region Turnover Per Bed Turnover Interval
2016 2015 2014 2013 2012 2011 2010 2009 2008 2016 2015 2014 2013 2012 2011 2010 2009 2008
Ashanti 2.7 2.7 99.1 104.1 70.6 71.3 64.6 59.7 54.7 4.03 4.3 2.7 0.8 2.4 2.5 1.7 2.1 2.5
Brong
Ahafo
3.1 3.1 98.1 85.6 57.4 65 60.5 59.8 56.6 1.61 2.0 3 1.1 2.8 2 2.3 2.6 2.6
Central 3 3 98.6 44.4 53 48.1 51 54.2 47.9 2.82 3.4 3.1 4.7 2.3 2.9 3.5 3.3 3.6
Eastern 4.1 4.1 98.5 56.3 56.3 52.9 49.7 49 46.1 2.52 1.9 4.9 2.8 2.8 2.8 3.1 3.3 3.5
Greater
Accra
4.6 4.6 96.9 54.7 76.4 68 49.5 47.3 41.4 1.32 1.6 5.3 2.5 -0.8 0.7 1 1.7 2.5
Northern 2.9 2.9 98.7 101.9 106 100 87.8 98.2 81.6 7.25 7.2 2.8 1.1 0.6 0.6 1.2 1.5 1.7
Upper East 3.2 3.2 97.4 76.5 82.3 80 72 65 52.8 2.18 1.8 3.5 2 1.6 1.8 2.4 2.8 4
Upper
West
3.7 3.7 98.5 75.9 102.4 83.1 68.9 64 63.2 1.14 1.4 3.7 1.5 0.7 1.2 1.8 2.2 2.4
Volta 3.6 3.6 99.1 49.1 60 52.9 46.3 44.1 38.4 2.14 2.1 3.4 3.5 2 2.6 3.7 3.8 4.7
Western 2.8 2.8 98.7 71.8 62.7 65.4 60.3 57 50.6 2.84 2.8 2.5 2.1 3 2.4 2.8 3.1 3.5
National 3.3 3.3 99.7 70.1 68 68.7 58.8 57.1 51.1 3.02 3.2 3.3 2 1.9 2 2.3 2.6 3
Source: CHIM/PPME-GHS

31
4.0 Health Service Outputs
4.1 Number of Outpatient Attendance by Region
Region 2016 2015 2014 2013 2012 2011 2010 2009
Ashanti 4866381 4,806,143 274,623 256,377 234,092 206,415 225,629 207,089
Brong Ahafo 4130672 4,201,032 196,098 172,945 165,801 135,478 123,187 111,521
Central 2719863 2,748,734 111,696 105,719 103,453 83,030 79,562 77,620
Eastern 3591370 3,779,918 167,945 170,622 172,819 149,163 139,159 127,050
Greater Accra 3639885 3,529,438 119,394 122,761 119,432 99,734 132,975 112,314
Northern 1974721 2,029,126 195,484 190,010 186,069 155,020 118,499 116,818
Upper East 2086391 1,960,205 71,581 81,779 87,349 71,825 66,538 56,324
Upper West 942999 855,888 72,858 62,225 62,690 58,106 51,605 44,287
Volta 2373364 2,430,368 164,888 143,582 125,588 112,866 101,653 93,829
Western 3415962 3,608,321 159812 153,435 149,276 132,651 121,263 115,246
National 29,741,608 29,949,173 1534379 1,459,455 1,406,569 1,204,288 1,160,070 1,062,098
Region 2008 2007 2006 2005 2004 2003 2002
Ashanti 3,427,329 3,272,767 1,912,396 1,502,660 1,350,769 1,248,955 2,226,059
Brong Ahafo 2,869,659 2,193,079 900,881 875,734 860,430 824,193 1,190,139
Central 1,281,602 1,293,818 1,477,204 1,278,852 1,186,311 1,057,649 734,932
Eastern 2,279,528 2,186,024 1,785,471 1,828,929 1,779,887 1,621,972 984,570
Greater Accra 2,105,980 2,352,191 652,054 681,667 638,455 526,678 1,639,943
Northern 1,113,699 685,085 538,202 561,182 565,659 561,455 536,880
Upper East 1,018,813 689,124 290,449 339,923 307,946 289,252 604,645
Upper West 459,309 420,775 745,979 750,000 735,727 664,788 294,325
Volta 1,378,484 958,330 1,324,909 1,114,579 1,128,674 964,450 610,526
Western 2,140,855 1,724,606 2,613,618 2,711,662 2,517,396 2,459,629 931,615
National 18,075,258 15,775,799 12,241,163 11,650,188 11,071,254 10,219,021 9,753,634
Source: CHIM/PPME-GHS
DHIMS2, GHS

32
4.2 Outpatient Attendance per Capita
Region 2016 2015 2014 2013 2012 2011 2010 2009 2008 2007 2006 2005 2004 2003 2002
Ashanti 0.89 0.87 0.92 0.9 0.96 1.1 1.04 0.89 0.73 0.72 0.59 0.63 0.61 0.62 0.58
Brong Ahafo 1.5 1.6 1.8 1.7 1.63 1.4 1.25 1.15 1.3 1.02 0.91 0.73 0.67 0.64 0.62
Central 1.1 1.1 1 1 1 0.97 0.81 0.71 0.68 0.7 0.5 0.5 0.5 0.49 0.44
Eastern 1.2 1.3 1.2 1.3 1.38 1.1 1.04 0.95 0.97 0.94 0.65 0.57 0.53 0.48 0.45
Greater Accra 0.78 0.75 0.82 0.8 0.95 0.67 0.97 0.51 0.51 0.6 0.47 0.51 0.52 0.49 0.52
Northern 0.68 0.7 0.79 0.7 0.7 0.74 0.54 0.53 0.49 0.31 0.3 0.33 0.31 0.27 0.28
Upper East 1.7 1.8 1.8 2.1 1.99 1.7 1.47 1.37 1.01 0.69 0.55 0.58 0.59 0.59 0.64
Upper West 1.2 1.1 1.3 1.2 1.12 1.4 0.91 0.72 0.7 0.65 0.46 0.54 0.5 0.48 0.49
Volta 0.97 1 1.2 1.1 1.01 0.74 0.76 0.69 0.73 0.51 0.41 0.42 0.42 0.38 0. 36
Western 1.2 1.4 1.4 1.4 1.44 1.1 1.16 0.69 0.86 0.72 0.57 0.49 0.52 0.46 0.45
National 1 1.1 1.1 1.16 1.14 1 0.98 0.81 0.77 0.69 0.55 0.54 0.52 0.5 0.49
Source: CHIM/PPME-GHS
DHIMS2, GHS
(This is the average number of outpatient visits per person per year)

33
4.3 Number of Inpatient Admissions by Region 2015
Region 2016 2015 2014 2013 2012 2011 2010 2009
Ashanti 286661 283,414 274,623 256,377 234,092 206,415 225,629 207,089
Brong Ahafo 181540 184,376 196,098 172,945 165,801 135,478 123,187 111,521
Central 111815 111,908 111,696 105,719 103,453 83,030 79,562 77,620
Eastern 182695 170,784 167,945 170,622 172,819 149,163 139,159 127,050
Greater Accra 118899 111,219 119,394 122,761 119,432 99,734 132,975 112,314
Northern 186159 183,775 195,484 190,010 186,069 155,020 118,499 116,818
Upper East 82954 80,203 71,581 81,779 87,349 71,825 66,538 56,324
Upper West 68122 59,852 72,858 62,225 62,690 58,106 51,605 44,287
Volta 150371 153,041 164,888 143,582 125,588 112,866 101,653 93,829
Western 163629 163,201 159812 153,435 149,276 132,651 121,263 115,246
National 1532845 1,501,773 1534379 1,459,455 1,406,569 1,204,288 1,160,070 1,062,098
Region 2008 2007 2006 2005 2004 2003 2002
Ashanti 145,316 163,357 147,223 158,436 153,891 150,209 133,495
Brong Ahafo 104,976 83,034 81,607 77,798 67,931 67,009 62,531
Central 60,658 96,404 67,628 63,932 59,611 55,820 54,871
Eastern 121,985 99,555 91,578 100,222 82,859 99,469 90,329
Greater Accra 79,974 136,823 92,890 98,561 81,874 76,606 88,299
Northern 66,146 69,185 60,547 67,063 72,368 74,733 69,801
Upper East 48,507 57,428 41,166 42,971 41,695 39,164 38,910
Upper West 42,061 36,721 29,716 36,047 32,157 30,656 31,846
Volta 83,093 70,162 69,919 70,000 68,144 66,241 63,844
Western 94,037 88,332 85,446 85,407 84,908 78,984 71,949
National 846,753 901,001 767,720 800,437 745,438 738,891 705,875
Source: CHIM/PPME-GHS
DHIMS2, GHS

34
4.4 Hospital Admission Rate
Region 2016 2015 2014 2013 2012 2011 2010 2009
Ashanti 52.9 51.9 51.9 49.51 46.43 40.9 45.92 33.16
Brong Ahafo 68 71.2 77.2 69.9 68.56 56 54.18 49.29
Central 45.2 43.6 43.2 43.81 44.2 35.5 38.65 38.81
Eastern 60.2 58.4 56.8 60.88 62.96 54.3 54.03 36.36
Greater Accra 25.7 23.8 26.4 27.93 28.02 23.4 34.69 17.97
Northern 64.9 64.2 70.3 70.34 70.87 59 48.44 49.24
Upper East 69.5 72.2 65.2 75.39 81.5 67 64.6 56.22
Upper West 85.7 77.6 97 83.76 85.99 79.7 76.31 67.03
Volta 61.6 63.9 70.5 62.94 56.43 50.7 48.71 51.28
Western 56.5 62.7 59.2 60.85 60.39 53.7 51.84 45.71
National 53.9 53.7 55.6 54.88 54.24 46.4 47.87 38.96
Source: CHIM/PPME-GHS
DHIMS2, GHS
(This is the average number of hospital admissions per 1,000 population)
Region 2008 2007 2006 2005 2004 2003 2002
Ashanti 30.78 35.78 33.3 37.1 37.3 37.6 34.6
Brong Ahafo 47.46 38.48 38.8 37.9 33.9 34.3 32.8
Central 32.23 52.30 37.5 36.2 34.4 32.9 33.0
Eastern 51.81 42.87 40.0 44.4 37.2 45.3 41.7
Greater Accra 19.50 34.83 25.0 27.3 23.7 23.2 27.9
Northern 29.13 31.32 28.2 32.1 35.6 37.8 36.3
Upper East 48.30 57.81 41.9 44.2 43.4 41.2 41.4
Upper West 63.75 56.60 46.6 57.5 52.1 50.6 53.4
Volta 43.71 37.61 38.2 39.0 38.7 38.3 37.6
Western 37.98 36.82 37.0 37.9 38.9 37.3 35.1
National 35.91 39.29 34.4 36.9 35.3 36.0 35.3

35
4.5 Case Fatality Rate for Malaria
Region
2016 2015 2014 2013 2012 2011
Under 5 All
Ages Under 5 All Ages Under 5 All Ages Under 5 All Ages
Under
5
All
Ages
Under
5
All
Ages
Ashanti 0.13 0.17 0.18 0.27 0.18 0.2 0.42 0.37 0.35 0.39 0.39 0.37
Brong
Ahafo 0.26 0.28 0.45 0.48 0.35 0.3 0.46 0.5 0.77 0.97 1.13 1.25
Central 0.36 0.48 0.54 0.73 1.2 1.39 0.86 1.72 0.98 1.89 1.84 3.04
Eastern 0.23 0.20 0.26 0.23 0.32 0.26 0.43 0.45 0.38 0.46 0.5 0.47
Greater
Accra 0.29 0.26 0.49 0.59 0.52 0.61 0.92 0.93 0.66 0.91 0.94 1.13
Northern 0.49 0.47 0.81 0.75 1.1 0.94 1.11 0.93 1.19 1.01 1.74 1.54
Upper East 0.51 0.67 0.72 0.77 0.4 0.62 0.69 0.87 0.7 1 0.95 1.23
Upper West 0.35 0.44 0.57 0.83 0.43 0.71 0.76 1.12 0.7 1.42 1.16 1.56
Volta 0.39 0.45 0.58 0.64 0.5 0.57 0.7 0.88 0.95 1.26 0.15 0.4
Western 0.32 0.26 0.45 0.38 0.42 0.35 0.58 0.55 0.78 0.77 0.83 0.82
National 0.32 0.33 0.51 0.52 0.54 0.53 0.69 0.74 0.78 0.92 1.04 1.11
Region 2010 2009 2008 2007 2006 2005
Under 5 All Ages Under
5
All
Ages
Under
5
All
Ages
Under
5
All
Ages
Under
5
All
Ages
Under
5
All
Ages
Ashanti 0.76 0.59 0.6 0.5 0.7 0.5 3.0 1.5 1.7 1.2 2.2 1.3
Brong Ahafo 1.59 1.38 1.3 1.1 1.4 1.1 1.6 1.5 1.9 4.5 1.8 1.6
Central 1.81 2.81 2.9 3.2 3.0 3.4 3.9 3.9 4.2 4.0 4.5 4.1
Eastern 0.76 0.76 0.8 0.8 1.0 0.8 1.5 1.3 1.5 1.5 1.5 1.2
Greater Accra 3.06 2.33 1.0 1.2 1.2 1.5 1.5 4.0 1.0 2.3 1.2 2.0
Northern 2.41 2.03 3.0 2.6 3.3 2.6 2.8 2.1 5.1 4.1 3.1 2.6
Upper East 1.40 1.61 1.6 1.8 2.0 1.9 2.1 1.9 2.6 2.4 2.5 2.2
Upper West 1.02 1.25 1.6 1.8 0.8 1.1 1.3 1.4 3.0 2.0 3.0 2.5
Volta 1.56 1.78 1.9 2.3 2.1 2.9 3.0 2.7 3.1 3.0 4.8 4.4
Western 1.36 1.21 1.8 1.5 2.1 1.9 3.0 2.7 2.7 2.3 3.4 2.9
National 1.47 1.41 1.7 1.6 1.6 1.4 2.4 2.1 2.7 2.6 2.8 2.3

36
4.5 Top Twenty Causes of Outpatient Morbidity 2002 -2016
2016 2015 2014
No DISEASES No of
cases
% of
total No DISEASES No of cases
% of
total No DISEASES No of cases
% of
total
1 Malaria 6959525 31.1 1 Malaria 6,961,077 26.1 1 Malaria 7,316,615 26.7
2
Upper Respiratory
Tract Infections 3840246 17.2 2
Upper Respiratory Tract
Infections 3,896,550 14.6 2
Upper Respiratory Tract
Infections 3,379,534 12.3
3
Rheumatism & Other
Joint Pains 1612609 7.2 3
Rheumatism & Other Joint
Pains 1,546,744 5.8 3 Diarrhoea Diseases 1,573,569 5.7
4 Diarrhoea Diseases 1570557 7.0 4 Diarrhoea Diseases 1,515,189 5.7 4
Rheumatism & Other Joint
Pains 1,474,615 5.4
5 Skin Diseases 1143556 5.1 5 Skin Diseases 1,187,674 4.4 5 Skin Diseases 1,335,465 4.9
6 Anaemia 1069138 4.8 6 Anaemia 1,007,335 3.8 6 Anaemia 993,135 3.6
7 Intestinal Worms 816106 3.6 7 Intestinal Worms 830,557 3.1 7 Intestinal Worms 855,677 3.1
8
Acute Urinary Tract
Infection 671144 3.0 8 Hypertension 715,247 2.7 8 Hypertension 829,655 3
9 Hypertension 606721 2.7 9 Acute Urinary Tract Infection 606,471 2.3 9
Acute Urinary Tract
Infection 603,607 2.2
10 Acute Eye Infection 538089 2.4 10 Acute Eye Infection 503,153 1.9 10 Acute Eye Infection 535,487 2
11 Typhoid Fever 384704 1.7 11 Typhoid Fever 337,120 1.3 11 Typhoid Fever 334,103 1.2
12 Pneumonia 235052 1.1 12
Uncomplicated Malaria in
Pregnancy suspected 328,119 1.2 12
Pregnancy Related
Complications 242,216 0.9
13
Gynaecological
conditions 205242 0.9 13
Uncomplicated Malaria in
Pregnancy Suspected Tested 309,803 1.2 13 Diabetes Mellitus 213,837 0.8
14
Pregnancy Related
Complications 201397 0.9 14
Pregnancy Related
Complications 233,392 0.9 14 Other Acute Ear infection 205,026 0.7
15 Ulcer 200687 0.9 15 Pneumonia 216,752 0.8 15 Pneumonia 204,984 0.7
16 Otitis Media 172237 0.8 16 Gynaecological conditions 196,045 0.7 16 Vaginal Discharge 193,329 0.7
17 Vaginal Discharge 169048 0.8 17 Vaginal Discharge 186,072 0.7 17
Home Injuries (Home
Accidents and Injuries) 186,988 0.7
18 Septiceamia 159103 0.7 18 Diabetes Mellitus 185,945 0.7 18 Gynaecological conditions 183,210 0.7
19 Diabetes Mellitus 154790 0.7 19 Ulcer 167,560 0.6 19 Septiceamia 111,248 0.4
20
Other Acute Ear
infection 140974 0.6 20 Other Acute Ear infection 156,343 0.6 20
Transport injuries (Road
Traffic Accidents) 105,966 0.4
All others 1514852 6.8 All other diseases 21,087,148 78.9 All other diseases 20,878,266 76.3
Total 22365777 100.0 Total 26,712,616 100 Total 27,377,934 100

37
#
2013 2012 2011
Disease Number of
Cases
% of
Total
Disease Number of
Cases
% of
Total
Disease Number of
Cases
% of
Total
1 Malaria 10,839,392 34.71 Malaria 10,171,448 39.98 Malaria 1,0171,448 40.0
2 Upper Respiratory Tract
Infections 3,549,464 11.37
Other ARI(Acute
Respiratory Infection) 2,718,135 10.68
Other ARI(Acute
Respiratory Infection) 2,718,135 10.7
3 Diarrhoea Diseases
1,530,739 4.90 Skin Diseases & Ulcers
1,168,196 4.59
Skin Diseases &
Ulcers 1,168,196 4.6
4 Skin Diseases 1,511,787 4.84 Diarrhoea Diseases 1,083,005 4.26 Diarrhoea Diseases 1,083,005 4.3
5 Rheumatism & Other
Joint Pains 1,369,466 4.39
Rheumatism and Joint
Paints 948,428 3.73
Rheumatism and
Joint Paints 948,428 3.7
6 Anaemia 955,001 3.06 Hypertension 860,745 3.38 Hypertension 860,745 3.4
7 Hypertension 936,958 3.00 Anaemia 555,159 2.18 Anaemia 555,159 2.2
8 Intestinal Worms 804,472 2.58 Intestinal worms 540,733 2.13 Intestinal worms 540,733 2.1
9 Acute Eye Infection 566,833 1.82 Acute Eye infection 517,397 2.03 Acute Eye infection 517,397 2.0
10 Acute Urinary Tract
Infection 506,402 1.62
Acute Urinary Tract
Infection 363,418 1.43
Acute Urinary Tract
Infection 363,418 1.4
11
Typhoid Fever
339,877 1.09
Pregnancy and Related
Complications 247,570 0.97
Pregnancy and
Related
Complications 247,570 1.0
12 Other Acute Ear
infection 284,236 0.91
Typhoid/Enteric Fever
(Typhoid) 247,303 0.97
Typhoid/Enteric
Fever (Typhoid) 247,303 1.0
13 Pregnancy Related
Complications 259,287 0.83 Acute Ear infection
238,910 0.94 Acute Ear infection
238,910 0.9
14 Pneumonia
236,585 0.76
Home Accidents and
Injuries 213,925 0.84
Home Accidents and
Injuries 213,925 0.8
15 Diabetes Mellitus 220,098 0.70 Diabetes Mellitus 204,812 0.81 Diabetes Mellitus 204,812 0.8
16 Vaginal Discharge
209,327 0.67
Gynaecological
conditions 190,073 0.75
Gynaecological
conditions 190,073 0.7
17 Home Injuries (Home
Accidents and Injuries) 208,617 0.67 Vaginal Discharge
180,892 0.71 Vaginal Discharge
180,892 0.7
18 Gynaecological
conditions 203,061 0.65 Pneumonia
177,404 0.70 Pneumonia
177,404 0.7
19 Referrals
158,841 0.51 Road Traffic Accidents
108,201 0.43
Road Traffic
Accidents 108,201 0.4

38
20 Transport injuries (Road
Traffic Accidents) 126,112 0.40 Dental Caries
98,996 0.39 Dental Caries
98,996 0.4
All other Diseases 6,409,098 20.53 All Other Diseases 4,606,662 18.11 All Other Diseases 4,606,662 18.1
31,225,653 28,728,687 25,441,412
#
2010 2009 2008
Disease Number of
Cases
% of
Total
Disease Number of
Cases
% of
Total
Disease Number of
Cases
% of
Total
1 Malaria 8,208,670 43.9 Malaria 7,096,440 46.2 Malaria 5,041,025 47.4
2 Other ARI(Acute
Respiratory Infection) 1,695,666 9.1
Other ARI(Acute
Respiratory Infection) 1,306,354 8.5
Upper respiratory
tract infection 794,301 7.5
3 Skin Diseases &
Ulcers 814,224 4.3
Skin Diseases &
Ulcers 622,391 4.1
Diarrhoeal Diseases
385,737 3.6
4 Diarrhoea Diseases 737,804 3.9 Diarrhoea Diseases 590,286 3.8 Skin Diseases 422,948 4.0
5 Hypertension 644,134 3.4 Hypertension 497,845 3.2 Hypertension 321,994 3.0
6 Rheumatism and Joint
Paints 603,834 3.2
Rheumatism and Joint
Paints 429,708 2.8
Home/Occupational
Injuries 133,051 1.3
7 Intestinal worms
374,637 2.0
Acute Eye infection
285,328 1.9
Acute Eye
Infections 185,175 1.7
8 Acute Eye infection
325,269 1.7
Intestinal worms
256,699 1.7
Pregnancy and
Related
Complications 158,458 1.5
9 Anaemia
321,792 1.7
Anaemia
211,318 1.4
Rheumatic and Joint
Diseases 254,518 2.4
10 Pregnancy and
Related
Complications 214,008 1.1
Pregnancy and
Related
Complications 201,566 1.3
Anaemia
139,593 1.3
11 Acute Urinary Tract
Infection 209,728 1.1
Home Accidents and
Injuries 167,689 1.1
Intestinal Worms
165,534 1.6
12 Home Accidents and
Injuries 181,254 1.0
Acute Urinary Tract
Infection 157,383 1.0
Gynaecological
Diseases 92,719 0.9
13 Typhoid/Enteric Fever
(Typhoid) 179,497 1.0
Typhoid/Enteric
Fever( Typhoid) 141,607 0.9
Pneumonia
85,386 0.8
39
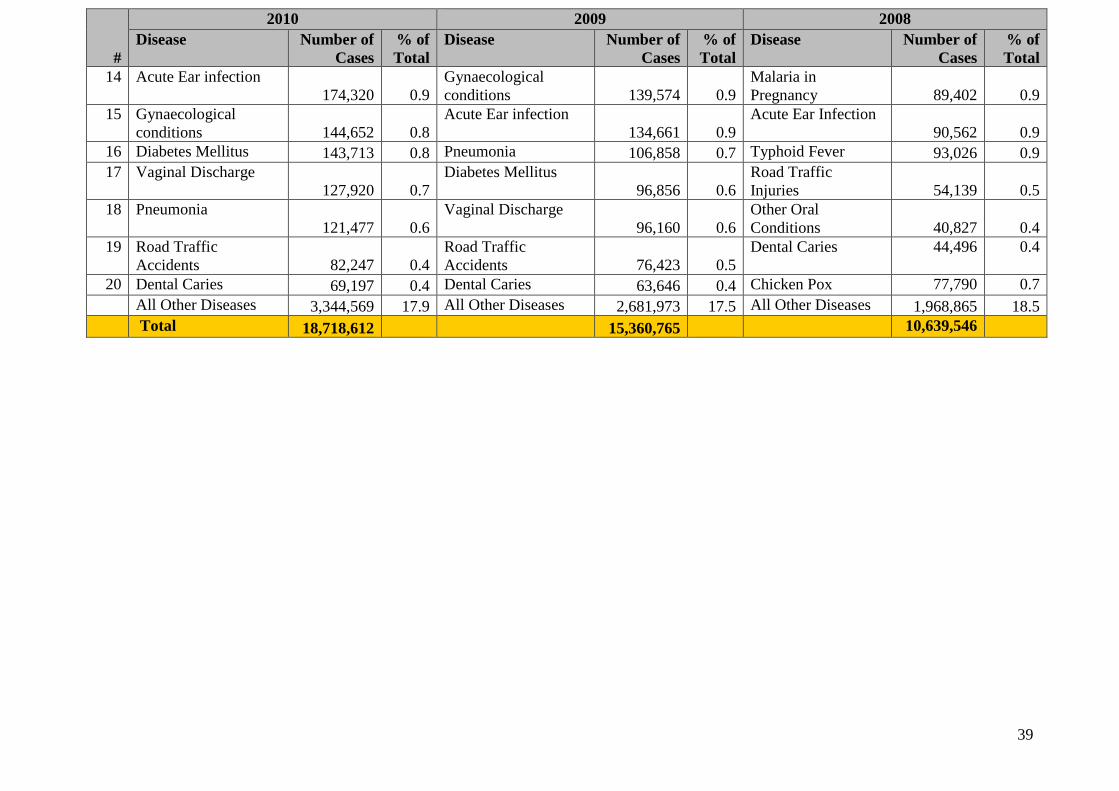
#
2010 2009 2008
Disease Number of
Cases
% of
Total
Disease Number of
Cases
% of
Total
Disease Number of
Cases
% of
Total
14 Acute Ear infection
174,320 0.9
Gynaecological
conditions 139,574 0.9
Malaria in
Pregnancy 89,402 0.9
15 Gynaecological
conditions 144,652 0.8
Acute Ear infection
134,661 0.9
Acute Ear Infection
90,562 0.9
16 Diabetes Mellitus 143,713 0.8 Pneumonia 106,858 0.7 Typhoid Fever 93,026 0.9
17 Vaginal Discharge
127,920 0.7
Diabetes Mellitus
96,856 0.6
Road Traffic
Injuries 54,139 0.5
18 Pneumonia
121,477 0.6
Vaginal Discharge
96,160 0.6
Other Oral
Conditions 40,827 0.4
19 Road Traffic
Accidents 82,247 0.4
Road Traffic
Accidents 76,423 0.5
Dental Caries 44,496 0.4
20 Dental Caries 69,197 0.4 Dental Caries 63,646 0.4 Chicken Pox 77,790 0.7
All Other Diseases 3,344,569 17.9 All Other Diseases 2,681,973 17.5 All Other Diseases 1,968,865 18.5
Total 18,718,612 15,360,765 10,639,546

40
+
# Diseases
2007 2006 2005
Number of
Cases
% of
Total
Number of
Cases
% of
Total
Number of
Cases % of Total
1 Malaria 5,384,685 42.5 3,861,348 37.83 3,799,158 44.76
2 Upper respiratory tract infection 920,806 7.3 632,755 6.20 581,323 6.85
3 Diarrhoeal Diseases 452,250 3.6 345,454 3.38 352,384 4.15
4 Skin Diseases 539,197 4.3 341,044 3.34 352,295 4.15
5 Hypertension 505,180 4.0 283,591 2.78 249,342 2.94
6 Home/Occupational Injuries 194,695 1.5 167,029 1.64 192,033 2.26
7 Acute Eye Infections 288,908 2.3 192,984 1.89 190,293 2.24
8 Pregnancy and Related Complications 188,731 1.5 136,958 1.34 172,253 2.03
9 Rheumatic and Joint Diseases 270,296 2.1 183,144 1.79 162,162 1.91
10 Anaemia 185,293 1.5 143,171 1.40 144,606 1.70
11 Intestinal Worms 208,429 1.6 130,071 1.27 134,440 1.58 12 Gynaecological Diseases 182,349 1.4 100,913 0.99 110,199 1.30
13 Pneumonia 124,403 1.0 91,491 0.90 83,154 0.95
14 Malaria in Pregnancy 114,577 0.9 86,730 0.85 94,135 1.11
15 Acute Ear Infection 165,834 1.3 89,163 0.87 80,154 0.95
16 Typhoid Fever 89,444 0.7 67,780 0.66 76,293 0.90
17 Road Traffic Injuries 82,152 0.6 64,646 0.63 76,486 0.90
18 Other Oral Conditions 94,449 0.7 52,073 0.51 52,394 0.62
19 Dental Caries N/A N/A 53,632 0.53 52,615 0.62
20 Chicken Pox N/A N/A N/A N/A N/A N/A
All Other Diseases 2,599,905 20.5 2,696,156 26.41 1,167,593 13.76
Total Cases 12,667,324 10,208,310

41
Diseases 2004 2003 2002
Number of
Cases
% of
Total
Number of
Cases
% of
Total
Number of
Cases
% of
Total
1 Malaria 3,379,527 44.1 3,359,191 43.9 3,140,980 43.7
2 Upper respiratory tract infection 549,398 7.2 519,652 6.8 532,531 7.4
3 Diarrhoeal Diseases 331,998 4.3 322,404 4.2 287,816 4.0
4 Skin Diseases 314,436 4.1 325,262 4.3 308,848 4.3
5 Hypertension 206,925 2.7 212,354 2.8 195,655 2.7
6 Home/Occupational Injuries 177,971 2.3 187,943 2.5 140,723 2.0
7 Acute Eye Infections 162,182 2.1 187,234 2.4 183,735 2.6
8 Pregnancy and Related Complications 145,079 1.9 151,475 2.0 178,937 2.5
9 Rheumatic and Joint Diseases 142,834 1.9 146,552 1.9 146,907 2.0
10 Anaemia 129,315 1.7 128,009 1.7 141,059 2.0
11 Intestinal Worms 119,885 1.6 151,330 2.0 133,302 1.9
12 Gynaecological Diseases 101,786 1.3 103,251 1.4 101,862 1.4
13 Pneumonia 76,742 1.0 77,477 1.0 77,064 1.1
14 Malaria in Pregnancy 74,279 1.0 58,113 0.8 28,969 0.4
15 Acute Ear Infection 74,002 1.0 71,974 0.9 73,441 1.0
16 Typhoid Fever 65,333 0.9 53,825 0.7 31,791 0.4
17 Road Traffic Injuries 64,300 0.8 61,296 0.8 98,026 1.4
18 Other Oral Conditions 52,381 0.7 49,459 0.6 33,987 0.5
19 Dental Caries 47,867 0.6 50,262 0.7 60,284 0.8
20 Chicken Pox 45,512 0.6 19,614 0.3 35,667 0.5
All Other Diseases 1,398,759 18.3 1,409,845 18.4 1,262,699 17.6
Total Cases 7,660,241 7,646,522 7,194,283
Source: CHIM/PPME-GHS
DHIMS2, GHS
NA: Data Not Available
About 60% of all outpatient cases are made up of Malaria, Upper Respiratory Tract Infection, Diarrhea and Diseases of the Skin.
Hypertension has consistently remained the 5th cause of Outpatient morbidity constituting about 3% of all Outpatient reported cases.

42
5.0 PUBLIC HEALTH SERVICES
5.1 HIV Prevalence among pregnant women attending ANC clinics
Region 2016 2015 2014 2013 2012 2011 2010 2009 2008
Ashanti 2.6 2.7 2.8 3.2 2.6 3.1 3 3.9 3
Brong Ahafo 2.7 1.7 2.6 2.1 2 2 2 2.9 2.6
Central 1.8 1.8 1.4 1.1 1.9 4.7 1.9 3 2
Eastern 2.6 2.7 3.7 3.7 3.6 3.6 3.2 4.2 4.2
Greater Accra 2.4 3.2 3.1 2.7 3.5 3.2 2.6 3.2 3
Northern 0.7 1.2 0.6 0.8 0.9 0.3 0.7 2 1.1
Upper East 1.7 1.5 1.4 1.7 2.1 1.5 2.4 2.2 2
Upper West 2.5 1.3 1.3 0.8 1.2 1 1.7 3.1 1.6
Volta 2.7 1.7 2.2 1.2 2.5 2.2 1.8 2.6 1.7
Western 2.5 2 2.4 2.4 2.4 1.9 2.5 3.1 2.9
National 2.4 1.8 1.6 1.9 2.1 2.1 2 2.9 2.2
Source: NACP, GHS
5.2 HIV Prevalence among pregnant women by Age Groups
Age
Group(Years) 2016 2015 2014 2013 2012 2011 2010 2009 2008
15 – 19 0.6 0.7 0.9 0.8 0.7 1.9 1.1 1.9 1.2
20 – 24 1.3 1.3 2.1 1.4 1.5 1.5 1.7 2.2 2.3
25 – 29 2.1 2 2 2.4 2.8 2.7 2.5 3.7 3
30 – 34 3.3 2.9 2.8 2.5 3 2.9 2.8 3.4 2.8
35 – 39 3.5 3.4 3.2 3.2 3.3 2.8 2.8 3.6 2.9
40 – 44 2.6 2.6 2.1 2.7 3.2 2.7 2.1 4 1.8
45 – 49 5.6 1.9 1.7 3.3 0 2.8 2.7 1.8 2.6
15 – 24 1.1 1.1 1.8 1.2 1.3 1.7 1.5 2.1 1.9
Source: NACP, GHS
5.3 Guinea Worm Cases
Region 2016 2015 2014 2013 2012 2011 2010 2009 2008
Ashanti 0 0 0 0 0 0 0 2 5
Brong Ahafo 0 0 0 0 0 0 0 2 11
Central 0 0 0 0 0 0 0 0 1
Eastern 0 0 0 0 0 0 0 1 2
Greater Accra 0 0 0 0 0 0 0 0 0
Northern 0 0 0 0 0 0 8 237 479
Upper East 0 0 0 0 0 0 0 0 1
Upper West 0 0 0 0 0 0 0 0 1
Volta 0 0 0 0 0 0 0 0 1
Western 0 0 0 0 0 0 0 0 0
National 0 0 0 0 0 0 8 242 501
Source: Guinea Worm Eradication Programme

43
5.4 Tuberculosis Case Notification per 100,000 Population
Region 2016 2015 2014 2013 2012 2011 2010 2009 2008 2007 2006 2005 2004
Ashanti 50 53 55 58 58 63 59 53 54 51 49 53 53.4
Brong Ahafo 52 54 53 50 43 44 37 38 30 36 31 28 32.7
Central 53 54 63 62 67 67 73 80 67 69 61 75 79.6
Eastern 54 56 62 65 65 68 72 80 71 71 72 75 67
Greater Accra 59 63 60 66 74 81 81 82 80 69 78 67 63.7
Northern 24 30 26 24 24 27 22 24 31 25 20 18 24.1
Upper East 53 56 57 65 57 68 63 48 48 51 32 34 38.5
Upper West 48 44 41 44 43 40 38 37 35 29 28 35 34.8
Volta 60 60 69 77 71 71 66 80 68 58 61 64 69.6
Western 56 59 64 70 66 74 76 74 74 73 75 76 66.6
National 54 56 58 60 61 63 63 64 61 57 57 57 56.6
Source: NTP, GHS
5.5 Tuberculosis Cure Rate
Region 2015 2014 2013 2012 2011 2010 2009 2008 2007 2006 2005 2004 2003
Ashanti 40.2 73.6 72.3 76.1 76.4 96.9 77.4 81.4 82.3 80.5 74.7 71.9 69
Brong Ahafo 43.1 78.0 80.8 76.5 67 65.9 71.3 70.9 64.1 59 60.8 61.1 63.7
Central 50.1 78.2 83.2 82.4 82.1 86 86.3 87.1 81.8 71.4 62.9 42.4 46.3
Eastern 41.9 68.6 67.6 68.6 71 61.4 73.8 75.5 72.9 68.8 63.1 61.4 60
Greater Accra 46.3 85.3 87.2 85.8 82.7 83.5 81.7 82 82.5 76 80.5 82 77.7
Northern 42.7 75.5 72.1 64.9 76.4 79.3 74.8 76.3 66.4 66 47 64
Upper East 40.8 88.2 82.1 81.3 85.2 87.6 88.3 72.2 75 73.6 66.9 67.4 59.6
Upper West 41.9 71.4 67.9 64.7 62.3 50.5 54.6 42.1 44.5 56.3 47.4 62.5 52
Volta 37.3 71.1 70.6 69.4 74.9 73.8 78.7 88 79.8 74 77.3 74.4 74.7
Western 61.3 70.3 63.1 69.5 72.3 75.2 77.6 73.5 74.2 59.9 57.6 55.6 38.7
National 42.5 75.0 74.3 74.5 75.5 75.6 79.1 78.8 77.5 76.1 67.6 64 61
Source: NTP, GHS

44
5.6 Tuberculosis Treatment Success Rate
Region 2015 2014 2013 2012 2011 2010 2009 2008 2007 2006 2005 2004 2003
Ashanti 86.1 98.2 89.2 90.9 90 91.8 88.8 90.3 90 86 80 79 81
Komfo Anokye
Teaching
Hospital 73.9 81.1
83.3 77.3 77.3 75.7 70.8 73.5 86 70 57 64 71
Brong Ahafo 89.3 87.1 89.8 85.3 83.5 76.6 78.9 82.3 77 70 66 67 69
Central 86.7 84.4 86.1 85.7 87 87.7 90.4 90 87 75 67 54 53
Eastern 84.9 86.7 84.4 81.8 83.7 72.1 80.5 82 79 77 72 67 64
Greater Accra 89.9 92.0 91.4 90.8 87.5 89.3 87.5 84.9 87 85 79 82 79
Korle Bu
Teaching
Hospital 56.2 74.2
74.5 78.2 78.5 72.7 65.8 70.8 70 69 68 77 71
Northern 90.6 87.5 86.5 73.1 81.2 85 84.5 87.8 83 80 80 74 75
Upper East 65.3 93.1 88.1 85.8 85.7 88.3 89.1 76.9 79 78 72 72 70
Upper West 86.0 86.4 89.7 83.2 77.2 73 73.6 61.8 71 71 65 85 69
Volta 85.5 88.9 87.7 86.5 86.1 87.7 87.1 93.4 87 83 84 82 81
Western 91.0 88.8 84.5 90.4 88.1 91 90.9 86.5 86 74 67 68 61
National 85.1 88.0 87.1 86.7 86.2 85.5 87 85.4 84 79 73 72 70
Source: NTP, GHS

45
6.0 EPI, GHS
REGION 6.1 Measles Immunization Coverage Rate, 2002 - 2015
2016 2015 2014 2013 2012 2011 2010 2009 2008 2007 2006 2005 2004 2003 2002
Ashanti 96.3 92.9 92 86 87 84.7 87.8 87.1 80.7 77.7 73.7 79 68 70 77
Brong Ahafo 94 96 93.3 91 97 96.4 95.5 93.9 96.6 102 99.4 89 87 86 87
Central 90 87 87.2 85 88 98.5 97.4 98.1 94.4 94 89 85 83 81 83.5
Eastern 89.3 88.3 78.8 79 87 94.4 96 94 95.1 95.5 93.8 92 86 93 91.6
Greater Accra 90.5 86 77.9 76 78 71.4 71.2 74 67.3 69.2 65.9 67 63 66 75.6
Northern 101 106.4 107.3 107 113 112.4 107.1 119.7 109.2 116.4 112.4 96 94 92 106.4
Upper East 73.8 84.1 83.2 79 83 85 83.6 105.9 93.1 102.2 95.8 85 88 84 93.3
Upper West 74.8 79.2 76.6 75 75 75.8 82 90.6 90 97.7 101.1 78 92 88 89.7
Volta 80.5 72.8 78.2 73 77 78.9 78.4 78.3 78.8 78.8 71 69 70 68 65.3
Western 82.9 89 85.4 85 96 86.4 85.7 85.2 87.5 92.1 90.3 80 86 87 86.8
National 90.1 89.6 86.9 84 89 87.7 87.7 89.1 86.5 88.6 85.1 81 78 79 83.8
Source: EPI, GHS
REGION 6.2 Penta 3 (DPT3) Immunization Coverage Rate, 2002 - 2015
2016 2015 2014 2013 2012 2011 2010 2009 2008 2007 2006 2005 2004 2003 2002
Ashanti 98.2 93.5 93.5 88 88 85 86.5 83.7 76.8 72.3 71 73 66 66 70.3
Brong Ahafo 96.5 95.5 94.2 92 96 94 94.3 95 97.3 100.2 96.8 91 83 81 82.7
Central 91.7 86.3 85.1 83 86 95 94.3 96.6 92.2 92.6 88.4 88 86 83 82
Eastern 97.2 92 83.5 83 87 93 93.6 94.5 93 93 88.6 89 79 81 80.1
Greater Accra 89.4 82.8 74.1 74 85 66 70.1 72.7 68.3 67.8 65.4 66 55 62 71.5
Northern 109.7 109.2 113.6 110 110 114 109.2 123 114.5 123.7 115.2 112 93 85 90.2
Upper East 79.2 87.2 89.1 83 84 87 83.1 105.9 94.8 101.6 92.6 97 87 83 90.7
Upper West 78.1 79.5 81.7 79 76 83 83 90.1 87.5 93.9 92.4 76 90 87 84.9
Volta 84.1 84.2 82.4 75 78 81 81.4 82.9 83.8 83.8 77.5 75 71 67 64.7
Western 85.9 89.1 90.7 88 95 89 86.4 88.6 89 93.3 91.1 85 86 88 85.4
National 93.3 90.9 88.8 86 88 87 87.1 89.3 86.6 87.8 84.2 83 76 76 78.1
Source: EPI, GHS

46
REGION 6.3 OPV3 Immunization Coverage Rate, 2002-2015
2016 2015 2014 2013 2012 2011 2010 2009 2008 2007 2006 2005 2004 2003 2002
Ashanti 97.8 93.9 93.4 88 87.5 84.7 86.3 83.61 76.7 72.3 70.6 72 66 68 70.5
Brong
Ahafo 96 96.6 95.1 92 95.2 93.8 94.1 93.76 97.2 101.3 97.1 91 82 80.2 81.2
Central 90.8 86.6 86.7 83 86.5 94.4 92.9 93.66 90.9 92.7 88.2 102 89 83.9 85.5
Eastern 96.7 92.2 83.2 85 87.4 92.6 93.1 94.15 92.7 93.3 88.8 91 79 81.3 80.4
Greater Accra 88.7 83.8 74.3 74 74.5 66.1 70.3 72.28 68.4 67.4 64.8 66 56 60.5 71.8
Northern 110.7 112.7 113.4 108 109.2 114.1 109 122.13 114.2 122.5 113.3 112 93 84.7 92
Upper East 79.1 86.9 88.8 83 86.4 86.5 82.8 105.35 89.2 100.8 92.6 96 87 82.9 91.9
Upper West 77.5 79.1 81.7 79 75.7 79.8 81.7 89.27 87.4 93.8 92.3 75 90 86.2 85
Volta 83.4 85 82.4 75 77.3 81.2 81.5 83.11 83.8 83.6 78 76 71 67.1 65
Western 84.8 92.8 90.6 91 93.9 87.9 86 88 88.4 92.4 89.6 85 86 87.4 87.1
National 92.8 92 89 86 87.4 86.7 86.8 88.69 86.1 87.6 83.7 84 76 75.5 78.8
Source: EPI, GHS
REGION 6.4 BCG Immunization Coverage Rate, 2002 -2015
2016 2015 2014 2013 2012 2011 2010 2009 2008 2007 2006 2005 2004 2003 2002
Ashanti 112.3 98 110.7 103 105.4 107.1 105.5 101.6 95.7 90.5 87.5 86 72 77 84.2
Brong Ahafo 109.7 106.1 110.5 109 114.1 114.4 111.6 111.1 111.6 114.5 111.6 99 98 96.7 94.6
Central 107.2 99.1 103.8 105 114.1 124 120.5 123.9 118.6 124 114.5 115 111 109 110.9
Eastern 101.2 82.7 92.4 95 103.8 110.3 114.3 114.2 111.7 110.6 110.2 114 104 102.3 107.1
Greater Accra 92.5 85.9 80.9 78 83.9 77.5 74.8 75.6 76.4 73.7 73.6 83 72 79.3 83.3
Northern 126.3 113 131.2 126 130.2 134.7 126.8 139.5 131 130.8 128.7 117 113 101.7 107.9
Upper East 86.2 88.7 90.7 87 89.5 99.3 91.3 123.5 107.3 112.5 110.6 96 108 109.1 116.1
Upper West 81.3 84.3 84.8 82 81.5 85.8 92.3 104.6 105.2 109.1 110 88 106 98.5 95.6
Volta 91.1 84.3 90 84 90.9 95.8 94.1 94.5 98.1 98.1 91.4 89 88 82.3 80.5
Western 94.9 100.3 106.9 106 117.1 104.9 99 100.6 103 107.8 103.8 98 100 101 104.4
National 103.1 95.1 101.6 98 104.3 104.8 102.1 103.8 102.6 102.4 99.6 97 92 92 95.6
Source: EPI, GHS

47
REGION 6.5 Tetanus Toxiods Immunization Coverage Rate, 2006-2015
2016 2015 2014 2013 2012 2011 2010 2009 2008 2007 2006
Ashanti 64.2 60.1 70 75 76.5 80.6 78 83.1 80.2 69 68.3
Brong Ahafo 82.7 84.4 81.5 76 74.4 81.6 84.9 82.2 89.8 90.9 88.9
Central 80.9 75.8 71 72 82.6 86.4 94.3 89.6 93.2 81.9 78.7
Eastern 79.2 76.7 70.5 76 71.9 80.2 83.6 85.1 80.7 67.3 68.1
Greater Accra 79.9 70.4 54.5 61 66.8 65.4 67.4 66.8 59.6 50.3 56.8
Northern 74.7 87.9 94.6 97 94.3 82.2 93.5 108 97.9 95 78.5
Upper East 55.6 63.3 66.3 59 62.3 70.3 63.8 85.5 66.2 90.4 78.3
Upper West 65.1 65.8 59.6 55 56.2 64.1 69.4 71.2 71.6 67.4 52.3
Volta 67.2 69.4 53.8 56 60 67.8 60.8 63.9 63.7 57 59.7
Western 61.6 65.4 54.8 65 72.3 64.1 62.8 62.6 62.7 58.8 57.1
National 72.3 71.7 160.5 71 73.6 75.7 76.2 78.6 76.3 70.1 68.2
Source: EPI, GHS
REGION 6.6 Yellow Fever Immunization Coverage Rate, 2005-2015
2016 2015 2014 2013 2012 2011 2010 2009 2008 2007 2006
Ashanti 80.2 92.3 91.5 86 86.8 84.3 87.4 86.8 80.4 76.9 72.9
Brong Ahafo 91.9 95.5 92.9 90 92.4 95.3 95.1 94 94.8 100.9 98.4
Central 86.7 88.9 85.9 85 86.2 96.9 95.1 96.8 91.3 91.9 86.6
Eastern 83.2 89 78.8 80 85.8 93.9 95.9 94.2 95.4 95.5 90.8
Greater Accra 77.6 87.7 77.8 76 77.3 71.4 43.2 73.2 66.8 68.3 64.4
Northern 88.7 104.5 105.9 105 110.1 111.4 106 118.7 107.6 115 110
Upper East 68.6 83.8 81.9 77 96 83.3 81.5 107.5 84.8 101.1 92.6
Upper West 73.8 79.1 76.3 75 74.5 75.1 82.6 89.5 88 97 96.2
Volta 75.8 82.9 78.8 73 76.3 79.1 78.5 78.2 79 77 71.6
Western 72.8 93.2 83.8 86 93.8 85.9 85.5 84.7 93.1 96.6 93.6
National 80.8 91 86.3 84 87.8 87.1 87.5 88.8 86 88.1 84
Source: EPI, GHS

48
REGION 6.7 Rotarix 2 Coverage 2012-2015
2016 2015 2014 2013 2012
Ashanti 97.5 93.8 93.7 88 49
Brong Ahafo 94.4 95.3 93.8 88 53
Central 88.8 84.7 83.5 80 43
Eastern 93.7 88.8 80.5 79 44
Greater Accra 82.7 77.7 72 70 43
Northern 113.8 112 115.3 107 55
Upper East 78.3 86.4 87.7 81 46
Upper West 78.3 78.6 81.9 77 43
Volta 80.4 81.8 81.7 75 40
Western 84.4 91.8 89.5 84 46
National 91.1 89.8 88 83 47
REGION 6.8 PCV 3 Coverage 2012-2015
2016 2015 2014 2013 2012
Ashanti 98.4 93.4 94 88 42
Brong Ahafo 96.5 96.6 95.4 92 46
Central 91.7 87.5 85.4 80 37
Eastern 97.3 92.2 83.3 83 41
Greater Accra 89.7 83.7 74.7 74 39
Northern 109.5 110.9 113.2 104 48
Upper East 79.2 87.2 88.9 83 40
Upper West 78.3 79.2 81.8 78 35
Volta 84.1 84.8 82.6 75 35
Western 85.6 93.1 91 84 37
National 93.3 91.8 89.2 84 40
Source: EPI, GHS

49
REGION 6.9 AFP Non-Polio Rate 2007-2015
2016 2015 2014 2013 2012 2011 2010 2009 2008 2007
Ashanti 1.96 1.96 1.13 1.98 1.17 2.09 1.48 2.1 1.35 0.89
Brong Ahafo 7.82 7.82 4 6.35 3.4 2.8 2.4 3.7 4.22 1.44
Central 2.82 2.82 3.36 2.66 2.22 2.38 1.38 4.25 2 3.13
Eastern 2.32 2.32 1.44 2.29 1.8 2 1.6 4.1 2.7 1.3
Greater Accra 1.75 1.75 1.44 1.52 0.25 0.6 0.95 1.06 1.06 0.5
Northern 4.24 4.24 2.42 2.73 1.64 3.3 2.2 2.5 3.4 2.11
Upper East 4.89 4.89 7.11 6.15 3.5 4.5 2 5.5 4.5 2
Upper West 2.57 2.57 3.33 5.77 3.33 5 4 4.33 3.33 3
Volta 3.14 3.14 3.1 2.09 1.67 3.13 3.13 2.25 1.63 1.75
Western 6.18 6.18 4.91 1.42 0.75 2 2.18 1.82 2.1 2.8
National 3.42 3.42 2.63 2.71 1.53 2.2 1.82 2.68 2.24 1.6
Source: Disease Surveillance Department

50
7.0 Reproductive Health Services
REGION 7.1 ANTE NATAL COVERAGE 7.2 SUPERVISED DELIVERY
2016 2015 2014 2013 2012 2011 2010 2009 2008 2007 2016 2015 2014 2013 2012 2011 2010 2009 2008 2007
Ashanti 74.7 73 76.6 81.9 82.3 84.3 84.7 80.7 86.1 76.1 53.4 52.9 54.4 55.4 50.1 45.9 53.4 42.4 35 26.7
Brong
Ahafo 81.9 84.7 90.3 95.5 100.4 110.6 82.3 97.9 102.1 101.8
61.7 62.6 65.4 65 65.7 46.8 54 53.7 49.8 34.5
Central 94.4 87.3 89.3 89.3 97.7 107.7 106.1 109.1 115.5 108.7 61.3 57.9 59.5 53.7 58.7 51.6 51.6 52.5 56.3 22.3
Eastern 71.8 75.5 77 82.1 86.9 93.9 84.8 93.4 98.2 87.2 50.4 51.2 52.5 52.8 56.5 58.1 48.2 52.1 48 43.1
Greater
Accra 87.6 85.3 87.9 86.9 88.7 91.7 89.5 77.4 85.2 77.2
59.4 59.1 59.7 56.4 56.6 58.8 54.4 47.9 50.3 43.1
Northern 116.7 114.4 117.5 113.6 112 135 120.9 120.8 127.7 116.8 57.5 52.8 53.4 46.8 43.3 44.5 36.8 36.1 26 27.7
Upper
East 76 82 83.6 83.8 88.1 91.6 92.5 100.1 102.1 111.7
70.1 74.2 73.5 67.5 68.4 67 59.7 52.6 40.4 43.5
Upper
West 85.4 83.2 85.2 87.7 84.4 86.2 88.8 88.9 93.5 96.3
66.3 62 64 58.2 52.5 39 46.5 36.7 40.6 32.9
Volta 68.8 70.8 77.1 78.3 81.8 88.7 81 88.9 93.4 87.4 43.7 44 45.3 43.4 44.8 44.3 36.9 39.4 37.5 33.3
Western 85.4 95.5 94.3 103.2 101.1 98.6 109.8 93.5 98.8 91.7 53.8 57.7 57.2 55.5 53.5 39.3 49.6 42.6 39.1 17.6
National 84.1 84.5 87.3 90 92.2 98.2 93.3 92.4 97.8 91.1 56.2 55.9 57 55 55.6 52.2 49.5 45.6 42.2 32.1

51
REGION 7.3 POST NATAL CARE 7.4 FAMILY PLANNING ACCEPTORS
2016 2015 2014 2013 2012 2011 2010 2009 2008 2007 2016 2015 2014 2013 2012 2011 2010 2009 2008 2007
Ashanti 55.4 57 62.2 49.4 48.2 53.4 52.6 38.4 51.6 50.6 25 22.2 20.4 19 16.6 17.4 17.6 17.5 15.7 15.2
Brong
Ahafo 70.5 77.6 82.4 71.3 66 64 59.2 53.7 57.2 57.1
52.3 40.1 56.3 35.3 26.4 28.3 33 43.4 36.3 40.9
Central 73.1 70.8 65.1 56.9 62.9 68.9 66.8 71.4 77.6 73.4 29.8 25 27.1 22.9 26.3 28.5 25.1 33.1 33 29.6
Eastern 61.8 66 73.1 68.5 68.7 71.7 64.5 67 61.5 61.5 27.8 28.1 29.9 28.1 31.6 36.3 31.5 32.9 33.1 33.3
Greater
Accra 67.7 68.7 73.4 63 62.8 65.4 57.7 51.7 48.7 48.5
54.8 38.7 33.2 28.9 27.3 41.9 31.6 32.6 63.9 16.4
Northern 101 93.9 104.3 89.7 83.8 91.8 88.9 84.9 80.7 76.8 22.2 18.5 19.4 15.9 16.4 21 21.5 28.9 26 20.1
Upper
East 72.4 78.4 80.5 76.6 77 78.7 76.2 77.8 57.3 66.9
30.2 29.1 29.1 26.9 28.1 29.7 24.3 33 26.2 27.4
Upper
West 71.8 68.4 76.2 69.3 64.8 68.8 68.4 64.9 68.7 70.1
52.1 53.1 50.9 42 42 50.7 49.2 56.5 59.8 85
Volta 53.5 58.2 68.2 55.1 53.4 58.2 50.1 47.3 50.5 55.6 26.5 26.3 27.8 24.1 24.6 28.6 22.5 27.5 21.6 23.7
Western 62.2 65.8 65.6 63.2 59.6 55.5 54.4 49.5 45.6 37.6 23.6 23 22.3 21.2 18.9 22.8 13 18.9 19.6 13.9
National 67.3 68.9 73.6 64.1 62.7 65.3 58.1 56.4 57.5 56.7 33.8 28.7 29.3 24.7 25.2 28.1 34.7 31.1 33.8 23.2
Source: RCH/PHD

52
7.5 Institutional Maternal Mortality Ratio
Region
2016 2015 2014 2013 2012 2011 2010
Maternal
Deaths
Maternal
Mortality
Ratio
Maternal
Deaths
Maternal
Mortality
Ratio
Maternal
Deaths
Maternal
Mortality
Ratio
Maternal
Deaths
Maternal
Mortality
Ratio
Maternal
Deaths
Maternal
Mortality
Ratio
Maternal
Deaths
Maternal
Mortality
Ratio
Maternal
Deaths
Maternal
Mortality
Ratio
Ashanti 129 114 168 136.4 139 114.9 200 125.3 79 77 252 232 165 149.6 Brong
Ahafo 77 117.1 87 130.6 95 134.9 95 139.2 112 167 93 208 73 138.7
Central 95 158.7 67 108.4 65 105.2 68 121.6 64 113 74 141 82 149.0
Eastern 97 158.9 107 176.1 117 175.5 124 199.5 116 179 935 207 115 191.6 Greater
Accra 197 180.4 208 176.8 204 184.7 201 196.7 196 201 242 256 169 181.5
Northern 133 207.3 92 144.3 66 107.5 99 173.7 111 212 114 165 84 137.2 Upper
East 37 110.9 30 89.7 45 138.7 33 108.4 40 136 36 120 37 137.9
Upper
West 25 118.6 30 155.8 31 161.1 34 192.9 24 146 29 202 26 157.7
Volta 71 167.7 62 134.3 86 178.8 73 161 72 175 87 201 82 209.6
Western 94 151.5 75 124.5 93 149.5 85 152.7 75 132 60 114 99 176.1
National 955 151.1 926 141.9 941 143.9 1,012 154.5 889 152 1,122 195 932 163.2
Region
2009 2008 2007 2006 2005 2004 2003 2002
Maternal
Deaths
Maternal
Mortality
Ratio
Maternal
Deaths
Maternal
Mortality
Ratio
Maternal
Deaths
Maternal
Mortality
Ratio
Maternal
Deaths
Maternal
Mortality
Ratio
Maternal
Deaths
Maternal
Mortality
Ratio
Maternal
Deaths
Maternal
Mortality
Ratio
Maternal
Deaths
Maternal
Mortality
Ratio
Maternal
Deaths
Maternal
Mortality
Ratio
Ashanti 177 215 222 252.6 179 245.9 175 212.2 181 195.9 161 176.4 173 196.1 172 203.4
Brong
Ahafo 94 194 81 185.3 88 222 116 225.8 75 211.4 104 229.6 84 196.2 102 235.1
Central 69 129 92 223.2 92 266.2 85 120.6 44 103.9 71 134.5 71 159.3 86 206.5
Eastern 82 136 98 170.7 146 265.3 118 227.3 143 288.1 109 267 113 262.6 92 198.2
Greater
Accra 166 197 167 194.3 149 202.3 118 123.6 125 182.4 114 183 120 187.7 83 122.8
Northern 96 147 91 175.9 113 206.9 91 186.2 70 176.5 66 172 77 254.8 49 158.2

53
Upper
East 30 131 27 152.2 29 140.7 43 219.9 34 172.3 46 170.9 34 203.5 59 378.3
Upper
West 41 267 22 120.6 30 160.9 20 118.8 21 122.7 19 107.7 16 99.1 17 106.7
Volta 55 146 52 144.7 65 200.5 65 217.4 78 255.6 71 261.9 84 256.2 91 345.6
Western 79 148 101 269.5 104 341 126 284.3 92 244 63 155.4 82 209.5 86 231.9
National 889 170 953 199.7 996 230.2 957 187.2 863 196.8 824 186 854 204.5 837 204.4
Source: CHIM/RCH
Institutional Maternal Mortality Ratio is the number of maternal deaths occurring in health facilities per 100,000 live births.

54
APPENDIX 1 8.1 TREND IN OPD ATTENDANCE PER CAPITA (2006-2014) 8.2 INFANT MORTALITY RATE-GHANA (1988-2014)
Figure 1 Figure 2
8.3 TOTAL FERTILITY RATE-GHANA (1988-2014) 8.4 INCIDENCE OF MALARIA PER 100,000 POPUATION
Figure 3 Figure 4
-
5,000
10,000
15,000
20,000
25,000
30,000
35,000
40,000
45,000
2009 2010 2011 2012 2013 2014 2015 2016
Inci
den
ce p
er 1
00
,00
0
Malaria incidence per 100,000 population (2009-
2016)

55
8.5 DOCTOR POPULATION RATIO (2008-2016) 8.6 NURSE POPULATION RATIO (2008-2016)
Figure 5 Figure 6
8.7 IMMUNIZATION COVERAGE (2008-2016) 8.8 RCH COVERAGE (2002-2006)
Figure 7 Figure 8

56
APPENDIX 2
9.0 MAJOR CAUSES OF ADMISSIONS AND DEATHS – 2016
Data on the causes of hospital admissions and deaths were collected from the regional hospitals and
district hospitals in all the ten regions excluding the two Teaching Hospitals.
9.1 Top Ten Causes of Admission All Ages – National 2016
Rank Cause of Admission Total cases
seen
Proportional
Morbidity Rate
(%)
1 Malaria 136,063 25.1
2 Anaemia 23,134 4.3
3 hypertension 21,927 4.0
4 Pneumonia 20,518 3.8
5 Infection of Urinary Tract (UTI) 13,008 2.4
6 Spontaneous delivery 12,905 2.4
7 Diabetes 8,978 1.7
8 Septicaemia 7,832 1.4
9 Gastritis 7,242 1.3
10 Cellulitis 6,480 1.2
All others 284,837 52.5
Total 542,924 100.0
Source: DHIMS2, GHS,
9.2 Top Ten Causes of Death All Ages – National 2016
Rank Cause of Death Total cases seen Proportional
Morbidity Rate (%)
1 Malaria 926 7.2
2 Pneumonia 903 7.0
3 Asphyxia 842 6.5
4 HIV/AIDS 828 6.4
5 Anaemia 747 5.8
6 Hypertension 588 4.6
7 Cerebrovascular Accident 489 3.8
8 diabetes 331 2.6
9 Septicaemia 300 2.3
10 Gastroenteritis 211 1.6
All others 6724 52.2
Total 12889 100.0
Source: DHIMS2, GHS

57
9.3 Top Ten Causes of Admission for Children Under 5 Years – National 2016
Rank Causes of Admission Number of cases
% of
Morbidity
cases
1 Malaria 66,102 40.6
2 Gastroenteristis 11,309 6.9
3 Bronchopneunomia 10,202 6.3
4 Anaemia 8,230 5.1
5 Septicaemia 5,015 3.1
6 Pneumonia 4,480 2.8
7 Asphyxia 3,733 2.3
8 Enteristis 1,430 0.9
9 Urine track infectin UTI 1,341 0.8
10 Diarrhoeal Diseases 918 0.6
All other Diseases 49,972 30.7
Total 162,732 100.0
Source: DHIMS2, GHS
9.4 Top Ten Causes of Deaths for Children Under 5 Years – National 2016
Rank Causes of Death Number of Cases % of morbidity
1 Asphyxia 436 16.6
2 Malaria 308 11.8
3 Pneumonia 195 7.4
4 Anaemia 129 4.9
5 Bronchopneumonia 82 3.1
6 Septicaemia 45 1.7
7 Gastroenteristis 38 1.5
8 Hypoglycaemia 34 1.3
9 HIV/AIDS 23 0.9
10 Enteristis 11 0.4
All other Diseases 1318 50.3
Total 2619 100.0
Source: DHIMS2, GHS

58
IMPORTANT HEALTH DAYS AND DATES
January
New Year Day - 1st
Health Sector Working Group meeting - 5th
TB HIV Collaborative Review Meeting - 25th – 27th
World Leprosy Day - 28th
February
CHPS Implementation TWG 1st week
HR Scientific meeting 1st to 3rd
Health Sector Working Group Meeting 2nd
World Cancer Day 4th
Health Partners Meeting 3rd week
March
Health Sector Working Group Meeting 2nd
Orientation for newly selected Deputy Directors of Nursing and Midwifery Service -1st week
Independence Day 6th
World Kidney Day 14th
World TB Day 24th
Integrated Monitoring 1st to 4th Week
Senior Managers Meeting/Conference (SMM1) 4th Week
April
Health Sector Working Group Meeting 6TH
Peer Review Meeting for Supply Chain Personnel 5th – 7th
World Health Day 7th
Palm Sunday 9th
Good Friday 14th
Easter Sunday 16th
Easter Monday 17th
World Malaria Day 25th
Health Summit 4th Week
African Vaccination Week
World Immunization day Last week in April
May
May Day 1st
Health Sector Working Group Meeting 4th
World Asthma Day 9th
Child Health Promotion Week 2nd week
World Hypertension Day 17th
African Union Day 25th
Drug Abuse Day 26th
Annual Research Dissemination Forum 31st May to 1st June
World No Tobacco Day 31st

59
June
Health Sector Working Group Meeting 1st
Health Partners Meeting 3rd week
World Blood Donor Day 15th
World Sickle Cells Day 19th
July
Republic Day 1st
Health Sector Working Group Meeting 6th
World Population Day 11th
20th African Union International conference on TB and Lung Diseases 10th – 14th
National Diabetes Week
Senior Managers Meeting/conference (SMM2)
Half Year Performance Reviews
World Hepatitis Day 28th
August
World Breastfeeding Week 1st – 7th
Health Sector Working Group Meeting 3rd
Mid-Year TB HIV Review Meeting
September
Health Sector Working Group Meeting 7th
Safe Motherhood Day 21st
World Rabies Day 28th
World Heart Day 29th
Mid Term in NTP/ Partners Joint Review
Annual General meeting of the Health Sector
Supply Chain Practitioners Association of Ghana (HESSCPAG) 27th – 29th
Integrated Monitoring visits 1st – 30th
Family Planning Week
October
International Day of Older Persons 1st
Health Sector Working Group Meeting 5th
World Sight Day 8th
World Mental Health Day 10th
Global Hand Washing Day 15th
National CHPS Forum
Measles Rubella Campaign
November
Health Sector Working Group Meeting 2nd
World Pneumonia Day 12th
World Diabetes Day 14th
Adolescent Advocacy Week
Last week

60
December
World Aids Day - 1st
Health Sector Working Group Meeting - 7th
Christmas Day - 25th
Boxing Day - 26th


