1
The horrendous costs of motorized transportation
in (Indian) cities
Henrik Valeur, 2013*
Abstract
With rural-urban migration and urban-rural remittance, the number of people affected by traditional
“rural” ills, such as undernourishment and infectious diseases, may decline. However, if cities and
urban cultures are not properly developed and maintained, “rural” ills may simply be replaced by
“urban” ills, such as stress, physical inactivity and social isolation, which may bring about even more
suffering. In countries like India, many of the “urban” ills can be attributed to the uncontrolled
proliferation of motorized transportation in cities, which, in combination with inadequate planning
and management, weak regulations/weak enforcement of regulations and lack of urban mobility
culture, may also have detrimental effects on the environment while severely hampering development.
Keywords
Urbanization, transportation, health, environment, development
Author
Henrik Valeur is a Danish born architect-urbanist, an independent researcher, founder and creative
director of UiD. He has studied urban mobility in cities around the world and developed numerous
projects for sustainable urban mobility, including the concept of “green streets”, the design of the
“Bicycle Tower” and a plan to make Sector 19 in Chandigarh car-free. For more information, see:
www.henrikvaleur.dk
*This paper appeared in Alog, March 26, 2013. Modified versions appeared in The Gobal Urbanist,
March 26, 2013 and in World Streets, March 30, 2013. It was reprinted in India: the Urban Transition
- A Case Study of Development Urbanism; Henrik Valeur; 2014
This paper may be copied or reprinted for noncommercial purposes as long as proper citation
standards are observed (author, title, date).
2
Table of contents
Abstract 1
Keywords
Author
1. Introduction 3
1.1 Urban mobility and development
1.2 Urban mobility culture
1.3 “Modern” mobility
1.4 Good and bad mobility in cities
1.5 Mobility interests
1.6 Mobility trends
1.7 Mobility problems
2. Human health effects 8
2.1 Accidents
2.2 Air pollution
2.3 Noise
2.4 Stress
2.5 Physical inactivity
2.6 What is causing the most human suffering?
3. Environmental harm 16
3.1 Degradation of urban environments
3.2 Destruction of eco-systems and loss of biodiversity
3.3 Resource depletion
3.4 Climate change
4. Development constraints 20
4.1 Expenditure
4.2 Loss of productivity
4.3 Reduced learning abilities
4.4 Environmental restraints
Notes 24
3
1. Introduction
It could presumably be argued that it is the combined ability to both move and think
that has enabled us, human beings, to achieve the kind of progress we have achieved.
Today, however, mobility and thinking often seem to oppose – or even exclude – one
another, especially in cities, where the current modes of transportation and traffic
behavior are not only threatening the health of the individual but also that of
communities and eco-systems.
And the prospect of many more people moving to cities and the prospect of cities
growing much larger are, of course, only making this threat that much more
imminent,1 especially in so-called “developing” countries, where the number of
motor vehicles in cities is growing rapidly, often exponentially, apparently without
any serious attempt to control this proliferation.
1.1 Urban mobility and development
On the contrary, in many “developing” countries, local governments, often with the
assistance of international development agencies, are seeking to expand, rather than
to limit, motorized transportation in cities, for instance, by subsidizing rather than
taxing the consumption of fossil fuel and by providing incentives and funding for
more flyovers and expressways for motorized transportation.
While mobility may be regarded as a driver of development, motorized
transportation in cities may effectively restrain development because traffic
congestion does lead to decreased mobility and the loss of human resources. In
addition, development can also be impeded by the inefficient and wasteful use of
natural resources caused by motorized transportation.
4
1.2 Urban mobility culture
In “developed” countries, motorized transportation evolved gradually, which gave
drivers, planners and law enforcement time to adapt to new transportation
technologies and increased levels of traffic. In “developing” countries, however, the
transition to motorized transportation is abrupt and sweeping. And for many people,
driving a car is a new experience.
Furthermore, urban planners and managers in “developing” countries are rarely
trained or equipped to handle massive motorized traffic congestion. And while there
may or may not be regulations in place to mitigate bad traffic behavior and the worst
effects of motorized transportation, these regulations are, in practice, almost never
enforced effectively.
1.3 “Modern” mobility
Ironically, while people in “developing” countries are aspiring to the same kind of
“modern” mobility that people in “developed” countries have been enjoying for
decades, the people in “developed” countries are now beginning to adopt modes of
mobility that people in “developing” countries consider outdated and backwards.
Thus, a fairly recent mobility invention in “developed” countries is the concept of
“shared mobility space”, which, of course, has a long history in many “developing”
countries. And in cities like London and New York, bicycle rickshaws (pedicabs) are
becoming increasingly popular while back in their homelands, in Asia, the bicycle
rickshaws are being replaced with auto rickshaws.
1.4 Good and bad mobility in cities Mobility is crucial to the functioning of contemporary cities and when it comes to
individuals being able to tap into the opportunities offered by these cities although a
clear-minded distinction must be made between “good” and “bad” mobility in cities.
5
Good mobility, like walking and cycling, may improve our health without harming
the environment while bad mobility, on the other hand, may severely damage both
our own health and the health of the environment. And in so doing, it may also
restrict development opportunities.
In principle, bad mobility in cities encompasses all means of motorized
transportation that contribute to local, regional and/or global pollution, resource
depletion and ecological destruction. This may include engines running on both
“dirty” fuels, like diesel and gasoline, and “clean” fuels, like compressed natural gas
and electricity. The negative effects on human health and the environment vary
greatly, though.
Bad mobility is also inefficient with, for instance, the car consuming many more
resources, creating much more pollution and taking up much more space than the
bicycle, although in central urban areas, the average speed of the car is now often the
same or even slower than the average speed of the bicycle, and, if we take into
account the time needed for parking the vehicle, it may, in certain places, be even
slower than walking.2
1.5 Mobility interests
There are obviously very big interests at stake here and they are not necessarily
staked in favor of human health, the environment and development. Thus, according
to the Fortune Global 500 list from 2013, six out of the world’s ten largest companies
by revenue are in the petroleum industry, two are automakers and one is a power
company.3 These companies are headquartered in Europe, North America and East
Asia and it has to be assumed that they exert considerable influence on the political
establishment in these regions.
1.6 Mobility trends In the past fifty years (1960-2010), the number of cars registered worldwide has
increased more than sevenfold (from nearly 100 million to over 700 million) while
6
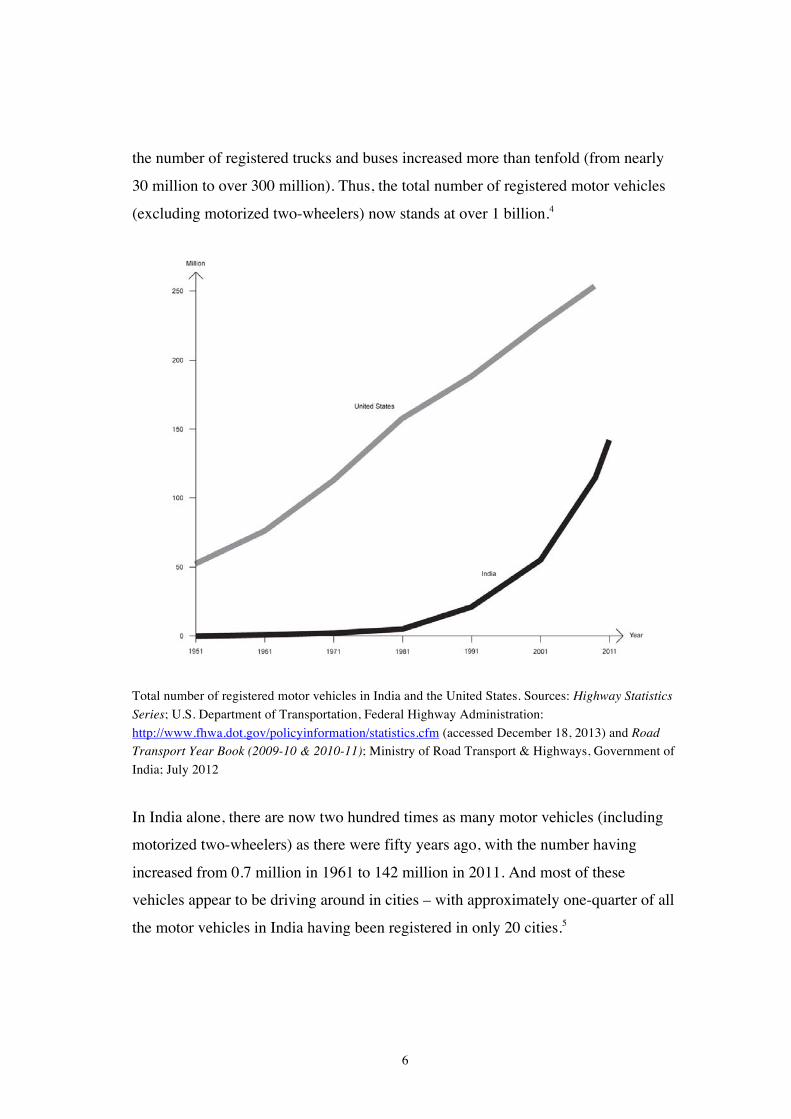
the number of registered trucks and buses increased more than tenfold (from nearly
30 million to over 300 million). Thus, the total number of registered motor vehicles
(excluding motorized two-wheelers) now stands at over 1 billion.4
Total number of registered motor vehicles in India and the United States. Sources: Highway Statistics Series; U.S. Department of Transportation, Federal Highway Administration: http://www.fhwa.dot.gov/policyinformation/statistics.cfm (accessed December 18, 2013) and Road Transport Year Book (2009-10 & 2010-11); Ministry of Road Transport & Highways, Government of India; July 2012
In India alone, there are now two hundred times as many motor vehicles (including
motorized two-wheelers) as there were fifty years ago, with the number having
increased from 0.7 million in 1961 to 142 million in 2011. And most of these
vehicles appear to be driving around in cities – with approximately one-quarter of all
the motor vehicles in India having been registered in only 20 cities.5
7
By 2030, three times as many motor vehicles as today are expected to be driving on
Indian roads.6 At the same time, Indian cities are expected to accommodate about 60
percent – or almost a quarter of a billion – more people than today.7 The problems
related to motorized transportation in Indian cities may thus increase in a manifold
way during the next couple of decades.
1.7 Mobility problems
The problems are already manifold but they may be divided into those concerning
our own health and those concerning the health of the environment – both of which
may put constraints on development opportunities.
8
2. Human health effects
The human health effects related to motorized transportation in cities range from
instant death to shorter life expectancy, reduced fertility, cognitive decline, chronic
suffering and poorer life quality.
The causes include accidents, air pollution, noise, stress and physical inactivity.
2.1 Accidents Traffic accidents may result in injuries, mutilations and fatalities.
The World Health Organization (WHO) estimates that more than one million people
worldwide die each year as a result of road traffic accidents and that up to 50 million
people suffer injuries. The organization also reports that the number of deaths caused
by road traffic accidents has increased 25 percent over the last decade and that it now
constitutes the main cause of death for 15-29 year-old people.8
The incidence of traffic accidents is very unevenly distributed throughout the world.
Sweden, for instance, had only 3 traffic-related deaths per 100,000 inhabitants (in
2008)9 while the corresponding figure for India was almost 12 (in 2011).10 Yet,
Swedes had 29 times as many cars per inhabitant (520 out of 1,000) as Indians had
(18 out of 1,000).11
Thus, relative to the number of cars and people, the chances of dying in a traffic
accident in India are about 100 times greater than in Sweden!
With increasing numbers of motor vehicles, lack of space, inappropriate traffic
behavior and weak regulations/weak enforcement of regulations, pedestrians and
cyclists become extremely vulnerable. In India, however, two-wheelers account for
almost as many road traffic deaths as pedestrians, cyclists and people traveling with
9
auto rickshaws combined. This is partially explained by the very high number of two
wheelers, which accounts for 71 percent of all the registered vehicles in India.12
2.2 Air pollution
Air pollution has been called “slow murder”13 because – apart from the acute health
effects like headache, eye irritation and nausea, which will generally disappear when
the exposure to air pollution is reduced or terminated – other effects like pulmonary,
cardiac, vascular, and neurological impairments take time to evolve but are then
often irreversible and may not only reduce life expectancy but can also make life
very painful.
Air pollution from motor vehicles can be divided into gases, such as carbon
monoxide (CO), nitrogen dioxide (NO2) and ozone (O3), and particulate matter like
as very small particles of soot. Both gases and particulate matter are hazardous to
human health.
Nothing is more vital for human beings than breathing. But breathing polluted air
may cause severe harm to the respiratory system, including chronic respiratory
diseases like asthma, chronic bronchitis and chronic obstructive pulmonary disease.
Air pollution may also cause lung cancer.
Worldwide, 1.5 million people die every year from lung cancer and 3 million people
die every year from chronic obstructive pulmonary disease.14 Meanwhile, the number
of people suffering from bronchial asthma has increased about 50 percent per decade
and now stands at between 100 and 150 million, with 180,000 deaths annually.15
Air pollution may also contribute to or increase the risk of cardiovascular diseases,
including coronary heart disease (7 million annual deaths worldwide)16, other forms
of cancer and damage to the immune system, impaired fetal development, cognitive
decline, reduced mental alertness and heavy metal poisoning.17
10
While young people are most vulnerable to road traffic accidents, it is children,
pregnant women, the elderly and people who are already suffering from asthma, lung
diseases and cardiovascular diseases that are most susceptible to air pollution.18
The urban areas most affected by air pollution are usually located within a distance
of a few hundred meters from main traffic arteries but air pollution can vary greatly
from one neighborhood to another and from one city to another.
In most cities, the level of particulate matter in the air exceeds the maximum level
recommended by WHO, with the air quality generally being poorest in cities in
“developing” countries. In India, the level of particulate matter registered in 27 out
of 32 cities exceeds national guidelines, which have already been set at triple the
levels recommended by WHO.19
In many cities, most of the air pollution comes from motor vehicles. Of particular
concern in Indian cities are the diesel engine exhaust gases, which can be observed
as black and blue fumes of smoke being emitted from all sorts of diesel engine
vehicles, including buses, trucks and rickshaws, but also from two-wheelers and even
from new diesel engine cars.
These fumes may be caused by bad fuel mix, low quality of fuel and/or inefficient
burning of the fuel.
In cities, the concentration of hazardous gases and particulate matter from diesel
engine vehicles can become very high and this has been termed the “deadly
dieselization” of Indian cities.20
WHO recently added lung cancer as a proven health effect of diesel engine exhaust,
thus putting it on par with the likes of tobacco and asbestos (gasoline exhaust is still
only classified as possibly carcinogenic to humans).21
11
India’s Centre for Science and Environment reports that standard diesel cars that are
sold across India emit 7½ times more toxic particulate matter and 3 to 5 times more
nitrogen oxides than comparable cars running on gasoline.22
Diesel is often referred to as “the poor man’s fuel” but it would probably be more
accurate to call it “the poor man’s misery”, since both life quality and life expectancy
are adversely affected by long-term exposure to diesel fumes. Most affected are
those who make a living on – or next to – polluted urban roads, such as rickshaw
drivers and street vendors; those who live in close proximity to these roads (this
could also include wealthy people); and those people who have to walk or cycle long
distances on these roads (usually because other means of transportation are not
available to them).
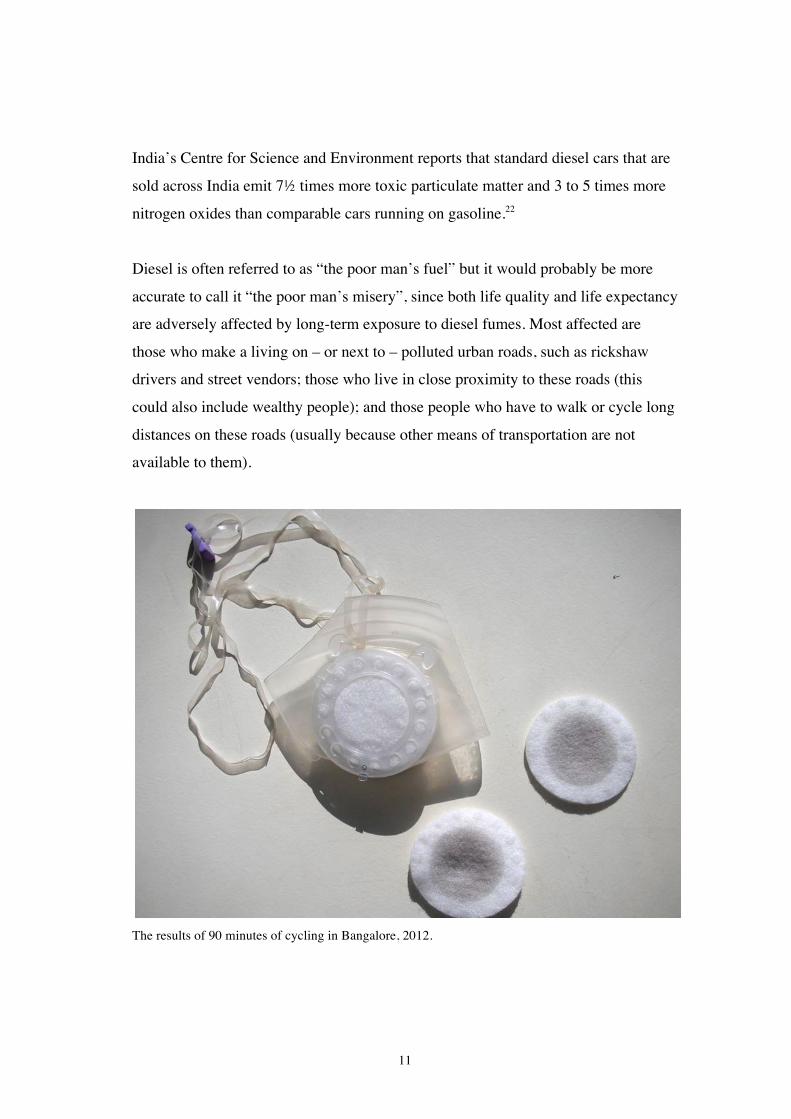
The results of 90 minutes of cycling in Bangalore, 2012.
12
2.3 Noise
Noise pollution is a widespread – albeit a frequently ignored – problem in cities.
According to a WHO report, the health of almost every third person in the European
region is harmed by traffic noise (and these countries are believed to have some of
the strictest noise regulations in the world). 23
Noise pollution caused by honking, motor engines and tires moving on asphalt may
cause high blood pressure and heart diseases, changes in the immune system and
sleep disturbance. It may also cause stress and stimulate aggression and anti-social
behavior. It may further reduce hearing abilities and induce tinnitus. And even birth
defects can be attributed to noise pollution.24
Noise pollution in Indian cities is very high and it would seem that honking is the
main source of the pollution. But most of this honking also seems quite unnecessary,
being merely a habit, the result of over-anxiety or a way of letting off steam resulting
from annoyance and aggression. In addition, honking is also used to announce that
the honker himself (it is rarely a she) is about to commit an unlawful act, such as not
stopping and paying attention at a crossing.25
With so much extraneous honking going on, there is a genuine possibility that people
will stop paying attention altogether. Maybe this is the reason that the sound of the
horns seems to get ever louder and more pitched. Like screaming children, each
driver tries to make himself heard above the others.
2.4 Stress
Most, if not all, urban commuters are exposed to various stress-provoking factors.
Traffic congestion, noise and inappropriate traffic behavior may cause stress to
commuters who happen to be using a private means of transportation and this may
lead to accidents, agitation and aggression (“road rage”) in a self-reinforcing vicious
cycle.
13
Users of public transportation may be exposed to stress-provoking factors like
delays, overcrowding, unpleasant smells and bad behavior, which may, again, lead to
more inappropriate and undesirable behavior.
Commuters who are daily, or frequently, exposed to stress-provoking factors in
traffic may develop chronic traffic-related stress, which is known to increase blood
pressure and the risk of heart disease and heart stroke.26
Both acute and chronic traffic-related stress can seriously damage the memory and
reduce learning abilities.27
2.5 Physical inactivity
By opting for motorized transportation, we opt out of exercising our body. In fact,
we hardly move our bodies at all while traveling. At the same time, motorized
transportation may prevent others from moving their bodies, too.28
Motorized transportation thus becomes the single most important contributor to
sedentary modern lifestyles.
Lack of physical activity impairs the immune system and causes the body to decay.
While physical activity may reduce anxiety and stress, physical inactivity may lead
to cognitive impairment, depression and reduced self-esteem.29 Physical inactivity
can also lead to obesity, which has come to be a global epidemic – with 20 percent of
the world’s adult population being overweight and more than 10 percent being
obese.30 And while this was “once considered a high-income country problem,
overweight and obesity are now on the rise in low- and middle-income countries,
particularly in urban settings”, according to the World Health Organization, 31 which
also estimates that the number of overweight children is now three times higher in
“developing” countries than it is in “developed” countries.32
14
In a series of recent studies, it is estimated that about 1.5 billion people do not attain
present physical activity recommendations and that physical inactivity may cause
more than 5 million annual deaths around the world (the same as the number of
deaths caused by smoking). 33
Physical inactivity may impair children’s development and this may be further
aggravated by a lack of opportunities for children to play in cities, partly because
their parents are afraid of letting them out onto the busy streets.
Urban populations may be more prone to obesity because work in cities is usually
less physical demanding, because diets are less healthy and because motorized
transportation is more readily available.
Obesity can result in mental, social and physical problems, including cardiovascular
disease, sleep deprivation, cancer, degradation of joints, asthma and diabetes type
2.34
Diabetes type 2 is a metabolic disorder, which may lead to heart disease, strokes, loss
of eyesight, kidney failure and amputations. Diabetes was first identified by Indian
physicians some 3,500 years ago and maybe this is no coincidence when we consider
that South Asians, unfortunately, appear to be more genetically predisposed to
diabetes than other people.35 Diabetes type 2 is thought to be caused by a
combination of genetics and modern lifestyles, especially the lack of physical
exercise and unhealthy diets. 36
India is home to the largest number of hungry people in the world but, apart from
China, India also has the largest number of people with diabetes.37 Of the more than
300 million people who are believed to suffer from diabetes type 2 worldwide, 40
percent are from China and India.38
15
2.6 What is causing the most human suffering?
Though undernourishment and infectious diseases are not unknown in cities, they are
largely rural ills while pollution, physical inactivity, social isolation and stress are
largely urban ills.
Hunger is a terrible and shameful problem – affecting almost a billion people the
world over. But despite continued population growth, the total number of affected
people has remained more or less stable since 1970,39 which means that in terms of
relative numbers, the portion of affected people has been reduced by more than half
during the past 40 years.
Infectious diseases like pneumonia, human immunodeficiency virus (HIV), diarrhea,
malaria and tuberculosis are still the dominant causes of death in many “developing”
countries, but non-communicable diseases such as cardiovascular maladies, cancer,
diabetes and chronic lung diseases are now responsible for almost two-thirds of all
the deaths in the world.40
Despite the fact that the data related to “urban” ills is incomplete, partly because
many of the health effects will take several years or even decades to become
manifest (the “slow murder” effect), there is little question that the number of people
affected by “urban” ills is rising fast. In fact, with half of the world’s population
living in cities today, it is not unlikely that more people are already affected by
modern “urban” ills than by traditional “rural” ills. And with the urban population in
“developing” countries expected to double from 2.6 billion in 2010 to 5.2 billion in
2050, while the rural population is expected to remain virtually stagnant,41 “urban”
ills will likely become more prevalent and cause more suffering than “rural” ills.
Motorized transportation, it is believed, is the single largest contributor to “urban”
ills.
16
3. Environmental harm
The environmental harm of bad mobility in cities ranges from local to global effects
and from limited to potentially catastrophic effects.
Gases and particulate matter from motorized transportation may cause or contribute
to the formation of smog and acid rain, overheating, water quality deterioration and
loss of fertile land, the obstruction of natural metabolism and eco-system damage,
heritage destruction, global warming and climate change.
The concentration of motorized transportation in cities increases the negative
environmental effects because more fuel is wasted and more pollution is created due
to traffic congestion, slow driving and frequent acceleration and braking.
3.1 Degradation of urban environments
The construction of infrastructure for motorized transportation, including roads,
railways and runways, may cause permanent damage to archaeological sites and
historical relics, architectural monuments and landscape heritage. These
infrastructures may also create physical barriers that disrupt local social tissues and
limit the availability of de-stressing natural environments and fertile land in and
around cities, thus further increasing the need for transportation (of food, for
example).
The proliferation of motorized transportation may also inhibit the growth of plants
and the spreading of wildlife, and may obstruct traditional and sustainable ways of
human living, in cities.
In addition, running motor engines, including air conditioning and cooling systems,
as well as the presence of asphalt, which attracts and absorbs the sun’s heat,
contribute significantly to the overheating in cities. Thus, the temperature in urban
17
areas can be several degrees higher than in surrounding areas. This is especially a
problem in warmer regions where urban dwellers – in any event, those who can
afford to do so – will consequently use more air conditioning, which will further add
to the problem, in a self-perpetuating cycle.
Overheating, congestion, pollution and the lack of nature may also cause people to
move to the suburbs, thus potentially increasing the demand for motorized
transportation.
Furthermore, motorized transportation contributes significantly to the formation of
smog, which occurs when large and concentrated amounts of air pollution (nitrogen
oxides and unburned hydrocarbons) interact with sunlight. Smog concentrates in
cities because of the high emissions of air pollutants and because buildings in cities
slow down the wind’s speed and thereby serve to reduce the dilution and removal of
pollutants.
Urban smog may last for several days. During this period, air pollutants at ground
level may reach harmful and even lethal concentrations.42
3.2 Destruction of eco-systems and loss of biodiversity
However, air pollution from cities may also affect surrounding areas, sometimes as
far as several hundred kilometers away, because the pollutants travel with the wind.
During this transfer in space, the primary pollutants, such as sulfur dioxide and
nitrogen oxides, are forming secondary pollutants such as nitric acid vapor, droplets
of sulfuric acid, and particles of acid-forming sulfate and nitrate salts, which
eventually fall on the earth as “acid rain”.43
Acid rain is a regional problem especially in areas that are located downwind from
large cities, where the effects may increase over the years as the soil’s natural
capacity to absorb acids gradually becomes depleted. And it may take many decades
for the soil to replenish nutrients.
18
Acid rain has a negative effect on eco-systems and destroys natural wildlife habitats,
thus contributing to the reduction of biodiversity. But it may also erode human
heritage sites and monuments, damage forests (“tree deaths”) and contaminate water
reservoirs, thus making this water unfit for drinking and even unfit for irrigation, and
may make the fish in the lakes and the rivers unfit for eating.44
Infrastructure for motorized transportation may further reduce the availability of
natural habitats and obstruct the free movement of wildlife.
3.3 Resource depletion
Due to the proliferation of motorized transportation in “developed” countries during
the 20th century and in “developing” countries during the early 21st century, we may
already have reached peak oil – a point from where oil production will become more
difficult or decline and from where prices of fuel and oil products can be expected to
rise. Meanwhile, if demands continue to grow, oil prices may not only continue to
rise but rise dramatically.
In addition to the exhaustion of non-renewable energy resources and the depletion of
certain natural materials, the proliferation of motorized transportation may also lead
to land and water shortages, not only in the areas directly affected by the
construction of new infrastructures but also in the areas affected by acid rain and
climate change, including rising sea levels and desertification.
3.4 Climate change In a study from NASA, “motor vehicles emerged as the greatest contributor to
atmospheric warming now and in the near term” – ahead of all other economic
sectors. 45
The International Energy Agency estimates that motorized transport already accounts
for around ¼ of energy-related CO2 emissions and that CO2 emissions from
motorized transport may increase more than 50 percent over the next 25 years. 46
19
These emissions are believed to cause global warming, which may result in extreme
weather conditions, rising sea levels, melting glaciers and desertification, also known
as “climate change”.
Motorized transportation in India presently only contributes 10 percent of the
country’s total CO2 emissions, compared to 30 percent in the United States, where
CO2 emissions from motorized transportation are, in any case, ten times higher than
in India.47 Therefore, in terms of climate change, there are other contributing factors
that deserve more attention in India. And there are other countries that have to do
much more when it comes to climate change mitigation. The most serious concerns
related to motorized transportation in Indian cities have to do with its negative
impact on the citizens’ health, on the local environment and on the potentials for
development.
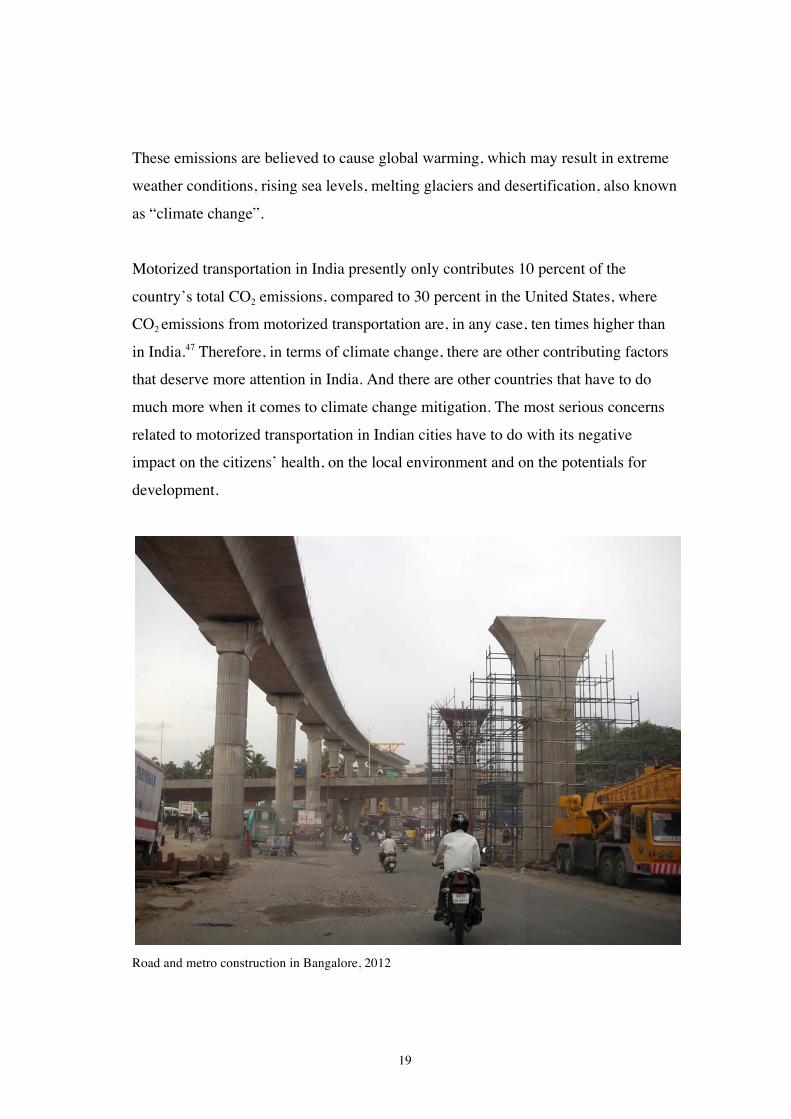
Road and metro construction in Bangalore, 2012
20
4. Development constraints
Mobility enables human interaction and the exchange of knowledge, innovations and
technologies, all of which are of crucial importance for development, but motorized
transportation in cities, especially when based on non-renewable energy sources,
may severely impede development by increasing expenditures, restricting
productivity, impairing cognitive development and depleting natural resources.
4.1 Expenditure The cost of treating traffic-related health problems puts a heavy burden on national
budgets and thus restricts government’s capacity to promote development.
In its 2009 report on road safety in South-East Asia, WHO set the costs of road
traffic injuries and fatalities in India alone at Rs. 550 billion (in the year 2000).48
A study from Harvard School of Public Health estimated the annual public health
costs related to traffic congestion in New York and Los Angeles at, respectively, 2.7
and 3.4 billion USD for the year 2010. This actually represents a reduction in costs
of more than 40 percent in these two cities when compared to analogous figures for
2000. The researchers explain this as the result of a shift to more fuel-efficient
vehicles and the increased use of cleaner fuels. They do, however, state that: “Our
estimates […] are likely conservative, in that they consider […] only the cost of
related mortality and not the costs that could be associated with related morbidity —
health care, insurance, accidents and other factors.” 49
In fact, recent studies indicate that traditional assessment methods are substantially
underestimating traffic-related health costs.50
21
Despite the uncertainty of the actual costs, there is no doubt that a large share of
national budgets, which could otherwise have been used to improve education, for
instance, are being spent on traffic-related health costs.
And while these costs may be dropping in “developed” countries, they may be rising
rapidly in “developing” countries due to the fast proliferation of motorized
transportation and the lack of adequate planning, management and regulations.
Still, the costs associated with environmental damage may be even higher.
4.2 Loss of productivity Traffic congestion, accidents and traffic-related diseases effectuate the loss of human
skills and talent, work capacity and innovation.
When people are stuck in traffic jams on the roads or are waiting for delayed flights,
trains and buses, they are largely unproductive, physically inactive and might even
be exposing themselves to harmful pollution.
To account for possible delays, people may allocate more (unproductive and
inactive) time than necessary for transportation or they may end up late for meetings,
classes and other appointments.
In addition to the waste of time and energy, there is the waste of lives. Most of the
people killed on the roads belong to the most productive segment of the population.51
Motorized transportation may also reduce productive land areas (agricultural land,
for instance) and street space, which many people in “developing” countries depend
on for their economic activities.
Furthermore, rushed and careless driving, fumes of blue and black smoke in the
streets, endless traffic jams and relentless honking combine to create an extremely

22
hostile environment in which few people want to live, let alone work, if they have a
choice. Current modes of transportation and traffic behavior in Indian cities may thus
discourage foreigners from settling there while encouraging locals, especially the
well educated, to move away.
In a global economy, brain drain and the lack of foreign investment may have
severely negative effects on development opportunities.
4.3 Reduced learning abilities
Various studies show that air pollution, noise, stress and physical inactivity have a
significantly negative effect on cognitive development.
A recent study from Denmark, which was intended to show the importance of
breakfast in relation to children’s learning abilities, revealed that breakfast doesn’t
make much difference. What really matter, the researchers found, are age, gender
and how the children get to school. If they transport themselves, by walking, running
or bicycling, their ability to concentrate, and thereby to learn, is significantly higher,
even several hours later, than if they are being driven to school.52
A Swedish study has previously shown the positive effects of exercise on learning
ability and memory among adults and that “boys who were most fit at the age of 18
were more likely to go to college than their less fit counterparts”.53
Reduced learning abilities will obviously have a negative effect on development
opportunities.
4.4 Environmental restraints
Motorized transportation contributes to the depletion of non-renewable resources,
both directly and indirectly, and to the decreasing availability of renewable
resources, such as water, forests and fertile land, through both excessive
consumption and degradation of these resources.
23
Resource scarcity may severely hamper development opportunities.
For instance, the limited availability of oil combined with increasing demand may
lead to higher oil prices. While this may be good for the environment, as it may
restrict motorized transportation, it may be bad for development, especially for the
poor, because so many products and technologies depend on oil today.
However, as a consequence of resource depletion and environmental degradation, the
world economy may be forced to move in a new direction. Future development
opportunities may therefore be seated in less resource demanding services, products
and technologies.
This includes services, products and technologies that are related to urban mobility.
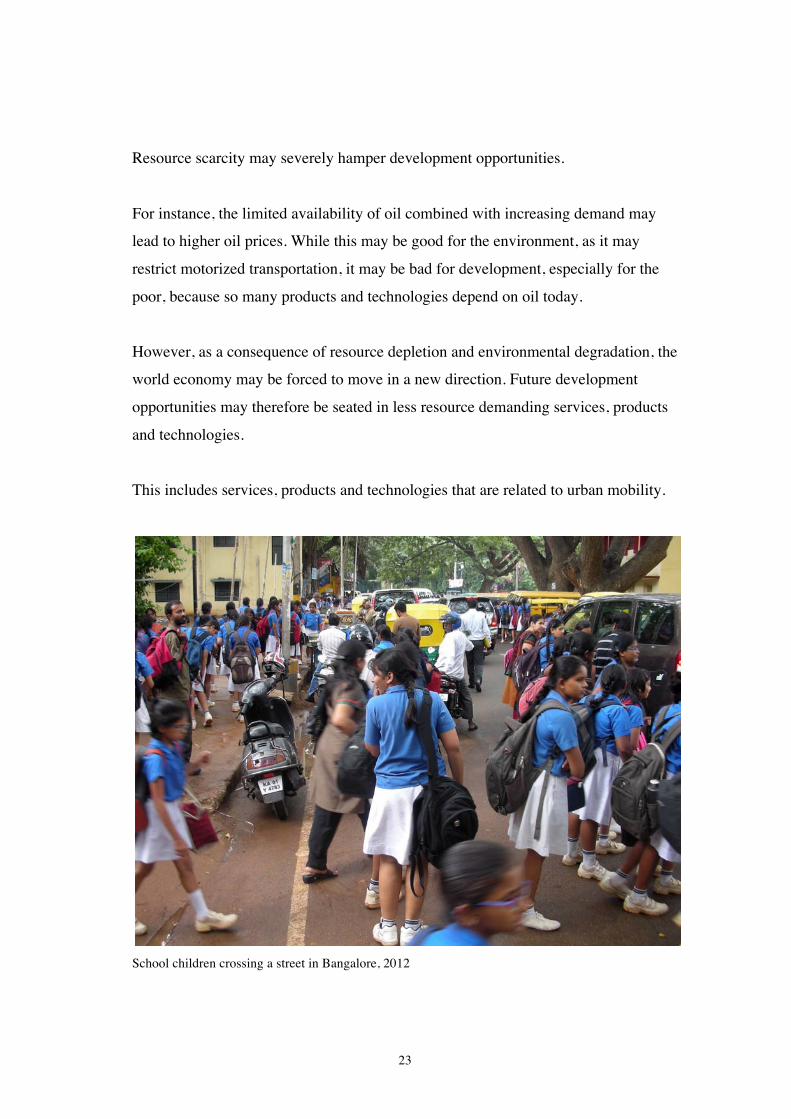
School children crossing a street in Bangalore, 2012
24
Notes
1 From 2010 – 2050, the world’s urban population is expected to grow from 3.6 to 6.3 billion. Ninety-
four percent of this growth is expected to take place in “developing” countries. Already in 2025, the
portion of the world’s urban population living in cities with less than half a million inhabitants will
have decreased from 51% to 42% while the portion living in megacities of more than ten million
inhabitants will have increased from 10% to 14%. Source: World Urbanization Prospects: The 2011
Revision; United Nations, Department of Economic and Social Affairs: http://esa.un.org/unup/CD-
ROM/Urban-Rural-Population.htm (accessed December 17, 2013) 2 The average road speed during rush hour in Delhi may reach 5 km/h by 2020, or five years earlier “if
the growing congestion on Delhi roads is not fixed on time.” Source: Growing congestion on Delhi
roads likely to reduce speeds to 5kmph; India Today; July 23, 2012:
http://indiatoday.intoday.in/story/get-ready-to-crawl-at-5kmph-in-delhi/1/209708.html
Meanwhile, the city of Sao Paulo recently reported a traffic jam that extended for 309 kilometers.
Source: São Paulo Had the Worst Traffic Jam in History; Folha de S. Paulo; November 15, 2013:
http://www1.folha.uol.com.br/internacional/en/saopaulo/2013/11/1371995-sao-paulo-had-the-worst-
traffic-jam-in-history.shtml
3 The world’s ten largest companies (by revenue): Royal Dutch Shell, Wal-Mart Stores, Exxon Mobil,
Sinopec Group, China National Petroleum, BP, State Grid (China’s government-owned power
company), Toyota Motor, Volkswagen and Total. Source: Global 500; CNN Money:
http://money.cnn.com/magazines/fortune/global500/2013/full_list/ (accessed January 21, 2014) 4 Source: Motor vehicle; Wikipedia: http://en.wikipedia.org/wiki/Motor_vehicle (accessed December
18, 2013) 5 In Delhi alone, more than one thousand new motor vehicles have been registered every single day
during the past decade. Numbers retrieved from: Road Transport Year Book (2009-10 & 2010-11);
Ministry of Road Transport & Highways, Government of India; July 2012 6 Source: India will have 450 million cars 20 years from now; Times of India; January 29, 2011:
http://www.timescrest.com/coverstory/india-will-have-450-million-cars-20-years-from-now-4645
7 The population of Indian cities is expected to grow from 379 million in 2010 to 606 million in 2030.
Source: World Urbanization Prospects: The 2011 Revision; United Nations, Department of Economic
and Social Affairs: http://esa.un.org/unup/CD-ROM/Urban-Rural-Population.htm (accessed March
15, 2014) 8 Sources: Global status report on road safety; World Health Organization; 2009 and The top ten
causes of death; World Health Organization:
http://www.who.int/mediacentre/factsheets/fs310/en/index.html (accessed January 21, 2014)
25
9 Source: List of countries by traffic-related death rate; Wikipedia:
http://en.wikipedia.org/wiki/List_of_countries_by_traffic-related_death_rate (accessed December 18,
2013) 10 Source: Road accidents in India; Ministry of Road Transport & Highways, Government of India;
2011 11 Source: List of countries by vehicles per capita; Wikipedia:
http://en.wikipedia.org/wiki/List_of_countries_by_vehicles_per_capita (accessed December 18, 2013)
12 Two-wheelers account for 22% of all road traffic deaths in India while pedestrians account for 13%;
cyclists account for 4%; and people travelling with auto rickshaws account for 6%. Source: Regional
Report on Status of Road Safety: the South-East Asia Region; World Health Organization; 2009 13 Quoted from: Slow murder: the deadly story of vehicular pollution in India; Anju Sharma and
Anumita Roychowdhury, Centre for Science and Environment; 1996 14 Source: The top 10 causes of death; World Health Organization:
http://www.who.int/mediacentre/factsheets/fs310/en/ (accessed December 18, 2013) 15 Source: Bronchial asthma; World Health Organization:
http://www.who.int/mediacentre/factsheets/fs206/en/ (accessed December 18, 2013) 16 Source: Ibid. 17 For an overview of adverse health effects associated with air pollution, see: Air pollution, Health
effects; Wikipedia: http://en.wikipedia.org/wiki/Air_pollution#Health_effects (accessed December 18,
2013) 18 Source: Who is affected by air pollution?; New South Wales Government:
http://www.health.nsw.gov.au/environment/air/Pages/who-is-affected.aspx (accessed December 18,
2013)
19 Source: Database: outdoor air pollution in cities; World Health Organization:
http://www.who.int/phe/health_topics/outdoorair/databases/en/ (accessed December 18, 2013). The
maximum level of particulate matter (PM10) in the air recommended by W.H.O. is 20 ug/m3. In
India, the maximum recommended level is 60 ug/m3. 20 Quoted from: Gasping for fresh air; Television for Education – Asia Pacific and Centre for Science
and Environment; April 27, 2011: http://www.tveap.org/?q=1104qca_pn.php 21 Source: W.H.O. Declares Diesel Fumes Cause Lung Cancer; New York Times; June 12, 2012:
http://www.nytimes.com/2012/06/13/health/diesel-fumes-cause-lung-cancer-who-says.html
22 Source: Gasping for fresh air; Television for Education – Asia Pacific and Centre for Science and
Environment; April 27, 2011: http://www.tveap.org/?q=1104qca_pn.php 23 Source: Environmental health inequalities in Europe; World Health Organization; 2012
26
24 For an overview of adverse health effects associated with noise pollution, see: Health effects from
noise; Wikipedia: http://en.wikipedia.org/wiki/Health_effects_from_noise (accessed December 18,
2013) 25 Based on own observations in Indian cities, 2010-13 26 For an overview of chronic stress, see: Chronic stress; Wikipedia:
http://en.wikipedia.org/wiki/Chronic_stress (accessed December 19, 2013) 27 For an overview of the adverse effects of acute and chronic stress on memory and learning abilities,
see: Effects of stress on memory; Wikipedia:
http://en.wikipedia.org/wiki/Effects_of_stress_on_memory#Chronic_stress (accessed December 19,
2013) 28 People may choose not to play, to walk or to cycle in cities because of the risks posed by motorized
transportation and because spaces for these activities have been taken over by motorized
transportation. 29 For an overview of the positive health effects brought about by physical activity, see: Physical
activity, Health effects; Wikipedia: http://en.wikipedia.org/wiki/Physical_exercise#Health_effects
(accessed December 19, 2013) 30 The definition of overweight is a Body Mass Index above 25. For obesity, it is above 30. 31 Quoted from: Obesity and overweight; World Health Organization:
http://www.who.int/mediacentre/factsheets/fs311/en/ (accessed December 19, 2013) 32 There are 30 million overweight children (under the age of five) in “developing” countries and 10
million in “developed” countries. Source: Ibid. 33 Source: Physical Activity; The Lancet, July 18, 2012: http://www.thelancet.com/series/physical-
activity 34 For an overview of adverse health effects associated with obesity, see: Obesity, Effects on health;
Wikipedia: http://en.wikipedia.org/wiki/Obesity#Effects_on_health (accessed December 19, 2013) 35 Source: Fat Oxidation, Fitness and Skeletal Muscle Expression of Oxidative/Lipid Metabolism
Genes in South Asians: Implications for Insulin Resistance?; Lesley M. L. Hall, Colin N. Moran,
Gillian R. Milne, et al.; 2010 36 For an overview of diabetes type 2, see: Diabetes mellitus type 2; Wikipedia:
http://en.wikipedia.org/wiki/Diabetes_mellitus_type_2 (accessed December 19, 2013) 37 An estimated 17.5% of the Indian population, corresponding to about 215 million people, suffered
from undernourishment in the period from 2010-12. Source: Global Hunger Index - The Challenge of
Hunger: Building Resilience to Achieve Food and Nutrition Security; International Food Policy
Research Institute; 2013. 65 million Indians are believed to suffer from diabetes, as compared to 98
million people afflicted with diabetes in China. The number of Indians with diabetes is expected to
27
rise to over 100 million by the year 2035. Source: Diabetes Atlas 6th edition; International Diabetes
Federation: http://www.idf.org/atlasmap/atlasmap (accessed December 19, 2013) 38 An estimated 347 (uncertainty interval 314–382) million adults had diabetes in 2008. Of these,
about 138 million were from China and India. Source: National, regional, and global trends in fasting
plasma glucose and diabetes prevalence since 1980: systematic analysis of health examination
surveys and epidemiological studies with 370 country-years and 2.7 million participants; G. Danaei,
M.M. Finucane, Y. Lu, G.M. Singh, M.J. Cowan, C.J. Paciorek et al.; 2011. “Type 2 diabetes
comprises 90% of people with diabetes around the world.” Quoted from: Diabetes, Fact sheet N°312;
World Health Organization: http://www.who.int/mediacentre/factsheets/fs312/en/ (accessed January
22, 2014) 39 Source: More people than ever are victims of hunger; Food and Agriculture Organization of the
United Nations; 2009 40 In 2000, non-communicable diseases were responsible for 60% of all deaths in the world. By 2011,
this number had risen to 65% (36 out of 55 million). Cardiovascular diseases alone were responsible
for 31% of all deaths in 2011. Source: Top 10 causes of death; World Health Organization:
http://www.who.int/mediacentre/factsheets/fs310/en/index2.html (accessed January 22, 2014) 41 Source: Population Distribution, Urbanization, Internal Migration and Development: An
International Perspective; United Nations, Department of Economic and Social Affairs Population
Division; 2011 42 The Great Smog of London in 1952 exemplifies just how lethal smog can be. Over the course of
just four days of intense smog, mostly caused by the use of coal, an estimated 12,000 people are
believed to have died prematurely. Source: Great Smog; Wikipedia;
http://en.wikipedia.org/wiki/Great_Smog (accessed December 20, 2013) 43 For an overview of acid rain, see: Acid rain; Wikipedia; http://en.wikipedia.org/wiki/Acid_rain
(accessed December 20, 2013) 44 An example of the negative effects of acid rain on eco-systems and natural wildlife are the lakes of
Ontario, Canada. In the 1970s and 1980s, fish were disappearing from hundreds of these lakes, many
of which remain fishless to this day because acid rain made the fish incapable of reproduction. And
people were warned not to consume the remaining fish because of high levels of toxic chemicals. The
lakes are located downwind from the North American Rustbelt, which, at the time, was home to some
of the world’s most polluting industries (including the world’s car manufacturing capital, Detroit). 45 Quoted from: Road Transportation Emerges as Key Driver of Warming in New Analysis from
NASA; NASA: http://www.nasa.gov/topics/earth/features/road-transportation.html (accessed
December 20, 2013) 46 Source: Transport, Energy and CO2: Moving toward Sustainability; International Energy Agency;
2009
28
47 Source: CO2 emissions from fuel combustion; International Energy Agency; 2012 48 Source: Regional Report on Status of Road Safety: the South-East Asia Region; World Health
Organization; 2009 49 Quoted from: Evaluation of the public health impacts of traffic congestion: a health risk
assessment; Jonathan I. Levy, Jonathan J. Buonocore and Katherine von Stackelberg; 2010 50 For example: “Traditional risk assessment methods underestimate both the burden of disease and
cost of asthma associated with air pollution, and these costs are borne disproportionately by
communities with higher than average traffic-related pollution”. Quoted from: Costs of childhood
asthma due to traffic-related pollution in two California communities; Sylvia Brandt et al., 2012 51 “Most of the people killed on the roads [in the South-East Asia Region] are young and aged
between 15 and 44 years, which corresponds to the most economically productive segment of the
population.” Quoted from: Regional Report on Status of Road Safety: the South-East Asia Region;
World Health Organization; 2009 52 Source: ‘Bilbørn’ lærer mindre i skolen; Politiken; November 23, 2012:
http://politiken.dk/tjek/sundhedogmotion/motion/ECE1819013/bilboern-laerer-mindre-i-skolen/ (in
Danish) 53 Quoted from: Sweden-US: Fit teenage boys are smarter; University World News, December 13,
2009: http://www.universityworldnews.com/article.php?story=20091211082741477


