
The impacts of long term CO2 objectives on short term transportation trends in the European Union
Frédéric Ghersi
Simon McDonnell
Reprint from Energy for Sustainable Development 11 (3): 38-48

2
3
The impacts of long term CO2 objectives on short term transportation trends in the European Union*
Frédéric Ghersi**
Simon McDonnell***
Abstract
In 2001, the Sustainable Development Strategy was formulated by the Euro-
pean Union and, for the first time, a framework aimed at incorporating meth-
ods of sustainable development into European policymaking was adopted. In
2004, the European Union launched a review of the strategy and it has since
been strengthened in a renewed strategy launched in 2006. Central to the re-
newed strategy is a commitment to cap global temperature rises to 2oC over
pre-industrial levels by the end of this century. The EU has recently agreed on
a target of reducing greenhouse gases by between 60 and 80% by 2050 in or-
der to achieve this goal. There has been little research on how the achievement
of such a target would impact on European transportation trends. Given the
new policy reality, this research develops projections simulating the impact of
such a long term target on road transportation growth in the European Union,
and assesses how much of specific transport interim transport targets are im-
plied by the presence of this long term target. The projections are based on
harmonised energy-economy simulations of the IMACLIM-R and POLES mo-
dels. They cover the EU-27 disaggregated into 23 zones and track emissions of
CO2 for a range of vehicles and technologies. The results indicate that while
mobility trends are only marginally altered by the presence of a stringent cli-
* The authors gratefully acknowledge funding by the European Commission under the TranSust Project, together with comments and help by both the POLES and the IMACLIM-R modelling teams (in particular Renaud Crassousfor IMACLIM, and Silvana Mima and Alban Kitous for POLES), and Gautam Dutt, editor of this special issue. ** PREG-X, 1, rue Descartes, 75005 Paris. [email protected]. *** School of Geography, Planning and Environmental Policy, UCD, Dublin, Ireland.
4
mate change mitigation policy, energy efficiency in transport is improved sig-
nificantly. However, we also find that the presence of an overarching climate
change objective is not enough to guarantee meeting a number of interim
transportation sub-targets.
Introduction
In 2001, the European Union published two important documents relating to
transportation and sustainability on the continent. The first, a White Paper on
Transport, investigated the trends in transport for the coming decade and pro-
posed a number of policy packages. The second document, the Sustainable
Development Strategy (SDS), established for the first time the EU policy on
sustainability—an issue that has moved towards the centre of policy-making.
Both documents have recently been reviewed and the commitments provided
for in each have been reaffirmed by European policy-makers. While the White
Paper on Transport has received considerable attention from policy-makers
and researchers, relatively little academic focus has centred on the impact of
the SDS on transportation trends in the European Union This is particularly
interesting given that the overriding environmental objective outlined in the
SDS is to cap the increase in global temperature rise to no more than 2°C
above pre-industrial levels by the end of this century. In order to achieve this
goal, the European Union has committed itself to a stringent interim target of
reduction in carbon dioxide (CO2) emissions by 2050. This objective aims to
reduce emissions from the EU by between 60% and 80% compared to 1990
levels (CEU, 2007). It is clear that the pursuit and achievement of such a tar-
get will impact on future trends in European transportation.
Accordingly, in this paper, we investigate the impact of the overall objective
of reducing CO2 emissions by between 60 and 80% by 2050 on the more fo-
cused transportation objectives outlined in the SDS. To do this, we compare
the state and trends of European transportation up to 2050 in a business-as-
usual or reference scenario, and in an ambitious carbon pricing scenario com-
patible with the proposed 2ºC cap on temperature increase. Both scenarios are
harmonised projections of the global dynamic recursive computable general
equilibrium model IMACLIM-R, and of the POLES model of global energy
markets, thereby guaranteeing full consistency between the macroeconomic
5
and energy balances. We explore whether reaching the ambitious target of a
60% to 80% reduction in CO2 by 2050 “dominates” other targets specifically
related to the transport sphere. In other words, we assess if by achieving this
ambitious CO2 reduction target by mid century, sub-targets related to transport
outlined in the SDS will be, almost by definition, achieved or even overshot.
The outline of the paper is as follows: section 1 presents some key transporta-
tion trends in the European Union as it stands, outlines some of the problems
associated with transport, and investigates some of the policy responses pur-
sued by European policy-makers. Section 2 briefly reviews the SDS, paying
particular attention to its role in relation to transport. Section 3 presents an
overview of the IMACLIM-R and POLES models and reports key assumptions
and general results of the baseline and policy projections. Section 4 tests the
hypothesis outlined above. Finally, section 6 concludes with some policy ob-
servations.
I. Transportation trends in the European Union
The demand for transportation in Europe has been growing rapidly in recent
decades and that trend largely continues today. This has had a significant im-
pact on Europe’s consumption of oil and the resulting emissions of greenhouse
gases and specifically CO2. Personal mobility on the continent now averages
35 km a day—doubling since 1970 (CEC, 2006). Meanwhile, the number of
cars in the EU has tripled and we are witnessing a growth rate in the region of
3 million cars a year (CEC, 2001a). These trends have manifested themselves
in significant growth in road transportation demand—between 1995 and 2004
road transportation grew by 19% for passenger cars and by 35% for freight
movements (measured by passenger-kilometres and tonne kilometres respec-
tively). The road transportation sector now accounts for 44% of total freight
transport and almost 85% of total passenger transport. With regard to the latter
area, the private car accounts for three-quarters of passenger transport while
transport by bus and coach (long-distance bus) combined accounts for less
than 10% (these latter modes have grown by a modest 5% over the last dec-
ade). Rail transport has continued to decline in importance and now only ac-
counts for 10% of freight transport and 7% of total passenger transport. As a
result of such trends, private cars account for more than half of all oil con-
6
sumed by transport. Emissions from transport contributed 28% of all CO2
emissions in Europe—one of the fastest-growing sectors. With road transpor-
tation heavily dependent on oil (it accounts for 67% of final European demand
for oil), it alone accounts for almost 85% of CO2 emissions from transport
(CEC, 2006). In tandem with environmental concerns, security of supply is-
sues and institutional changes within the EU, transportation has moved onto
the European policy agenda over the last two decades.1
The European Commission (EC)’s first White Paper on Transport (CEC, 1992)
focused on the achievement of a single market in transport rather than on sus-
tainability issues. However, it did characterise the problems arising from ex-
cessive growth in road transport demand, through linking unequal modal share
development to increased congestion and harmful environmental effects. The
related White Paper on Growth, Competitiveness and Employment (CEC,
1993) warned about the dangers of congestion impacting negatively on pro-
ductivity. Such negative impacts can occur because of the nature of conges-
tion. It can be defined in some respects as excessive demand and can occur
because once road tax is paid, every user has access to the road network at all
times (with the exception of tolled roads). As usage of the road network in-
creases, so typically do marginal costs associated with road transportation. The
costs of transport are not restricted to users of the infrastructure. Indeed, the
external costs of road traffic congestion 2 alone can amount to 0.5% of EU
gross domestic product (GDP) and traffic forecasts for the next decade indi-
cate that in the absence of policy interventions, road congestion will increase
significantly by 2010. These congestion costs will also increase by 142% to
reach 80 billion euros a year, which is approximately 1% of the EU’s GDP
(CEC, 2001a). In addition to traffic congestion, the external costs of transport
include accidents, road damage externalities and environmental costs. The lat-
ter costs consist of regional environmental effects (including barrier effects,3
acidification and noise; for more see Sterner, 2003) and air pollution (with
both local and global impacts).
1 Cf. http://www.europarl.europa.eu/facts/4_5_1_en.htm (accessed 1 July 2007). 2 Congestion occurs because the motorist’s private marginal costs diverge from the cost he/she imposes on society. The externalities can manifest themselves as delays in business transactions, excess business and private time lost to congestion, etc. 3 For instance: severance impacts on ecosystems or communities arising from the construction of a motorway.

7
The economic problem of traffic congestion is related to the ‘public good’ na-
ture of road space (i.e., restricting access to it is difficult). However, road
space is in reality rarely a ‘pure’ public good—beyond a certain point of de-
mand, congestion and rivalry exist. As road usage levels increase, the non-
excludable nature of the public good exerts itself and as one user ‘consumes’
the road space, it impacts on the ability of other road users to do the same—
congestion increases and the utility derived by each user is a decreasing func-
tion of the number of other users. As more users demand the limited space, the
social marginal cost (the additional costs to society) diverges from a user’s
private marginal cost. The former includes the sum of the time costs caused by
the delays that the motorist imposes on all other road users (motorist and non-
motorist alike). The latter only includes fuel and vehicle-related costs plus the
motorist’s own time and other costs. The social marginal costs also include the
environmental external costs, notably air pollution and greenhouse gas (GHG)
emissions, which increase as congestion intensifies. This latter point is espe-
cially relevant given European commitments to the Kyoto Protocol and other
initiatives to reduce GHG emissions. Transport-related GHG emissions have
increased significantly and domestic transport now accounts for 21% of GHG
emissions (CEC, 2006a). As a result of increasing emissions from transport
sources (up by 23% since 1990; CEC, 2006a), many countries are now strug-
gling to meet their commitments to adhere to agreed Kyoto Protocol limits.4
Consequently, the focus of European policy-makers in the area of transporta-
tion has widened from a primarily economic analysis (as per the White Paper
of 1992) to encompass the other main spheres of sustainability, namely the
environmental and social areas. This has been mirrored in the development of
the White Papers. This recognition that transportation impacts on areas beyond
the movement of people and goods (because of the aforementioned external-
ities), has allowed for the development of policy objectives aimed at address-
ing the aforementioned sustainability questions.
As noted, the first comprehensive policy intervention in transportation by the
EC focused primarily on economic issues related to the movement of goods
4 The treaty, signed by more than 165 countries and ratified in February 2005, commits the coun-tries listed in its Annex 1 to an overall 5.2% reduction on 1990 levels by 2008-2012, cf. http://unfccc.int/essential_background/kyoto_protocol/status_of_ratification/items/2613.php (accessed 17 June 2007). The EU ratified the treaty in May 2001, committing itself to an 8% reduction over the period.
8
and people (CEC, 1992). The follow-up policy document in 2001 outlined a
number of key objectives for transportation in Europe:
• To offer a high level of mobility to people and businesses throughout
the EU;
• To protect the environment, ensure energy security, promote minimum
labour standards for the sector and protect the passenger and the citizen;
• To allow for innovation in support of the first two aims by increasing
the efficiency and sustainability of the transport sector;
• To connect internationally by projecting the EU’s policies to reinforce
sustainable mobility, protection and innovation (CEC, 2006).
In addition, 60 EU-level specific measures are outlined covering 13 areas. The
time horizon of this strategy extends to 2010 and the mid-term review of the
White Paper (CEC, 2006) notes the above objectives put the EU’s transport
policy at the heart of the Lisbon agenda for growth and jobs (this strategy also
forwarded projections to 2020). 5 Longer term objectives in relation to balanc-
ing “the imperatives of economic growth, social welfare and environmental
protection in all policy choices” are referred to in the White Paper. However,
specific long-term policy outcomes are beyond the scope of the strategy. Con-
sequently, while the inter-relations between transport and other areas in the
economic, environmental and social spheres are alluded to, we must look to-
wards the SDS (CEC, 2001b) for specific longer-term objectives aimed at ad-
dressing climate change directly.
5 In 2006 the EU published a mid-term review of the White Paper on European Transport Policy for 2010 (CEC, 2006). As part of this review, Transport and Mobility in the Catholic University of Leuven developed scenarios to run its TREMOVE model on. This had two aims: firstly to assess the conformance of the transport implementation activities with the original White Paper over the period 2001-2005; secondly, to assess whether the objectives were still feasible given policy and trend developments. An analysis of these 60 objectives is beyond the scope of this research but interested readers are directed to Annex 1 of the 2001 White Paper on Transport (CEC, 2001a): http://ec.europa.eu/transport/white_paper/documents/doc/lb_texte_complet_en.pdf
9
II. The European Union Sustainable Development Strategy
The issue of sustainability has moved towards the centre of European policy-
making in the past two decades. The initial stimulus in this process was the
foundation and reporting of the World Commission on Environment and De-
velopment—the ‘Bruntland Commission’—in 1987 (UN, 1987). Its definition
of sustainability—development is said to be “sustainable” if it meets the needs
of the present without compromising the ability of future generations to meet
their own needs—is the most frequently used one. The Bruntland Commission
was followed by the United Nations Conference on Environment and Devel-
opment (UNCED) in Rio de Janeiro, Brazil in 1992. This conference adopted
Agenda 21, otherwise known as the Rio Declaration on Environment and De-
velopment. This spurred interest at a European level, and the process of incor-
porating sustainability into EU policy-making began with the European Coun-
cil discussing A Sustainable Europe for a Better World: A European Strategy
for Sustainable Development (CEC, 2001b). This was proposed by the Euro-
pean Commission at the Gothenburg Council meeting of 2001 and was adopted
as the SDS.
Initially a broad statement of intention recognising the relationship between
long-term economic growth, social cohesion and environmental protection, the
strategy was reviewed, and specific targets updated and developed. 6 The re-
launch by the European Council in 2006 resulted from a review process that
began in 2004 involving the EC, the European Parliament and the European
Economic and Social Council. The EC presented a document for review at the
end of 2005 establishing a framework for action on sustainability (CEC,
2005). The European Council adopted this as a basis for the renewed strategy
in June 2006 (CEU, 2006). The renewed strategy aims to implement a coherent
long-term strategy in relation to sustainable development, and places emphasis
both on immediate problems and also on longer-term objectives. In the sphere
of climate change and clean energy, it states the absolute target of a 15-30%
6 A global dimension has also been added to the policy-making process with the adoption of the 2002 strategy on establishing a global partnership in sustainable development (CEC, 2002): http://europa.eu/eur-lex/en/com/cnc/2002/com2002_0082en01.pdf
10
reduction over 1990 CO2 emission levels by 2020.7 It also defines the 2°C cap
on temperature increases over the century compared to pre-industrial levels—
subsequently translated into an EU objective of 60% to 80% reduction over
1990 levels in 2050 by the European Council (CEU, 2007). The overall trans-
portation objective is identified as ensuring that transport systems meet soci-
ety’s economic, social and environmental needs whilst minimising negative
transport-related externalities in these areas. The following sub-targets are
identified as, inter alia:
• Decoupling economic growth and the demand for transport with the aim
of reducing environmental impact;
• Achieving sustainable levels of transport energy use and reducing
transport GHG emissions;
• Reducing pollutant emissions from transport and their impact on human
health;
• Achieving a balanced shift towards environmentally friendly transport
modes (this has already been formulated as a return to 1998 modal
shares by 2010);
• Reducing CO2 emission from light duty vehicle to 120g/km by 2012.
Given the short time horizon between the original SDS and the renewed strat-
egy, it is interesting to note the flexibility in target formulation and develop-
ment. In the intervening period, a number of these targets were altered, reveal-
ing flexibility in the policy process. However despite this, neither the strategy
nor the related transport white papers explore how the achievement of the
long-term climate change goal will impact on these shorter-term transportation
targets. While some targets have broad interpretations so as to be able to in-
corporate the impacts of the long-term targets, others are more specific. This
juxtaposition between the short-term sub-targets in EU policy-making related
to transportation and the long-term climate change objectives develops into an
interesting story for researchers. We investigate this relationship by develop-
ing a number of policy scenarios aimed at exploring the impact of achieving
7 This strengthened the commitment in the original SDS, outlined in relative terms only: to re-duce atmospheric greenhouse gas emissions by an average of 1% of 1990 levels per year up to 2020.
11
the ultimate climate change aim of a 60-80% reduction in CO2 emissions by
2050 on transport sub-targets.
III. Scenario Development
The baseline and the policy scenario that allow us to test our research hy-
pothesis are based on harmonised projections of the IMACLIM-R and POLES
models. These are outlined below.
III.1. IMACLIM-R Model
IMACLIM-R (IMpact Assessment of CLIMate policies-Recursive version) is a
dynamic recursive computable general equilibrium model specifically built to
interface with bottom-up expertise on energy systems (Crassous et al., 2006).
The version that produced the scenarios commented upon in this paper projects
the world economy every year up to 2050. It details 12 world regions, includ-
ing Europe,8 and 12 economic sectors, among which air, sea, and land trans-
portation activities are defined as three distinct sectors. In IMACLIM-R, eco-
nomic growth mainly results from exogenous assumptions about population
and labour productivity dynamics. However, international trade, particularly
that of energy commodities, and imperfect markets for both labour (wage
curve) and capital (constrained capital flows, varying utilisation rates), signifi-
cantly impact on the equilibrium growth resulting from these assumption. In
this general framework, transportation demands result from the following.
• Intermediate consumption of transport by all sectors: the three transpor-
tation activities are inputs into the 12 sectors detailed. They consecu-
tively grow as the sectors expand, in a proportion depending on price-
induced variations in each sector’s transportation intensity. For the sce-
narios reported here these variations were calibrated on POLES results.
• Household demand: This has an elaborate specification. Mobility, de-
fined as an aggregate of four imperfectly substitutable travelling modes
8 40-plus countries of geographical Europe, not the EU strictly speaking.
12
(air travel, public terrestrial modes, personal cars and non motorised
modes), is one of the elements of the utility function of the representa-
tive household of each region. In addition, on top of their budget con-
straint, households are subject to a travelling-time constraint.9 Last but
not least, the ‘travelling time efficiency’ (average distance covered in
an hour of time) of each mode is described as an increasing function of
public investment in the infrastructure dedicated to this mode.
III.2. POLES Model
The POLES (Prospective Outlook on Long Term Energy Systems) model pro-
jects the energy systems and markets of a 47-zone world every year up to a
2050 horizon, based on main assumptions of GDP and population growth (Cri-
qui, 2001). The supply side of energy markets consists of fully endogenous
world and regional markets for oil, coal and gas,10 together with a comprehen-
sive description of current and future electricity-producing technologies. En-
ergy demand is broadly disaggregated among transportation, industry, residen-
tial and service usages. Each of these categories is in turn disaggregated in
sub-activities, with varying levels of technological detail. Road transportation
is distinguished between passenger and freight transport. Passenger transport
is split between personal cars, motorcycles and bus; the corresponding passen-
ger-kilometres (pkm) demands are projected following an econometric specifi-
cation (the trend modified by per capita income and short- and long-term av-
erage fuel price elasticities, with asymmetrical elasticities to price increases
and decreases) without explicit modal substitution. Vintages of six personal
car technologies are represented, with their dynamics based on the endogenous
relative prices of fuels and exogenous assumptions about vehicle costs and
fuel efficiency, Operation and Maintenance (O&M) expenses, a discount rate
and limits to the penetration rates. As regards freight, the tonne-kilometre
9 Following ‘Zahavi’s law’, establishing that the daily time spent in transportation is quite stable across time and regions of the world, regardless of the transportation mode—and hence of the distance covered. 10 Fossil fuel production is simulated by a detailed discovery-process model for the main produc-ing countries and a more compact model for the minor ones. Production is maximum for all re-gions (‘fatal’ producers) except major producers (e.g., the OPEC for oil), which adjust their own production to cover excess demand. The reserves to production ratio of major producers drives the international prices.
13
(tkm) demand of road freight transport is projected following an econometric
specification with total GDP and short- and long-term fuel price elasticities as
arguments.
III.3. Modelling Carbon Policies
In the aggregate economic framework of both IMACLIM-R and POLES, the
complex mix of policy tools aiming at curving carbon emissions (ranging from
market instruments to command and control measures, on varying geographi-
cal scales) is usually symbolised by a region-specific uniform carbon pricing.
This pricing is introduced in the form of an excise tax, with the carbon content
of each specific energy consumption as a basis; in both the harmonised runs
developed for this research, the revenue raised is ‘lump-sum recycled’, i.e.
directly transferred to households—aggregated to their labour and capital reve-
nues to define their budget constraint.
Although both models can be used to assess more subtle policy and revenue
recycling options, this fairly standard policy perspective, summed up by its
carbon pricing, allows for a ready comparison with other modelling exercises
(see e.g. Weyant and Hill, 1999, or IPCC, 2001, for frequently-quoted surveys
of modelling results expressed in such terms).
III.4. Scenario Development
Harmonised runs of the two models were developed through a ‘soft-linking’
approach, that is an iterative running with back-and-forth exchanges of model-
ling outputs—the only assumption common to both models, total population,
having been identically matched to the 2004 median projection of the UN. In a
nutshell, the successive IMACLIM-R runs were made to exploit POLES’ ex-
pertise on energy matters (e.g. fundamental trends on primary energy markets,
energy intensities and mixes for the different sectors and households, etc.).
The successive POLES runs themselves resorted to the updated GDP and sec-
toral outputs (the latter being used as activity indicators) computed by
IMACLIM-R. The complementary nature of the two models allowed for reach-
ing a satisfactory degree of convergence quite rapidly.
14
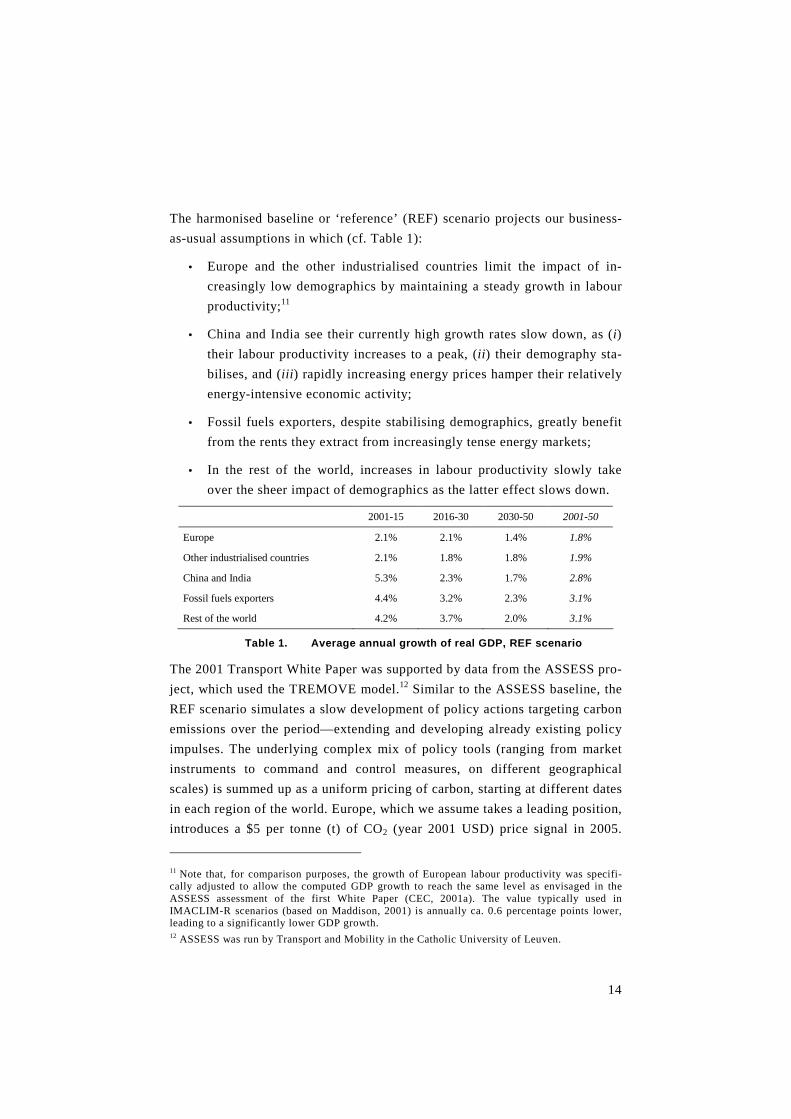
The harmonised baseline or ‘reference’ (REF) scenario projects our business-
as-usual assumptions in which (cf. Table 1):
• Europe and the other industrialised countries limit the impact of in-
creasingly low demographics by maintaining a steady growth in labour
productivity;11
• China and India see their currently high growth rates slow down, as (i)
their labour productivity increases to a peak, (ii ) their demography sta-
bilises, and (iii ) rapidly increasing energy prices hamper their relatively
energy-intensive economic activity;
• Fossil fuels exporters, despite stabilising demographics, greatly benefit
from the rents they extract from increasingly tense energy markets;
• In the rest of the world, increases in labour productivity slowly take
over the sheer impact of demographics as the latter effect slows down.
2001-15 2016-30 2030-50 2001-50
Europe 2.1% 2.1% 1.4% 1.8%
Other industrialised countries 2.1% 1.8% 1.8% 1.9%
China and India 5.3% 2.3% 1.7% 2.8%
Fossil fuels exporters 4.4% 3.2% 2.3% 3.1%
Rest of the world 4.2% 3.7% 2.0% 3.1%
Table 1. Average annual growth of real GDP, REF scenario
The 2001 Transport White Paper was supported by data from the ASSESS pro-
ject, which used the TREMOVE model.12 Similar to the ASSESS baseline, the
REF scenario simulates a slow development of policy actions targeting carbon
emissions over the period—extending and developing already existing policy
impulses. The underlying complex mix of policy tools (ranging from market
instruments to command and control measures, on different geographical
scales) is summed up as a uniform pricing of carbon, starting at different dates
in each region of the world. Europe, which we assume takes a leading position,
introduces a $5 per tonne (t) of CO2 (year 2001 USD) price signal in 2005.
11 Note that, for comparison purposes, the growth of European labour productivity was specifi-cally adjusted to allow the computed GDP growth to reach the same level as envisaged in the ASSESS assessment of the first White Paper (CEC, 2001a). The value typically used in IMACLIM-R scenarios (based on Maddison, 2001) is annually ca. 0.6 percentage points lower, leading to a significantly lower GDP growth. 12 ASSESS was run by Transport and Mobility in the Catholic University of Leuven.
15
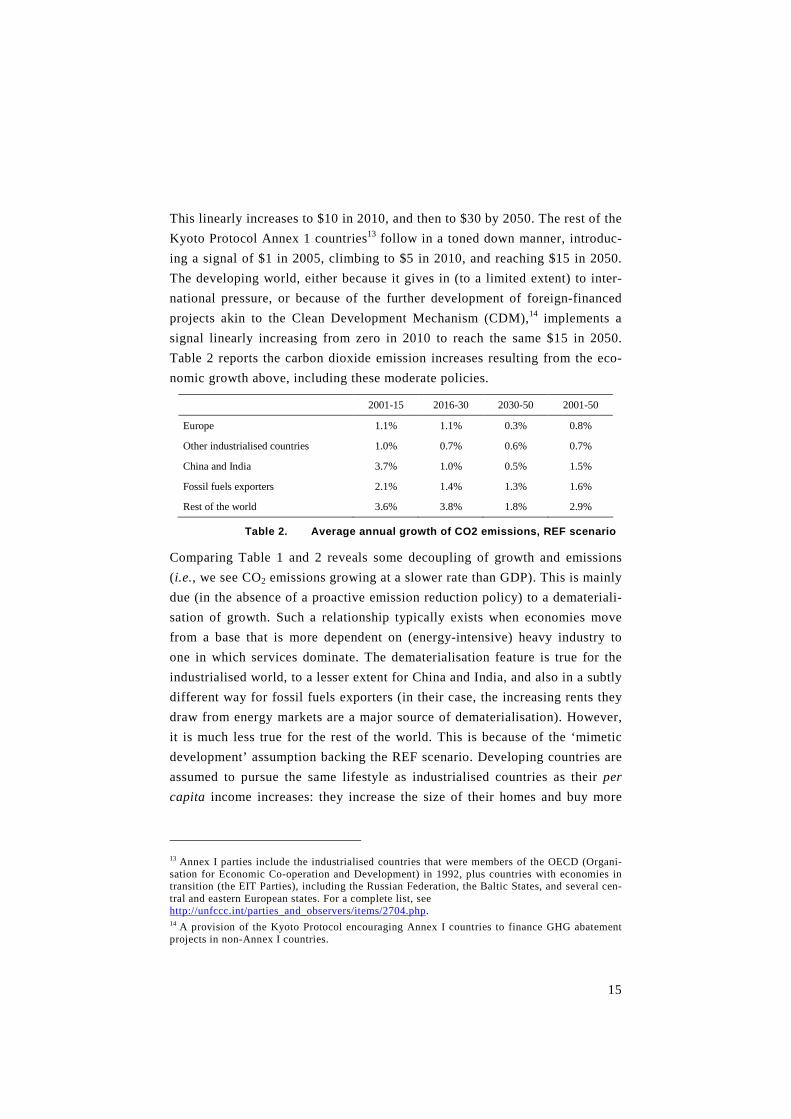
This linearly increases to $10 in 2010, and then to $30 by 2050. The rest of the
Kyoto Protocol Annex 1 countries13 follow in a toned down manner, introduc-
ing a signal of $1 in 2005, climbing to $5 in 2010, and reaching $15 in 2050.
The developing world, either because it gives in (to a limited extent) to inter-
national pressure, or because of the further development of foreign-financed
projects akin to the Clean Development Mechanism (CDM),14 implements a
signal linearly increasing from zero in 2010 to reach the same $15 in 2050.
Table 2 reports the carbon dioxide emission increases resulting from the eco-
nomic growth above, including these moderate policies.
2001-15 2016-30 2030-50 2001-50
Europe 1.1% 1.1% 0.3% 0.8%
Other industrialised countries 1.0% 0.7% 0.6% 0.7%
China and India 3.7% 1.0% 0.5% 1.5%
Fossil fuels exporters 2.1% 1.4% 1.3% 1.6%
Rest of the world 3.6% 3.8% 1.8% 2.9%
Table 2. Average annual growth of CO2 emissions, REF scenario
Comparing Table 1 and 2 reveals some decoupling of growth and emissions
(i.e., we see CO2 emissions growing at a slower rate than GDP). This is mainly
due (in the absence of a proactive emission reduction policy) to a demateriali-
sation of growth. Such a relationship typically exists when economies move
from a base that is more dependent on (energy-intensive) heavy industry to
one in which services dominate. The dematerialisation feature is true for the
industrialised world, to a lesser extent for China and India, and also in a subtly
different way for fossil fuels exporters (in their case, the increasing rents they
draw from energy markets are a major source of dematerialisation). However,
it is much less true for the rest of the world. This is because of the ‘mimetic
development’ assumption backing the REF scenario. Developing countries are
assumed to pursue the same lifestyle as industrialised countries as their per
capita income increases: they increase the size of their homes and buy more
13 Annex I parties include the industrialised countries that were members of the OECD (Organi-sation for Economic Co-operation and Development) in 1992, plus countries with economies in transition (the EIT Parties), including the Russian Federation, the Baltic States, and several cen-tral and eastern European states. For a complete list, see http://unfccc.int/parties_and_observers/items/2704.php. 14 A provision of the Kyoto Protocol encouraging Annex I countries to finance GHG abatement projects in non-Annex I countries.
16
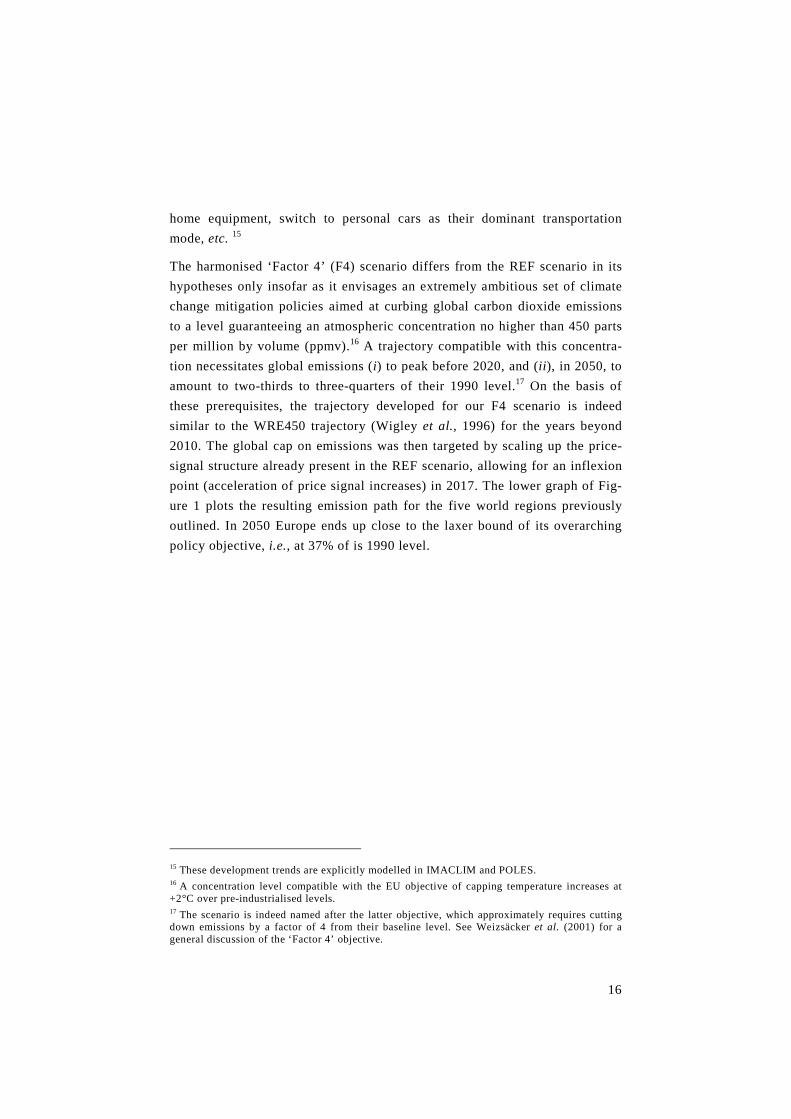
home equipment, switch to personal cars as their dominant transportation
mode, etc. 15
The harmonised ‘Factor 4’ (F4) scenario differs from the REF scenario in its
hypotheses only insofar as it envisages an extremely ambitious set of climate
change mitigation policies aimed at curbing global carbon dioxide emissions
to a level guaranteeing an atmospheric concentration no higher than 450 parts
per million by volume (ppmv).16 A trajectory compatible with this concentra-
tion necessitates global emissions (i) to peak before 2020, and (ii ), in 2050, to
amount to two-thirds to three-quarters of their 1990 level.17 On the basis of
these prerequisites, the trajectory developed for our F4 scenario is indeed
similar to the WRE450 trajectory (Wigley et al., 1996) for the years beyond
2010. The global cap on emissions was then targeted by scaling up the price-
signal structure already present in the REF scenario, allowing for an inflexion
point (acceleration of price signal increases) in 2017. The lower graph of Fig-
ure 1 plots the resulting emission path for the five world regions previously
outlined. In 2050 Europe ends up close to the laxer bound of its overarching
policy objective, i.e., at 37% of is 1990 level.
15 These development trends are explicitly modelled in IMACLIM and POLES. 16 A concentration level compatible with the EU objective of capping temperature increases at +2°C over pre-industrialised levels. 17 The scenario is indeed named after the latter objective, which approximately requires cutting down emissions by a factor of 4 from their baseline level. See Weizsäcker et al. (2001) for a general discussion of the ‘Factor 4’ objective.
17
0
20
40
60
2005 201 5 2025 203 5 2045
GtCO2 Rest of the world Fossil fuels exporters China and India Other ind. countries Europe
0
20
40
60
200 5 201 5 2025 2035 2045
GtCO2 Rest of the world Fossil fuels exporters China and India Other ind. countries Europe
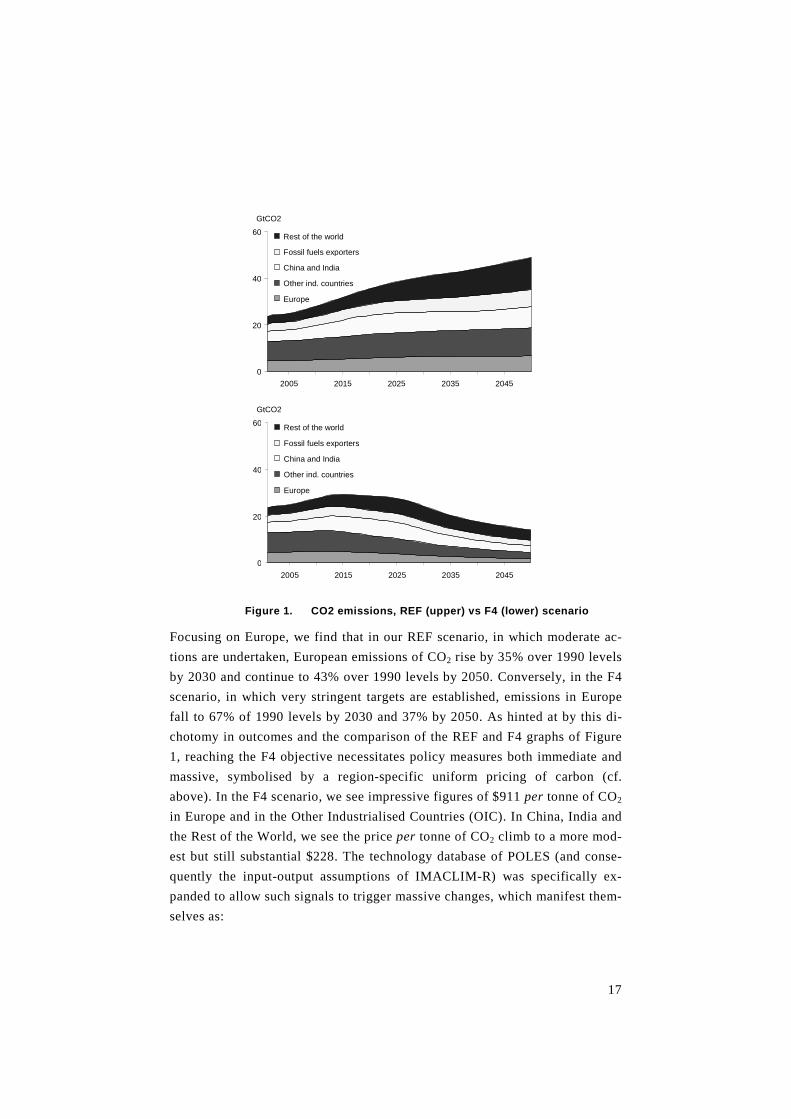
Figure 1. CO2 emissions, REF (upper) vs F4 (lower) scenario
Focusing on Europe, we find that in our REF scenario, in which moderate ac-
tions are undertaken, European emissions of CO2 rise by 35% over 1990 levels
by 2030 and continue to 43% over 1990 levels by 2050. Conversely, in the F4
scenario, in which very stringent targets are established, emissions in Europe
fall to 67% of 1990 levels by 2030 and 37% by 2050. As hinted at by this di-
chotomy in outcomes and the comparison of the REF and F4 graphs of Figure
1, reaching the F4 objective necessitates policy measures both immediate and
massive, symbolised by a region-specific uniform pricing of carbon (cf.
above). In the F4 scenario, we see impressive figures of $911 per tonne of CO2
in Europe and in the Other Industrialised Countries (OIC). In China, India and
the Rest of the World, we see the price per tonne of CO2 climb to a more mod-
est but still substantial $228. The technology database of POLES (and conse-
quently the input-output assumptions of IMACLIM-R) was specifically ex-
panded to allow such signals to trigger massive changes, which manifest them-
selves as:
18
• The rapid diffusion of very-low-emission equipment in the building,
transportation, and industrial sectors;
• The increased development and diffusion of low- or no-carbon energy
technologies, such as renewables, third generation nuclear power, and
carbon capture and storage;
• The development and diffusion of industrial production techniques of
radically innovative materials.
Still, the scenario as it stands is somewhat conservative as it does not hypothe-
sise induced changes in lifestyles, location and urbanisation choices. It would
be reasonable to assume that such behavioural changes would allow for even
more radical changes.
Integrating this extended POLES expertise, IMACLIM-R computes macroeco-
nomic conditions up to 2050. We find that the general macroeconomic conse-
quences of such major mutations of the energy systems are not as dramatic as
one might expect. Such consequences are largely dependent on the particular
characteristics of each region (cf. Table 3). Comparing Tables 3 and 1, we see
that the burden of implementing the stringent climate change constraint (i.e.,
that by 2050, European emissions are 37% of 1990 levels) is felt in the me-
dium term. This indicates that economies, hampered by the inertia of their en-
ergy systems, bear the brunt in the shorter run. In the longer-term, when the
necessary adjustments have taken place, growth tends back towards its REF
levels, and even overshoots it in some regions. Europe is obviously the most
impacted region—its relatively higher REF energy efficiency makes it particu-
larly sensitive to high carbon prices. Over the period, we see average annual
growth fall from about 1.6% in 2001-15 to 1.2% for the following 15 years.
Between 2030 and 2050, we see average annual growth return to about 1.4%
and this has the effect of stabilising the annual growth rate at 1.4% over the
whole period 2001-2050. In the REF scenario, annual growth is estimated at
1.8% over the same period. However, there are some significant divergences
earlier on in the period. For instance, growth up to 2030 averages 2.1% per
annum in the REF case which is between 0.5%-0.9% higher than in our F4
scenario. After 2030, the average growth rates converge. What might be of
concern to policy-makers and researchers alike is that the likely reduction in
annual growth rates is front-loaded, with the benefits being felt further in the
future. The impact on the other industrialised countries, on India and China
19
and on the rest of the world is smaller (annual growth is reduced by an average
of 0.1% and 0.2% respectively for the first two regions while the rest of the
world sees no negative aggregate impact over the period). However, fossil fu-
els exporters see annual growth fall from 3.1% to 2.6% per annum up to 2050.
This is related to the fact that (i) their export volumes are greatly reduced, and
(ii ) the consequently much lower tensions on the oil and gas markets allow for
much lower rents.
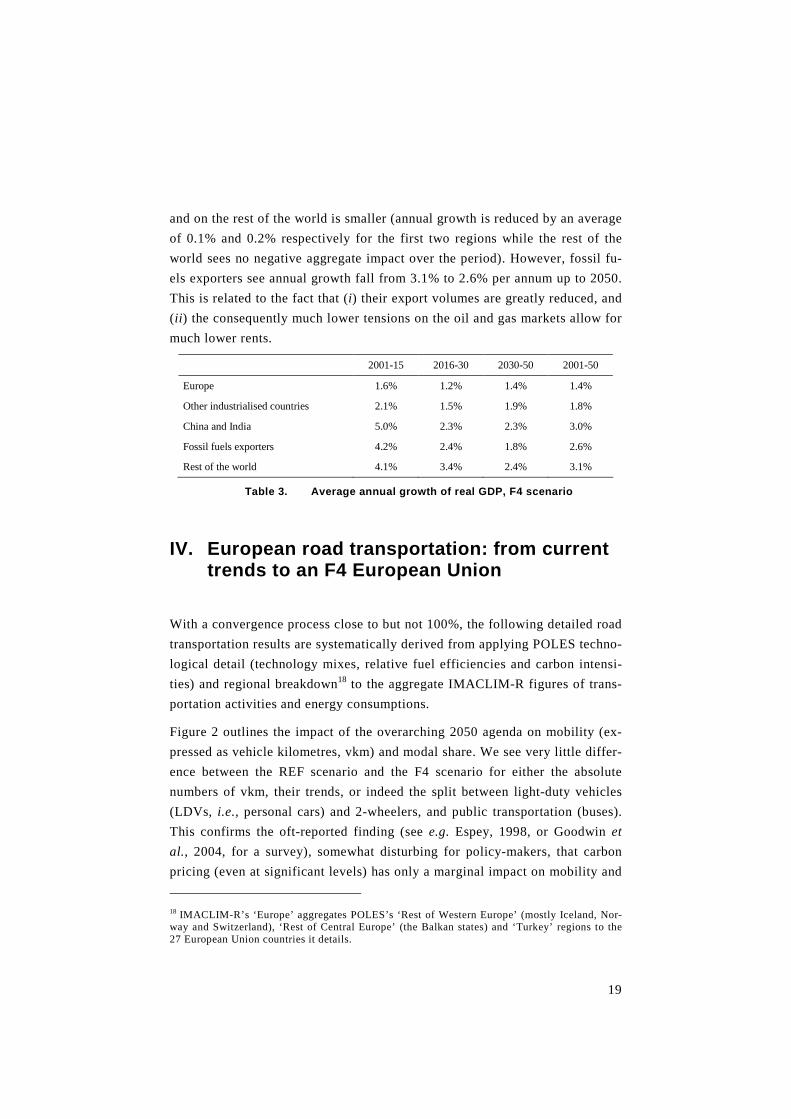
2001-15 2016-30 2030-50 2001-50
Europe 1.6% 1.2% 1.4% 1.4%
Other industrialised countries 2.1% 1.5% 1.9% 1.8%
China and India 5.0% 2.3% 2.3% 3.0%
Fossil fuels exporters 4.2% 2.4% 1.8% 2.6%
Rest of the world 4.1% 3.4% 2.4% 3.1%
Table 3. Average annual growth of real GDP, F4 scenario
IV. European road transportation: from current trends to an F4 European Union
With a convergence process close to but not 100%, the following detailed road
transportation results are systematically derived from applying POLES techno-
logical detail (technology mixes, relative fuel efficiencies and carbon intensi-
ties) and regional breakdown18 to the aggregate IMACLIM-R figures of trans-
portation activities and energy consumptions.
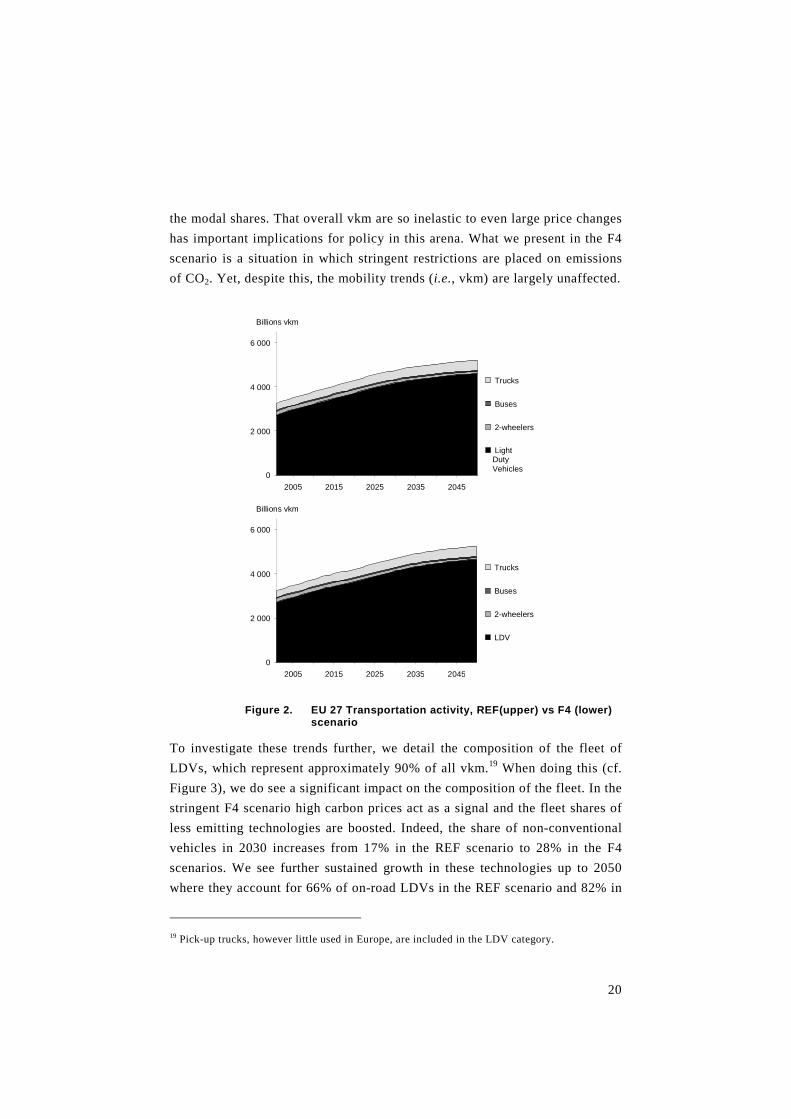
Figure 2 outlines the impact of the overarching 2050 agenda on mobility (ex-
pressed as vehicle kilometres, vkm) and modal share. We see very little differ-
ence between the REF scenario and the F4 scenario for either the absolute
numbers of vkm, their trends, or indeed the split between light-duty vehicles
(LDVs, i.e., personal cars) and 2-wheelers, and public transportation (buses).
This confirms the oft-reported finding (see e.g. Espey, 1998, or Goodwin et
al., 2004, for a survey), somewhat disturbing for policy-makers, that carbon
pricing (even at significant levels) has only a marginal impact on mobility and
18 IMACLIM-R’s ‘Europe’ aggregates POLES’s ‘Rest of Western Europe’ (mostly Iceland, Nor-way and Switzerland), ‘Rest of Central Europe’ (the Balkan states) and ‘Turkey’ regions to the 27 European Union countries it details.
20
the modal shares. That overall vkm are so inelastic to even large price changes
has important implications for policy in this arena. What we present in the F4
scenario is a situation in which stringent restrictions are placed on emissions
of CO2. Yet, despite this, the mobility trends (i.e., vkm) are largely unaffected.
0
2 000
4 000
6 000
200 5 2015 202 5 2035 2045
Billions vkm
Trucks
Buses
2- wheelers
Light Duty Vehicles
0
2 000
4 000
6 000
2005 2015 2025 2035 2045
Billions vkm
Trucks
Buses
2-wheelers
LDV
Figure 2. EU 27 Transportation activity, REF(upper) vs F4 (lower) scenario
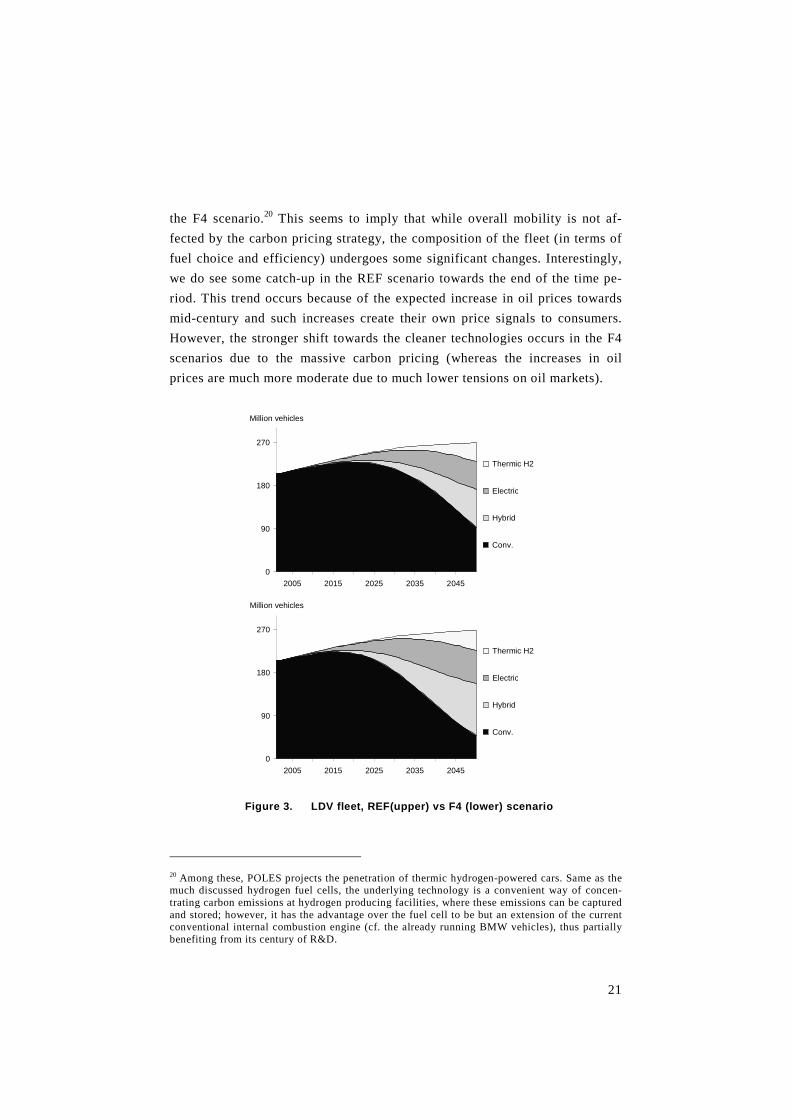
To investigate these trends further, we detail the composition of the fleet of
LDVs, which represent approximately 90% of all vkm.19 When doing this (cf.
Figure 3), we do see a significant impact on the composition of the fleet. In the
stringent F4 scenario high carbon prices act as a signal and the fleet shares of
less emitting technologies are boosted. Indeed, the share of non-conventional
vehicles in 2030 increases from 17% in the REF scenario to 28% in the F4
scenarios. We see further sustained growth in these technologies up to 2050
where they account for 66% of on-road LDVs in the REF scenario and 82% in
19 Pick-up trucks, however little used in Europe, are included in the LDV category.
21
the F4 scenario.20 This seems to imply that while overall mobility is not af-
fected by the carbon pricing strategy, the composition of the fleet (in terms of
fuel choice and efficiency) undergoes some significant changes. Interestingly,
we do see some catch-up in the REF scenario towards the end of the time pe-
riod. This trend occurs because of the expected increase in oil prices towards
mid-century and such increases create their own price signals to consumers.
However, the stronger shift towards the cleaner technologies occurs in the F4
scenarios due to the massive carbon pricing (whereas the increases in oil
prices are much more moderate due to much lower tensions on oil markets).
0
90
180
270
2005 2015 2025 2035 2045
Million vehicles
Thermic H2
Electric
Hybrid
Conv.
0
90
180
270
2005 2015 2025 2035 2045
Million vehicles
Thermic H2
Electric
Hybrid
Conv.
Figure 3. LDV fleet, REF(upper) vs F4 (lower) scenario
20 Among these, POLES projects the penetration of thermic hydrogen-powered cars. Same as the much discussed hydrogen fuel cells, the underlying technology is a convenient way of concen-trating carbon emissions at hydrogen producing facilities, where these emissions can be captured and stored; however, it has the advantage over the fuel cell to be but an extension of the current conventional internal combustion engine (cf. the already running BMW vehicles), thus partially benefiting from its century of R&D.
22
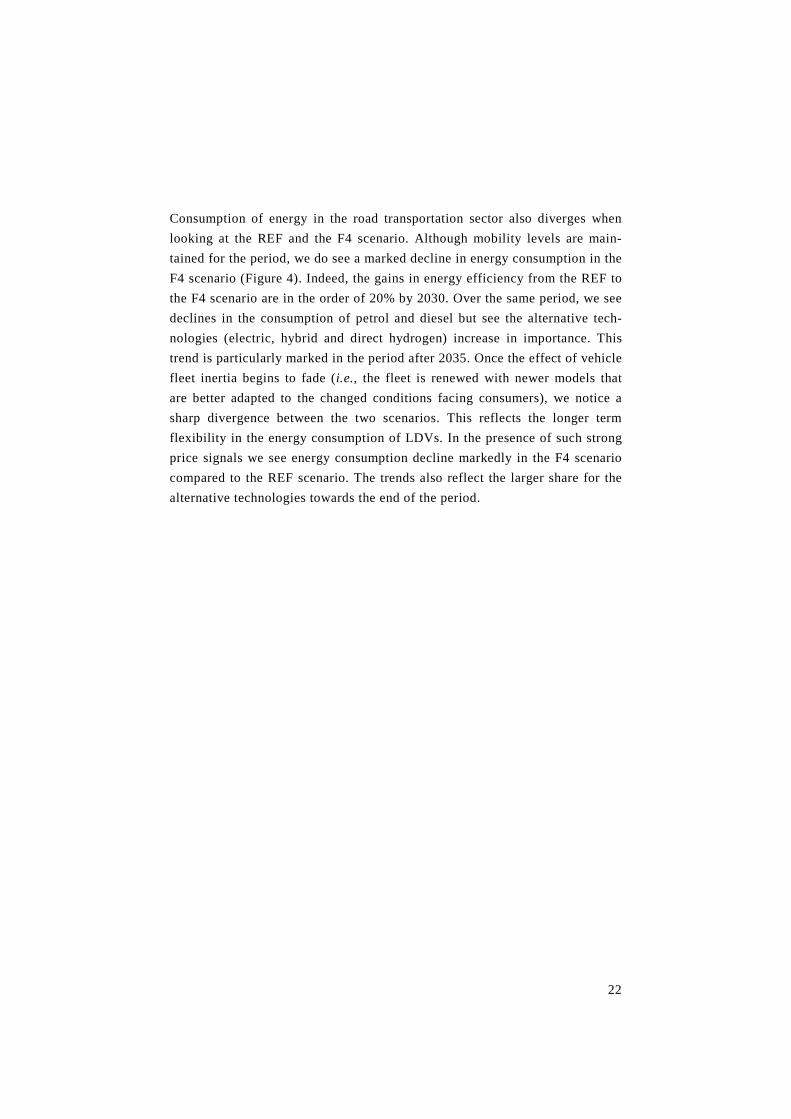
Consumption of energy in the road transportation sector also diverges when
looking at the REF and the F4 scenario. Although mobility levels are main-
tained for the period, we do see a marked decline in energy consumption in the
F4 scenario (Figure 4). Indeed, the gains in energy efficiency from the REF to
the F4 scenario are in the order of 20% by 2030. Over the same period, we see
declines in the consumption of petrol and diesel but see the alternative tech-
nologies (electric, hybrid and direct hydrogen) increase in importance. This
trend is particularly marked in the period after 2035. Once the effect of vehicle
fleet inertia begins to fade (i.e., the fleet is renewed with newer models that
are better adapted to the changed conditions facing consumers), we notice a
sharp divergence between the two scenarios. This reflects the longer term
flexibility in the energy consumption of LDVs. In the presence of such strong
price signals we see energy consumption decline markedly in the F4 scenario
compared to the REF scenario. The trends also reflect the larger share for the
alternative technologies towards the end of the period.
23
0
100
200
300
2005 2015 2025 2035 2045
MTOE
Hydrogen
Electricity
Biofuels
Fossil fuels
0
100
200
300
200 5 201 5 2025 203 5 2045
MTOE
Hydrogen
Electricity
Biofuels
Fossil fuels
Figure 4. End-use energy consumption of road transportation, REF (upper) vs F4 (lower) scenario
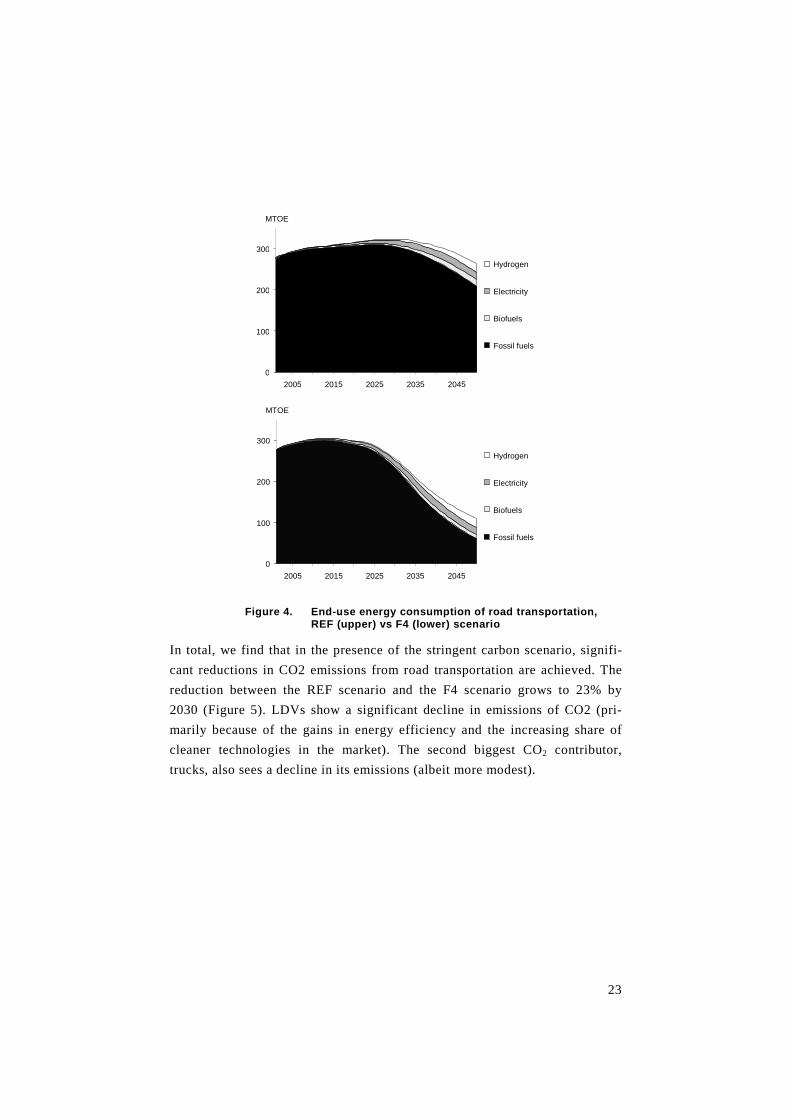
In total, we find that in the presence of the stringent carbon scenario, signifi-
cant reductions in CO2 emissions from road transportation are achieved. The
reduction between the REF scenario and the F4 scenario grows to 23% by
2030 (Figure 5). LDVs show a significant decline in emissions of CO2 (pri-
marily because of the gains in energy efficiency and the increasing share of
cleaner technologies in the market). The second biggest CO2 contributor,
trucks, also sees a decline in its emissions (albeit more modest).
24
0
300
600
900
2005 2015 2025 2035 2045
MtCO2
Trucks
Buses
2-wheelers
LDV
0
300
600
900
2005 2015 2025 2035 2045
MtCO2
Trucks
Buses
2-wheelers
LDV
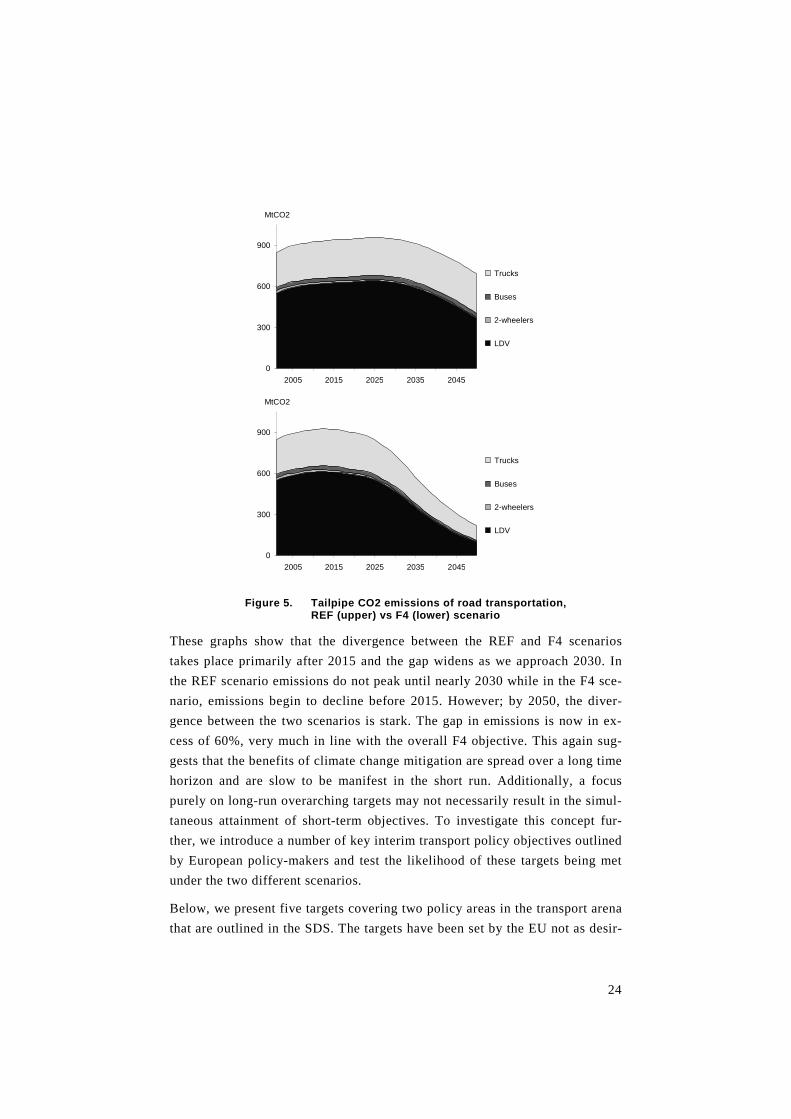
Figure 5. Tailpipe CO2 emissions of road transportation, REF (upper) vs F4 (lower) scenario
These graphs show that the divergence between the REF and F4 scenarios
takes place primarily after 2015 and the gap widens as we approach 2030. In
the REF scenario emissions do not peak until nearly 2030 while in the F4 sce-
nario, emissions begin to decline before 2015. However; by 2050, the diver-
gence between the two scenarios is stark. The gap in emissions is now in ex-
cess of 60%, very much in line with the overall F4 objective. This again sug-
gests that the benefits of climate change mitigation are spread over a long time
horizon and are slow to be manifest in the short run. Additionally, a focus
purely on long-run overarching targets may not necessarily result in the simul-
taneous attainment of short-term objectives. To investigate this concept fur-
ther, we introduce a number of key interim transport policy objectives outlined
by European policy-makers and test the likelihood of these targets being met
under the two different scenarios.
Below, we present five targets covering two policy areas in the transport arena
that are outlined in the SDS. The targets have been set by the EU not as desir-
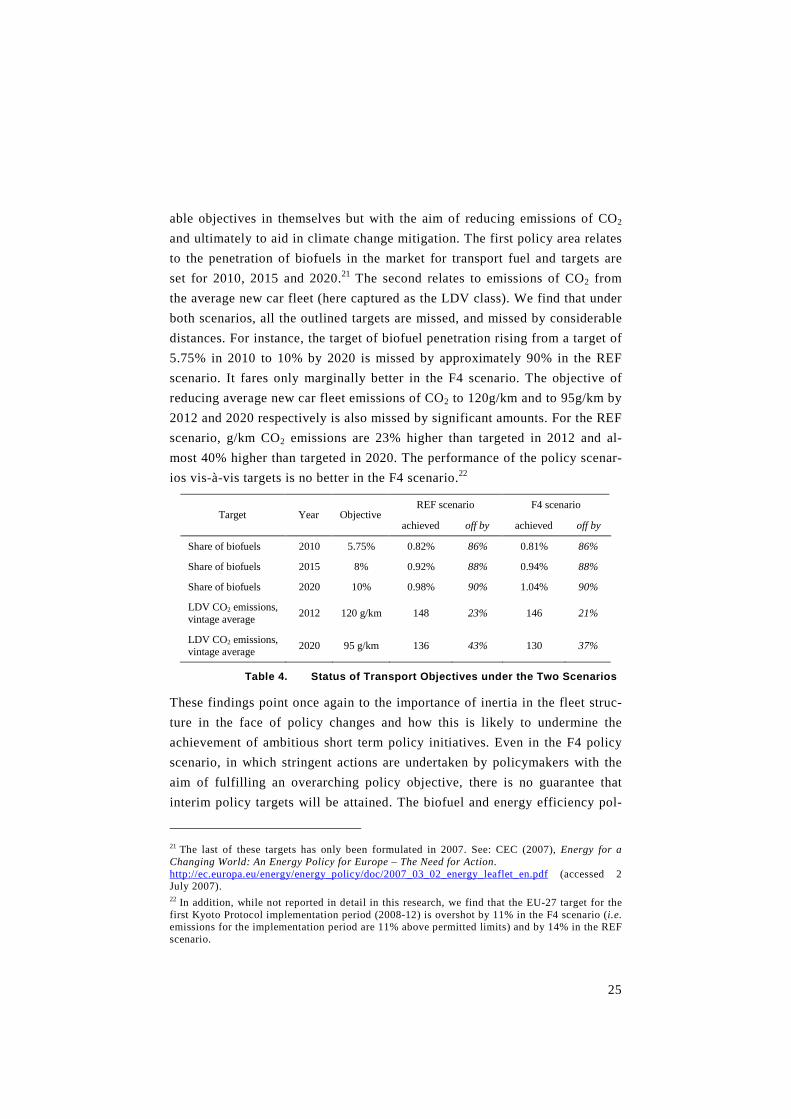
25
able objectives in themselves but with the aim of reducing emissions of CO2
and ultimately to aid in climate change mitigation. The first policy area relates
to the penetration of biofuels in the market for transport fuel and targets are
set for 2010, 2015 and 2020.21 The second relates to emissions of CO2 from
the average new car fleet (here captured as the LDV class). We find that under
both scenarios, all the outlined targets are missed, and missed by considerable
distances. For instance, the target of biofuel penetration rising from a target of
5.75% in 2010 to 10% by 2020 is missed by approximately 90% in the REF
scenario. It fares only marginally better in the F4 scenario. The objective of
reducing average new car fleet emissions of CO2 to 120g/km and to 95g/km by
2012 and 2020 respectively is also missed by significant amounts. For the REF
scenario, g/km CO2 emissions are 23% higher than targeted in 2012 and al-
most 40% higher than targeted in 2020. The performance of the policy scenar-
ios vis-à-vis targets is no better in the F4 scenario.22
REF scenario F4 scenario Target Year Objective
achieved off by achieved off by
Share of biofuels 2010 5.75% 0.82% 86% 0.81% 86%
Share of biofuels 2015 8% 0.92% 88% 0.94% 88%
Share of biofuels 2020 10% 0.98% 90% 1.04% 90%
LDV CO2 emissions, vintage average
2012 120 g/km 148 23% 146 21%
LDV CO2 emissions, vintage average
2020 95 g/km 136 43% 130 37%
Table 4. Status of Transport Objectives under the Two Scenarios
These findings point once again to the importance of inertia in the fleet struc-
ture in the face of policy changes and how this is likely to undermine the
achievement of ambitious short term policy initiatives. Even in the F4 policy
scenario, in which stringent actions are undertaken by policymakers with the
aim of fulfilling an overarching policy objective, there is no guarantee that
interim policy targets will be attained. The biofuel and energy efficiency pol-
21 The last of these targets has only been formulated in 2007. See: CEC (2007), Energy for a Changing World: An Energy Policy for Europe – The Need for Action. http://ec.europa.eu/energy/energy_policy/doc/2007_03_02_energy_leaflet_en.pdf (accessed 2 July 2007). 22 In addition, while not reported in detail in this research, we find that the EU-27 target for the first Kyoto Protocol implementation period (2008-12) is overshot by 11% in the F4 scenario (i.e. emissions for the implementation period are 11% above permitted limits) and by 14% in the REF scenario.
26
icy objectives are goals, and require additional policy initiatives in order to be
achieved. As a result, we reject the hypothesis that the presence of such a
long-range target will ‘dominate’ specific interim measures. The reason for
this is clear from looking at the long-term trends in our research. By 2050, the
F4 scenario—in which we hypothesise the meeting of the climate change ob-
jective—diverges significantly from the business-as-usual alternative. This
trend is repeated when we look at specific elements of the market (i.e. the
composition of the LDV fleet, etc.). However, these trends only begin to assert
themselves after a considerable lag. Inertia in the replacement and substitution
of vehicle fleets militates against a quick response to even significant price
signals for carbon. We find that even in the F4 scenario in which there is an
accelerated turnover in vehicle type and composition, emissions only diverge
gradually from the REF case. By 2050, the divergence is significant but an
analysis to 2030 shows every little difference between the two scenarios. We
find this trend once again when we investigate how the presence of such a
long-term ambitious target impacts on shorter-term sub-targets. Given the
short time horizon for these targets and the inertia in the fleet of vehicles, all
the targets are missed. The F4 scenario has only marginal impact. This pre-
sents policy-makers with significant challenges in formulating policy targets
in the short run and in the long run.
V. Conclusions
This paper has set out to investigate the impact of stringent long-term climate
change mitigation targets on the shorter-run trends in the transportation arena.
To do this, we have investigated the impact of the overall objective of reduc-
ing emissions of CO2 by between 60 and 80% by 2050 on some transport ob-
jectives outlined in the SDS. We have employed a scenario-based approach
over the time horizon of 2001 to 2050 and explored a business-as-usual refer-
ence scenario and a scenario with an ambitious carbon pricing assumption.
Both scenarios are harmonised projections of the global dynamic recursive
computable general equilibrium model IMACLIM-R, and of the POLES model
of global energy markets, thereby guaranteeing full consistency between the
macroeconomic and energy balances. At the outset, we hypothesise that reach-
ing the ambitious target of a 60% to 80% reduction in CO2 by 2050 will
27
“dominate” other targets specifically related to the transport sphere. To do
this, we introduce a number of targets outlined in the SDS. In fact, we find
that the hypothesis that we tested can be rejected. We see that under both the
REF scenario and the scenario in which strong carbon price signals are given,
the interim transport policy targets are not met. This is a stark finding and one
that should be of concern to policy-makers. It indicates that the presence of a
long-term target for climate change mitigation (even one that is acted upon)
does not guarantee that short-run transportation sub-targets will be met. We
conclude that the structure of the market forbids immediate reactions to price
signals (even very significant ones).
In addition to the above, we have seen that the imposition of the carbon price
signal does have some impact on economic growth. This is especially the case
for Europe. We find that projected economic growth is reduced by the intro-
duction of a pricing signal for carbon; however, the impact reduces over time.
Worryingly for policy-makers, this implies that while the benefits are spread
over the whole period, the negative impacts are focused within a shorter time
horizon. This again reflects the inertia existing in the vehicle fleet market and
the resultant lag in response to policy initiatives. Despite this, we do see that
the impact of the carbon pricing strategy is significant. We find that in our
REF scenario in which moderate actions are undertaken, European emissions
of CO2 rise by 35% over 1990 levels through 2030 and continue to 43% over
1990 levels by 2050. In contrast, the F4 scenario projects emissions in Europe
to fall to 67% of 1990 levels by 2030 and 37% by 2050. This seems to indicate
that reaching the F4 objective necessitates significant policy measures which
are likely to have massive impacts. In the F4 scenario price signal, a tonne of
CO2 rises to $911 in Europe and in the Other Industrialised Countries (OIC).
In China, India and the Rest of the World, we see the price signal per tonne of
CO2 climb to a more modest but still substantial $228. The scenario as it
stands is somewhat conservative as it does not hypothesise induced changes in
lifestyles, location and urbanisation choices. It would be reasonable to assume
that such behavioural changes would allow for even more radical changes.
When estimating the impact of our policy agenda on transport mobility (ex-
pressed as vehicle-kilometres), we found—in common with other studies—that
light-duty vehicle mobility is inelastic to even large price signals for carbon.
We do, however, see a significant impact on the composition of the fleet (in
the medium to long run). In the F4 scenario high carbon prices act as a signal
28
and the market shares of less emitting technologies are boosted. This seems to
imply that while mobility is not affected by the carbon pricing strategy, the
composition of the fleet undergoes some significant changes.
A similar trend is seen in the area of energy consumption. Energy consumption
is reduced significantly in the F4 scenario over the REF case by 2050; how-
ever, the divergence between the two scenarios only begins to become appar-
ent after 2020. This results in the light-duty vehicles showing a significant
decline in emissions of CO2 (primarily because of the gains in energy effi-
ciency and the increasing penetration of cleaner technologies in the market).
The second biggest CO2 contributor, trucks, also sees a decline in its emissions
(albeit more modest).
As we have seen in the previous sections, the impact of the stringent policies
aimed at reducing carbon dioxide emissions only begin to take effect in the
medium to long term. We propose that the key explanation for the lack of di-
vergence between the two scenarios in the short term is the structure of the
vehicle fleet market. The inherent inertia in fleet turnover and substitution
hinders short-term responses to policy actions; yet by 2050, we see a signifi-
cant divergence in the transportation trends (with the exception of overall mo-
bility) under the two scenarios. Emissions from transport now contribute over
a quarter of all CO2 emissions in Europe. Despite this short-term inertia, we
find that in the presence of significant pricing signals, the transportation trends
do begin to diverge (due primarily to the penetration of cleaner technologies in
the medium to long run). This is an important finding for policy-makers.
Given that transportation is amongst the most rigid of all sectors in relation to
emissions of CO2, the long-term findings are encouraging. Despite finding that
the presence of a long-term overarching climate change mitigation objective
does not guarantee the achievement of interim related goals, the sector does
react to the pricing signals in the longer term. The evident short-term inertia
should not hinder policymakers who wish to initiate policies aimed at reducing
emissions from this sector.
29
References
CEC (1992), The Future Development of the Common Transport Policy. A
Global Approach to the Construction of a Community Framework for Sustain-
able Mobility. Transport White Paper. Communication from the Commission:
Com (92) 494, Brussels.
CEC (1993), Growth, Competitiveness, Employment: The Challenges and
Ways Forward into the 21st Century - White Paper. Parts A and B. COM (93)
700 final/A and B, 5 December 1993. Bulletin of the European Communities,
Supplement 6/93, Brussels
CEC (2001a), European Transport Policy for 2010: Time to Decide. Transport
White Paper. Communication from the Commission to the Council and the
European Parliament: COM (2001) 370, Brussels.
CEC (2001b), A Sustainable Europe for a Better World: A European Union
Strategy for Sustainable Development. Commission’s proposal to the Gothen-
burg European Council. Communication from the Commission, COM (2001)
264 Final, Brussels.
CEC (2002), Towards a Global Partnership for Sustainable Development.
Communication from the Commission to the European Parliament, The Coun-
cil, The Economic and Social Committee and the Committee of the Regions.
COM (2002) 82, Brussels.
CEC (2005), On the Review of the Sustainable Development Strategy – A Plat-
form for Action. Communication from the Commission to the Council and the
European Parliament. COM (2005) 658 Final, Brussels.
CEC (2006), Keep Europe Moving – Sustainable Mobility for our Continent.
Mid-term review of the European Commission’s 2001 Transport White Paper.
Communication from the Commission to the Council and the European Par-
liament. COM (2006) 314 final Brussels.
CEC (2007), Energy for a Changing World: An Energy Policy for Europe –
The Need for Action
http://ec.europa.eu/energy/energy_policy/doc/2007_03_02_energy_leaflet_en.
pdf (accessed July 2nd, 2007).
30
CEU (2006), Review of the EU Sustainable Development Strategy (EU SDS) −
Renewed Strategy. Council of the European Union, Brussels, 9th June 2006.
CEU (2007) Brussels European Council 8/9 March 2007, Presidency Conclu-
sions, Council of the European Union, 7224/1/07 Rev 1, Brussels, 2 May
2007:
http://www.consilium.europa.eu/ueDocs/cms_Data/docs/pressData/en/ec/9313
5.pdf
Crassous, R., J.-C. Hourcade, O. Sassi (2006), “Endogenous Structural Change
and Climate Targets. Modeling Experiments with Imaclim-R”, The Energy
Journal, Special Issue Endogenous Technological Change and the Economics
of the Atmospheric Stabilization: 259–276.
Criqui, P. (2001), POLES: Prospective Outlook on Long-term Energy Systems,
Institut d’Économie et de Politique de l’Énergie, Grenoble, France, 9 pp.
http://www.upmf-grenoble.fr/iepe/textes/POLES8p_01.pdf (accessed August
1st, 2006).
Edenhofer, O., K. Lessmann, C. Kemfert, M.J. Grubb and J. Koehler (2006),
“Induced Technological Change: Exploring its Implications for the Economics
of Atmospheric Stabilization - Synthesis Report from the Innovation Modeling
Comparison Project”, The Energy Journal, Special Issue Endogenous Techno-
logical Change and the Economics of the Atmospheric Stabilization: 1-52.
Espey, M. (1998), “Gasoline Demand Revisited: An International Meta-
Analysis of Elasticities”, Energy Economics 20: 273-295.
Goodwin, P., Dargay, J., Hanly, M. (2004) “Elasticities of Road Traffic and
Fuel Consumption with Respect to Price and Income: A Review”. Transport
Reviews 24 (3): 275-292.
Intergovernmental Panel on Climate Change (2001), Climate Change 2001:
Mitigation, third assessment report of Working group III, Cambridge Univer-
sity Press, 752 pp.
Maddison, A. (2001), The World Economy: A Millennial Perspective. OECD,
Development Centre Studies, Paris.
Nakićenović, N. and R. Swart (2000), Emissions Scenarios – Special Report
on Emissions Scenarios, Intergovernmental Panel on Climate Change, Cam-
bridge University Press, New York, USA.
31
UN (1987), Report of the World Commission on Environment and Develop-
ment. United Nations General Assembly Resolution 42/187, 11 December
1987.
Weizsacker, E.U. von, H.L. Lovins and A.B. Lovins (1998), Factor Four:
Doubling Wealth, Halving Resource Use - A Report to the Club of Rome.
Earthscan Publications Ltd, 322 pages.
Weyant, J. P., and J. N. Hill, eds. (1999), The Costs of the Kyoto Protocol: A
Multi-Model Evaluation, Special Issue of The Energy Journal.
Wigley, T.M.L., R. Richels, and J.A. Edmonds (1996), “Economic and Envi-
ronmental Choices in the Stabilization of Atmospheric CO2 Concentrations”,
Nature 379: 240-243.


