The Lean EnterpriseThe Lean EnterpriseThe Lean EnterpriseThe Lean EnterpriseValue Stream MappingValue Stream Mapping
Lean Foundations
Continuous Improvement Training
Lean Foundations
Continuous Improvement Training
The purpose of this module is to present the foundational principles of Waste Identification and
elimination.
Learn the History and Purpose of Value Stream Mapping.
LearningLearning ObjectivesObjectives LearningLearning ObjectivesObjectives

Short HistoryShort HistoryShort HistoryShort History
Origins in Toyota, circa1955 – The way of doing business…
Also called “Material and Information Flow Mapping”
Used by Toyota Motors to show both current and ideal states as part of the lean implementation process
Discussed in “Lean Thinking”Further developed and documented by the Lean Enterprise Institute of Brookline, Mass. “Learning to See”
1996 1998

What is the Value Stream?What is the Value Stream? What is the Value Stream?What is the Value Stream?
Total Value Stream
SUPPLIERS YOUR PLANT OR BUSINESS CUSTOMER TO END USER
All the actions, both value added and non-value added, currently required to bring a product from raw materials to the customer.All the actions, both value added and non-value added, currently required to bring a product from raw materials to the customer.

The Value Stream PerspectiveThe Value Stream PerspectiveThe Value Stream PerspectiveThe Value Stream Perspective
A value stream is all the actions (both value added and non-value added) currently required to bring a product (or transaction) though the main flows essential for every product/ service: from raw material/ (customer need), through all the required steps, then – back to the arms of the customer.
Taking a value stream perspective means working on the big picture, not just individual processes, and improving the whole, not just optimizing the parts.
TOTAL VALUE STREAM
SUPPLY
PARTNERS YOUR PLANT OF COMPANY CUSTOMER TO END USER
Value Stream MappingValue Stream MappingValue Stream MappingValue Stream Mapping
• Let’s look at an EXAMPLE
7
WIP 870
QTIME72H
MELT903M
INSPCHEM
HoldFurnace
Cast903
INSPPROFILE
WIP 696QTIME
P/T 6N
LOT 75K
P/T 8HWIP 8 COILS
120K
P/T 3 HR15KWIP
STORE STAGEBREAKDOWN
911
REC STAGE
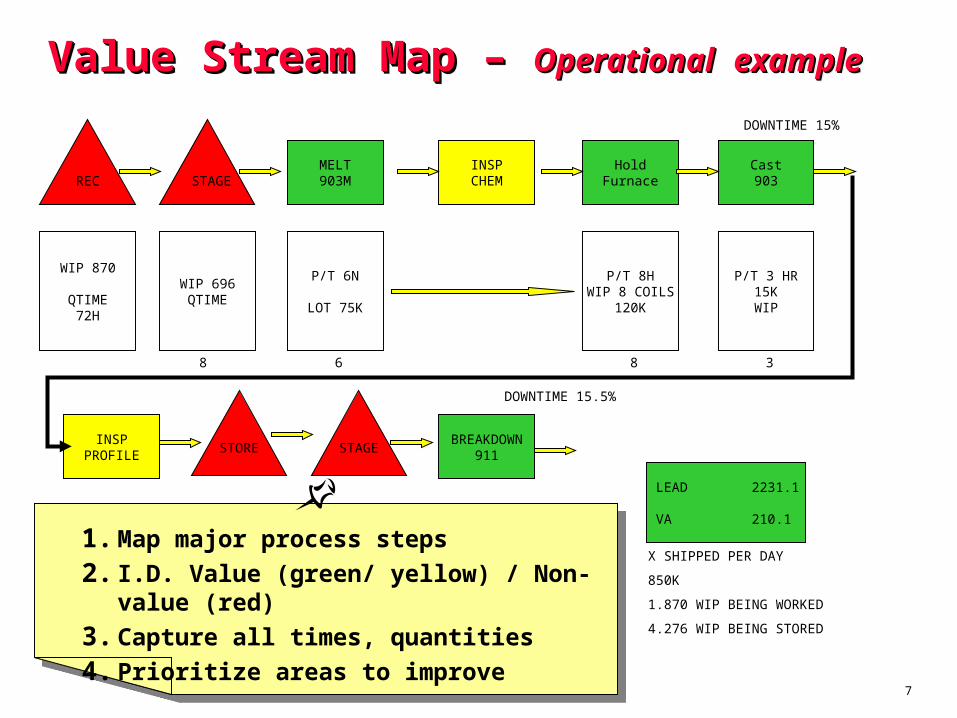
LEAD 2231.1
VA 210.17%SCRAP
WIP746KQTIME8 1OK
LOT 1 COILTIME .1WIP 15K
WIP108K8HRQ/T8
DOWNTIME 15%
DOWNTIME 15.5%
8 6 8 3
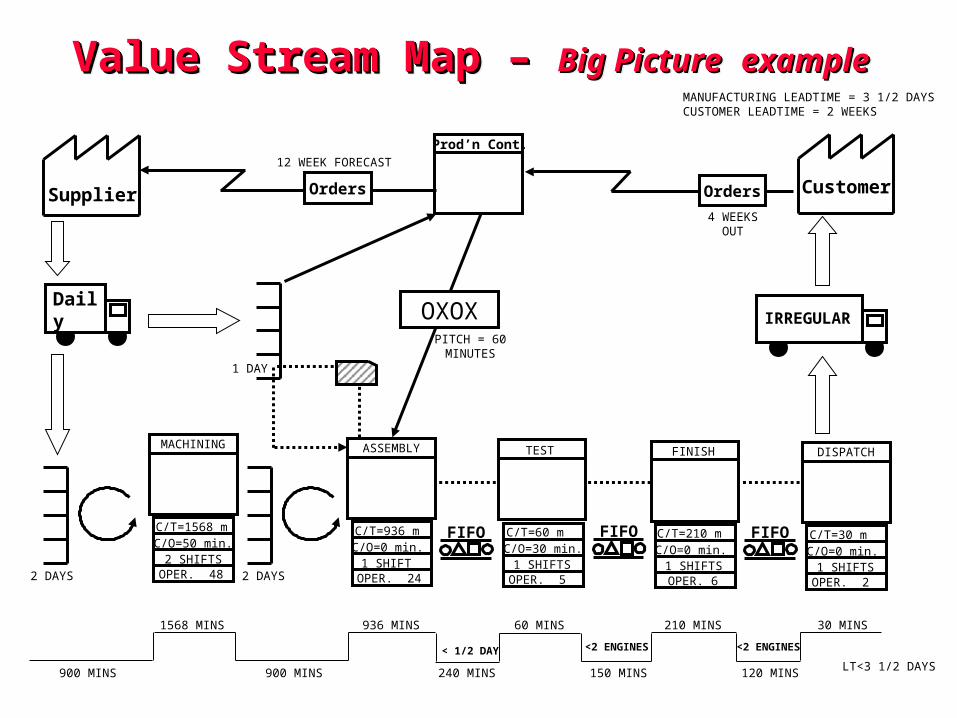
Value Stream Map – Value Stream Map – OperationalOperational exampleexampleValue Stream Map – Value Stream Map – OperationalOperational exampleexample
1. Map major process steps
2. I.D. Value (green/ yellow) / Non-value (red)
3. Capture all times, quantities
4. Prioritize areas to improve
X SHIPPED PER DAY
850K
1.870 WIP BEING WORKED
4.276 WIP BEING STORED
Customer
MACHINING
C/T=1568 mC/O=50 min.
2 SHIFTSOPER. 48
Daily
FIFO
Prod’n Cont.
Supplier OrdersOrders
IRREGULAR
ASSEMBLY
C/T=936 mC/O=0 min.
1 SHIFTOPER. 24
TEST
C/T=60 mC/O=30 min.1 SHIFTS
OPER. 5
FINISH
C/T=210 mC/O=0 min.
1 SHIFTSOPER. 6
DISPATCH
C/T=30 mC/O=0 min.
1 SHIFTSOPER. 2
FIFOFIFO
OXOX
1 DAY
2 DAYS 2 DAYS
900 MINS 900 MINS 240 MINS 150 MINS 120 MINS
1568 MINS 936 MINS 60 MINS 210 MINS 30 MINS
4 WEEKSOUT
12 WEEK FORECAST
< 1/2 DAY <2 ENGINES <2 ENGINES
PITCH = 60MINUTES
LT<3 1/2 DAYS
MANUFACTURING LEADTIME = 3 1/2 DAYSCUSTOMER LEADTIME = 2 WEEKS
Value Stream Map – Value Stream Map – Big PictureBig Picture exampleexampleValue Stream Map – Value Stream Map – Big PictureBig Picture exampleexample

Why do Value Stream mapping?Why do Value Stream mapping?Why do Value Stream mapping?Why do Value Stream mapping?
• To understand the current situation - The “big picture” point of view (To use as a tool to
improve the whole vs. optimizing the parts…)
• Exposes sources of waste - not just the waste
• Shows linkage between information flow and material flow
• Forms the blueprint to identify areas of improvement

What does Value Stream Map do for us?What does Value Stream Map do for us?What does Value Stream Map do for us?What does Value Stream Map do for us?
• It helps visualize more than just the single-process level, i.e. assembly, welding, etc., in production. You can see the whole flow.
• It helps to see more than waste. Mapping helps to see the sources of waste in your value stream.
• It provides a common language for talking about manufacturing (and transactional) processes.
• It makes decisions about the flow apparent, so you can discuss them. Otherwise, many details and decisions in your area just happen by default.
• By adding data, it ties together lean concepts and six sigma techniques, which helps you avoid “pet projects”.

Value Stream Mapping is an Essential ToolValue Stream Mapping is an Essential ToolValue Stream Mapping is an Essential ToolValue Stream Mapping is an Essential Tool
• It forms the basis of an implementation plan. By helping you design how the whole door-to-door flow should operate - a missing piece in so many lean efforts - value stream maps become a blueprint for improvement. Imagine trying to build a house without a blueprint!
• It shows the linkage between the information flow and the material flow. No other tool does this.

Value Stream Mapping is an Essential ToolValue Stream Mapping is an Essential ToolValue Stream Mapping is an Essential ToolValue Stream Mapping is an Essential Tool
• It enhances the quantitative tools and layout diagrams that produce a tally of non-value added steps, lead time, distance traveled, the amount of inventory, and so on.
• Value stream mapping is a qualitative tool by which you describe in detail how your facility should operate in order to create flow. Numbers are good for creating a sense of urgency or as before/ after measures. Value stream mapping is good for describing what you are actually going to do to affect those numbers.
Value Stream MappingValue Stream MappingValue Stream MappingValue Stream Mapping
• Let’s look at an EXAMPLE of Process Mapping
• A good start, but no data, no symbols, no color coding etc
Books: Learning to See, Lean Thinking14
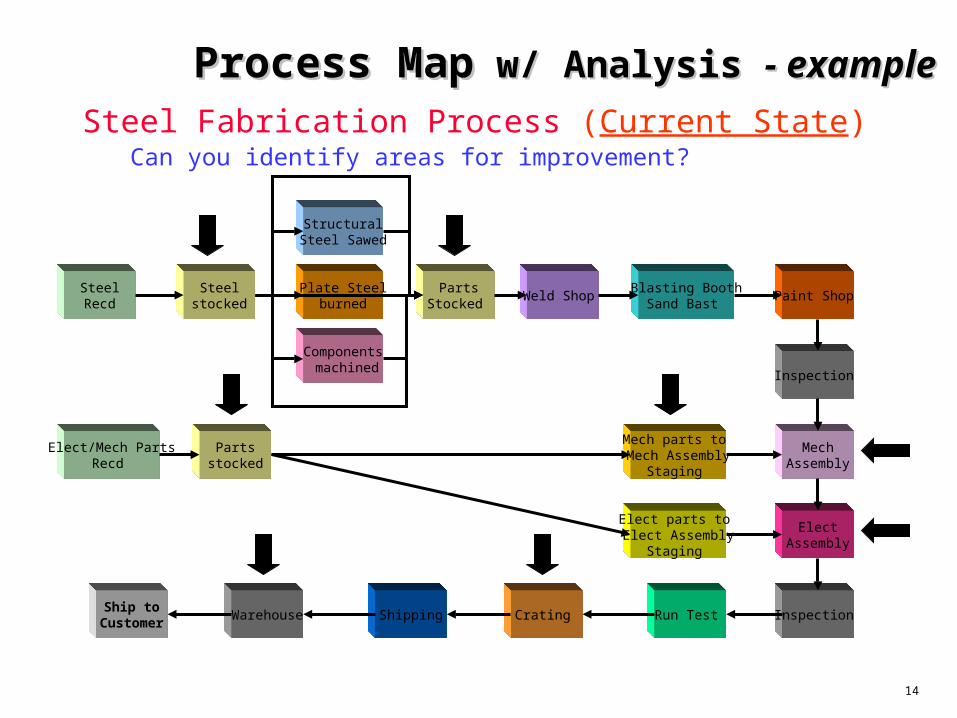
Process MapProcess Map w/ Analysis w/ Analysis - example- example
SteelRecd
PartsStocked
Components machined
Plate Steelburned
StructuralSteel Sawed
Steelstocked
Weld Shop Paint Shop
Elect/Mech PartsRecd
Blasting BoothSand Bast
Mech parts to Mech Assembly
Staging
Partsstocked
Inspection
MechAssembly
Elect parts to Elect Assembly
Staging
ElectAssembly
Inspection Run Test Crating ShippingWarehouseShip to
Customer
Steel Fabrication Process (Current State) Can you identify areas for improvement?
Books: Learning to See, Lean Thinking15
SteelRecd
Components machined
Plate Steelburned
StructuralSteel Sawed
Weld Shop Paint Shop
Elect/Mech PartsRecd
Blasting BoothSand Bast
All parts to AssemblyStaging
Inspection
Mech/ElectAssembly
Inspection &Run Test
Ship toCustomer
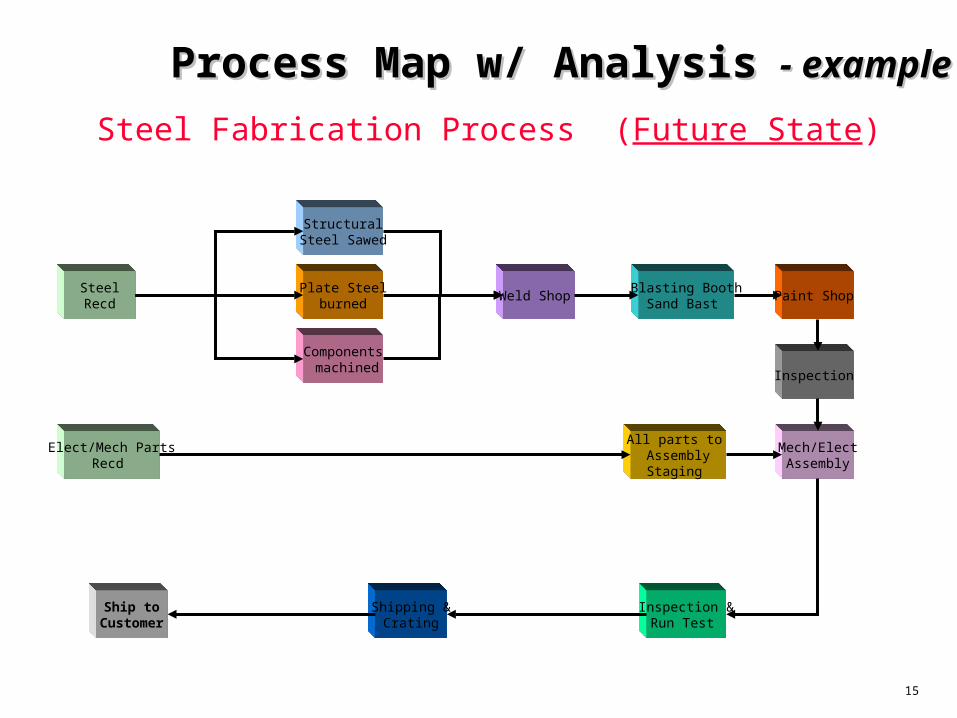
Steel Fabrication Process (Future State)
Shipping &Crating
Process Map w/ AnalysisProcess Map w/ Analysis - example- example

Impact of “Immediate Opportunities”Impact of “Immediate Opportunities”Impact of “Immediate Opportunities”Impact of “Immediate Opportunities”
The Process Map good place to start process analysis activities:
• Safety issues resolved first !
• Visible results in areas Kaizened
• “Low hanging fruit” addressed
Product flows more smoothlythrough that part of the stream
Many pockets of success …
But –Process Maps have limited impact on the total VALUE STREAM

Process Map (functional)Process Map (functional)
Product Family or Main Process/ Information Flow
(door to door)
Product Family or Main Process/ Information Flow
(door to door)
Many products/ information flows share the Many products/ information flows share the same major stepssame major stepsMany products/ information flows share the Many products/ information flows share the same major stepssame major steps
“Value Stream”
Operational Level (SIPOC)Operational Level (SIPOC)
Material and Information FlowsMaterial and Information FlowsMaterial and Information FlowsMaterial and Information Flows
In Process Analysis, the information flow (paper) is treated with just as much importance as the material flow.
Focus on one product family
or “major line”
or
Administrative Procedure.
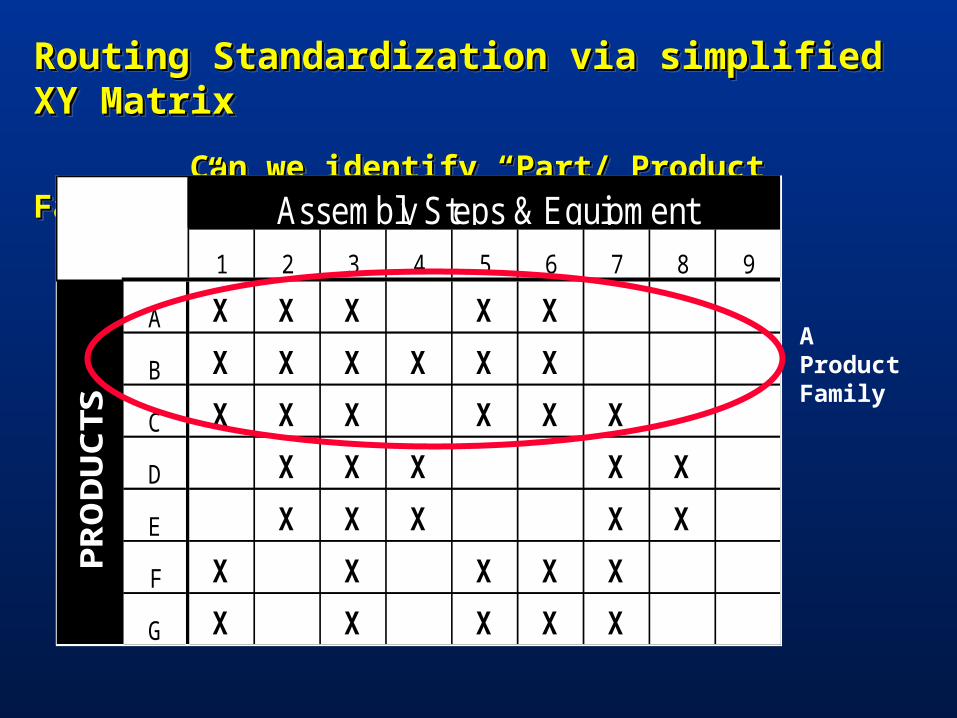
Routing Standardization via simplified XY MatrixRouting Standardization via simplified XY Matrix
Can we identify “Part/ Product Families” ?Can we identify “Part/ Product Families” ?
Routing Standardization via simplified XY MatrixRouting Standardization via simplified XY Matrix
Can we identify “Part/ Product Families” ?Can we identify “Part/ Product Families” ?
1 2 3 4 5 6 7 8 9
A X X X X X
B X X X X X X
C X X X X X X
D X X X X X
E X X X X X
F X X X X X
G X X X X X
Assembly Steps & Equipment
PR
OD
UC
TS
A Product Family

Production Systembased on Customer pull rate
Just-in-Time (JIT)
Making Products at the Right Time Based on When They’re Sold
Autonomation (Jidoka)
Stop at Every Abnormality
Leveled Production
People
Equipment
Information
Engineering
Raw Material
Wip / Sub Assy’s
Finished Product
Document flow of information and material !
What will be seen?What will be seen?What will be seen?What will be seen?

Value Stream Mapping (VSM)Value Stream Mapping (VSM) builds on Process Mappingbuilds on Process MappingValue Stream Mapping (VSM)Value Stream Mapping (VSM) builds on Process Mappingbuilds on Process Mapping
Quality
Speed
Safety

Value Stream MappingValue Stream MappingValue Stream MappingValue Stream Mapping
• Let’s look at an EXAMPLE with data, color codes etc

Supplier
Prep Mach
Assy
Insp
ShipStage Insp Store
C/T 15 minBatch 12Req 450 pcs
Q/T 480WIP150
Dist 285”8 per day
Q/T 60 min50 pcs
C/T 1 minReq 450
C/T 8 minBatch 6
Dist 30”8 per day
Q/T 60 min50 pcs
C/T 5 minReq 450Oper 5
C/T 5 minReq 450Oper 2.5
Dist 400”8 per day
Dist 50”20 per day
Q/T 480WIP150
C/T 85 min10 Orders
Store
Customer
StageStore
Rec 90001 deliver each month
(Current State)
Move Move
Move Move
Value Stream Map - Value Stream Map - exampleexampleValue Stream Map - Value Stream Map - exampleexample
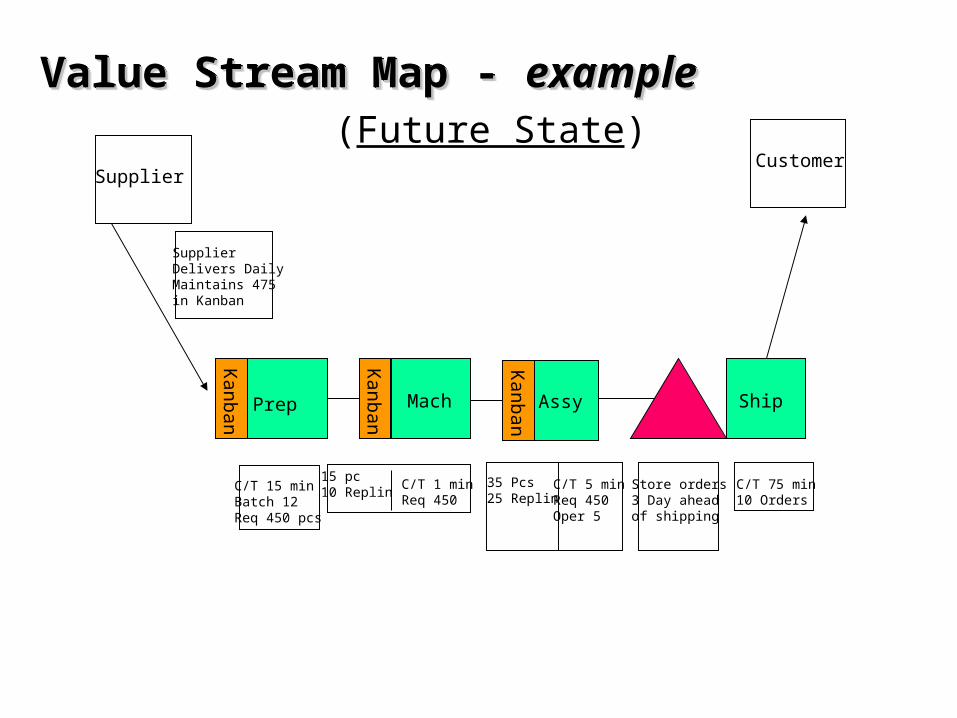
Prep
C/T 15 minBatch 12Req 450 pcs
Mach
C/T 1 minReq 450
Assy
C/T 5 minReq 450Oper 5
Ship
C/T 75 min10 Orders
Kan
ban
Kan
ban
15 pc10 Replin
Store orders3 Day ahead of shipping
Supplier
Kan
ban
Customer
Supplier Delivers DailyMaintains 475 in Kanban
35 Pcs25 Replin
(Future State)
Value Stream Map - Value Stream Map - exampleexampleValue Stream Map - Value Stream Map - exampleexample

Value Stream MappingValue Stream MappingBest PracticesBest Practices
• Always map in pencil - rough out 1st, clean later.• Start at the customer and work backwards.• Don’t be too detailed at first, list major process steps.• Walk the actual material and information flows yourself.• Start with a quick walk, to get a feel for the flow and sequence then, go back and talk to the right people for each step. (Don’t forget second and third shifts)
Don’t map the organization. Map the flows through the organization.Don’t map the organization. Map the flows through the organization.

Value Stream MappingValue Stream MappingBest PracticesBest Practices
• Color Code the operations. (Red, Yellow, Green)• Add cycle time, wait time, travel time, quantities, yields, inventory, and number of machines/ operators required.• Always collect ‘current-state’ information while waking along the actual pathways of material and information flows.• Map current and future state. (With Timelines and Target Dates)• Involve the Management team totally.
Don’t map the organization. Map the flows through the organization.Don’t map the organization. Map the flows through the organization.
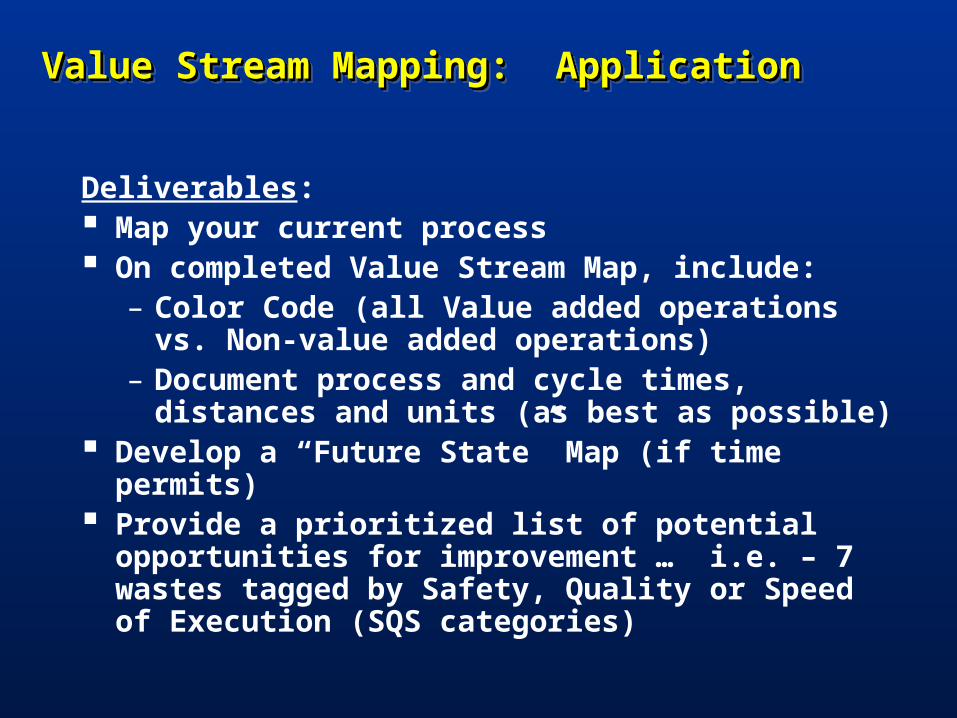
Value Stream Mapping: ApplicationValue Stream Mapping: ApplicationValue Stream Mapping: ApplicationValue Stream Mapping: Application
Deliverables: Map your current process On completed Value Stream Map, include:
– Color Code (all Value added operations vs. Non-value added operations)
– Document process and cycle times, distances and units (as best as possible)
Develop a “Future State” Map (if time permits) Provide a prioritized list of potential opportunities
for improvement … i.e. – 7 wastes tagged by Safety, Quality or Speed of Execution (SQS categories)
Books: Learning to See, Lean Thinking28
Value Stream Symbols Value Stream Symbols and Definitionsand Definitions
Addendum
Value Stream Symbols Value Stream Symbols and Definitionsand Definitions
Addendum
Books: Learning to See, Lean Thinking29
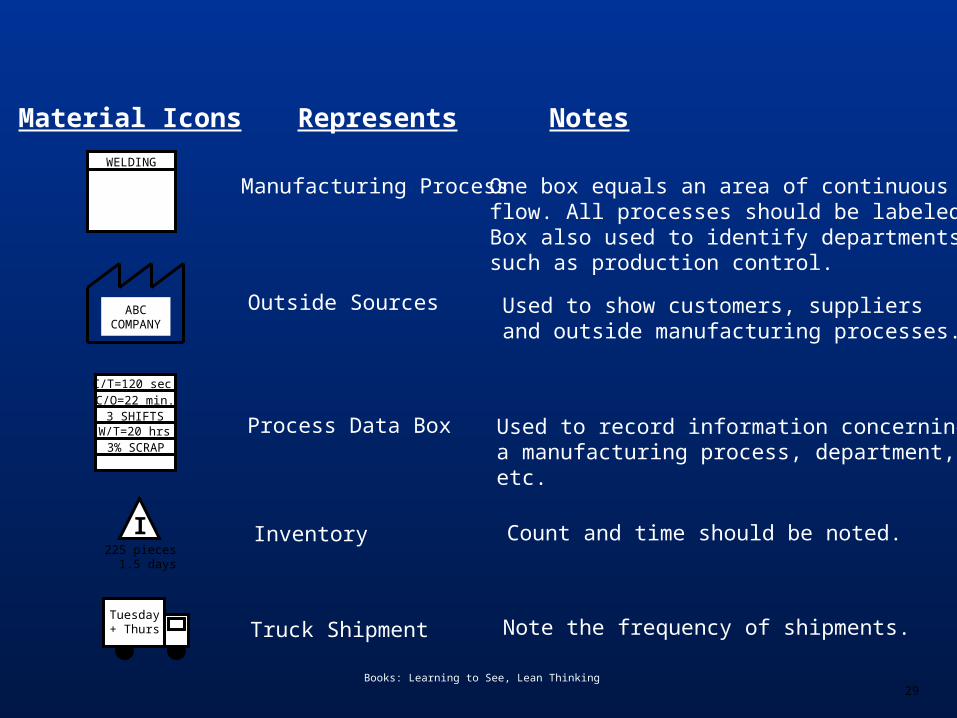
Manufacturing Process
Process Data Box
I
Truck Shipment
Inventory
Material Icons Represents Notes
Outside Sources
One box equals an area of continuousflow. All processes should be labeled.Box also used to identify departmentssuch as production control.
Used to show customers, suppliersand outside manufacturing processes.
WELDING
ABCCOMPANY
C/T=120 sec.C/O=22 min.
3 SHIFTS
3% SCRAPW/T=20 hrs Used to record information concerning
a manufacturing process, department,etc.
Count and time should be noted.225 pieces 1.5 days
Tuesday+ Thurs Note the frequency of shipments.
Books: Learning to See, Lean Thinking30
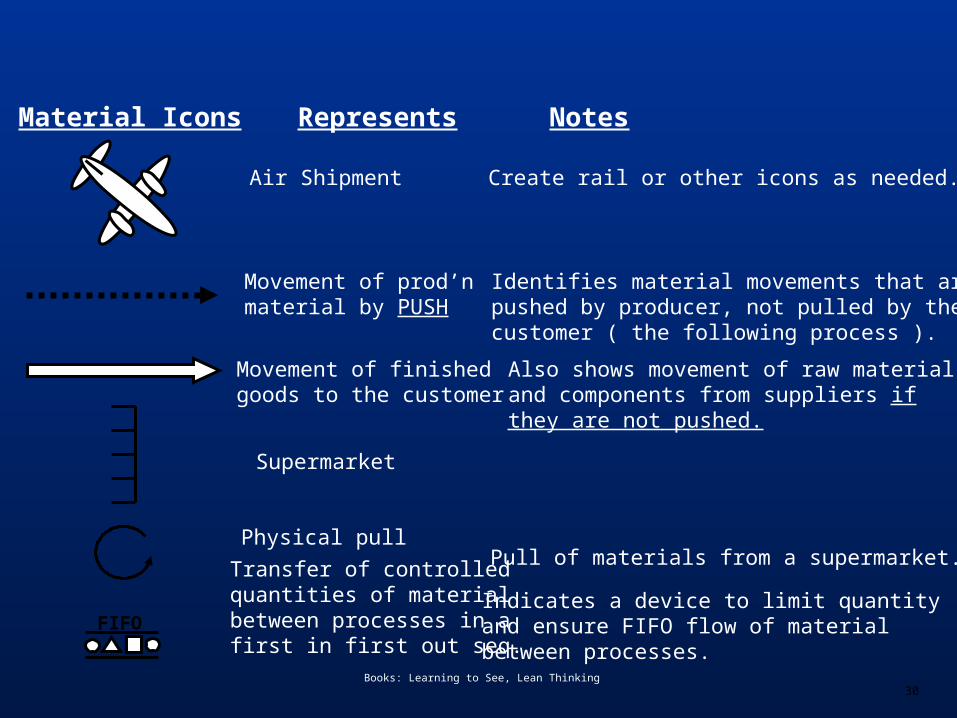
Material Icons Represents Notes
FIFO
Air Shipment
Movement of prod’nmaterial by PUSH
Movement of finishedgoods to the customer
Supermarket
Physical pull
Transfer of controlledquantities of material between processes in afirst in first out seq.
Create rail or other icons as needed.
Identifies material movements that arepushed by producer, not pulled by the customer ( the following process ).
Also shows movement of raw materialand components from suppliers ifthey are not pushed.
Pull of materials from a supermarket.
Indicates a device to limit quantityand ensure FIFO flow of materialbetween processes.
Books: Learning to See, Lean Thinking31
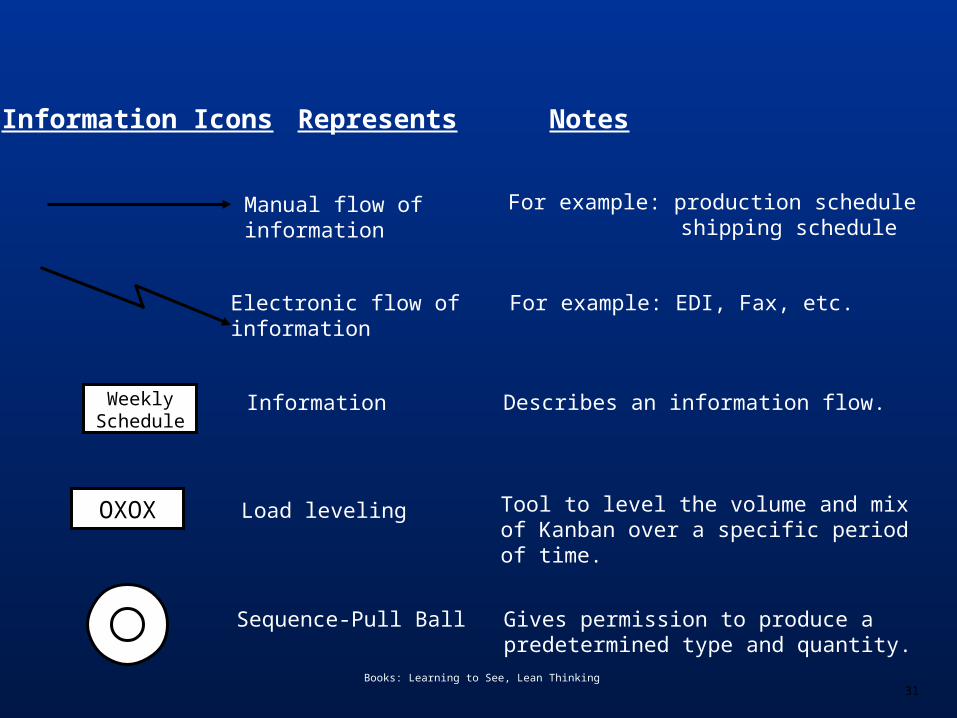
Information Icons Represents Notes
Manual flow ofinformation
Electronic flow ofinformation
For example: production schedule shipping schedule
For example: EDI, Fax, etc.
OXOX Load leveling
Sequence-Pull Ball
Tool to level the volume and mixof Kanban over a specific periodof time.
Gives permission to produce apredetermined type and quantity.
WeeklySchedule
Information Describes an information flow.

Books: Learning to See, Lean Thinking32
Information Icons Represents Notes
20 Production Kanban
Withdrawal Kanban
Signal Kanban
Kanban post
Tells a process how many of whatcan be produced and gives permissionto do so.
Production instruction that ordersproduction from a batch process,eg: stamping.
Place where Kanban are collectedand held for conveyance .
Tells a process how many of whatcan be withdrawn and gives permissionto do so.
Books: Learning to See, Lean Thinking33
LatheChangeover
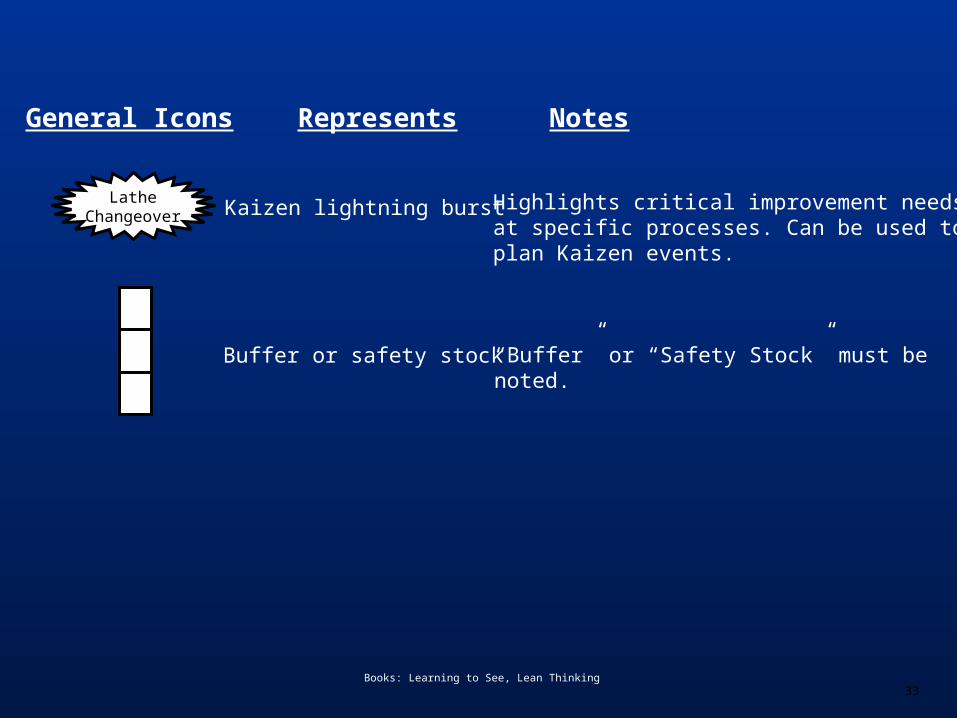
General Icons Represents Notes
Kaizen lightning burst
Buffer or safety stock
Highlights critical improvement needsat specific processes. Can be used toplan Kaizen events.
“Buffer” or “Safety Stock” must benoted.

The Lean EnterpriseThe Lean EnterpriseThe Lean EnterpriseThe Lean EnterpriseValue Stream MappingValue Stream Mapping
Lean Foundations
Continuous Improvement Training
Lean Foundations
Continuous Improvement Training


