
The Peak in World Oil Supply
Dr. Peter R. A. Wells
September 2008

AcknowledgementsAcknowledgements• Data Sources
– IHS – crude oil field data (except USA)– International Oil Scouts Association (USA)– Our own database and analyses for oil fields (Iran, Iraq,
Saudi Arabia)– IEA, EIA, BP, UK DTI, NPD, government agencies in
Australia, Canada, USA (MMS, states of California, Oklahoma, Texas, Ohio, Louisiana etc)
– Permission to publish analysis derived from the IHS database
© Peter R.A. Wells

North America
South & Central America
Europe and Eurasia
Middle East
AfricaAsia Pacific
0
20,000
40,000
60,000
80,000
100,000
120,000
140,000
1965 1970 1975 1980 1985 1990 1995 2000 2005 2010 2015 2020 2025 2030
000
b/d
EIA 2007 Reference CaseCERA 2006 Asian PhoenixIEA 2006 Alternative Policy ScenarioIEA 2006 Deferred Investment CaseIEA 2007 Reference Case
Is growth in oil consumption sustainable?Is growth in oil consumption sustainable?
Data from BP Statistical Review of World Energy, EIA, IEA and CERA
© Peter R.A. Wells

0
5
10
15
20
25
30
0 200 400 600 800 1,000 1,200 1,400 1,600Population, millions
Per C
apita
Oil
Con
sum
tion,
b/y
Are Asian aspirations realisable?Are Asian aspirations realisable?
USA
W EurJapanS Korea
FSU
Sub Saharan Africa
India China
?
Data from BP Statistical Review of World Energy and UN
© Peter R.A. Wells

What do we mean by What do we mean by ““OilOil”” or or ““liquidsliquids””??• Crude oil including condensate produced with crude oil at the
separator
• Natural gas liquids (NGLs): natural gas plant liquids (NGPLs) produced from associated and non-associated gas fields and condensate produced from non-associated gas fields
• Tar sands: Syncrude/bitumen extracted from tar sands
• GTL and CTL: Liquids produced in gas-to-liquids and coal-to-liquids plants
• Liquid biofuels: ethanol, biodiesel etc.
• Shale oil: oil extracted from oil shale
• Other hydrocarbon liquids: orimulsion, MTBE etc.
• Refinery Gains: Net liquid gains in refining crude oil due mainly to hydrogenation
© Peter R.A. Wells

Components of supplyComponents of supply
Crude Oil
NGLs
Biofuels
Canadian Tar sands
0
10,000,000
20,000,000
30,000,000
40,000,000
50,000,000
60,000,000
70,000,000
80,000,000
90,000,000
1950 1955 1960 1965 1970 1975 1980 1985 1990 1995 2000 2005
b/d
Historical production data from our own database derived from EIA, IEA, BP Statistical Review of World Energy and national publicly available databases
1.0%1.6%
11.4%
86.0%
© Peter R.A. Wells

USA
Rest of Non-OPEC
FSU
OPEC
0
10,000,000
20,000,000
30,000,000
40,000,000
50,000,000
60,000,000
70,000,000
80,000,000
1950 1955 1960 1965 1970 1975 1980 1985 1990 1995 2000 2005
b/d
Components of crude oilComponents of crude oil
42.8%
16.2%
33.9%
7.1%
Historical production data from our own database derived from EIA, IEA, BP Statistical Review of World Energy and national publicly available databases
© Peter R.A. Wells
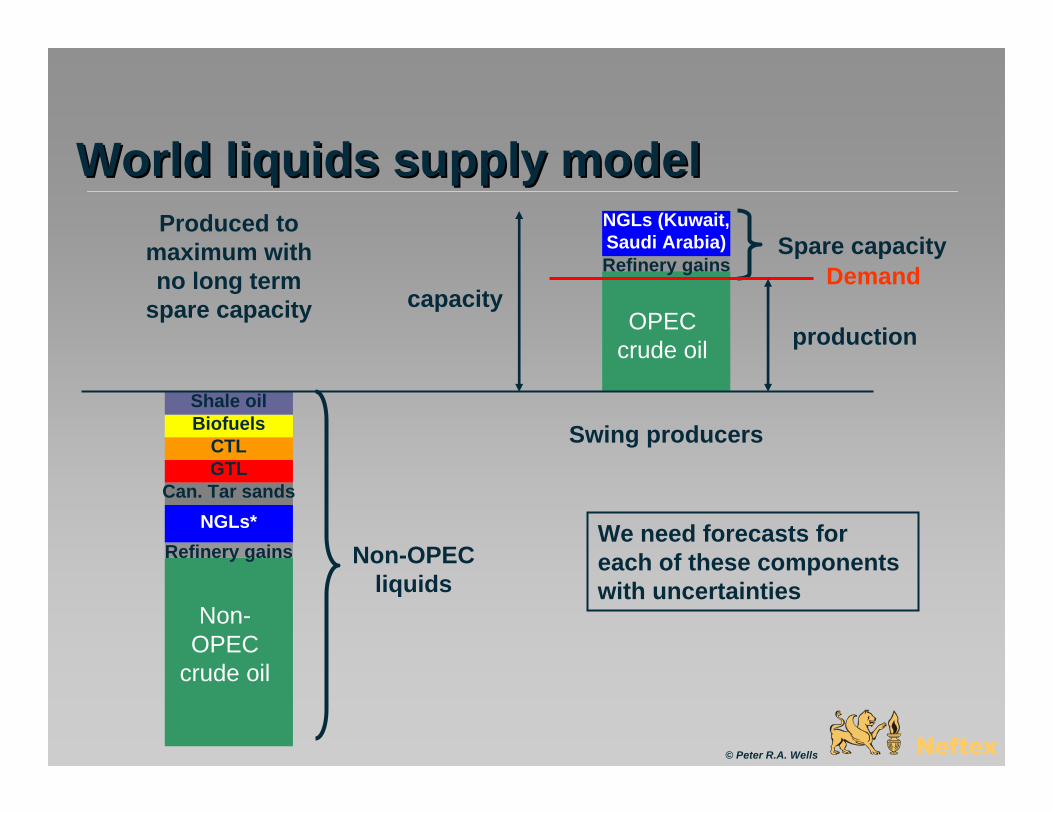
World liquids supply modelWorld liquids supply model
Non-OPEC
crude oil
Refinery gainsNGLs*
Can. Tar sands
Shale oilBiofuels
GTLCTL
OPEC crude oil
NGLs (Kuwait, Saudi Arabia)Refinery gains
Produced to maximum with no long term
spare capacity
Non-OPEC liquids
Spare capacity
Swing producers
Demandcapacity
production
© Peter R.A. Wells
We need forecasts for each of these components with uncertainties
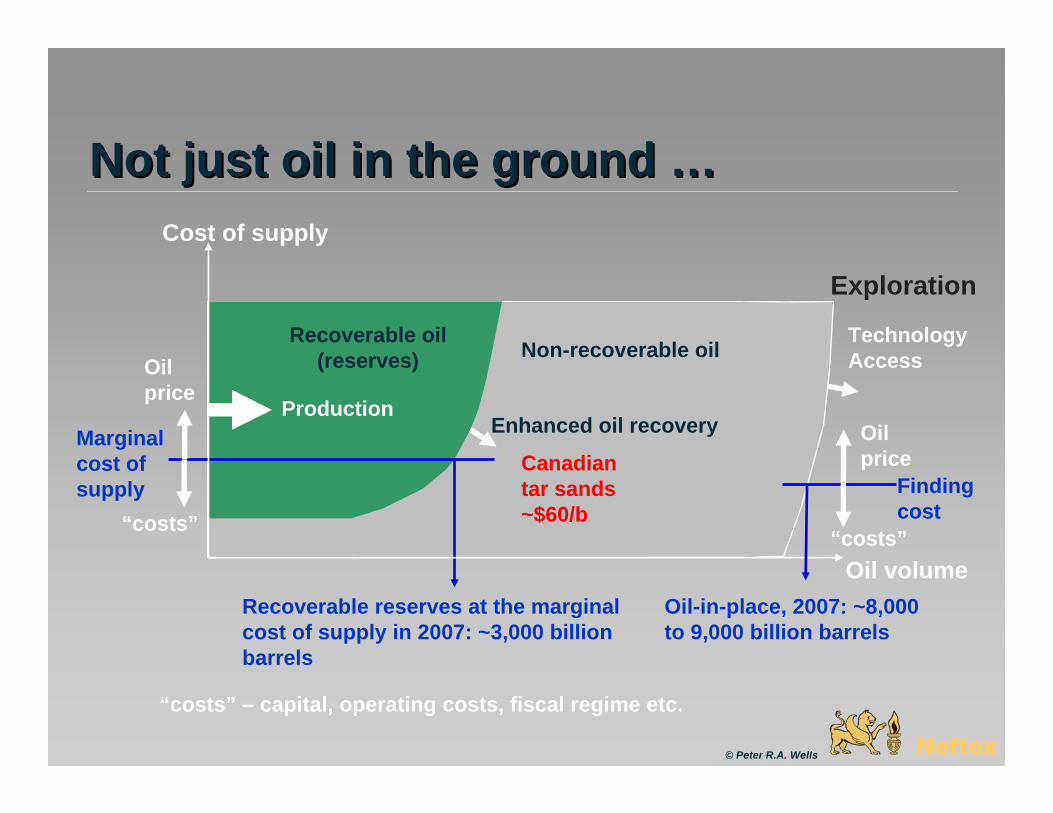
Not just oil in the ground Not just oil in the ground ……
Recoverable oil (reserves) Non-recoverable oil
Exploration
Oil price
Enhanced oil recoveryMarginal cost of supply
Recoverable reserves at the marginal cost of supply in 2007: ~3,000 billion barrels
Oil-in-place, 2007: ~8,000 to 9,000 billion barrels
Cost of supply
Oil volume
Production
Finding cost
Oil price
Technology Access
Canadian tar sands ~$60/b“costs”
“costs”
© Peter R.A. Wells
“costs” – capital, operating costs, fiscal regime etc.
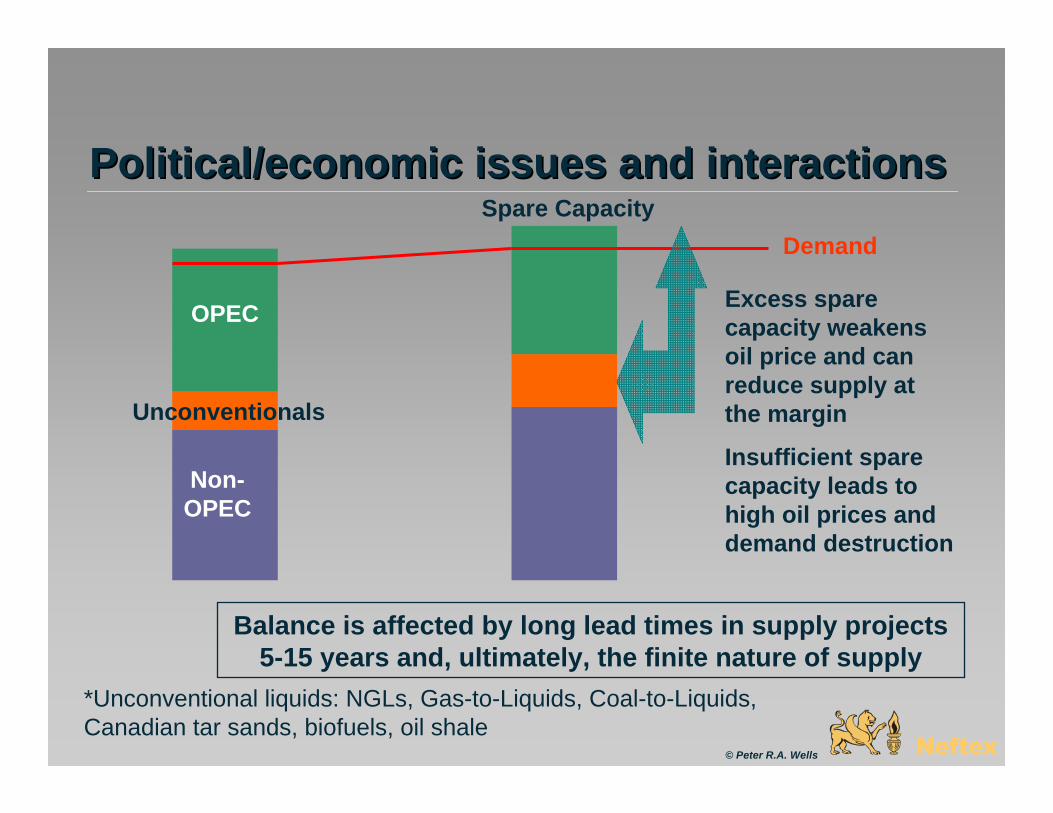
Political/economic issues and interactionsPolitical/economic issues and interactions
Non-OPEC
OPEC
Unconventionals
*Unconventional liquids: NGLs, Gas-to-Liquids, Coal-to-Liquids, Canadian tar sands, biofuels, oil shale
Spare CapacityDemand
Excess spare capacity weakens oil price and can reduce supply at the margin
Insufficient spare capacity leads to high oil prices and demand destruction
© Peter R.A. Wells
Balance is affected by long lead times in supply projects 5-15 years and, ultimately, the finite nature of supply

Spare capacity and oil priceSpare capacity and oil price
0
10
20
30
40
50
60
70
80
90
100
1970 1975 1980 1985 1990 1995 2000 2005
Rea
l oil
pric
e (2
007)
, $/b
0
2,000,000
4,000,000
6,000,000
8,000,000
10,000,000
12,000,000
spar
e ca
paci
ty, b
/d
Price floor set by the needs of the Saudi Arabian budget
Oil price Spare Capacity
Spare capacity from IMF, PIW, OPEC
Oil price from BP
© Peter R.A. Wells
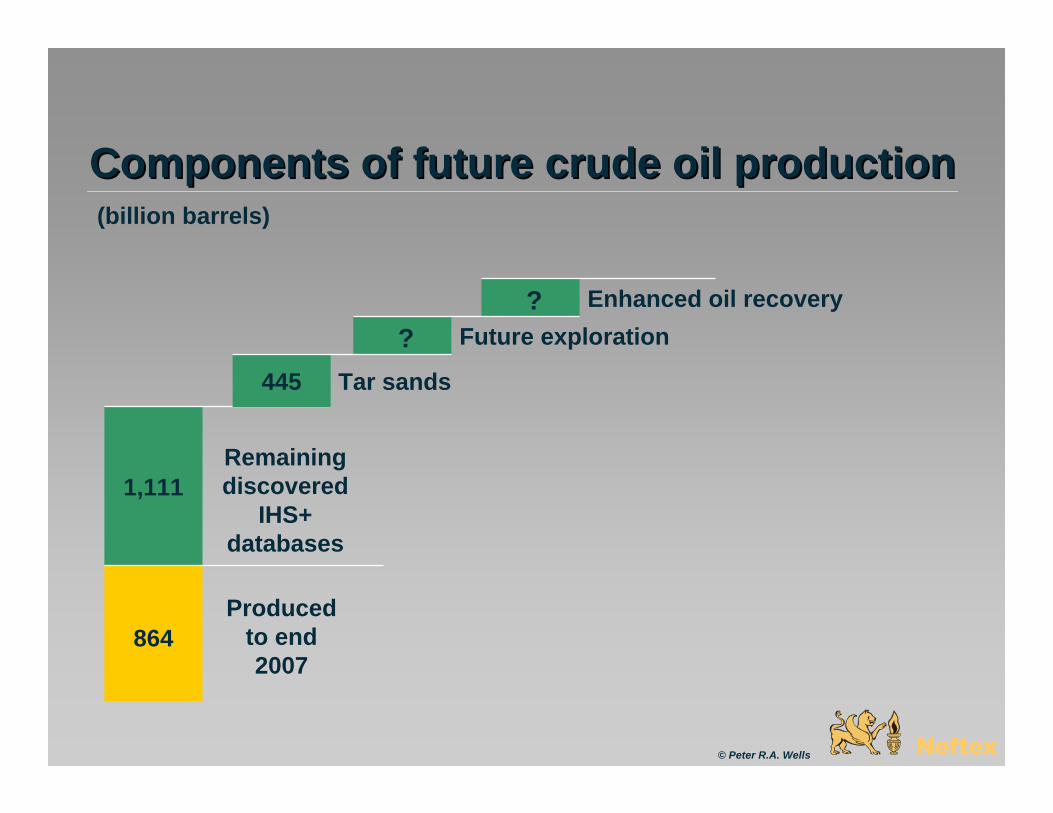
Components of future crude oil productionComponents of future crude oil production
© Peter R.A. Wells
??
864
1,111
(billion barrels)
Produced to end 2007
Remaining discovered
IHS+ databases
Future explorationEnhanced oil recovery
Tar sands445

Future Exploration SuccessFuture Exploration Success
© Peter R.A. Wells
0
200
400
600
800
1,000
1,200
1,400
1,600
1,800
USGS CERA Neftex
billi
on b
arre
ls
mean
mean
P5
P95
P95
P5
USGS/CERA 3 x Saudi Arabia?? 45% of past discoveries?? 150 years to 2,000 bln b, but only 30 years to 900 billion b?? Requires discovery rate of 36 blnb/year – Only achieved 12 blnb/year between 1995 and 2007
Neftex1 x Saudi Arabia 15% of past discoveries Requires discovery rate of 13 blnb/year (2008 to 2020) declining to 5 bln b/year in 2030

0
10,000
20,000
30,000
40,000
50,000
60,000
70,000
1850 1870 1890 1910 1930 1950 1970 1990 2010 2030 2050
mill
ion
barr
els
OPECFSURest of non-OPEC less FSUUSA
Future exploration success Future exploration success -- based on based on USGS/CERA viewUSGS/CERA view
Raw field reserves data and exploration success history for OPEC, FSU and rest of non-OPEC from IHS and for USA from the International Oil Scouts Association
Forecast exploration success from our Monte Carlo simulator
USGS 2000
© Peter R.A. Wells
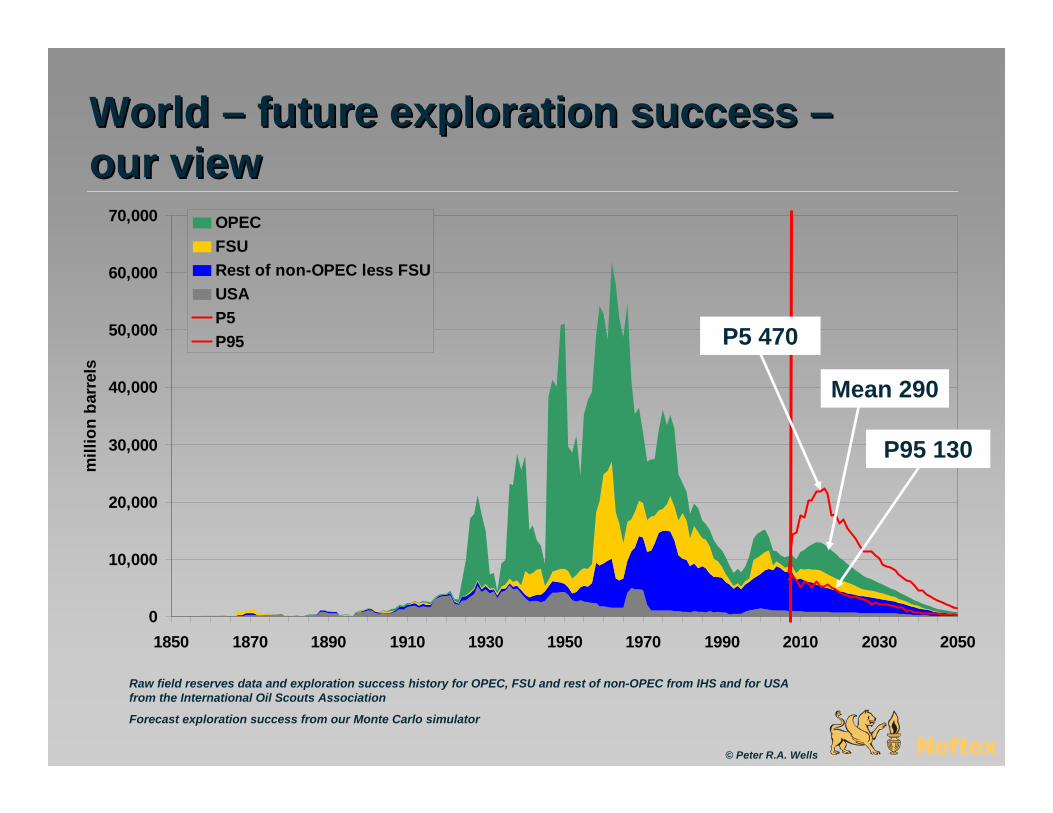
World World –– future exploration success future exploration success ––our viewour view
Raw field reserves data and exploration success history for OPEC, FSU and rest of non-OPEC from IHS and for USA from the International Oil Scouts Association
Forecast exploration success from our Monte Carlo simulator
0
10,000
20,000
30,000
40,000
50,000
60,000
70,000
1850 1870 1890 1910 1930 1950 1970 1990 2010 2030 2050
mill
ion
barr
els
OPECFSURest of non-OPEC less FSUUSAP5P95
© Peter R.A. Wells
P5 470
Mean 290
P95 130

Improved Oil Recovery (IOR)Improved Oil Recovery (IOR)
© Peter R.A. Wells
production
time
production
time
Oil pulled forward from the tail – “accelerated” no
reserves added
Additional reserves extracted
Enhanced Oil Recovery
“Field Upgrades”
Technologies:
Miscible non hydrocarbon gas (CO2, N2) floods, thermal, chemical
Technologies:
Horizontal wells, multilateral wells, MRC wells, smart wells, smart fields, gas lift, pumps, fracturing
AIM is to recover more of the oil profitably - MAY increase reserves
AIM is to raise and extend production BY increasing reserves

Major New Technologies take timeMajor New Technologies take time
• Horizontal wells were first drilled in 1929
• Early 1980s, USSR developed drilling technologies for long radius wells making them widely applicable
• In 2000, 24,000 horizontal wells were drilled
• Technology took ~15-20 years to become widespread
• If it is not under development today, it will not have much impact until after 2025
© Peter R.A. Wells

USA experience with Enhanced Oil USA experience with Enhanced Oil Recovery (EOR)Recovery (EOR)
0
100,000
200,000
300,000
400,000
500,000
600,000
700,000
800,000
1980 1982 1984 1986 1988 1990 1992 1994 1996 1998 2000 2002 2004 2006
b/d
Thermal (steam injection)
Miscible non-hydrocarbon gas injection
(CO2, N2 injection)
Chemical floods
© Peter R.A. Wells

USA experience of EOR USA experience of EOR –– specific to field, specific to field, reservoir, oil type, locationreservoir, oil type, location
• Thermal/Steam: Heavy oils in good reservoirs above 900 metres depth – thermal methods such as steam injection can increase reserves considerably (add up to 40% of OIIP to recovery) (California, Oman, some Persian Gulf fields, Venezuela (not tar sands))
• CO2: Light to medium oils in poor reservoirs (few fractures) –miscible non-hydrocarbon gas injection (CO2, N2) can add 8-17% of OIIP to recovery to reserves (Permian Basin USA, some Persian Gulf oil fields)
• No Gains: Light-medium oils in good quality reservoirs achieve high recovery rates (>65%) from water or hydrocarbon gas injection – EOR cannot add much to recovery and reserves (North Sea, West African and Gulf of Mexico fields)
© Peter R.A. Wells
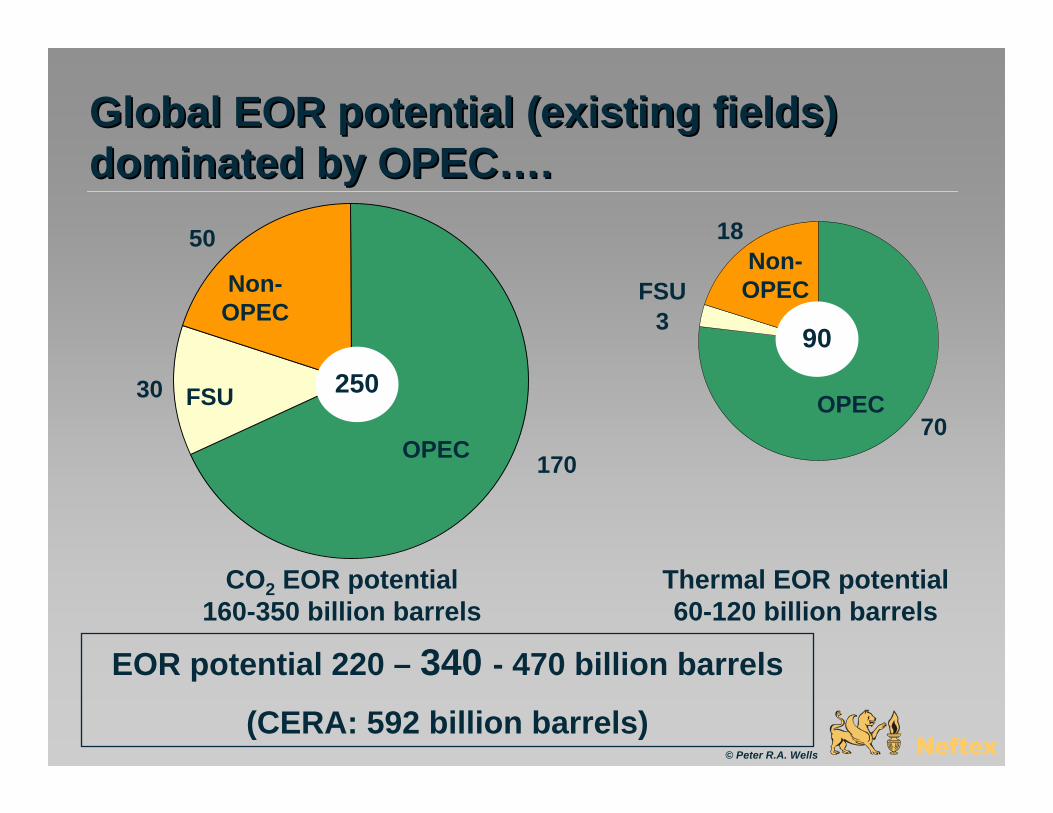
Global EOR potential (existing fields) Global EOR potential (existing fields) dominated by OPECdominated by OPEC……..
70
18
3
OPEC
Non-OPEC
FSU OPEC
Non-OPECFSU
CO2 EOR potential 160-350 billion barrels
Thermal EOR potential 60-120 billion barrels
170
30
50
EOR potential 220 – 340 - 470 billion barrels
(CERA: 592 billion barrels)
25090
© Peter R.A. Wells

World (potential) crude oil volumesWorld (potential) crude oil volumes……. .
© Peter R.A. Wells
290340
864
1,111
(billion barrels)
Produced to end 2007
Remaining discovered
IHS+ databases
Future explorationEnhanced oil recovery
Tar sands445
130-470220-470
3,050TOTAL conventional
crude oil, 2,600
Simulation Model approach to crude oil Simulation Model approach to crude oil forecasting forecasting
• If a field has not been discovered it cannot be produced or enhanced – model starts with the discovery history (proven + probable (2P) reserves and date of discovery)
• Model is built up using individual fields –– Real discovered fields in the IHS or other databases
discovered to the end of 2007 (10s of thousands)– Modelled yet-to-be-discovered fields based on
forecast exploration success after 2007 (10s of thousands)
• Preserves the granularity of individual oil fields throughout the forecast and continuity of methodology
© Peter R.A. Wells

Simulation Model approach to crude Simulation Model approach to crude oil forecasting oil forecasting
© Peter R.A. Wells
Past discoveries Future
discoveries
Country Field Date discovery 2P reserves A 1 1890 500 B 2 1910 45 …… ….. …… ……
Country Field Date discovery 2P reserves A 1 2008 900 B 2 2009 320 …… ….. …… ……
Field size
time
Probability distributions for
time between discovery and
production
time
Probability distributions for
shape of production
profile
Field size
+ + + +
+ …..10s of thousands of fields0
5,000,000
10,000,000
15,000,000
20,000,000
25,000,000
30,000,000
35,000,000
40,000,000
45,000,000
1950 1960 1970 1980 1990 2000 2010 2020 2030 2040 2050
b/d
Simulation Model approach to crude oil Simulation Model approach to crude oil forecasting forecasting
• A simulation model provides a direct link between exploration success/Enhanced Oil Recovery (EOR) and production on the scale of individual oil fields
• Uncertainties in input are properly carried through and expressed as uncertainties in the forecast
• If a calibrated simulation model can replicate historical production closely then we can have confidence in its forecasts (history match)
• To test the model, we have history matched:– USA– Non OPEC less USA, less FSU (ROW)– FSU
© Peter R.A. Wells
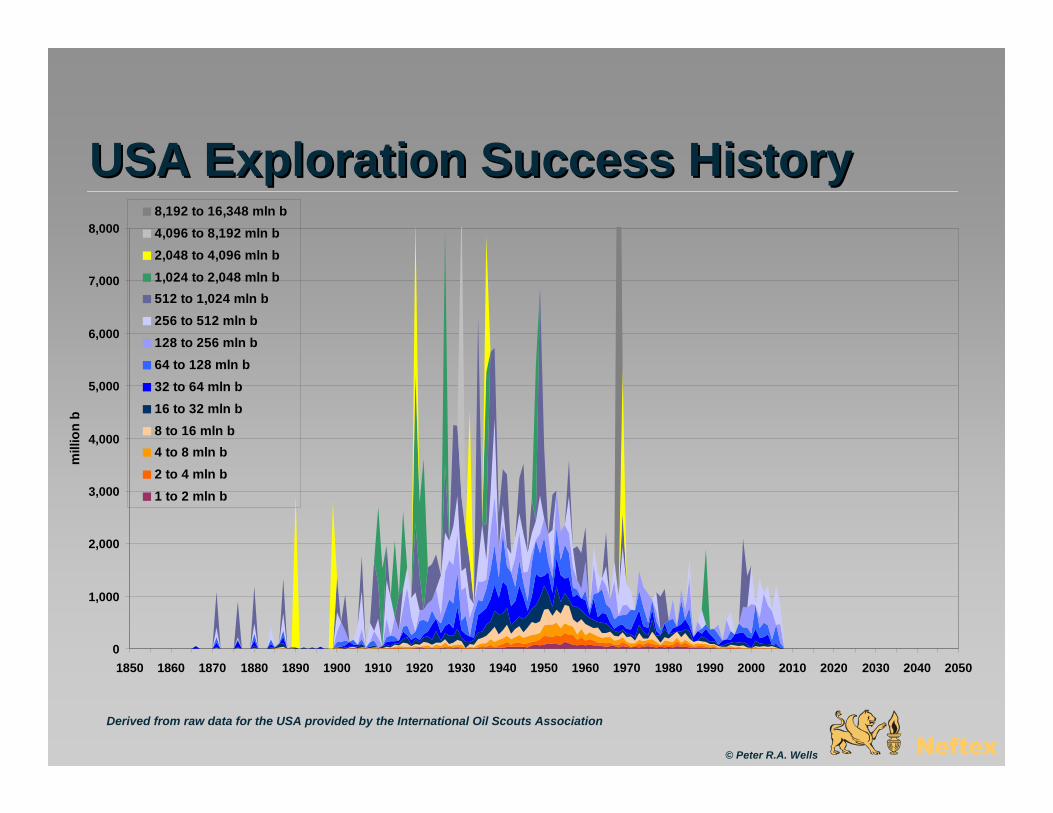
USA Exploration Success HistoryUSA Exploration Success History
0
1,000
2,000
3,000
4,000
5,000
6,000
7,000
8,000
1850 1860 1870 1880 1890 1900 1910 1920 1930 1940 1950 1960 1970 1980 1990 2000 2010 2020 2030 2040 2050
mill
ion
b
8,192 to 16,348 mln b4,096 to 8,192 mln b2,048 to 4,096 mln b1,024 to 2,048 mln b512 to 1,024 mln b256 to 512 mln b128 to 256 mln b64 to 128 mln b32 to 64 mln b16 to 32 mln b8 to 16 mln b4 to 8 mln b2 to 4 mln b1 to 2 mln b
Derived from raw data for the USA provided by the International Oil Scouts Association
© Peter R.A. Wells

History matching History matching -- USAUSA
0
1,000,000
2,000,000
3,000,000
4,000,000
5,000,000
6,000,000
7,000,000
8,000,000
9,000,000
10,000,000
1850 1860 1870 1880 1890 1900 1910 1920 1930 1940 1950 1960 1970 1980 1990 2000 2010 2020 2030 2040 2050
b/d
1 to 2 mln b2 to 4 mln b4 to 8 mln b8 to 16 mln b16 to 32 mln b32 to 64 mln b64 to 128 mln b128 to 256 mln b256 to 512 mln b512 to 1,024 mln b1,024 to 2,048 mln b2,048 to 4,096 mln b4,096 to 8,192 mln b8,192 to 16,348 mln bUSA crude oil production
Derived from raw data for the USA provided by the International Oil Scouts Association
Actual production profile from our own database
© Peter R.A. Wells
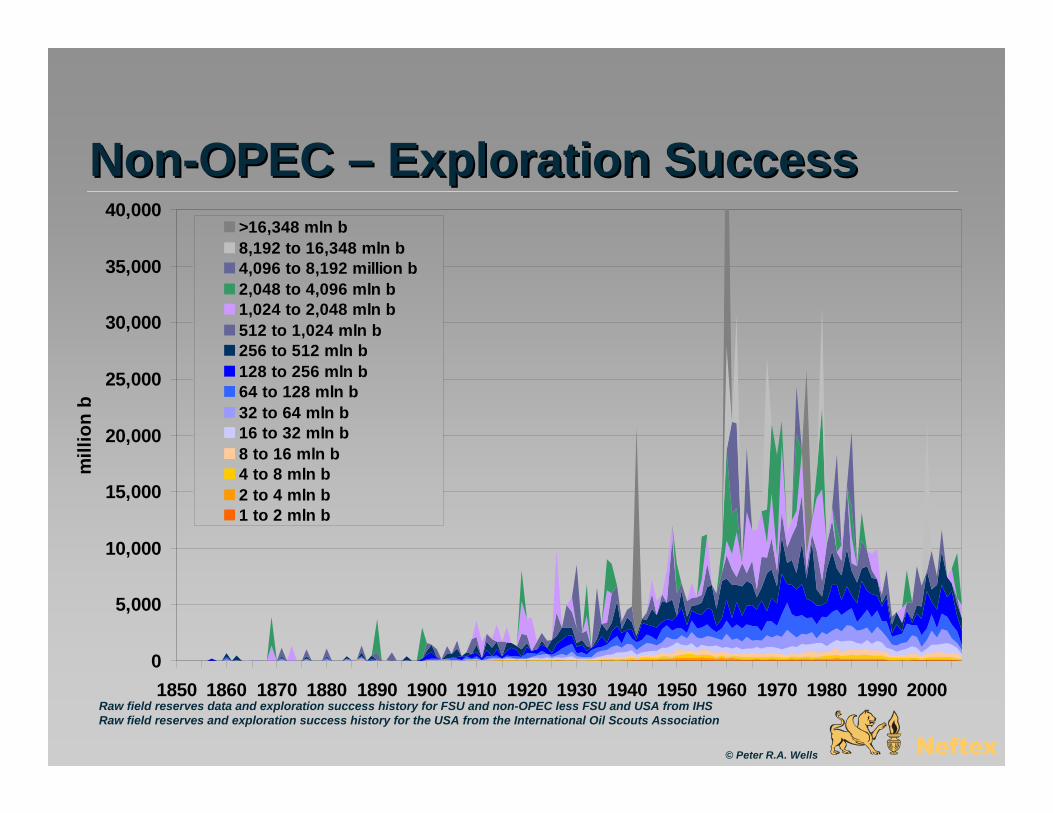
NonNon--OPEC OPEC –– Exploration SuccessExploration Success
Raw field reserves data and exploration success history for FSU and non-OPEC less FSU and USA from IHSRaw field reserves and exploration success history for the USA from the International Oil Scouts Association
0
5,000
10,000
15,000
20,000
25,000
30,000
35,000
40,000
1850 1860 1870 1880 1890 1900 1910 1920 1930 1940 1950 1960 1970 1980 1990 2000
mill
ion
b
>16,348 mln b8,192 to 16,348 mln b4,096 to 8,192 million b2,048 to 4,096 mln b1,024 to 2,048 mln b512 to 1,024 mln b256 to 512 mln b128 to 256 mln b64 to 128 mln b32 to 64 mln b16 to 32 mln b8 to 16 mln b4 to 8 mln b2 to 4 mln b1 to 2 mln b
© Peter R.A. Wells

History Matching History Matching –– NonNon--OPECOPEC
Raw field reserves data and exploration success history from IHS and International Oil Scouts Association
Actual production profile from our own database
Forecast model profile from the Monte Carlo Simulation
0
5,000,000
10,000,000
15,000,000
20,000,000
25,000,000
30,000,000
35,000,000
40,000,000
45,000,000
1850 1860 1870 1880 1890 1900 1910 1920 1930 1940 1950 1960 1970 1980 1990 2000 2010 2020 2030 2040 2050
b/d
© Peter R.A. Wells

History Matching History Matching –– NonNon--OPECOPEC
0
5,000,000
10,000,000
15,000,000
20,000,000
25,000,000
30,000,000
35,000,000
40,000,000
45,000,000
1950 1960 1970 1980 1990 2000 2010 2020 2030 2040 2050
b/d
Raw field reserves data and exploration success history from IHS and International Oil Scouts Association
Actual production profile from our own database
Forecast model profile from the Monte Carlo Simulation © Peter R.A. Wells

Most nonMost non--OPEC, non FSU oil fields are OPEC, non FSU oil fields are offshore offshore –– rapid declinesrapid declines……EOR??EOR??
0
5,000
10,000
15,000
20,000
25,000
1850 1860 1870 1880 1890 1900 1910 1920 1930 1940 1950 1960 1970 1980 1990 2000
mill
ion
b
0
10
20
30
40
50
60
70
80
90
100
Perc
ent o
ffsho
re
Offshore discoveries
Onshore discoveries
Smoothed Percent Offshorediscoveries
Derived from raw data provided by IHS
© Peter R.A. Wells
0
5,000
10,000
15,000
20,000
25,000
30,000
35,000
40,000
1850 1860 1870 1880 1890 1900 1910 1920 1930 1940 1950 1960 1970 1980 1990 2000 2010 2020 2030 2040 2050
mill
ion
b
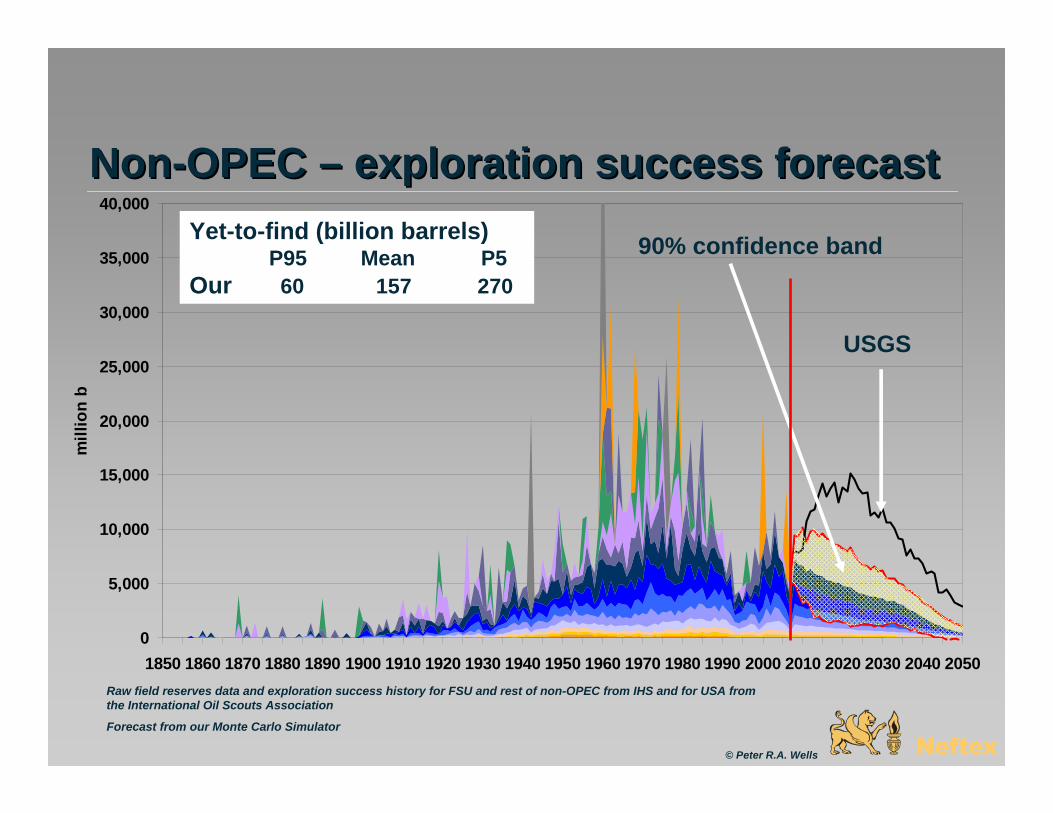
NonNon--OPEC OPEC –– exploration success forecastexploration success forecast
Raw field reserves data and exploration success history for FSU and rest of non-OPEC from IHS and for USA from the International Oil Scouts Association
Forecast from our Monte Carlo Simulator
Yet-to-find (billion barrels)P95 P95 Mean P5 Our 60 157 270
USGS
90% confidence band
© Peter R.A. Wells

NonNon--OPEC OPEC –– at peak! at peak! –– after 2008, demand growth after 2008, demand growth must be met by increased capacity in OPEC or must be met by increased capacity in OPEC or unconventional liquidsunconventional liquids
Raw field reserves data and exploration success history for FSU and rest of non-OPEC from IHS and for USA from the International Oil Scouts Association
Forecast from Monte Carlo simulator
0
5,000,000
10,000,000
15,000,000
20,000,000
25,000,000
30,000,000
35,000,000
40,000,000
45,000,000
1950 1955 1960 1965 1970 1975 1980 1985 1990 1995 2000 2005 2010 2015 2020 2025 2030
b/d
Produced to end 2007
625 billion barrels
Future production 530 billion barrels
© Peter R.A. Wells

0
5,000,000
10,000,000
15,000,000
20,000,000
25,000,000
30,000,000
35,000,000
40,000,000
45,000,000
1950 1955 1960 1965 1970 1975 1980 1985 1990 1995 2000 2005 2010 2015 2020 2025 2030
b/d
90% confidence band
Actual crude oilproductionMean forecastproduction
NonNon--OPEC OPEC –– uncertaintiesuncertainties
Raw field reserves data and exploration success history for FSU and rest of non-OPEC from IHS and for USA from the International Oil Scouts Association
Forecast from Monte Carlo simulator© Peter R.A. Wells

OPECOPEC’’s Dilemma s Dilemma ……. . How much new capacity and by when?How much new capacity and by when?
© Peter R.A. Wells
?
?
Non-OPEC (55.3)
10.2
41.9
31.0
Crude oil
NGLsCan. Tar sands (1.6)
Biofuels (1.3)
Crude oil OPEC (32.0)
Demand (~87)Spare capacity
(1.5)
CTL, GTL, ref. gain etc (1.6)
ref. gain (0.9)
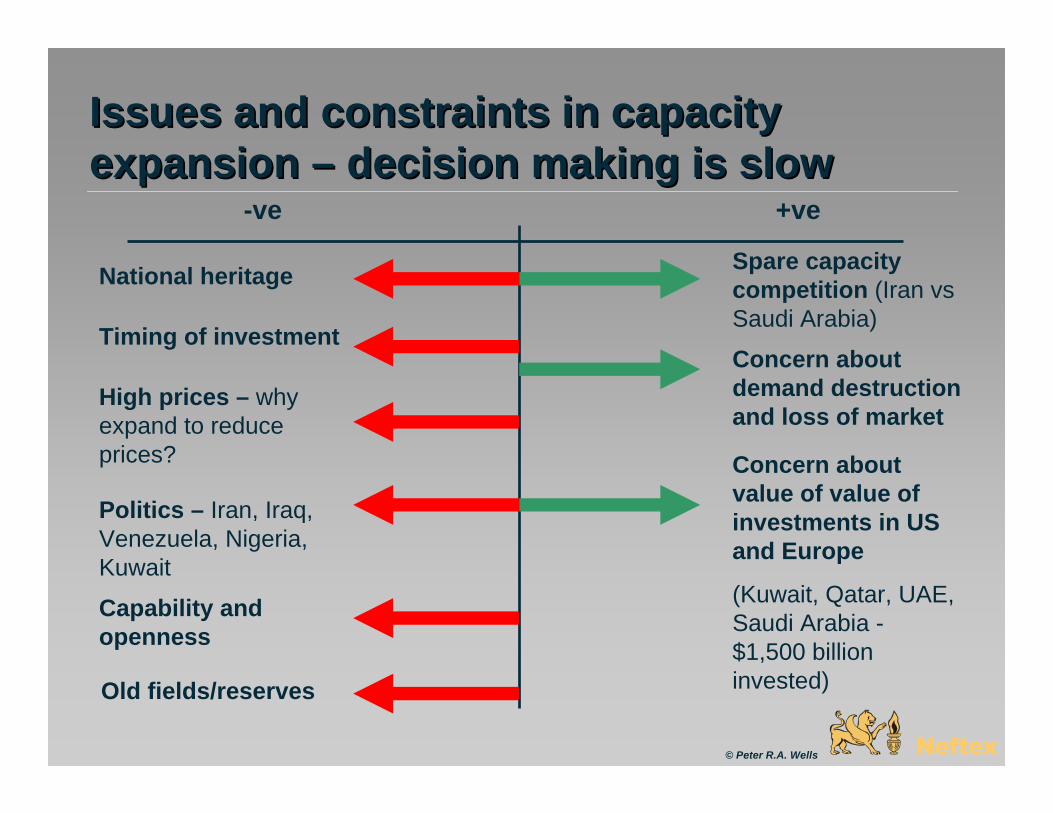
Issues and constraints in capacity Issues and constraints in capacity expansion expansion –– decision making is slowdecision making is slow
© Peter R.A. Wells
-ve +ve
Spare capacity competition (Iran vsSaudi Arabia)
Concern about demand destruction and loss of market
Concern about value of value of investments in US and Europe
(Kuwait, Qatar, UAE, Saudi Arabia -$1,500 billion invested)
National heritage
High prices – why expand to reduce prices?
Politics – Iran, Iraq, Venezuela, Nigeria, Kuwait
Timing of investment
Capability and openness
Old fields/reserves

OPEC OPEC –– our forecast of exploration successour forecast of exploration success
0
5,000
10,000
15,000
20,000
25,000
30,000
35,000
40,000
45,000
1880 1890 1900 1910 1920 1930 1940 1950 1960 1970 1980 1990 2000 2010 2020 2030 2040 2050
mill
ion
b
(billion barrels) P95 mean P5 86 96 120
(2008 to 2050)
Raw historical data from IHS Forecasts by Neftex
© Peter R.A. Wells

The large OPEC fields are mature The large OPEC fields are mature (fields >2 billion barrels reserves)(fields >2 billion barrels reserves)
© Peter R.A. Wells
0
5,000,000
10,000,000
15,000,000
20,000,000
25,000,000
1920 1925 1930 1935 1940 1945 1950 1955 1960 1965 1970 1975 1980 1985 1990 1995 2000 2005
b/d
Includes data provided by Petroconsultants S.A. (data copyright 2008 Petroconsultants S.A.)

OPEC OPEC –– issue is not reserves but maximum issue is not reserves but maximum sustainable rate and pace of getting theresustainable rate and pace of getting there
Existing producing oil fields
Enhanced/improved oil recovery
Discovered undeveloped fields
Future exploration success
0
1,000,000
2,000,000
3,000,000
4,000,000
5,000,000
6,000,000
1950 1960 1970 1980 1990 2000 2010 2020 2030 2040 2050
b/d
Maximum production capacity determined by maximum production from primary and secondary recovery from existing producing fields
EOR, development of discovered fields and exploration extend plateau
(EXCEPTIONS:- Nigeria, Libya, Algeria)
Existing producing
fields
© Peter R.A. Wells
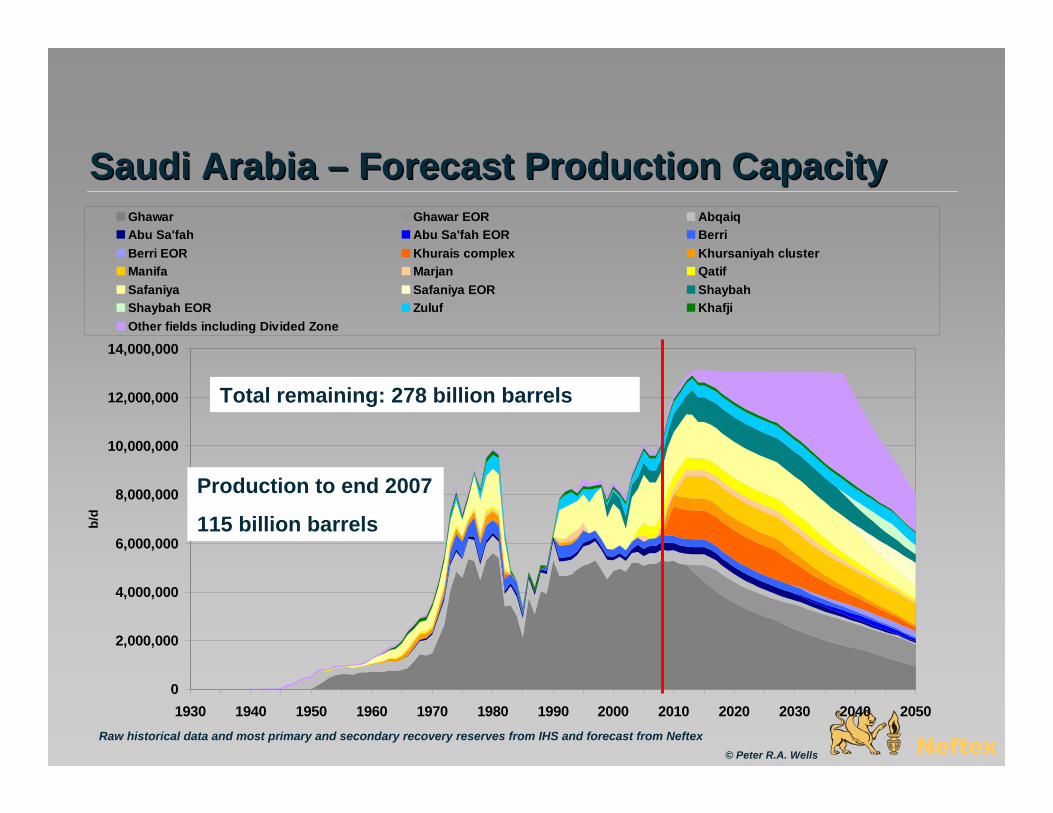
Saudi Arabia Saudi Arabia –– Forecast Production CapacityForecast Production Capacity
0
2,000,000
4,000,000
6,000,000
8,000,000
10,000,000
12,000,000
14,000,000
1930 1940 1950 1960 1970 1980 1990 2000 2010 2020 2030 2040 2050
b/d
Ghawar Ghawar EOR AbqaiqAbu Sa'fah Abu Sa'fah EOR BerriBerri EOR Khurais complex Khursaniyah clusterManifa Marjan QatifSafaniya Safaniya EOR ShaybahShaybah EOR Zuluf KhafjiOther fields including Divided Zone
Raw historical data and most primary and secondary recovery reserves from IHS and forecast from Neftex
Total remaining: 278 billion barrels
Production to end 2007
115 billion barrels
© Peter R.A. Wells

0
1,000,000
2,000,000
3,000,000
4,000,000
5,000,000
6,000,000
7,000,000
1910 1920 1930 1940 1950 1960 1970 1980 1990 2000 2010 2020 2030 2040 2050
b/d
Iran Iran –– forecast production capacityforecast production capacity
Raw historical data and most primary and secondary recovery reserves for conventional crude from Khazar AssociatesForecasts by Neftex
Total remaining: 90 billion barrels
Production to end 2007
61 billion barrels
© Peter R.A. Wells
Ahwaz
MarunGachsaranAgha Jari
Azadegan Undeveloped discoveries

Iraq Iraq –– Forecast Production CapacityForecast Production Capacity
0
1,000,000
2,000,000
3,000,000
4,000,000
5,000,000
6,000,000
7,000,000
8,000,000
1920 1930 1940 1950 1960 1970 1980 1990 2000 2010 2020 2030 2040 2050
b/d
Rumaila (North & South) Kirkuk East Baghdad West QurnaMajnoon Zubair Nahr Umr HalfayaJambur Buzurgan Bai Hassan SubbaKhabbaz Tuba Balad RatawiLuhais Abu Ghraib Ajil TikritQaiyarah Naft Khaneh Amara SufayaAin Zalah Jabal Fauqi Butmah TawkheTaq Taq Nasiriya Gharraf RafidainAhdab Noor Kifl HamrinDiscovered, undeveloped fields Yet-to-Find fields
Raw historical data and most primary and secondary recovery reserves from and forecast from Neftex
Total remaining: 177 billion barrels
Production to end 2007
31 billion barrels
© Peter R.A. Wells
0.0
1,000,000.0
2,000,000.0
3,000,000.0
4,000,000.0
5,000,000.0
6,000,000.0
7,000,000.0
1910 1920 1930 1940 1950 1960 1970 1980 1990 2000 2010 2020 2030 2040 2050
b/d
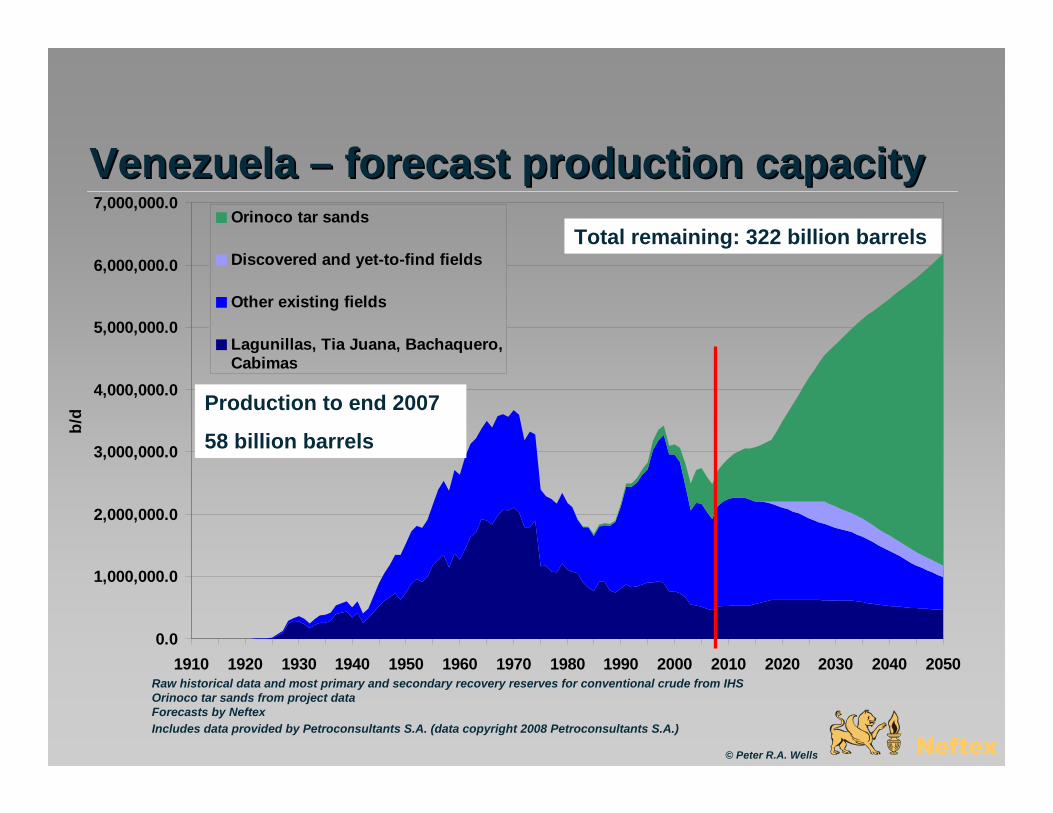
Orinoco tar sands
Discovered and yet-to-find fields
Other existing fields
Lagunillas, Tia Juana, Bachaquero,Cabimas
Venezuela Venezuela –– forecast production capacityforecast production capacity
Raw historical data and most primary and secondary recovery reserves for conventional crude from IHS Orinoco tar sands from project dataForecasts by Neftex
Total remaining: 322 billion barrels
Production to end 2007
58 billion barrels
© Peter R.A. Wells
Includes data provided by Petroconsultants S.A. (data copyright 2008 Petroconsultants S.A.)
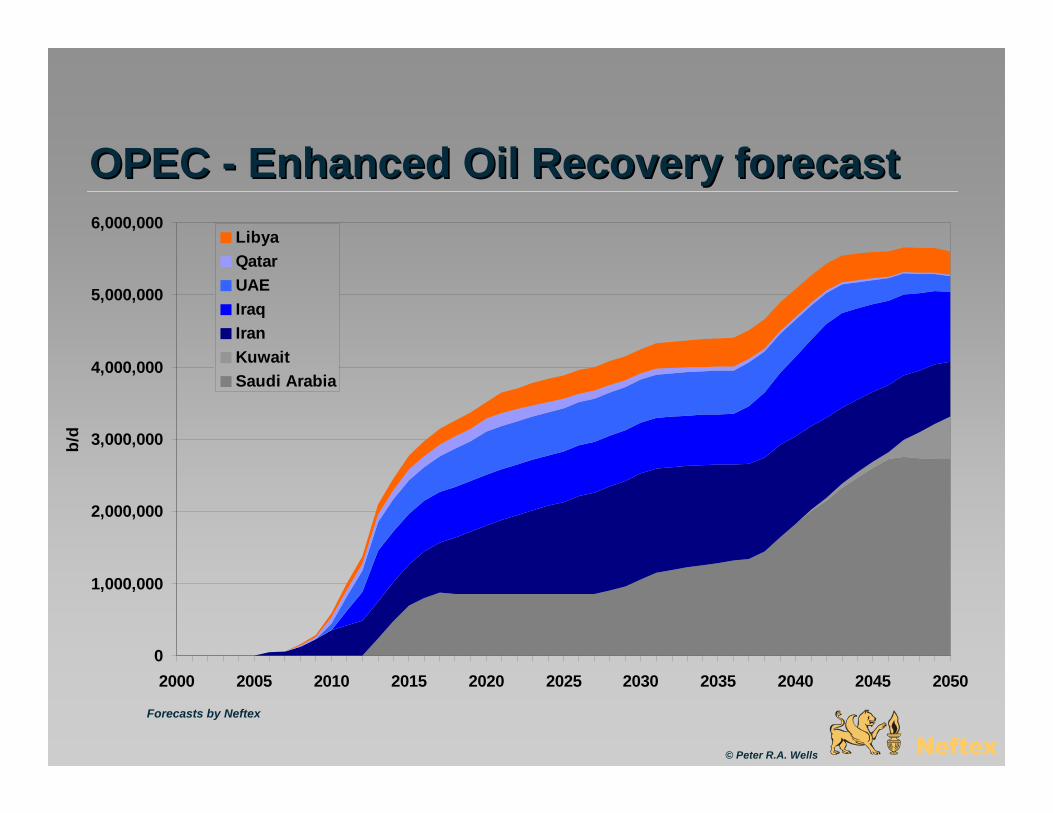
OPEC OPEC -- Enhanced Oil Recovery forecastEnhanced Oil Recovery forecast
0
1,000,000
2,000,000
3,000,000
4,000,000
5,000,000
6,000,000
2000 2005 2010 2015 2020 2025 2030 2035 2040 2045 2050
b/d
LibyaQatarUAEIraqIranKuwaitSaudi Arabia
Forecasts by Neftex
© Peter R.A. Wells
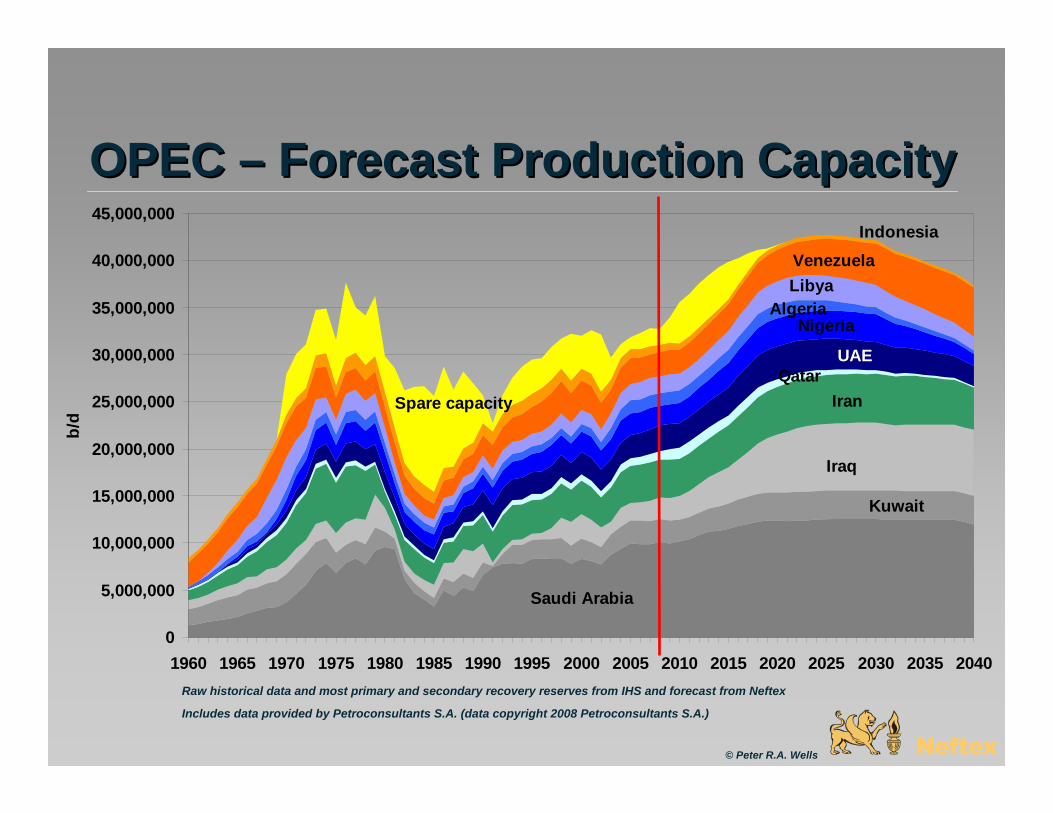
Saudi Arabia
Kuwait
Iraq
Iran
UAEQatar
AlgeriaNigeria
LibyaVenezuela
Indonesia
Spare capacity
0
5,000,000
10,000,000
15,000,000
20,000,000
25,000,000
30,000,000
35,000,000
40,000,000
45,000,000
1960 1965 1970 1975 1980 1985 1990 1995 2000 2005 2010 2015 2020 2025 2030 2035 2040
b/d
OPEC OPEC –– Forecast Production CapacityForecast Production Capacity
Raw historical data and most primary and secondary recovery reserves from IHS and forecast from Neftex
© Peter R.A. Wells
Includes data provided by Petroconsultants S.A. (data copyright 2008 Petroconsultants S.A.)

Challenges for OPECChallenges for OPEC• Balance creation of capacity to “guesstimate” of future call on
OPEC
• Call on OPEC is the difference between two large unknowns –non-OPEC liquids (from crude oil to biofuels) and demand
• Extensive investment of capital and expertise will be required just to maintain current production capacity
• Additional capital to create new capacity is available but decision making is necessarily cautious
• Major potential for new capacity is in four countries: – Saudi Arabia (potential 2-3 million b/d) – underway but technical
risks– Iran (1-2 million b/d) - stymied by politics – Iraq (4-5 million b/d) - major political/security risks– Venezuela tar sands (>2 million b/d) – resource nationalism
© Peter R.A. Wells

High Impact potential new production High Impact potential new production capacity is also high riskcapacity is also high risk
© Peter R.A. Wells
0.1
1
10
Impact on capacity,
million b/d
low high
Qatar
Kuwait
Iran
Iraq
Saudi Arabia
UAE Libya
Algeria
Nigeria
Venezuela
AngolaEcuador
Political risks and constraints
Nigeria – IOCs active

Above or below ground risks?Above or below ground risks?
© Peter R.A. Wells
low
High
Geological constraints
“Below ground”
low high
Qatar
Kuwait
Iran
Iraq
Saudi Arabia
UAELibya
Algeria
Nigeria
Venezuela
Angola
Political constraints
“Above ground”
USAROW
FSU

Natural Gas Liquids (Natural Gas Liquids (NGLsNGLs))
USA
Canada
Saudi Arabia
Qatar
Iran
Algeria Exploration success
0
2,000,000
4,000,000
6,000,000
8,000,000
10,000,000
12,000,000
1950 1960 1970 1980 1990 2000 2010 2020 2030 2040 2050
b/d
Historical data from our own database based on EIA, IEA, BP Statistical Review of World Energy and national databases
© Peter R.A. Wells

““NonNon--crude oilcrude oil”” liquids liquids
0
5,000,000
10,000,000
15,000,000
20,000,000
25,000,000
1950 1960 1970 1980 1990 2000 2010 2020 2030 2040 2050 2060 2070
b/d
Oil shaleOther liquidsBiofuelsCoal-to-LiquidsGas-to-LiquidsCanadian tar sandsNGLs
© Peter R.A. Wells

Peak liquids production: 98Peak liquids production: 98--105 million b/d 105 million b/d Between: 2017 and 2023 Between: 2017 and 2023
0
20,000,000
40,000,000
60,000,000
80,000,000
100,000,000
120,000,000
1980 1990 2000 2010 2020 2030 2040
b/d
CERA Asian Phoenix (2006) 121 million b/d
IEA Ref. Case (2007) 116 million b/d
Non-OPEC crude oil
OPEC crude oil
NGLs
BiofuelsCTLGTLShale oil
Spare capacity
Canadian tar sands
© Peter R.A. Wells

World liquids supply base case World liquids supply base case ––121121--116 million b/d in 2030???116 million b/d in 2030???
40,000,000
50,000,000
60,000,000
70,000,000
80,000,000
90,000,000
100,000,000
110,000,000
120,000,000
1980 1990 2000 2010 2020 2030 2040
b/d
CERA Asian Phoenix (2006) 121 million b/d
IEA Ref. Case (2007) 116 million b/d
© Peter R.A. Wells

Hard to make up for 40 years of declining Hard to make up for 40 years of declining exploration successexploration success
Raw field reserves data and exploration success history for OPEC, FSU and rest of non-OPEC from IHS and for USA from the International Oil Scouts Association
Forecast exploration success from our Monte Carlo simulator
0
10,000
20,000
30,000
40,000
50,000
60,000
70,000
1850 1870 1890 1910 1930 1950 1970 1990 2010 2030 2050
mill
ion
barr
els
OPECFSURest of non-OPEC less FSUUSAP5P95
© Peter R.A. Wells

OPEC OPEC -- Crude Oil Crude Oil
© Peter R.A. Wells
-3,000,000
-2,000,000
-1,000,000
0
1,000,000
2,000,000
3,000,000
4,000,000
1990 1995 2000 2005 2010 2015 2020 2025
year
-on-
year
cha
nge,
b/d
0
20
40
60
80
100
120
140
Rea
l oil
pric
e, d
ated
Bre
nt, $
/b
Non OPEC Saudi Arabia Iraq Rest of OPEC Oil price
World crude oil peaks
Change in production Change in capacity

Liquids balanceLiquids balance
© Peter R.A. Wells
-2,000,000
-1,000,000
0
1,000,000
2,000,000
3,000,000
4,000,000
5,000,000
1990 1995 2000 2005 2010 2015 2020 2025
year
-on-
year
cha
nge,
b/d
0
20
40
60
80
100
120
140
Rea
l oil
pric
e, d
ated
Bre
nt, $
/b
World crude oil NGLs Canadian tar sands
Biofuels Other unconventionals Oil price
World liquids peaks
Change in production Change in capacity
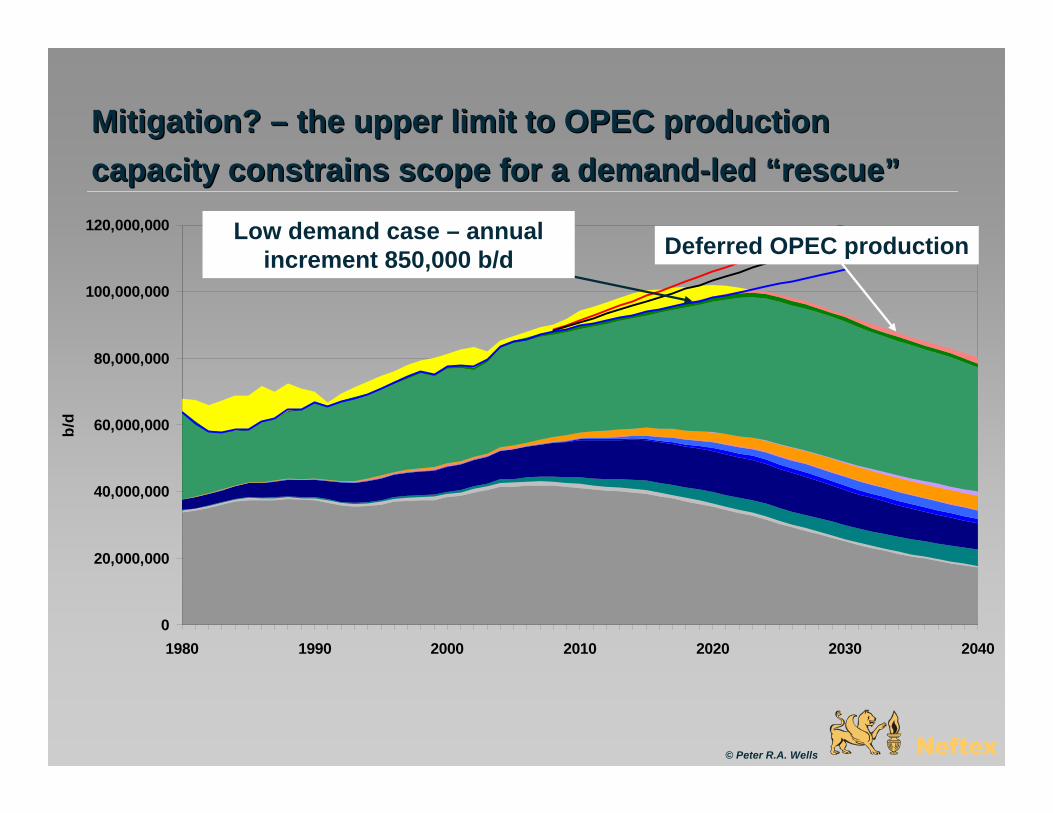
Mitigation? Mitigation? –– the upper limit to OPEC production the upper limit to OPEC production capacity constrains scope for a demandcapacity constrains scope for a demand--led led ““rescuerescue””
© Peter R.A. Wells
0
20,000,000
40,000,000
60,000,000
80,000,000
100,000,000
120,000,000
1980 1990 2000 2010 2020 2030 2040
b/d
Deferred OPEC productionLow demand case – annual increment 850,000 b/d
Mitigation Mitigation -- Substitution within the crude Substitution within the crude oil systemoil system
© Peter R.A. Wells
• Liquid fuels are uniquely efficient for transportation – high energy per volume
• 75% of crude oil consumed in the USA is used for transportation (motor gasoline, jet fuel and diesel)– 25% is 5 million b/d!
• Only ~60% crude oil world wide used for transportation– 40% is 25 million b/d - mainly heavy end of the barrel
used for space heating, industry and power generation
• Scope for substituting gas and nuclear in power generation and natural gas liquids in industrial uses
• Major investment in refining and refining technology and access to cheap, clean hydrogen – nuclear power for hydrogen and process energy

Mitigation Mitigation -- substitutionssubstitutions…… electricity replaces electricity replaces gasoline (plug ins, hydrogen fuel cells) gasoline (plug ins, hydrogen fuel cells) –– nuclear!nuclear!
Global Warming
Security of Supply
Coal-to-liquids
Corn ethanol
Sugar cane ethanol
Gas-to-liquids
EU biodiesel
hybridsplug-ins
nuclearbehaviour
Canadian tar sands
Shale oil
Gas from Russia
Clean coal power
Solar-wind-tidalhydrogen
© Peter R.A. Wells
diesel

0
20,000,000
40,000,000
60,000,000
80,000,000
100,000,000
120,000,000
1980 1990 2000 2010 2020 2030 2040
b/d
0
20,000,000
40,000,000
60,000,000
80,000,000
100,000,000
120,000,000
0
20,000,000
40,000,000
60,000,000
80,000,000
100,000,000
120,000,000
1980 1990 2000 2010 2020 2030 2040
b/d
0
20,000,000
40,000,000
60,000,000
80,000,000
100,000,000
120,000,000
Mitigation Mitigation -- Natural gas will outlast liquids Natural gas will outlast liquids ……Compressed natural gas (CNG)Compressed natural gas (CNG)
© Peter R.A. Wells
Natural gas

Back up slidesBack up slides
© Peter R.A. Wells

BiofuelsBiofuels
0
1,000,000
2,000,000
3,000,000
4,000,000
5,000,000
6,000,000
1970 1980 1990 2000 2010 2020 2030 2040 2050
b/d
Rest of Latin AmericaAfricaMiddle EastRest of developing AsiaIndonesiaPacific CanadaEUChinaIndiaBrazilUSAP5 of our estimateHigh case, IEA 2006P95 of our estimate
© Peter R.A. Wells

Shale OilShale Oil
0
500
1,000
1,500
2,000
2,500
3,000
2005 2010 2015 2020 2025 2030 2035 2040 2045 2050
000
b/d
0
500
1,000
1,500
2,000
2,500
3,000
Forecast range RandUS DOE/DOD Time-Shifted Canadian Tar SandsEIA Base Case Forecast
Environment (GHG, land) Infrastructure Capital cost Gas, water resources Unproven technology
© Peter R.A. Wells
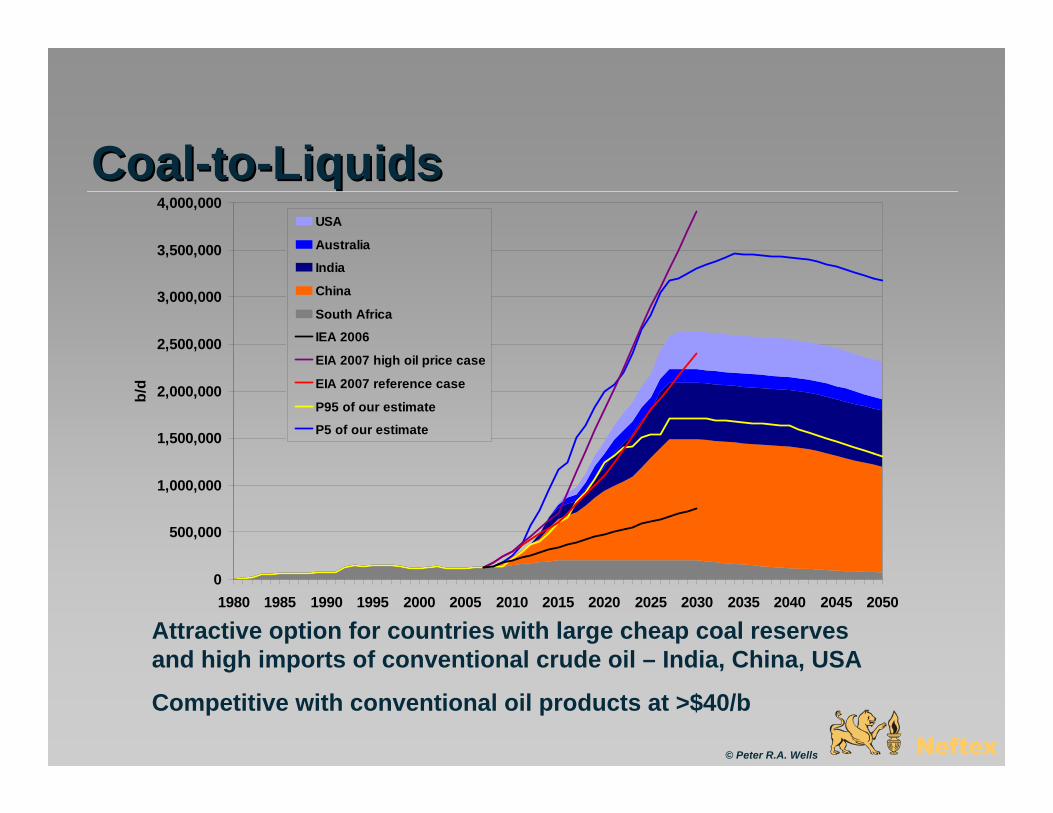
CoalCoal--toto--LiquidsLiquids
Attractive option for countries with large cheap coal reserves and high imports of conventional crude oil – India, China, USA
Competitive with conventional oil products at >$40/b
0
500,000
1,000,000
1,500,000
2,000,000
2,500,000
3,000,000
3,500,000
4,000,000
1980 1985 1990 1995 2000 2005 2010 2015 2020 2025 2030 2035 2040 2045 2050
b/d
USA
Australia
India
China
South Africa
IEA 2006
EIA 2007 high oil price case
EIA 2007 reference case
P95 of our estimate
P5 of our estimate
© Peter R.A. Wells
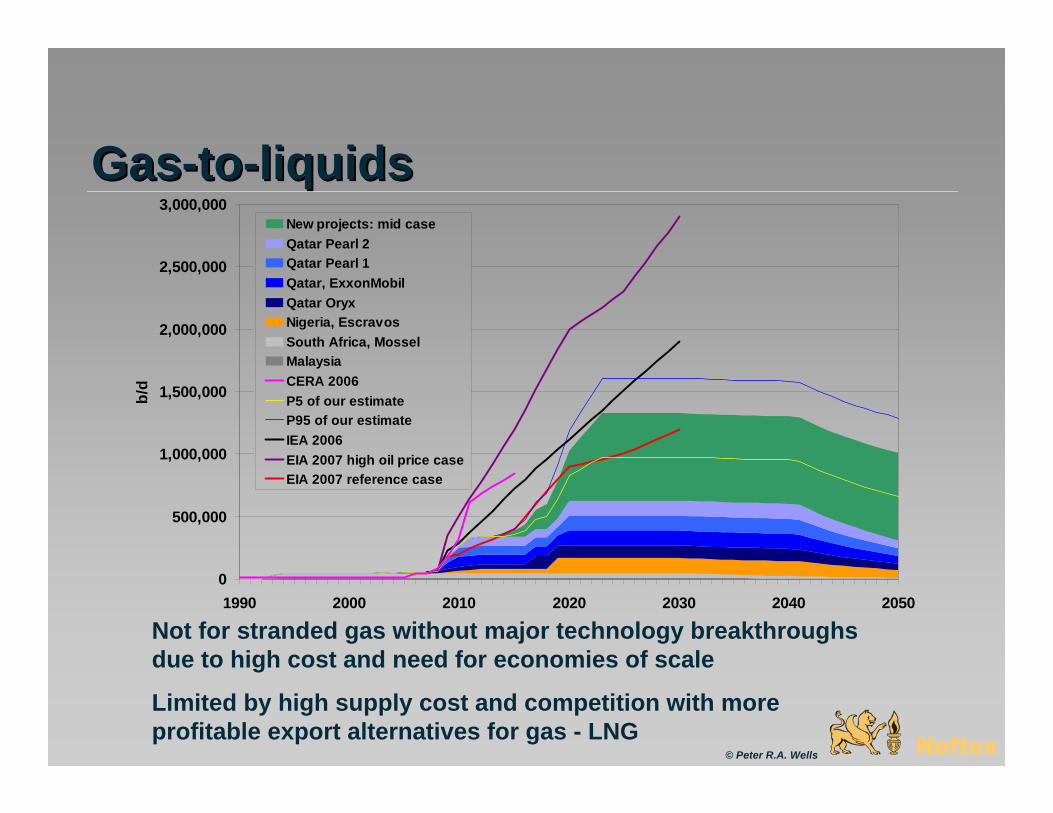
GasGas--toto--liquidsliquids
0
500,000
1,000,000
1,500,000
2,000,000
2,500,000
3,000,000
1990 2000 2010 2020 2030 2040 2050
b/d
New projects: mid caseQatar Pearl 2Qatar Pearl 1Qatar, ExxonMobilQatar OryxNigeria, EscravosSouth Africa, MosselMalaysiaCERA 2006P5 of our estimateP95 of our estimateIEA 2006EIA 2007 high oil price caseEIA 2007 reference case
Not for stranded gas without major technology breakthroughs due to high cost and need for economies of scale
Limited by high supply cost and competition with more profitable export alternatives for gas - LNG
© Peter R.A. Wells

0
1,000,000
2,000,000
3,000,000
4,000,000
5,000,000
6,000,000
1970 1975 1980 1985 1990 1995 2000 2005 2010 2015 2020 2025 2030
b/d
0
1,000,000
2,000,000
3,000,000
4,000,000
5,000,000
6,000,000Production90 % confidence bandForecast Mean caseIEA 2005CERA 2005ExxonMobil 2005NEB Fortress Islands case 2007NEB Triple E case 2007NEB reference case 2007CAPP unconstrained 2007CAPP moderate growth 2007EIA
Canadian Tar SandsCanadian Tar SandsEnvironment (GHG, land) Infrastructure Capital cost Gas, water resources
© Peter R.A. Wells


