
NBER WORKING PAPER SERIES
THE PRICE EFFECTS OF A LARGE MERGER OF MANUFACTURERS:A CASE STUDY OF MAYTAG-WHIRLPOOL
Orley C. AshenfelterDaniel S. Hosken
Matthew C. Weinberg
Working Paper 17476http://www.nber.org/papers/w17476
NATIONAL BUREAU OF ECONOMIC RESEARCH1050 Massachusetts Avenue
Cambridge, MA 02138October 2011
The opinions expressed here are those of the authors and not necessarily those of the Federal TradeCommission, any of its Commissioners, or the National Bureau of Economic Research. We thankPrinceton Univesity for financial assistance. We also thank Mike Mazzeo, Paul Pautler, Chuck Romeo,Carl Shapiro, and Mike Vita for comments.
NBER working papers are circulated for discussion and comment purposes. They have not been peer-reviewed or been subject to the review by the NBER Board of Directors that accompanies officialNBER publications.
© 2011 by Orley C. Ashenfelter, Daniel S. Hosken, and Matthew C. Weinberg. All rights reserved.Short sections of text, not to exceed two paragraphs, may be quoted without explicit permission providedthat full credit, including © notice, is given to the source.

The Price Effects of a Large Merger of Manufacturers: A Case Study of Maytag-WhirlpoolOrley C. Ashenfelter, Daniel S. Hosken, and Matthew C. WeinbergNBER Working Paper No. 17476October 2011JEL No. K2,K21,L11,L4
ABSTRACT
Many experts speculate that U.S. antitrust policy towards horizontal mergers has been too lenient.We estimate the price effects of Whirlpool’s acquisition of Maytag to provide new evidence on thisdebate. We compare price changes in appliance markets most affected by the merger to markets whereconcentration changed much less or not at all. We estimate price increases for dishwashers and relativelylarge price increases for clothes dryers, but no price effects for refrigerators or clothes washers. Thecombined firm’s market share fell across all four affected categories and the number of distinct applianceproducts fell.
Orley C. AshenfelterIndustrial Relations SectionFirestone LibraryPrinceton UniversityPrinceton, NJ 08544and [email protected]
Daniel S. HoskenFederal Trade Commission600 Pennsylvania Avenue, NWWashington, DC [email protected]
Matthew C. Weinberg Dalton HallBryn Mawr CollegeBryn Mawr, PA 19010L ADDRESS [email protected]

The Price Effects of a Large Merger of Manufacturers:
A Case Study of Maytag-Whirlpool
Orley C. Ashenfelter, Daniel S. Hosken, and Matthew C. Weinberg∗
Abstract
Many experts speculate that U.S. antitrust policy towards horizontal mergers hasbeen too lenient. We estimate the price effects of Whirlpool’s acquisition of Maytagto provide new evidence on this debate. We compare price changes in appliancemarkets most affected by the merger to markets where concentration changed muchless or not at all. We estimate price increases for dishwashers and relatively largeprice increases for clothes dryers, but no price effects for refrigerators or clotheswashers. The combined firm’s market share fell across all four affected categoriesand the number of distinct appliance products fell.
Each year thousands of mergers are proposed to the U.S. Federal Trade Commission
and U.S. Department of Justice. After filing, the merging firms must wait while the an-
titrust authority attempts to identify and block mergers that would increase consumer
prices. The challenge of identifying those mergers that would increase prices while not
interfering with those that would not is enormous. Enforcement decisions must be made
quickly and often with imperfect information on consumer demand, the ease of entry,
and the possibility of merger induced efficiencies. Unsurprisingly, whether antitrust en-
forcement has been too lenient or too strict is the subject of much debate (Crandall and
Winston (2003), Baker (2003)). A straightforward way to inform this debate is to eval-
uate whether approved mergers actually increased price. Without evidence of this sort,
it is impossible to know whether antitrust policy is achieving the objective of protecting
consumer surplus.
∗The opinions expressed here are those of the authors and not necessarily those of the Federal TradeCommission or any of its Commissioners. We thank Mike Mazzeo, Paul Pautler, Chuck Romeo, CarlShapiro, and Mike Vita for comments. Ashenfelter: [email protected], Hosken: [email protected],Weinberg: [email protected]
1

This paper presents exactly that kind of evidence by estimating the price effects of a
large and controversial merger–Whirlpool’s acquisition of Maytag. This merger combined
two of the largest appliance manufacturers in the United States, and is particularly in-
teresting for our purposes because it was likely nearly blocked.1 The Whirlpool/Maytag
case arguably presents an opportunity to evaluate whether a change in antitrust policy,
allowing a merger that otherwise would have been challenged, resulted in a price increase.
Using scanner data covering a period before and after Whirlpool’s purchase of Maytag,
we estimate how markets for different types of appliances were impacted by the acquisi-
tion. Before the merger Whirlpool and Maytag were both large manufacturers of clothes
washers, clothes dryers, dishwashers, and refrigerators. In contrast, both firms had essen-
tially no presence in the market for freezers and Maytag was a relatively less important
producer of cooktops, ovens, and ranges. Comparing the prices of dryers, washers, re-
frigerators, and dishwashers to appliance markets that experienced no or small changes
in concentration before and after the merger offers a simple test of whether the merger
increased prices. We find that the prices for dishwashers and clothes dryers increased rel-
ative to each comparison appliance category, we find small price changes for refrigerators,
and essentially no change in prices of washing machines.
Comparisons within appliance categories between products produced by Maytag or
Whirlpool and rival appliance manufacturers provide an alternative test of whether the
merger raised prices. Consistent with models of oligopoly commonly used to study mergers
(Deneckere and Davidson (1985)), we find evidence that dryers and dishwashers owned
by the merging parties and introduced after the merger occurred experienced an increase
in price relative to rivals’ dryers and dishwashers introduced after the merger occurred.
We also estimate the effects of the merger on market share and a simple measure of
1Baker and Shapiro state, “the perception that the Justice Department has adopted a very lax mergerenforcement policy was unquestionably fueled by the March, 2006 decision of Assistant Attorney GeneralBarnett not to take any enforcement action when Whirlpool sought to obtain Maytag,” and that they are“confident that the Whirlpool/Maytag deal would have been challenged by Assistant Attorney GeneralKlein 10 years ago.”
2

product variety. Consistent with our estimated price effects, we find that the merging
parties’ combined market share fell in the product categories experiencing the largest
price increases. However, similar decreases in relative sales were experienced in other
appliance categories for which prices did not increase. We also find that the number
of distinct products, as measured by Stock Keeping Units (SKUs), offered to consumers
by Whirlpool/Maytag fell after the merger, both in absolute terms and relative to rival
appliance manufacturers.
This paper complements a small number of papers that directly estimate the effects
of mergers in consumer product markets.2 The studies in this literature are typically case
studies. This approach makes it feasible to focus on industry specific institutions that are
often necessary to account for when estimating merger effects.3
The evidence on whether mergers increase prices is mixed and limited primarily to
industries with a history of regulation, e.g. banking, airlines, petroleum, and hospital
mergers, which might not be generalizable to other sectors of the economy.4 As pointed
out by Carlton (2009), determining if mergers of competitors lead to increased prices
is potentially complicated by a selection issue-the antitrust agencies attempt to identify
and block mergers that would increase prices paid by consumers. Selection implies that
the average price change resulting from a random sample of approved mergers will be a
lower bound on the average price effect of a merger in a world with no merger enforce-
ment. This lower bound, however, is not an informative measure of whether potentially
problematic mergers allowed by the government have increased prices, because the over-
2See Whinston (2006) for a survey and Weinberg (2008) or Hunter, Leonard and Olley (2008) for amore recent survey focusing on the empirical literature.
3The literature on collusion (see Asker (2010) and Genesove and Mullin (2001)) also frequently usesthe case study approach.
4Examples include Borenstein (1990) and Kim and Singal (1993) studies of airline mergers, Focarelliand Panetta (2003), Sapienza (2002), and Prager and Hannan (1998) studies of banking mergers, andHastings (2004) Taylor and Hosken (2007), and Simpson and Taylor (2008) studies of gasoline mergers.Chandra and Collard-Wexler (2009) estimate the price effects of Canadian newspaper mergers. Winston,Dennis and Maheshri (2011) study two large railroad mergers using a different approach. This paperestimates demand and supply and assumes a model of competition to study the short and long-runeffects mergers.
3

whelming majority of proposed mergers raise no competitive concerns.5 A more useful
measure of whether antitrust enforcement is at the right level is the average effect of
mergers that were nearly blocked. A negative mean price effect of the marginal merger
would imply enforcement is too strict; that is the government is discouraging acquisitions
that would result in lower final good prices. Similarly a positive price effect would imply
that merger enforcement has been too lenient. This paper attempts to account for this
selection issue by focusing on the Maytag-Whirlpool case precisely because it’s viewed as
a merger that was nearly challenged during a time period in which relatively few mergers
were challenged.6
We begin the paper by providing background information on the merger. We next
describe the data and the construction of our sample of appliances. We then report the
detailed results of our study and explore the robustness of our findings.
1 Merger Background
Whirlpool’s acquisition of Maytag was much more controversial than the typical antitrust
case. In mid-2005 a group of private investors agreed to purchase Maytag for $1.13 billion.Before this transaction was consummated, the Haier Group (a Chinese owned appliance
manufacturer), offered $1.3 billion dollars for Maytag. While Haier was the leading appli-
ance manufacturer in China, it had relatively little presence in the U.S. According to press
reports, Haier’s goal was to move the manufacturing of Maytag’s products to its much
lower cost Chinese factories while maintaining Maytag’s extensive U.S. dealer and service
network.7 Haier’s proposed acquisition was controversial both because of general concerns
5Ashenfelter and Hosken (2010) report that from 1991-2004, 97% of mergers proposed to the regulatorswent consummated without modification.
6For example, Baker and Shapiro cite a January 2007 Wall Street Journal article reporting that “Thefederal government has nearly stepped out of the antitrust business ...the message is clear for deals withantitrust issues: It’s now or never.”
7“China’s Haier withdraws Maytag bid on pricing, integration concerns”, Forbes, July 20, 2005.
4

about the purchase of well-known U.S. brands by Chinese firms and the potential loss of
a large number of relatively high paid manufacturing jobs. On July 17th the largest U.S.
appliance manufacturer, Whirlpool, offered to purchase Maytag for $1.4 billion. On July
20th Haier Group withdrew its offer to purchase Maytag. Ultimately, Whirlpool was able
to purchase Maytag for $1.79 billion after a long investigation by the U.S. Department
of Justice’s antitrust division (DOJ) on March 30, 2006. Because of the large increase
in concentration in several appliance markets, visibility of the merging parties, and the
alleged incongruity with the DOJ’s relatively long history in enforcement action towards
mergers in traditional manufacturing industries, the merger and DOJ’s decision received
significant attention both amongst antitrust experts and the popular press, much of it
negative.8
The merger reduced the number of major appliance manufacturers (Whirlpool, May-
tag, GE, and Electrolux) in the United States from four to three. Both Maytag and
Whirlpool had sales in seven of the eight major home appliance categories: dishwash-
ers, clothes dryers, refrigerators, clothes washers, cooktops, ovens, and ranges.9 Within
each appliance category there is substantial product differentiation. 10 There are two
leading sources of differentiation. The first comes from measurable product characteris-
tics. Second, products are also differentiated by brand marketing. The major appliance
manufacturers typically sell luxury variations of their appliances under a different brand
name. Further, a number of smaller niche firms sell very high end appliances in each
major category. Miele and Bosch, for example, sell very expensive, quiet, and highly
efficient dishwashers and LG sells relatively expensive and efficient front loading washing
machines.
8See “Arguments for Whirlpool-Maytag Just Don’t Wash”, Washington Post, 2/22/2006 and Bakerand Shapiro (2008).
9Prior to the merger only Electrolux was a significant participant in the eight category, freezers.According to Moss (2006), Maytag and Whirlpool began selling freezers in 2005. However, in our dataneither firm had more than a one percent revenue share of freezer sales before the merger occurred.
10For example, the ratio of the price in the 75th percentile of the price distribution to the 25th percentileranges from 1.7 for dishwashers to 2.8 for ovens.
5
According to public documents, much of Justice’s investigation focused on clothes
washers and dryers.11 While the merger increased concentration most dramatically in the
washer and dryer markets, it also substantially affected concentration in the markets for
dishwashers and refrigerators. Table 1 contains pre-merger revenue shares calculated using
our data. Whirlpool was the largest manufacturer in each of these appliance categories,
and Maytag was the second largest producer of washers and dryers. Table 2 presents pre-
merger market shares for cooktops, freezers, ovens, and ranges.12 Maytag had relatively
little market share in these categories, and while the merger did increase concentration
in cooktops, ovens, and ranges, it did so to a much lesser extent than for dryers, washers,
dishwashers, and refrigerators.
One of the largest appliance brands, Kenmore, is owned and sold exclusively by the
retailer Sears. Sears contracts with appliance manufacturers like Whirlpool to produce all
of its Kenmore appliances. Our data does not contain information on Kenmore. While this
poses no problem in directly estimating the price effects of the merger on the products
for which we do have data, we are unable to determine if Kenmore’s prices changed
differentially from its competitors.
2 Data and Sample Construction
Our data from the NPD Group covers each of the major appliance categories. We obtained
the most disaggregated data NPD would provide: national monthly retail unit sales and
revenues for each appliance measured at the level of a specific appliance model, defined
11The Department of Justice’s statement is available at http ://www.usdoj.gov/atr/public/pressreleases/2006/215326.htm
12Most of the appliance products we study are essentially self-explanatory. There may be some ambi-guity among the three appliance categories used to cook food. A cooktop is an appliance that containsburners (powered by electricity or natural gas) to cook food. An oven is an appliance that holds anenclosed space for cooking food, such as baking a cake. A range is an appliance that contains both acooktop and an oven. A range is the most frequently purchased cooking appliance in a U.S. kitchen.Ovens and cooktops are sold separately and typically professionally installed in a kitchen.
6

as a stock keeping unit (SKU). The data spans the time period from January 2005 to
September 2008. NPD collects its data from a nationally representative sample of national
and regional major appliance retailers. Representatives of NPD told us that the codes
used to identify appliances (SKUs) are unique to a product and common across retailers;
that is, different retailers selling an identical product will sell a product with a common
SKU.13 Our data set also includes a rich set of descriptive information for each appliance
including brand name and product characteristics.14 Product characteristics explain a
large fraction of the variation in appliance prices, typically 85 to 95 percent.
There are two institutional features of appliance markets that are important for our
study. First, products in six of the eight appliance categories we study (clothes washers
and dryers, dishwashers, freezers, refrigerators, and ranges) have, on average, relatively
short shelf lives lasting roughly one calendar year. The price and volume sold of these
products declines as the date in which a product exits the market approaches. This can
be seen by examining the relationship between an appliance product’s price and unit
sales and its age. We estimate this relationship separately for each appliance category in
equations (1) and (2) below, conditional on observing each product’s birth:
log pit = αi +25∑
k=2
θkAgekit +
43∑
l=2
δlT imePeriodlit + eit (1)
log qit = ψi +25∑
k=3
λkAgekit +
43∑
l=3
γlT imePeriodlit + uit (2)
where αi and ψi are product specific fixed effects, Agekit are age indicators, and T imePeriodlit
are separate indicators for each month in our regression sample. Figures 1 and 2 plot the
coefficients corresponding to the Age indicators in equations 1 and 2 respectively.15 Ovens
13To protect a retailer’s confidentiality, NPD does not release disaggregated data which would allow aresearcher to identify a specific retailer. Within our data less than 1.4% of sales are not associated witha specific product.
14See the appendix for a list of the characteristics that describe each appliance type in our data.15The age coefficients in Figure 1 are measured relative to prices in the product’s first month with
positive sales. Because our data is measured at the monthly frequency we cannot determine how many
7

and cooktops appear to be relatively long lived and do not experience systematic declines
in pricing or sales with age in their first 25 months on the market. Unit sales of ovens and
cooktops, for example, at twenty months of age appear to be very similar to sales in their
fourth month. Similarly, prices appear to be relatively constant over time. The other
appliance categories appear to have much lower prices and unit sales as a product ages.
Prices fall significantly after a product has been on the market for more than one year,
typically more than 10%, and monthly unit sales fall by about 50% relative to a product’s
sales after it has been on the market for a few months. In the remainder of this study
we limit attention to the pricing of models within their first full year of existence due to
the rapidly declining price and volume profile at the end of a product’s lifetime. Further,
because the shape of the age-sales and age-pricing relationship varies across appliance
categories, all analysis will include separate controls for age for each appliance category.
Second, there is significant heterogeneity in the level of sales of different appliance
products in our data. In our data more than 14,000 appliances (defined by a unique
SKU) are introduced during our sample period. Most of these appliances, however, have
a very small number of unit sales. Very small differences in product type generate a unique
SKU, e.g., a product’s color. It could be that some minor variants of an appliance have
small sales (more than 93% of dryers are white). Alternatively some small volume SKUs
may not be real products, but instead the result of a coding error, e.g., an erroneously
entered SKU number. To minimize this type of measurement error we focus attention on
models that have a relatively high volume of sales. For the smaller appliance categories,
freezers, ovens, and cooktops, we restrict attention to appliances that have at least 100 unit
sales within the product’s first 13 months on the market.16 Refrigerators, dishwashers,
weeks within a month the item has been on sale in its first month; that is, for most of the items in ourdata the first month’s sales correspond to a partial month. For this reason in measuring how an item’sunit sales change with age we drop the month in which the product was introduced and measure the agecoefficients relative to month 2’s volume.
16Total unit sales of all cooktops, freezers and ovens in their first 13 months on the market are 65,738,445,886, and 61,085 respectively in our data. These models account for 66% of cooktop sales, 99% offreezer sales, and 66% of oven sales.
8

clothes dryers, washing machines, and ranges are higher volume products, so we restrict
our sample to models having 1000 unit sales in the first 13 months on the market.17
3 Price Effects of the Merger
The major issue faced by any study attempting to estimating the effect of a merger on
consumer prices is to develop a reasonable estimate of the counterfactual change in prices
had the merger not occurred. Simply comparing the merging firms’ average prices after
the merger to their average prices beforehand assumes this counterfactual change is zero,
and this simple time difference will be biased if something unrelated but concurrent in
timing to the merger also affected prices. For example, an increase in the price of steel
coincident with the merger would bias a simple time difference estimator of the merger’s
effect on prices upwards. In order to avoid this assumption, we follow the literature and
estimate the price effects by comparing the change in pricing to that of a comparison
group. For this approach to be valid, it must be the case that the change in price of the
comparison group is the counterfactual change in price that would have occurred for the
brands owned by the merging firms had the merger not occurred.
Major appliances are highly durable goods that are frequently purchased in conjunc-
tion with new home building or home remodeling. A natural control product for our
study would be a major appliance category unaffected by the merger. Prior to the merger
both Maytag and Whirlpool sold products in seven of the eight major appliance cate-
gories for which we have data. The degree of pre-merger competition between Maytag
and Whirlpool, however, likely varied across product categories. Maytag and Whirlpool
were major competitors in four appliance categories: dishwashers, refrigerators, clothes
17Total unit sales of all refrigerator, dishwasher, clothes dryer, range, and clothes dryer sales in their13 months on the market are 3.9 million, 1.9 million, 3.4 million, 2.4 million, and 4 million in our data.These models account for 90% of refrigerator sales, 92% of dishwasher sales, 98% of clothes dryer sales,90% of range sales, and 99% of clothes washer sales.
9

washers, and clothes dryers (see Table 1 for revenue shares by manufacturer for these
appliance markets). In each of these categories the markets appear to be highly concen-
trated with Whirlpool typically having about 40% of sales and Maytag having a share
between 9% and 16% in these categories.
In contrast, the degree of competition between Maytag and Whirlpool, as suggested
by revenue shares, appears less substantial in the cooktop, freezer, oven, and range prod-
uct categories. In our data neither Whirlpool nor Maytag had a presence in the freezer
market prior to the merger’s consummation. While the range market has a similar level
of pre-merger concentration as the markets shown in Table 1, Maytag’s market share was
relatively small at 5.1%. Maytag’s pre-merger share is somewhat larger in the cooktop and
oven markets at 9.2% and 6.2%, respectively. However, the level of pre-merger concentra-
tion is significantly lower than in dishwashers, refrigerators, clothes washers and dryers.
For this reason, and the fact that these categories were not mentioned in public accounts
of DOJ’s investigation, we use cooktops, freezers, ovens, and ranges as comparison groups.
Further, in Baker and Shapiro’s (2008) account of the merger, only clothes dryers and
washers were explicitly mentioned as areas of concern. To further reduce the possibility
that these comparison products experienced a price increase related to the merger, we
restrict the comparison group to brands not produced by Maytag or Whirlpool. While
the Bertrand model of Deneckere and Davidson (1985) predicts that rivals will increase
prices after the merger for most demand systems, they will do so by a smaller extent than
the merging firms.
3.1 Graphical Evidence
To determine if the merger increased appliance prices, we start by plotting average (log)
prices of Maytag and Whirlpool appliances in the markets where concentration changed
the most: dishwashers, clothes dryers and washers, and refrigerators. For comparison, we
10

also plot average prices of two appliance categories for which the merger arguably should
have had little if any effect: freezers and ranges that were not produced by Maytag or
Whirlpool.
Figure 3 contains the results with freezers as a comparison, and Figure 4 contains
the same plots but with ranges that were not produced by Maytag or Whirlpool for
comparison. The vertical lines indicate the date the merger was consummated, April of
2006.18 Recall that in order to avoid selection issues associated with left censoring, we
restricted our sample to products first introduced during the time period spanned by our
sample. This restriction causes our sample size to be very small in the first few months
of our sample. As a result our estimates of the monthly average log price during the first
few months of our sample are noisy. Therefore, when constructing the figures we exclude
the first four months of data and take the starting point to be June of 2005.
The figures plotting the raw data are somewhat noisy. There is some suggestive
evidence that the prices of dishwashers, dryers, and clothes washers increased relative
to both freezers and ranges over the sample period, but the exact timing of the relative
price increase varies somewhat by category. Dishwasher prices increased soon after the
merger but clothes washer and dryer prices increased several months afterwards. More
importantly, two issues make these graphs difficult to interpret as revealing the effects of
the merger. First, as seen in Figure 1, product prices decrease as they become older and
the composition of dishwashers, dryers, and clothes washers that are late in their life may
vary relative to the comparison appliances. If the composition of freezers becomes older
relative to dryers, this could generate the price profiles in Figures 3 and 4. Second, if
the composition of higher end and more expensive dryers sold increased over the sample
period, the graphs may simply reflect that.
In order to address these issues, we next plot how average prices conditional on ob-
servable characteristics and age vary over the sample period for each type of appliance.
18The exact date was March 30, 2006.
11

This was done by first fitting the following equation to the data with OLS separately for
each of the eight appliance categories:
log(pit) =∑
j
δjxij +
13∑
k=3
θkAgeit +
43∑
l=2
γlT imePeriodlt + ǫit (3)
where xij is characteristic j of product i, the Ageit are age dummies, and the T imePeriodlt
are month dummies. The omitted month dummy corresponds to the first month in the
data. We then plot the ˆ{γ}43
t=5against the corresponding time period.19
Figure 5 plots the adjusted prices of dishwashers, dryers, clothes washers and refrig-
erators against freezers. Figure 6 contains the same plots, but with ranges instead of
freezers. The average prices after conditioning on product characteristics and age are less
volatile than the raw data. While overall, dishwasher, dryer, and clothes washer prices
increased relative to both freezers and ranges, the figures may mask important differences
in pricing between products introduced before and after the merger date. We explore this
possibility in the next section.
3.2 Regression Estimates
We carry out inference by estimating how the prices of washers, dryers, dishwashers,
and refrigerators changed before and after the merger relative to four comparison groups:
freezers, ranges, cooktops and ovens. A natural starting point fits the following equation
to the data using OLS separately for each “treatment”/“comparison” pair:
log(pit) = β1 ∗Maytagi ∗ PostMergert + β2 ∗Whirlpooli ∗ PostMergert (4)
+
13∑
k=3
θTkAgeTit +
13∑
k=3
θCk AgeCit ++
43∑
l=2
δlT imePeriodlit + αi + ǫit
19Again, we start the plots in June of 2005 due to the small number of SKU’s in the initial months inour sample.
12

where pit is the average price of SKU i in month t.20 αi is an SKU-specific fixed effect,
and T imePeriodlit is a time indicator that allows for a common monthly change in log
prices in month l. AgeCit and AgeTit are a series of age indicators corresponding to the
appliance’s age in months for the comparison and treatment category, respectively. The
key parameters are β1 and β2, which measure the change in the log price of Maytag
and Whirlpool products relative to the change in log price of each comparison appliance
category.21
The presence of the SKU specific fixed effects αi in 4 implies that the price effects
are identified from products that existed both before and after the merger occurred. It
is impossible to identify the effect using products that did not exist both before and
after the merger, as for these products the Maytagi ∗ PostMergert and Whirlpooli ∗
PostMergert are perfectly collinear with the SKU fixed effects. This shortcoming is
potentially important: most products in the markets affected by the merger have short
lifetimes, roughly a year. The price effect of the merger could be systematically different
for products existing prior to the merger relative to those introduced after the merger.
For example, the merged firm might maintain its prices on products introduced prior to
the merger (on average, six months from the end of their life cycle), and increase the
price of products introduced following the merger. To explore this possibility, we replace
the SKU fixed effects with a linear combination of observable characteristics such as
brand dummies, a stainless steel indicator, and product size.22 We estimate the following
20Most merger retrospectives estimate some variation of this equation. See Weinberg (2008) for areview and description of the various comparison markets and products that have been used.
21Allowing separate time dummies for each month is more flexible than controlling only for commonpre and post-merger difference and allowing for SKU specific fixed effects is more flexible than allowingfor only a time invariant difference in the conditional mean between maytag/whirlpool and other brands.Of course, one cannot control for both a post merger dummy and monthly time effects nor both SKUfixed effects and a Maytag or Whirlpool dummy.
22A list of product specific characteristics (all specifications include brand dummies) used for eachtype of appliance is located in the data appendix. Measuring a product’s quality using observed productcharacteristics is a common approach used in the matching of new and discontinued products in pricemeasurement. The U.S. Bureau of Labor Statistics, for example, estimates hedonic regressions to estimatethe value of new product characteristics to control for changes in product quality.
13

equation using OLS:
log(pit) =∑
j
δTj ∗ xTij +∑
h
δCh ∗ xCih +43∑
l=2
θCl T imePeriodlit (5)
+ β1 ∗Maytagi ∗ PostMergert + β2 ∗Whirlpooli ∗ PostMergert
+13∑
k=3
θTkAgeTit +
13∑
k=3
θCk AgeCit + ǫit
The xTij include characteristics and brand dummies for Whirlpool/Maytag appliances and
xCih include characteristics and brand dummies of the comparison appliances.23 Standard
errors are clustered by SKU.
While specification 5 has the advantage that it can be used to estimate separate price
effects for products introduced after the merger was consummated, a potential drawback
is that if there are unobservable characteristics that systematically changed after the
merger occurred, the OLS estimator of 5 will be biased. To explore the efficacy of using
characteristics to control for product heterogeneity we estimate both equations 4 and 5
on the sample of SKU’s introduced within one year of the merger’s consummation date,
April 1, 2006. If unobservable product characteristics result in bias of the OLS estimator
of 5, we would expect the estimates of β1 and β2 to be different when estimated in
specification 4 than in specification 5.
The estimated price effects are shown in Appendix Tables 1-4, where each table cor-
responds to a different comparison group. Appendix Table 1, for example, presents the
estimated price effects for the four most affected appliance markets using cooktops as the
comparison group. The first two columns show that the estimated price effects for dish-
washers using either product fixed effects (column 1) or product characteristics (column
2) are virtually identical, about 4% for Whirlpool and 3% for Maytag. The estimated
23Note xTij are non-zero only if the SKU is a Maytag or Whilpool appliance and xC
ih are non-zero onlyif the SKU is a comparison appliance.
14

price effects for the other appliance markets in Appendix Table 1 are remarkably simi-
lar (typically within 0.1%) when using either fixed effects or product characteristics to
control for an SKU’s quality. This pattern holds not only when cooktops are used as a
comparison category, but also when freezers, ovens, or ranges are used for comparison (see
Appendix Tables 2-4, respectively). This finding suggests that unobserved time-invariant
product characteristics within an SKU are not correlated with the post-merger dummies,
conditional on observable characteristics. Because of the potential importance of pricing
differences for products introduced after the merger, and because the specifications with
fixed effects and product characteristic controls yield virtually identical merger effects, we
use measured product characteristics to control for product quality in the remainder of
this paper.
We next use a slight variation of specification 5 that allows the Maytag and Whirlpool
interactions with the post-merger dummy to vary by whether the product was introduced
before or after the merger date. This allows us to examine whether the merged manu-
facturer changed pricing differently for products introduced after the merger date. We
estimate the price effects on an expanded sample including all products that were born
within our sample period. Adding products that did not exist both before and after
the merger increases the sample size by between 35 and 57 percent, depending on the
appliance category.24
Tables 3 - 6 present the estimated price effects for dryers, dishwashers, refrigerators,
and clothes washers relative to each the four comparison appliance categories. In sum-
mary, we find systematic price increases for products introduced after the merger occurred
in two categories: dryers and dishwashers. Despite experiencing a large change in market
structure similar to the dryer market, we do not observe evidence of a price increase for
clothes washers. The results for refrigerators are more mixed. There is some evidence
24We also estimated all of the models using the level of prices as the dependent variable instead of thelog of price, and find qualitatively similar results. These results are available upon request.
15

of a small price increase, 2-4%, for Whirlpool refrigerators, however, this price effect is
imprecisely estimated and not as robust as the findings for clothes dryers or dishwashers.
The results for products introduced before the merger occurred are less robust to the
choice of comparison group. When measured relative to cooktops or freezers, appliance
prices appear to have increased while the price effects are much smaller (and sometimes
negative) when measured relative to ranges and ovens. We cannot reach a conclusion as
to how the merger affected pricing for these products.
The detailed results for dryers are presented in Table 3. The bottom two rows show
that across each of the four comparison appliance categories, the prices of newly introduced
Whirlpool and Maytag dryers increased. The magnitude of the price increase was large
for Whirlpool dryers, between 13 and 17 percent depending on the comparison group, and
the results are statistically significant at conventional levels. While the point estimates
suggest that prices of new Maytag dryers increased as well, the magnitude was less than
5 percent and we are unable to reject the null of no price increase at the .10 level. The
evidence on the impact of the merger on the prices of dryers that were introduced before
the merger is less robust. Relative to freezers and cooktops, pre-existing Maytag dryer
prices increased, but no effect is found relative to the other two comparison categories.
The estimates for Whirlpool dryers introduced before the merger indicate small price
decreases, if anything.
The results for dishwashers are presented in Table 4. Prices of Maytag dishwashers
introduced after the merger increased by between 5 and 7 percent and are statistically
significant at the .05 level, while Whirlpool dishwasher pricing remained essentially un-
changed. There is some evidence that prices of dishwashers introduced before the merger
increased as well, though the magnitudes are fairly sensitive to choice of comparison
appliance category.
Tables 5 and 6 present the results for refrigerators and clothes washers. Whirlpool re-
16

frigerator prices introduced after the merger increased slightly by 2-4%, and we can reject
the null of no price change at the .05 level for all specifications except when comparing
to freezers. We find no significant price changes for Maytag refrigerators, and none for
refrigerators introduced by the parties before the merger was consummated. Interestingly,
we find no evidence that the merger resulted in price changes for Maytag or Whirlpool
clothes washers.
As an additional test, we compare the change in Maytag and Whirlpool appliance
prices relative to rivals’ prices within each appliance category. To calculate these price
effects we estimate the following variant of equation 5 separately for each appliance
category:
log(pit) =∑
j
δj ∗ xij +13∑
k=3
θk ∗ Ageit +43∑
l=2
δl ∗ T imePeriodit (6)
+ β1 ∗Maytagi ∗ PostMergert ∗ PreMergerProducti
+ β2 ∗Whirlpooli ∗ PostMergert ∗ PreMergerProducti
+ β3 ∗Maytagi ∗ PostMergert ∗ PostMergerProducti
+ β2 ∗Whirlpooli ∗ PostMergert ∗ PostMergerProducti + ǫit
where xij are appliance characteristics and the other variables are as defined above. To
the extent that the merger increased prices, rivals may have increased prices in the post-
merger equilibrium as well. This would be true in the differentiated product Bertrand
model commonly used to simulate mergers and studied in Deneckere and Davidson (1985).
In this model, the extent to which rivals increase price depends on how quickly the absolute
value of demand elasticities increase as prices increase (Crooke, Froeb, Tschantz and
Werden (2003)). However, for a large class of demand systems Deneckere and Davidson
show that the merging firms will increase price by more than rivals. Therefore, if this
model describes pricing well, and if the merging firm’s products are important substitutes
17

for other appliances in the same category, then the estimated price effects from equation
(6) will be biased down but of correct sign.
The results appear in Table 7. The estimated price effects are generally consistent
with the findings from the other comparison groups. Starting with column 1 we see that
dishwashers introduced prior to the merger by Maytag and Whirlpool increased slightly
more than other manufacturers’ dishwashers. This is within the range seen in Table 3
for the other control groups. Similarly, we see that Maytag dishwashers had a relatively
large price increase of 8% relative to other manufacturers’ dishwashers. We also observe
a large price increase for Whirlpool dryers introduced following the merger, roughly 7%
relative to other manufacturers’ dryers. Finally, consistent with the other comparison
groups, the relative price of Maytag’s and Whirlpool’s refrigerators do not appear to have
changed much relative to the prices of other firms’ refrigerators. Maytag and Whirlpool’s
clothes washer prices, however, appear to have decreased relative to prices of rival clothes
washers.
3.3 Market Shares and Product Variety
The focus of our study is to determine if the acquisition of Maytag by Whirlpool increased
consumer prices. While the results vary somewhat with the choice of comparison appli-
ance category, overall we interpret our findings as indicating an increase in the price of
Maytag dishwashers and Whirlpool clothes dryers. We next examine whether the com-
bined Whirlpool/Maytag’s output falls in response to the price increases we observed. We
conduct this test by examining how the market share (either revenue or unit sales) of the
merged firm changed following the merger in each appliance market.
We estimate the change in the merging parties’ average monthly market share with a
simple regression of Whirlpool/Maytag’s monthly market share on a merger dummy. The
results for volume shares are in column 1 of Table 8 and the results for revenue shares are in
18

column 2. Volume and revenue shares fell significantly in each product category following
the merger, and not just those experiencing a relative price increase. Refrigerators’ and
clothes washers’ average revenue shares, for example, fell by an estimated 8.6 and 7.3
share points following the merger.
Why should Whirlpool/Maytag’s share of these categories have fallen so much follow-
ing the merger? One possibility is that the merged firm changed their product offerings.
We next explore whether Whirlpool/Maytag changed the number of items it sells. To do
this, we first identify distinct items (SKUs) that were sold in each time period. As noted
earlier, many SKUs in our data set have very few sales. For this reason, we limit our
attention to relatively high volume SKUs sold by appliance manufacturers. Specifically,
we calculate the number of SKUs with at least 100 unit sales sold by Whirlpool/Maytag
and all other appliance manufacturers for each month in our sample, and examine how
the number of items available for sale each month changed following the merger.25 We
first plot the number of SKUs offered each month by Whirlpool/Maytag and all other
manufacturers in Figure 7. The plots show a systematic drop in the relative number of
Whirlpool/Maytag SKUs offered for sale following the merger in each of the four most
affected appliance categories. The changes are most pronounced for clothes washers and
dryers where the combined Whirlpool accounted for the majority of items offered pre-
merger and a minority of items post-merger. Regressions of the monthly count of distinct
Whirlpool/Maytag SKUs on a post-merger dummy are reported in column 3 of Table 8.
The average monthly number of different products sold fell across appliance categories in
absolute terms, by about 10 units per month for Dryers and Washers and by about 12
SKUs for refrigerators. The absolute reduction in SKUs was quite small for dishwashers:
roughly 1 SKU.
To further explore the effect of the merger on our simple measure of product variety,
25SKUs with at least 100 monthly sales account for the overwhelming majority of unit sales in themost affected markets: 98% of clothes washers, 97% of clothes dryers, 93% of dishwashers and 91% ofrefrigerators.
19

we also estimate the relative change in the number of products sold by Whirlpool/Maytag
to account for the possibility that appliance manufacturers may have changed the number
of product offerings in response to either changes in demand or cost, e.g., an increased or
decreased demand for variety. We do this by estimating the following equation:
log SKUit = α+β∗Whirlpool/Maytagi+γMergert+δWhirlpool/Maytagi∗Mergert+ǫit
(7)
where the dependent variable is the log of the number of high volume SKUs sold in month t
(by any appliance manufacturer),Whirlpool/Maytagi is an indicator for Whirlpool/Maytag,
and Mergert is an indicator for the post-merger period. We interpret the coefficient on
the interaction term, δ, as the relative proportional change in the number of appliances
offered by Whirlpool/Maytag following the merger. The results are in column 4 of Table 8.
In relative terms, the reduction in variety is substantial for all four product categories.
This implies rival manufacturers were increasing the number of products offered in these
appliance markets while Whirlpool/Maytag was reducing its product offerings. Variety
was reduced, at least to the extent that SKU counts are a reasonable measure of variety.
4 Conclusions
Merger analysis is inherently prospective: the government must quickly make predictions
about how large discrete changes in market structure will affect markets. Forecasting how
changes in market structure will change consumer prices, costs, and incentives to innovate
is extraordinarily difficult. In the roughly 30 years since the passage of the Hart-Scott-
Rodino Act (which essentially started federal review of prospective mergers), the antitrust
agencies and the federal courts have developed methodologies, expertise, and expectations
about the types of information that will be probative in determining if mergers are likely to
harm consumers. Only by estimating the price effects of consummated mergers, however,
20

can we learn if the decision making process used by the courts and antitrust agencies is
successful in identifying and blocking mergers that raise consumer prices.
We have estimated the price effects of Whirlpool’s acquisition of Maytag because
the decision to not challenge this merger appears to be a break with previous government
decision making. The merger greatly increased concentration in several appliance markets
that were already concentrated. Both the popular press and academic economists stated
that the merger would have been challenged in the previous administration. Therefore,
this merger provides a relatively unique opportunity to examine if more lenient treatment
of mergers results in competitive harm.
This merger is also interesting because in contrast to most allowed mergers (where
the government states nothing about its reason for allowing the merger), the Department
of Justice provided a somewhat detailed justification for its decision. The Justice De-
partment stated that its investigation focused on laundry products (washers and dryers)
and that within this sector three factors led them to conclude that any attempt to raise
prices would likely be unsuccessful. First, the two largest domestic manufacturers (Elec-
trolux and GE) had substantial excess capacity and could expand output. Moreover,
recent successful foreign entrants (LG and Samsung) could import more products into
the U.S. in response to an anticompetitive price increase. Second, sales of the majority
of appliances are made by a small number of large retailers (Sears, Best Buy, Lowes,
and Home Depot) who “have alternatives available to help them resist an attempt by
the merged entity to raise price.” Third, “the parties (Maytag/Whirlpool) substantiated
large cost savings and other efficiencies that should benefit consumers.”26 We have esti-
mated the price effects of the merger for the four major appliance categories where the
change in market concentration was highest: washers and dryers, which were the focus of
the government’s investigation, and refrigerators and dishwashers. Relative to four com-
parison appliance categories, we find price increases for some, but not all, types. Prices of
26Department of Justice Closing statement, dated March 29, 2006.
21

Whirlpool clothes dryers and Maytag dishwashers introduced after the merger increased
by roughly 14% and 7%, respectively. We do not see systematic evidence of any price
change (increase or decrease) for Maytag or Whirlpool refrigerator or clothes washers.
Given Maytag and Whirlpool’s very similar pre-merger market share in the clothes
washer and dryer markets, we find it somewhat surprising to observe a price increase only
for dryers. One difference between the washer and dryer markets cited by the DOJ is that
the U.S. washer market is experiencing a change in technology. Consumers are switching
from traditional top loading washing machines, where Maytag and Whirlpool were most
successful, to more expensive but more efficient front loading machines. In this segment,
Whirlpool and Maytag were less successful and faced strong competition from imports
(such as Samsung and LG). In contrast, the dryer market is not undergoing a similar
change. The competitive factors the DOJ cited, particularly recent successful entry by
Samsung and LG, may have played an important role in maintaining washer pricing. In
total, however, the factors cited by the DOJ do not appear to have been sufficient to
maintain pre-merger price levels for either clothes dryers or dishwashers.
Obviously, mergers change much more than a firm’s pricing incentives. Firms likely
change their marketing strategies, product mix, and may be able to lower their costs
following mergers and acquisitions. Empirical work shows that mergers can affect a firms
optimal product selection (see, e.g., Sweeting (2010) and Berry and Waldfogel (2001)),
and that reductions in variety induced by merger can significantly reduce consumer wel-
fare (Draganska, Mazzeo and Seim (2010)). We observe a large reduction in the number
of distinct items (stock-keeping units or SKUs) offered to consumers following the acqui-
sition, and this reduction is largest in the clothes washer and dryer markets that were the
focus of the government’s investigation. If the number of distinct SKUs are a meaningful
measure of product variety, this finding suggests that the merger may have resulted in a
large, and potentially important, reduction in variety.
22

References
Ashenfelter, Orley C. and Daniel S. Hosken, “The Effect of Mergers on Consumer
Prices: Evidence from Five Mergers on the Enforcement Margin,” Journal of Law
and Economics, 2010, 53, 417–466.
Asker, John, “A Study of the Internal Organisation of a Bidding Cartel,” American
Economic Review, 2010, 100 (3), 724–62.
Baker, Jonathan, “The Case for Antitrust Enforcement,” Journal of Economic Per-
spectives, Fall 2003, 17 (4), 27–50.
Baker, Jonathan B. and Carl Shapiro, “Reinvigorating Horizontal Merger Enforce-
ment,” in R. Pitofsky, ed., Where the Chicago School Overshot the Mark: The Effect
of Conservative Economic Analysis on Antitrust, Oxford University Press, 2008.
Berry, Steven T. and Joel Waldfogel, “Do Mergers Increase Product Variety? Ev-
idence From Radio Broadcasting,” The Quarterly Journal of Economics, August
2001, 116 (3), 1009–1025.
Borenstein, Severin, “Airline Mergers, Airport Dominance, and Market Power,” Amer-
ican Economic Review, May 1990, 80 (2), 400–404.
Carlton, Dennis, “The Need to Measure the Effect of Merger Policy and How to Do
It,” Competition Policy International, 2009.
Chandra, Ambarish and Allan Collard-Wexler, “Mergers in Two-Sided Markets:
An Application to the Canadian Newspaper Industry,” Journal of Economics and
Mangement Strategy, Winter 2009, 18 (4), 1045–1070.
23

Crandall, Robert W. and Clifford Winston, “Does Antitrust Policy Improve Con-
sumer Welfare? Assessing the Evidence,” Journal of Economic Perspectives, Fall
2003, 17 (4), 3–26.
Crooke, Philip, Luke Froeb, Steven Tschantz, and Gregory J. Werden, “The
Effects of Assumed Demand Form on Simulated Post-Merger Equilibria,” Review of
Industrial Organization, Nov 2003, 15 (3), 205–217.
Deneckere, Raymond and Carl Davidson, “Incentives to Form Coalitions with
Bertrand Competition,” The RAND Journal of Economics, 1985, 16, 473–86.
Draganska, Michaela, Michael Mazzeo, and Katja Seim, “Addressing Endoge-
nous Product Choice in an Empirical Analysis of Merger Effects,” Working Paper,
Northwestern University 2010.
Focarelli, Dario and Fabio Panetta, “Are Mergers Beneficial to Consumers? Evidence
from the Market for Bank Deposits,” American Economic Review, September 2003,
93 (4), 1152–72.
Genesove, David and Wallace P. Mullin, “Rules, Communication, and Collusion:
Narrative Evidence from the Sugar Institute Case,” American Economic Review,
2001, 91 (3), 379–98.
Hastings, Justine S., “Vertical Relationships and Competition in Retail Gasoline Mar-
kets: Empirical Evidence from Contract Changes in Southern California,” American
Economic Review, March 2004, 94 (1), 317–328.
Hunter, Graeme, Gregory K. Leonard, and Steven Olley, “Merger Retrospective
Studies: A Review,” Antitrust, 2008, 23, 34–41.
Kim, E. Han and Vijay Singal, “Mergers and Market Power: Evidence from the U.S.
Airline Industry,” American Economic Review, 1993, 83, 549–569.
24

Moss, Diana, “Antitrust Analysis of Whirlpool’s Proposed Acquisition of Maytag,”
Technical Report, American Antitrust Institute 2006.
Prager, Robin A. and Timothy H. Hannan, “Do Substantial Horizontal Mergers
Generate Significant Price Effects? Evidence from the Banking Industry,” Journal
of Industrial Economics, December 1998, 46 (4), 433–52.
Sapienza, Paola, “The Effects of Banking Mergers on Loan Contracts,” Journal of
Finance, 2002, 1, 329–67.
Simpson, John and Christopher T. Taylor, “Do Gasoline Mergers Affect Consumer
Prices? The Marathon Ashland Petroleum and Ultramar Diamond Shamrock Trans-
action,” Journal of Law and Economics, 2008, 51 (1), 135–52.
Sweeting, Andrew, “The Effects of Mergers on Product Positioning: Evidence from
the Music Radio Industry,” RAND Journal of Economics, 2010, 41 (2), 372–97.
Taylor, Christopher T. and Daniel S. Hosken, “The Economic Effects of the
Marathon-Ashland Joint Venture: The Importance of Industry Supply Shocks and
Vertical Market Structure,” Journal of Industrial Economics, 09 2007, 55 (3), 419–
451.
Weinberg, Matthew C., “The Price Effects of Horizontal Mergers,” Journal of Com-
petition Law and Economics, July 2008, 4 (2), 433–47.
Whinston, Michael D., Lectures on Antitrust Economics, Cambridge, MA: MIT Press,
2006.
Winston, Clifford, Scott Dennis, and Vikram Maheshri, “Long Run Effects of
Mergers: The Case of US Western Railroads,” forthcoming in Journal of Law and
Economics.
25

Figure 1: Average Log Price by Age
−.6
−.4
−.2
0.2
(log)
pric
e
0 5 10 15 20 25Age of SKU in Months
Ovens
−.6
−.4
−.2
0.2
(log)
pric
e
0 5 10 15 20 25Age of SKU in Months
Cooktops
−.6
−.4
−.2
0.2
(log)
pric
e
0 5 10 15 20 25Age of SKU in Months
Freezers
−.6
−.4
−.2
0.2
(log)
pric
e
0 5 10 15 20 25Age of SKU in Months
Ranges
−.6
−.4
−.2
0.2
(log)
pric
e
0 5 10 15 20 25Age of SKU in Months
Dishwashers
−.6
−.4
−.2
0.2
(log)
pric
e0 5 10 15 20 25
Age of SKU in Months
Refrigerators
−.6
−.4
−.2
0.2
(log)
pric
e
0 5 10 15 20 25Age of SKU in Months
Dryers
−.6
−.4
−.2
0.2
(log)
pric
e
0 5 10 15 20 25Age of SKU in Months
Washing Machines
Notes: The figures plot coefficients on age dummies from a regression of log price on SKUfixed effects, age dummies, and time effects. Average log prices are measured relative toSKU’s first month with positive sales.
26

Figure 2: Average Log Volume by Age
−3
−2
−1
01
(log)
vol
ume
5 10 15 20 25Age of SKU in Months
Ovens
−3
−2
−1
01
(log)
vol
ume
5 10 15 20 25Age of SKU in Months
Cooktops
−3
−2
−1
01
(log)
vol
ume
5 10 15 20 25Age of SKU in Months
Freezers
−3
−2
−1
01
(log)
vol
ume
5 10 15 20 25Age of SKU in Months
Ranges
−3
−2
−1
01
(log)
vol
ume
5 10 15 20 25Age of SKU in Months
Dishwashers
−3
−2
−1
01
(log)
vol
ume
5 10 15 20 25Age of SKU in Months
Refrigerators
−3
−2
−1
01
(log)
vol
ume
5 10 15 20 25Age of SKU in Months
Dryers
−3
−2
−1
01
(log)
vol
ume
5 10 15 20 25Age of SKU in Months
Washing Machines
Notes: The figures plot coefficients on age dummies from a regression of log volume on SKUfixed effects, age dummies, and time effects. Average log prices are measured relative toSKU’s first month with positive sales.
27

Figure 3: Averages of Log Price: Freezer Comparison
5.5
66.
57
2005m7 2006m7 2007m7 2008m7date
Dishwashers Freezers
5.5
66.
57
2005m7 2006m7 2007m7 2008m7date
Dryers Freezers
5.5
66.
57
2005m7 2006m7 2007m7 2008m7date
Clothes Washers Freezers
5.5
66.
57
2005m7 2006m7 2007m7 2008m7date
Refrigerators Freezers
Notes: Solid line is average log price of either Maytag and Whirlpool dishwashers, clothes dryers,clothes washers, and refrigerators. Dashed line is average log price of freezers. The plot spans May of2005-September of 2008. All products were born within the sample period. The vertical line correspondsto the merger’s consummation date, April 2006. The merger was consummated on March 30, 2006.
28
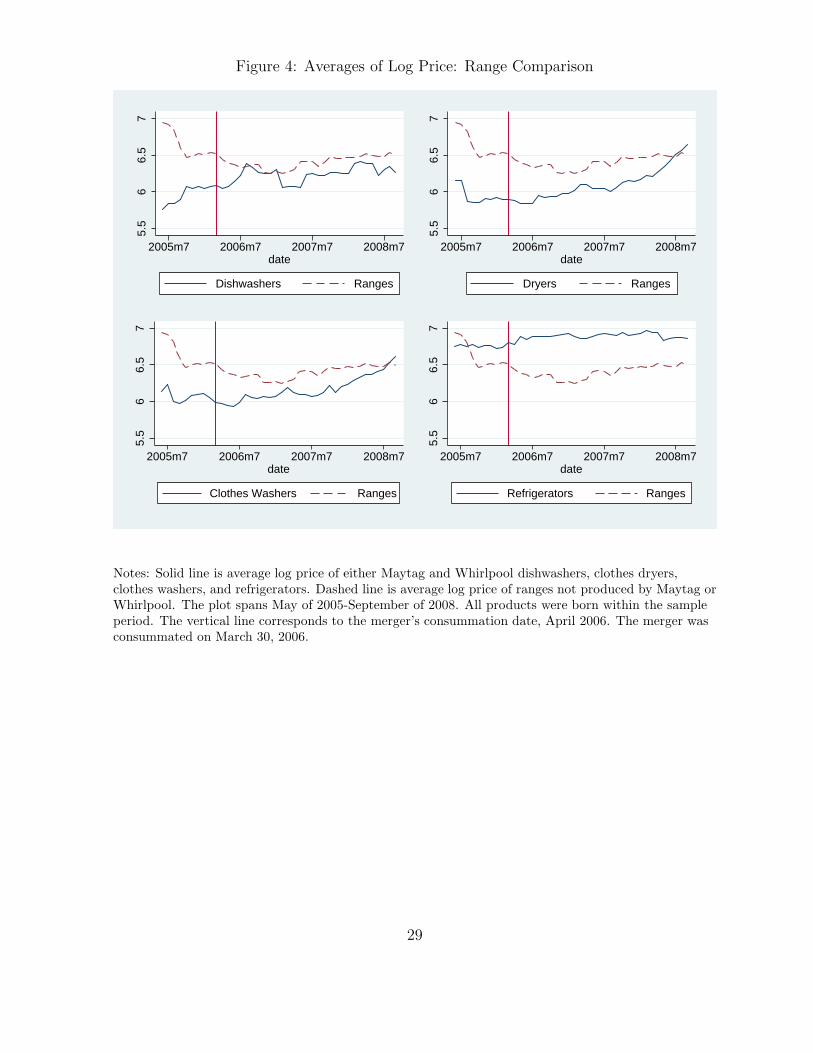
Figure 4: Averages of Log Price: Range Comparison
5.5
66.
57
2005m7 2006m7 2007m7 2008m7date
Dishwashers Ranges
5.5
66.
57
2005m7 2006m7 2007m7 2008m7date
Dryers Ranges
5.5
66.
57
2005m7 2006m7 2007m7 2008m7date
Clothes Washers Ranges
5.5
66.
57
2005m7 2006m7 2007m7 2008m7date
Refrigerators Ranges
Notes: Solid line is average log price of either Maytag and Whirlpool dishwashers, clothes dryers,clothes washers, and refrigerators. Dashed line is average log price of ranges not produced by Maytag orWhirlpool. The plot spans May of 2005-September of 2008. All products were born within the sampleperiod. The vertical line corresponds to the merger’s consummation date, April 2006. The merger wasconsummated on March 30, 2006.
29

Figure 5: Averages of Log Price Conditional on Product Characteristics and Age Dum-mies: Freezer Comparison
−.4
−.2
0.2
.4
2005m7 2006m7 2007m7 2008m7date
Dishwashers Freezers
−.4
−.2
0.2
.4
2005m7 2006m7 2007m7 2008m7date
Dryers Freezers
−.4
−.2
0.2
.4
2005m7 2006m7 2007m7 2008m7date
Clothes Washers Freezers
−.4
−.2
0.2
.4
2005m7 2006m7 2007m7 2008m7date
Refrigerators Freezers
Notes: Solid line is age and characteristic adjusted average log price of either Maytag and Whirlpooldishwashers, clothes dryers, clothes washers, and refrigerators. Dashed line is age and characteristicadjusted average log price of freezers. The plot spans May of 2005-September of 2008. All productswere born within the sample period. The vertical line corresponds to the merger’s consummation date,April 2006. The merger was consummated on March 30, 2006.
30

Figure 6: Averages of Log Price Conditional on Product Characteristics and Age Dum-mies: Range Comparison
−.2
0.2
.4
2005m7 2006m7 2007m7 2008m7date
Dishwashers Ranges
−.2
0.2
.4
2005m7 2006m7 2007m7 2008m7date
Dryers Ranges
−.2
0.2
.4
2005m7 2006m7 2007m7 2008m7date
Clothes Washers Ranges
−.2
0.2
.4
2005m7 2006m7 2007m7 2008m7date
Refrigerators Ranges
Notes: Solid line is age and characteristic adjusted average log price of either Maytag and Whirlpooldishwashers, clothes dryers, clothes washers, and refrigerators. Dashed line is age and characteristicadjusted average log price of ranges not produced by Maytag or Whirlpool. The plot spans May of2005-September of 2008. All products were born within the sample period. The vertical line correspondsto the merger’s consummation date, April 2006. The merger was consummated on March 30, 2006.
31

Figure 7: SKU Counts
5060
7080
9010
0
2005m1 2006m1 2007m1 2008m1 2009m1Date
Maytag/Whirlpool All Rivals
Clothes Washers
4060
8010
012
0
2005m1 2006m1 2007m1 2008m1 2009m1Date
Maytag/Whirlpool All Rivals
Dish Washers60
8010
012
0
2005m1 2006m1 2007m1 2008m1 2009m1Date
Maytag/Whirlpool All Rivals
Dryers
100
150
200
250
300
2005m1 2006m1 2007m1 2008m1 2009m1Date
Maytag/Whirlpool All Rivals
Refrigerators
Notes: Solid lines are the count of Whirlpool/Maytag SKUs with at least 100 unit sales. Dashed line isthe count for all other manufacturers. The plot spans January of 2005-September of 2008. All productswere born within the sample period. The vertical line corresponds to the merger’s consummation date,April 2006. The merger was consummated on March 30, 2006.
32

Table 1: Pre-Merger Market Shares for Markets With LargestChange in Concentration Following Whirlpool-Maytag
Dishwashers Clothes DryersManufacturer Revenue Share Manufacturer Revenue ShareBosch 6.2% Bosch 1.9%Electrolux 25.1% Electrolux 8.9%Fisher-Paykel 2.4% Fisher-Paykel 1.8%GE 12.47% GE 12.2%LG 1.6% LG 9.6%Maytag 11.4% Maytag 16.6%
Miele 1.3% Whirlpool 48.8%
Whirlpool 38.6% Other 0.1%Other 0.9% Pre-Merger HHI 2983Pre-Merger HHI 2453 Change in HHI 1620Change in HHI 880
Refrigerators Clothes WashersManufacturer Revenue Share Manufacturer Revenue ShareElectrolux 24.1% Bosch 2.4%GE 10.9% Electrolux 13.8%LG 6.1% Fisher Paykel 2.1%Maytag 9.2% GE 10.5%Samsung 4.2% LG 10.2%Sub-Zero 2.4% Maytag 16.8%
Whirlpool 41.8% Whirlpool 44.0%
Other 1.4% Other 0.3%Pre-Merger HHI 2595 Pre-Merger HHI 2632Change in HHI 770 Change in HHI 1478
33

Table 2: Pre-Merger Market Shares for Markets With Smaller orNo Change in Concentration Following Whirlpool-Maytag
Cooktop FreezerManufacturer Revenue Share Manufacturer Revenue ShareBosch 8.4% Avanti Pro 1.4%Dacor 1.9% Electrolux 81.3%Electrolux 19.1% Haier 12.8%Fisher-Paykel 1.4% Other 2.0%GE 20.8% Sub-Zero 1.5%Maytag 9.5% Wood 1.0%Miele 1.1% Pre-Merger HHI 6789Other 0.00% Change in HHI 0Sub-Zero 8.2%Viking 7.6%Whirlpool 22.0%
Pre-Merger HHI 1571Change in HHI 416
Oven RangeManufacturer Revenue Share Manufacturer Revenue ShareBosch 10.1% Bosch 1.2%Dacor 1.9% Electrolux 37.6%Electrolux 10.5% GE 25.3%Fisher-Paykel 1.6% Maytag 5.2%
GE 23.1% Other 1.0%Maytag 6.3% Premier 1.7%Miele 2.3% Sub-Zero 1.8%Other 0.00% Viking 1.7%Sub-Zero 7.9% Whirlpool 24.7%
Viking 3.8% Pre-Merger HHI 2703Whirlpool 32.5% Change in HHI 256Pre-Merger HHI 1929Change in HHI 412
34

Table 3: Price Effects of Dryers Relative to Other Appliances
Comparison CategoryCooktops Freezers Ovens Ranges
Post*Old*Whirlpool -0.0172 0.0291 -0.0654 -0.0602(0.0198) (0.0347) (0.0218) (0.0176)
Post*Old*Maytag 0.0437 0.0903 -0.0102 0.000473(0.0132) (0.0310) (0.0153) (0.00671)
Post*New*Whirlpool 0.133 0.140 0.171 0.144(0.0653) (0.0479) (0.0471) (0.0542)
Post*New*Maytag 0.00486 0.0113 0.0574 0.0318(0.0864) (0.0622) (0.0623) (0.0757)
Observations 2657 2206 2563 4429Number of SKU 250 225 240 403
Notes : Standard errors in parentheses allow for arbitrary serial correlationand heteroskedasticity within SKU. Product characteristics included in allspecifications. Authors’ own calculations on monthly NPD data from April2005 through September 2008.
Table 4: Price Effects of Dishwashers Relative to Other Appli-ances
Comparison CategoryCooktops Freezers Ovens Ranges
Post*Old*Whirlpool 0.0325 0.0855 -0.00769 0.0124(0.0135) (0.0307) (0.0168) (0.00739)
Post*Old*Maytag 0.0275 0.0826 -0.00919 0.0100(0.0161) (0.0310) (0.0188) (0.0107)
Post*New*Whirlpool -0.00127 -0.0160 0.00463 0.00115(0.0157) (0.0161) (0.0151) (0.00684)
Post*New*Maytag 0.0662 0.0480 0.0711 0.0743(0.0206) (0.0200) (0.0200) (0.0163)
Observations 2296 1845 2202 4068Number of SKU 211 186 201 364
Notes : Standard errors in parentheses allow for arbitrary serial correlationand heteroskedasticity within SKU. Product characteristics included in allspecifications. Authors’ own calculations on monthly NPD data from April2005 through September 2008.
35

Table 5: Price Effects of Refrigerators Relative to Other Appli-ances
Comparison CategoryCooktops Freezers Ovens Ranges
Post*Old*Whirlpool -0.0213 0.0455 -0.0465 -0.0221(0.0227) (0.0341) (0.0240) (0.0202)
Post*Old*Maytag -0.0266 0.0370 -0.0506 -0.0254(0.0267) (0.0363) (0.0286) (0.0251)
Post*New*Whirlpool 0.0388 0.0194 0.0389 0.0210(0.0159) (0.0164) (0.0145) (0.00951)
Post*New*Maytag 0.00602 -0.00641 0.0157 0.00960(0.0212) (0.0229) (0.0200) (0.0164)
Observations 3534 3083 3440 5306Number of sku1 359 334 349 512
Notes : Standard errors in parentheses allow for arbitrary serial correlationand heteroskedasticity within SKU. Product characteristics included in allspecifications. Authors’ own calculations on monthly NPD data from April2005 through September 2008.
Table 6: Price Effects of Washers Relative to Other Appliances
Comparison CategoryCooktops Freezers Ovens Ranges
Post*Old*Whirlpool -0.00856 0.0341 -0.0556 -0.0431(0.0256) (0.0373) (0.0273) (0.0231)
Post*Old*Maytag 0.0383 0.0848 -0.0117 0.00310(0.0177) (0.0318) (0.0195) (0.0127)
Post*New*Whirlpool -0.0175 -0.0409 -0.0150 -0.0202(0.0171) (0.0175) (0.0176) (0.0106)
Post*New*Maytag 0.0157 -0.00743 0.0223 0.0171(0.0179) (0.0179) (0.0180) (0.0111)
Observations 2264 1813 2170 4036Number of SKU 218 193 208 371
Notes : Standard errors in parentheses allow for arbitrary serial correlationand heteroskedasticity within SKU. Product characteristics included in allspecifications. Authors’ own calculations on monthly NPD data from April2005 through September 2008.
36

Table 7: Price Effects of Merging Party Appliances Relative toRivals
Appliance TypeDishwashers Refrigerators Dryers Washers
Post*Old*Whirlpool 0.024 -0.044 -0.055 -0.040(0.008) (0.021) (0.018) (0.027)
Post*Old*Maytag 0.030 -0.045 0.008 0.006(0.011) (0.025) (0.008) (0.017)
Post*New*Whirlpool 0.014 0.008 0.073 -0.047(0.007) (0.009) (0.030) (0.013)
Post*New*Maytag 0.082 -0.026 -0.002 -0.014(0.015) (0.017) (0.040) (0.014)
Observations 2895 5902 3088 2456Number of SKU 257 605 284 232
Notes : Standard errors in parentheses allow for arbitrary serial correlationand heteroskedasticity within SKU. Product characteristics included in allspecifications. Authors’ own calculations on monthly NPD data from April2005 through September 2008.
37

Table 8: Change in Whirlpool/Maytag’s Market Share and Prod-uct Offerings Following the Merger
Product Change in Absolute RelativeSharea Change in Change in
Products ProductsOfferedb Offeredc
Revenue VolumeShare Share
Dish Washer -0.046 -0.043 -1.067 -0.219(0.010) (0.011) (1.862) (0.044)
Clothes Dryer -0.095 -0.068 -9.767 -0.527(0.009) (0.008) (2.690) (0.046)
Refrigerator -0.086 -0.110 -12.500 -0.266(0.011) (0.013) (5.392) (0.050)
Clothes Washer -0.073 -0.053 -10.367 -0.527(0.008) (0.007) (2.613) (0.050)
Observations 45 45 45 90
Notes : aRegression of market share on merger indicator. bRegression ofthe number of SKU’s with more than 100 unit sales in a month on Mergerindicator. cRegression of the log of the number of SKU’s with more than 100unit sales in a month on Merger indicator, Whirlpool/Maytag indicator, andtheir interaction. Standard errors in parentheses. Authors’ own calculationson monthly NPD data from April 2005 through September 2008.
38

A Data Appendix
This section describes the product characteristics available in the NPD data and used as
controls in specification 5. For dishwashers, we have dummy variables indicating if the
product is stainless steel, has a stainless steel look, is black, has some other color, is not
digital, is energy star certified, has a stainless steel interior, has 1-4 cycles, has 5 cycles,
has 6 cycles, has sound control, and is portable.
For refrigerators, we include dummy variables indicating if the product is stainless
steel, has a stainless steel look, is black, is some other color, has an ice and water dispenser
in the door, has crisper and meat drawers, is energy star certified, has an ice maker, has
wire shelves, and has a water filtration system. We also include 8 depth dummies, 7
height dummies, 14 capacity dummies, and 5 width dummies.
For clothes washers, we include dummy variables indicating if the product is stainless
steel, black, some other color, is pre-stacked or stackable, has a soil sensor, has a load
sensor, has between 700 and 1000 RPMs, and 8 dummies indicating number of cycles and
3 dummies indicating capacity. We do not include an indicator for front-loading washers
because this indicator was collinear with the other controls we used. Recall, we focus on
washers produced by Maytag and Whirlpool, which were not large manufacturers of front
loading washers.
For clothes dryers, we include dummy variables indicating if the product is stainless
steel, black, some other color, has a delicate cycle, has a drop down door, has a dryer
rack included, is more than 27 inches in width, is gas powered, and 3 capacity dummies,
7 number of program dummies, and 7 temperature dummies.
For freezers, we include variables indicating if the product is stainless steel, has a
defrost drain, has an ice maker, has a light, has a lock, has baskets, is a chest, and 9 size
dummies. We also include indicators of whether the freezer has 3, 4, 5, or 8 shelves.
For ovens, we include dummy variables indicating if the product is stainless steel, has
39

no cleaning option, is electric, has a convection fan, is a double oven, has a microwave, 4
capacity dummies, and 2 width dummies.
For cooktops, we include dummy variables indicating if the product is stainless steel,
is black, has an electronic timer, has an electric coil, has a mechanical timer, and 2 width
dummies.
For ranges, we include dummy variables indicating if the product is stainless steel, has
a stainless steel look, is black, has some other color, includes a convection oven, includes
a microwave, is double conventional, has electronic controls and timer, has a mechanical
timer, has an electric coil, has sealed burners, has electronic ignition, is a slide in range,
and 4 capacity dummies and 4 width dummies.
40

B Additional Tables
41

Table 1: Comparison of Estimated Price Effects Relative to Cooktops Using SKU Fixed Effects and Product Characteristics
Dishwashers Dryers Refrigerators Washers
Post*Whirlpool 0.0432 0.0415 -0.0292 -0.0298 -0.0196 -0.0209 -0.0277 -0.0282(0.0228) (0.0234) (0.0308) (0.0314) (0.0280) (0.0283) (0.0365) (0.0365)
Post*Maytag 0.0327 0.0324 0.0332 0.0327 -0.0310 -0.0316 0.0167 0.0176(0.0211) (0.0216) (0.0199) (0.0206) (0.0432) (0.0434) (0.0251) (0.0257)
SKU Fixed Effects Yes No Yes No Yes No Yes NoProduct Characteristics No Yes No Yes No Yes No YesObservations 1392 1392 1449 1449 2025 2025 1275 1275Number of SKUs 153 153 179 179 231 231 155 155
Notes: Estimated on the set of products that were sold before and after the merger. Standard errors in parentheses allow for arbitraryheteroskedasticity and serial correlation within an SKU. Authors’ own calculations on monthly NPD data from April 2005 through September2008.
42

Table 2: Comparison of Estimated Price Effects Relative to Freezers Using SKU Fixed Effects and Product Characteristics
Dishwashers Dryers Refrigerators Washers
Post*Whirlpool 0.120 0.105 0.0557 0.0433 0.0866 0.0663 0.0575 0.0466(0.0360) (0.0331) (0.0374) (0.0345) (0.0391) (0.0348) (0.0420) (0.0382)
Post*Maytag 0.109 0.0979 0.121 0.110 0.0698 0.0511 0.106 0.0975(0.0353) (0.0327) (0.0343) (0.0314) (0.0422) (0.0372) (0.0366) (0.0330)
SKU Fixed Effects Yes No Yes No Yes No Yes NoProduct Characteristics No Yes No Yes No Yes No YesObservations 1088 1088 1145 1145 1721 1721 971 971SKUs 121 121 147 147 199 199 123 123
Notes: Estimated on the set of products that were sold before and after the merger. Standard errors in parentheses allow for arbitraryheteroskedasticity and serial correlation within an SKU. Authors’ own calculations on monthly NPD data from April 2005 through September2008.
43

Table 3: Comparison of Estimated Price Effects Relative to Ovens Using SKU Fixed Effects and Product Characteristics
Dishwashers Dryers Refrigerators Washers
Post*Whirlpool 0.0268 0.0196 -0.100 -0.102 -0.0392 -0.0433 -0.0656 -0.0667(0.0320) (0.0323) (0.0452) (0.0446) (0.0324) (0.0307) (0.0444) (0.0424)
Post*Maytag 0.0196 0.0165 -0.0388 -0.0413 -0.0491 -0.0516 -0.0228 -0.0205(0.0311) (0.0314) (0.0376) (0.0367) (0.0491) (0.0477) (0.0358) (0.0348)
SKU Fixed Effects Yes No Yes No Yes No Yes NoProduct Characteristics No Yes No Yes No Yes No YesObservations 1088 1088 1145 1145 1721 1721 971 971Number of SKUs 120 120 146 146 198 198 122 122
Notes: Estimated on the set of products that were sold before and after the merger. Standard errors in parentheses allow for arbitraryheteroskedasticity and serial correlation within an SKU. Authors’ own calculations on monthly NPD data from April 2005 through September2008.
44

Table 4: Comparison of Estimated Price Effects Relative to Ranges Using SKU Fixed Effects and Product Characteristics
Dishwashers Dryers Refrigerators Washers
Post*Whirlpool 0.0299 0.0284 -0.0339 -0.0349 -0.0143 -0.0160 -0.0341 -0.0351(0.0170) (0.0173) (0.0298) (0.0301) (0.0271) (0.0271) (0.0347) (0.0346)
Post*Maytag 0.0168 0.0164 0.0285 0.0275 -0.0257 -0.0266 0.0104 0.0105(0.0163) (0.0165) (0.0168) (0.0171) (0.0416) (0.0416) (0.0211) (0.0213)
SKU Fixed Effects Yes No Yes No Yes No Yes NoProduct Characteristics No Yes No Yes No Yes No YesObservations 2072 2072 2129 2129 2705 2705 1955 1955Number of SKUs 213 213 239 239 291 291 215 215
Notes: Estimated on the set of products that were sold before and after the merger. Standard errors in parentheses allow for arbitraryheteroskedasticity and serial correlation within an SKU. Authors’ own calculations on monthly NPD data from April 2005 through September2008.
45


