Download - The Racially Fragmented City? - MixedMetro
The Racially Fragmented City? 1
The Racially Fragmented City? Neighborhood Racial Segregation and Diversity Jointly
Considered
Forthcoming in The Professional Geographer 2011

The Racially Fragmented City? 2
Abstract:
This essay reflects on the racial configuration of urban space. Previous research tends to posit
racial segregation and diversity as either endpoints on a continuum of racial dominance or
mirror images of one another. In this paper we argue that segregation and diversity must be
jointly understood; they are necessarily related, though not inevitably as binary opposites. Our
view is that the neighborhood geographies of US metropolitan areas are simultaneously and
increasingly marked by both racial segregation and racial diversity. We inspect the
neighborhood racial structure of several large metropolitan areas for 1990 and 2000 to
demonstrate the ―both/and‖-ness of segregation and diversity.
Key words: racial segregation, racial diversity, racialized urban space
The Racially Fragmented City? 3
“If you wish to ride with me you must come into the “Jim Crow Car.” There
will be no objection—already four other white men, and a little white girl
with her nurse, are in there. Usually the races are mixed in there; but the
white coach is all white. Of course this car is not so good as the other, but it
is fairly clean and comfortable.” WEB DuBois The Souls of Black Folk,
(1903 93)
The Souls of Black Folk is a sociological classic and a historically important documentation of the
everyday lives of African Americans at the turn of the twentieth century. It‘s best remembered
for DuBois‘ prediction that ―the problem of the Twentieth Century is the problem of the color-
line‖. We take our lead here, however, from this other passage that shows how racial mixing in
―Jim Crow Cars‖ framed segregation in the all-white section of trains. Racial separation has
rarely been, so to speak, simply black and white.
This essay concerns racial segregation and diversity. Our interest is not rail cars but the
neighborhoods that comprise US metropolitan areas (MSAs), and not the turn of the twentieth
century but the turn of the twenty-first. When residential segregation is jointly considered
with its opposite (i.e., racial diversity), they are usually positioned as the binary endpoints of a
uni-dimensional continuum of racial dominance. In this view, as neighborhoods become less
segregated, they necessarily become more racially diverse and vice-versa. That is to say,
neighborhoods are ―either/or‖ – either they are racially segregated to varying degrees or they
are racially diverse to varying degrees. This ontology reduces segregation and diversity to
mirror images of one another. We agree that segregation and diversity must be jointly
considered and are necessarily related, but we resist the temptation to conflate them into a
single continuum of racial variability. We make the case that the neighborhood geographies of
The Racially Fragmented City? 4
MSAs are increasingly marked by both racial segregation and racial diversity. Using a new
variant of an old technique, we present case studies of several large MSAs to showcase the
―both/and‖-ness of diversity and segregation.
Our perspective recognizes ―folds‖ in the racial continuum enabling a reinterpretation of the
racial landscapes of metropolitan places. To illustrate, a gradational view of segregation and
diversity would designate a neighborhood, say, ―moderately diverse‖. Such a perspective misses
the meaningful distinction between a moderately diverse neighborhood where blacks are the
dominant racial group and a moderately diverse neighborhood where Latinos are the dominant
racialized group.1 These neighborhoods are both, to a degree, segregated (with a black- or
Latino- majority) and integrated (in the sense that the area contains a significant presence of
other groups). Operationally, we present a simple-to-understand, cross-sectional classification
scheme that is easily deployed using publicly available Census data. Specifically, by intersecting
levels of segregation by levels of diversity, we distinguish groups of tracts by how diverse they
are (low, medium, and high) by which racial group is numerically dominant. This classification
scheme also allows for the analysis of neighborhood racial dynamics across census year.
By investigating the segregations and diversities that mark urban space, we move beyond
binary thinking embedded in references to the ―black-white divide‖ or questions such as ―to
what degree is this neighborhood segregated or diverse?‖ In so doing, the analysis offers a re-
reading of changing racial landscapes in US neighborhoods that builds on other efforts to re-
imagine geographies of race (Delaney 2002). Another, more direct, interpretation of this work
is as a response to the call by Johnston et al. (2009 91) for an infusion of ―more geography‖ into
studies of urban segregation.
The Racially Fragmented City? 5
The essay proceeds as follows. A brief review of the literature on segregation measurement
features some of the recent contributions that privilege spatial relations and those that try to
account for the increasingly multiracial compositions of contemporary MSAs. We then detail
our neighborhood classification scheme and illustrate its utility in three ways. The first uses the
summary counts of neighborhood type for sixteen MSAs comparing 1990 with 2000. We then
produce pairs of maps for three MSAs that show cartographically how the spaces of diversity
and segregation have shifted over this decade. We also summarize these changes using
transition matrices that pinpoint the types of neighborhoods that have shifted classification.
The conclusions broaden the discussion to contemplate, among other things, how future
applications of the technique may unpack other dimensions of neighborhood diversity/
segregation.
Background
Chicago School sociologists produced the first conceptual framework to comprehend the racial
and ethnic residential patchworks in US cities (e.g., Park & Burgess 1984[1925]; Sibley 1995
offers an alternative view). The index of dissimilarity emerged in the 1950s as the preferred
method from these exchanges and its status went unchallenged for several decades. Then, in
the 1970s, researchers started to question the interpretability of the dissimilarity measure, and
advocated for a variety of increasingly sophisticated alternatives (e.g., Cortese, Falk, and Cohen
1976; Jakubs 1977; Falk, Cortese, and Cohen 1978; Massey 1978; Winship 1977, 1978; Sakoda
1981). The index of dissimilarity still dominates, but instead of reigning supreme as it did in
the past it now heads a growing pack of indexes designed to summarize different dimensions of
The Racially Fragmented City? 6
segregation (for reviews, see, for example, White 1986; Massey and Denton 1988; Simpson
2004).
Geographers have joined these debates, proposing a number of extensions to enhance the
spatial and scalar properties of segregation measures (e.g., Brown and Chung 2006; Ellis et al.
2007; Jakubs 1981; Johnston et al. 2009; Reardon and O‘Sullivan 2004; Wong 1998; 2002; 2008;
Wu and Sui 2001). Most of these approaches offer new ways of measuring segregation
accounting for the spatial distribution of groups and individuals and/or accounting for the
increasingly multiethnic makeup of MSAs. To the best of our knowledge, few researchers start
from the idea that segregation and diversity fold together. As we have no interest in joining a
―which index is best‖ fracas, rather than providing a long recitation of previous research layered
with a comprehensive comparative analysis, we contextualize our analysis in two ways. First,
we rehearse the Johnston, Poulsen, and Forrest‘s innovations designed to analyze segregation
comparatively (e.g., Johnston et al. 2003; 2004; 2005; 2006a; 2006b; 2007; Poulsen et al. 2002a;
2002b). Second, we tap the literature on neighborhood stability. This work categorizes census
tracts according to criteria often associated with neighborhood racial mix.
Johnston, Poulsen, and Forrest
The volume of papers published in the last decade using Johnston et al.‘s method for
comparative segregation analysis requires we situate our work relative to the framework they
have developed. These scholars acknowledge that their scheme is based on arbitrary divisions,
as are all such schemes. They differentiate areas (neighborhoods, tracts, blocks, etc.) that are
predominantly white (sometimes called ―host society‖ and/or ―settler society‖) from all others.
The Racially Fragmented City? 7
They then subdivide these white areas into two categories depending on whether the
percentage white is greater than or less than 80 percent. All remaining areas are then divided
based on the degree of racial compositional mixing in the neighborhood (from [1] areas where
whites are a substantial minority of the area‘s population to [2] areas that are not dominated
by any single group through to [3] areas that are dominated by a single minority [non-white]
group.) Rhetorically and in practice, Johnston and his colleagues are careful to delineate that
there are multiple variants of the last two categories in their scheme – one for each minority
(non-white) group present in the population.
Generally, the Johnston et al. framework consists of 6 basic categories (the last 2 categories can
be expanded as needed to account for multiple non-white minority groups). It has several
strengths. First, their approach recognizes multiple ―types‖ of segregation, including the
possibility that areas are compositionally plural. Second, it provides a conceptually stable
taxonomy that can be applied to studies of change over time and across national contexts,
where the specific racial groups identified in national censuses differ. This is an important
innovation and opens up a set of new research areas.
Their approach accents the analysis of multiple types of segregation, rather than residential
mixing. It also places whites center stage. This is perhaps understandable in light of the
persistence of white racial dominance in all walks of life including housing markets. In terms of
analyzing racially mixed neighborhoods, their method only distinguishes neighborhoods with a
strong white numerical minority from those where whites are less strongly represented. This
means it is empirically unable to ―see‖ neighborhoods that are mixed and have specific non-
white groups as the most numerous (Peach 2009). We feel that in both cross-sectional and
The Racially Fragmented City? 8
change-over-time senses, it is increasingly important to recognize multiple types of mixed
neighborhoods, with attention to the specific non-white groups that characterize these spaces.
Our approach highlights both a) multiple types of segregation (without implying equivalence
between areas where whites are the majority and areas where non-whites are the dominant
population) and b) multiple types of diversity.
Neighborhood Stability and Neighborhood Transition
A related strand of research that helps contextualize our ideas is that subset of the literature
devoted to neighborhood stability and transition in a multiethnic framework. Like Johnston
and his collaborators, this group of scholars deploys typologies of neighborhoods that include
multiple types of racially diverse areas (e.g., Denton and Massey 1991; Ellen 2000; Fasenfest et
al. 2006; Friedman 2008; Rawlings et al. 2004; see also Reibel and Regelson 2007; Lee 1985;
Lee and Wood 1990). Fasenfest et al. (2006) observe the growing diversity of metropolitan
America and ask how these larger trends play out in neighborhoods. As they think about the
long-term trends toward greater diversity, they devote considerable attention to the stability
over time of diverse neighborhoods. They are particularly interested in the impact of
neighborhoods that show stable mixing between blacks and white. Stably integrated
neighborhoods are important as an object of study because their existence suggests that spaces
of racial mixing are not necessarily the transitory products of ―white flight‖ or ―gentrification‖.
Fasenfest et al. (2006) design a classification scheme, typical in this sort of work (cf. Freidman
2008; Jones 2008), for neighborhood types that treats blacks and whites separately and all other
minorities grouped into a class they call ―Other.‖ Looking at the 10 largest MSAs, they imagine
two general sorts of neighborhood: Homogenous and Mixed-race. Homogenous neighborhoods
The Racially Fragmented City? 9
have three subtypes:
1) ―Predominantly white‖: >80% white and no minority > 10%.
2) ―Predominantly Black‖: > 50% black and no other minority > than 10%.
3) ―Predominantly other‖: > 50% nonblack minority and < 10% black.
Mixed neighborhoods have 4 subtypes.
1) ―Mixed white/other‖: 10-50% nonblack minority and <10% black.
2) ―Mixed white/black‖: 10-50% black and < 10% nonblack minority.
3) ―Mixed black/other‖: >10% black, >10% nonblack minority and < 40%white.
4) ―Mixed multi-ethnic‖: >10% black, >10% nonblack minority and > 40% white.
Fasenfest et al. (2006) discuss their typology in the context of what they differentiate as
absolute vs. comparative approaches to defining neighborhood racial composition. By this, they
distinguish absolute approaches that apply pre-defined categories to all MSAs from
comparative approaches that take into consideration the racial composition of the metropolitan
area in defining the categories. Fasenfest et al. use an absolute approach that intends to
―recognize the growing role of Latinos and Asians in neighborhood integration‖ (p. 98) and yet
oddly combine all non-black minorities into a single ―omnibus ―other‖ category.‖ Conceptually,
this approach does allow the data to reveal patterns of integration more complex than a simple
white/black typology. Still, very real differences are missed between neighborhoods where
Latinos are the dominant group and neighborhoods where Asians are the dominant group.
Two other closely related studies are worth noting; both pivot again on black-white divides and
mixing. Ellen (2000) reports that ~57 percent of ―integrated neighborhoods‖ (i.e., those
between 0-50 percent black) in 1970 remained that way in 1990. Rawlings et al. (2004) also
were interested in black-nonblack mixing and neighborhood stability in several dozen of the
The Racially Fragmented City? 10
largest MSAs where blacks formed the largest minority group (and where Latinos comprise 20
percent or less of the metropolitan population, thus excluding New York, Los Angeles and
Miami from the analysis). They found that about 80 percent of mixed-majority white
neighborhoods (where blacks constitute 10–50 percent of the neighborhood‘s population) in
1990 retained that mix in 2000. The most stable neighborhoods within this group were those in
which the share of the black population was about 10 percent. Freidman (2008), commenting on
this project, observed that ‗‗majority white‘‘ places were broadly defined and that the study goes
some way to explaining why the level of stability in this study is so much higher than Fasenfest
et al. (2006) found. In response, however, Friedman (2008) looked at the 61 MSAs with
populations exceeding 1 million in 2000. In 2000, this set accounted for 72 percent of all
metropolitan blacks, 73 percent of all metropolitan Latinos, and 80 percent of all metropolitan
Asians. Friedman‘s neighborhood taxonomy built expressly on Ellen (2000) and Fasenfest et al.
(2006) and identified seven types of neighborhood that differ from Fasenfest et al.‘s in only
minor ways. Friedman‘s typology reproduces the problem identified in Fasenfest‘s scheme –
non-black minority groups are grouped together into a single expanded ―other‖ category,
which does not allow for the kind of group-specific views we seek.
In contrast to the existing strategies to comprehend the variability and complexity of racial
composition within urban areas, we aim to capture a constructive tension between detail
(complexity) and simplicity (comprehensibility). Like the approaches we just reviewed, our
framework uses an absolute, rather than relative, definition, which allows meaningful
comparisons across multiple cities (cf. Jones 2008 and Maly 2000). Our framework allows for
analysis of change; specifically neighborhood racial dynamics. We also link our essay to a
The Racially Fragmented City? 11
website that facilitates interaction between users/readers and the mapping of racialized urban
space.
The Technique: Data, Methods, and Application
We start from the position that the classification scheme should be based on a-priori logic. Note
that the now broad array of existing segregation measures, including those developed by
geographers, all attempt to capture the degree to which groups residentially live apart from one
another. We choose instead to start our approach by evaluating compositional diversity, or the
degree to which groups live together. An effective and widely used measure appropriate for
census tracts is scaled entropy.2 The classification system offered below emerged from detailed
explorations of the impact on scaled entropy of many configurations of racial composition
spread across the 6 major racial categories on the Census (white, black, Latino, Asian, Native
American, and other) and with an eye towards classes that make substantive sense and show
well on choropleth maps.
We begin by distinguishing 3 levels of diversity that we will subsequently subdivide by the
dominant racial group (Figure 1). We define ―Low Diversity‖ tracts as having scaled entropy
values less than or equal to 0.3707. This value hinges on two criteria. First, this is the
maximum scaled entropy that can be reached in a tract where one of the six racial groups
constitutes 85 percent of the population – i.e., each of the other 5 groups constitutes exactly 3
percent of the population.3 Second, tract scaled entropy can be less than 0.3707 even when no
group constitutes 80 percent of the population – for example, scaled entropy=0.36 if Group A
constitutes 65 percent, Group B 35 percent, and all other groups 0 percent of the neighborhood

The Racially Fragmented City? 12
population. Recall that the majority of existing approaches start by setting a threshold for
majority group dominance (typically 80 percent) that differs from the threshold for minority
group dominance (often 50 percent). The strength of our entropy-based approach is that it
forces scholars to think beyond single group dominance, or even pairs of groups, to consider
the multiplicity of groups. So, for the 65 percent/35 percent tract, even though Group A does
not dominate at the 80 percent level, the tract as a whole is not diverse, and thus, we assert,
―fits‖ in this low diversity category. With a third group present in non-trivial shares, for
example in a 65 percent/30 percent/5 percent configuration, scaled entropy rises to 0.44 and
the tract would appropriately not constitute a ―Low Diversity‖ area in our classification scheme.
We defined ―High Diversity‖ tracts as those with (a) scaled entropy greater than/equal to
0.7414, and (b) no group constituting more than 45 percent of the tract‘s population.4 The
0.7414 threshold requires that, in addition to satisfying the 45 percent rule, a tract‘s top two
groups have a combined percentage of no more than 80 percent of the tract population.5 We
define as ―Moderately Diverse‖ those tracts not captured by the other two categories.
A distinguishing feature of our approach is the additional step of identifying the dominant
racial group in both the low-diversity and moderate-diversity tracts.6 Neighborhood
concentrations of Native Americans and non-Latino individuals identifying as ―Other‖ are rare
in US MSAs. In our sample, only one tract (in Phoenix) was moderately diverse and Native
American Indian-dominated. So although Native Americans and ―others‖ play into calculations
of neighborhood diversity, we restrict the subdivision of low and moderately diverse tracts into
those where whites, blacks, Asians, and Latinos are the dominant groups.
The Racially Fragmented City? 13
To demonstrate the usefulness of our approach, we use SF3 data from the 1990 and 2000 US
censuses to visualize and assess the intersections of neighborhood racial segregation and
integration at census-tract scale. We examine these patterns in sixteen large MSAs: Atlanta,
Boston, Chicago, Dallas, Detroit, Houston, Los Angeles, Miami, Minneapolis, New York,
Philadelphia, Phoenix, San Diego, San Francisco, Seattle, Washington DC. These MSAs
represent a variety of regions and range widely in their racial compositions and patterns of
mixing. We restrict our analysis to the urbanized areas within each broad metropolitan region
to sharpen our focus on the clearly urban portions of these areas. This restriction leaves out
rural and low-density exurban portions of metropolitan regions, which often distort the
effectiveness of cartographic visualizations, even though they represent spaces that may be
factor into the future of segregation and diversity. To facilitate our analysis, we boundary
matched the 1990 census tracts to 2000 boundaries, which yielded a sample of over 18,600
census tracts. As the US census frequently changes how it measures race from decade to
decade, we matched the 6 racial groupings defined in the 1990 Census (white, black, Latino,
Asian, Native American, and other) by collapsing Hawaiian/Pacific Islander into the Asian
category, and merging American Indian and Alaska Native into a single Native American
category. Census 2000 was the first census to allow respondents to claim more than one race.
Following the lead of other researchers who have compared 1990 with 2000, we were forced to
collapse mixed-race individuals into the set of single-race categories using a method of
proportional assignment to nonwhite categories.
In 1990, the most common type of tract in our sample of sixteen MSAs (48 percent) was ―low-
diversity white-dominant‖. By 2000, less than one third (32 percent) of tracts were low-
diversity white-dominant and this type just barely remained the modal category. Figure 1

The Racially Fragmented City? 14
shows the distribution of tracts across all the categories for (a) all the metropolitan places
(Total), and (b) broken down by individual MSA. They are organized from left to right by the
MSA with the highest proportion of low-diversity white-dominant tracts in 1990 (Minneapolis)
to the lowest (Los Angeles).
Figure 1 about here
While Figure 1 contains many stories, we will highlight what we see as the principal
narratives. Every MSA saw the proportion of low-diversity white-dominant tracts shrink;
Seattle experienced the largest decline: in 1990, over 80 percent of neighborhoods could be
described as low-diversity white-dominant falling to less than 50 percent by 2000. The decline
in the proportion of low-diversity white-dominant tracts between 1990 and 2000 went hand in
hand with growth in the proportion of all other sorts of tracts, including those which are
moderate-diversity white-dominant and those classified outside either of the two white
dominated categories.
Many MSAs between 1990 and 2000 became more multiethnic, driven largely by increases in
the number and proportion of Latinos and Asians (e.g., Iceland 2004). From the perspective of
our research, these changes manifest themselves in various ways. More neighborhoods are
Latino and Asian dominated in 2000. And the share of tracts that we class as ―highly diverse‖
grew from 0.82 percent in 1990 to 3.32 percent in 2000, with San Francisco, San Diego,
Washington DC, New York, and Minneapolis boasting the highest proportions of highly
diverse neighborhoods.
The Racially Fragmented City? 15
We can look at this in another way; every MSA studied here experienced a reduction between
1990 and 2000 in the total number of low-diversity tracts, with many (about 17 percent)
becoming moderately diverse without changing their category of racial dominance. Seattle
experienced the largest decadal decline; its proportion dropped from 81 percent to 48 percent.
San Francisco has the fewest low-diversity tracts total (14 percent in 2000). Detroit, Boston,
Minneapolis, and Chicago have the largest proportion. Figure 1 shows that while these shifts
towards diversity were taking place, another story, a narrative of segregation, played out at the
same time. The proportion of low-diversity black-dominant tracts remained stubbornly set at
around 8.6 percent for the decade. Atlanta, Chicago, Detroit, and Philadelphia all experienced
an increase in the proportion of low-diversity black-dominant neighborhoods between 1990 and
2000.
Figure 1 tells several fascinating stories but it does not reveal which neighborhoods
experienced a racial transition. A 1990-2000 transition matrix (Table 1) can begin to unpack
that line of thinking.
Table 1 about here
Transition matrices like this one (i.e., that contain the tallies by type of neighborhood of all
sixteen MSAs) allow us to see the types of neighborhood change taking place between 1990-
2000. About 31 percent, (5811/18624), transitioned to a different category in the course of the
decade. Of the 5811, 3506 changed their diversity classification and 1575 remained in the same
diversity category but shifted in racial dominance. Only 136 changed both diversity and racial
The Racially Fragmented City? 16
classification. In addition, 530 became highly racially diverse and 64 shifted from being highly
diverse to another, less diverse, state.
Looking at the first row of Table 1, we see that of the 8940 low-diversity white-dominant
tracts in 1990, 5935 remained in that state in 2000. Put differently, fully 33 percent of low-
diversity white-dominant tracts in 1990 were in a different class in 2000. These transitions
reveal how increasing diversity emerged, but swathed within the context of white
neighborhood isolation. The majority became moderately diverse white-dominant tracts
(incremental diversification?), but some shifted radically: three to low-diversity black-dominant
(traditional white flight?), two to low-diversity Latino-dominant (emerging forms of white
flight?), and 7 became ―highly diverse‖ (rapid diversification?). Other rows show the persistence
of non-white residential isolation: low-diversity black- and Latino-dominated tracts were more
likely than others to stay unchanged between 1990 and 2000 (89 percent in each case). At other
end of the scale, this table demonstrates the often transitory nature of residential racial mixing:
the class of tracts least likely to retain its 1990 status is the highly diverse set (only 89/153, or
58.2 percent, stayed in that category over the course of the decade).
Examining the columns produces other insights. For example, very few tracts became low-
diversity white-dominated during the decade; 39 moderately diverse white tracts and 3
moderately diverse black tracts moved to the low-diversity white-dominated category. This
means that 99.3 percent of low-diversity white tracts in 2000 were in the same classification in
1990. In contrast, about 90 percent (1449/1604) of low-diversity black tracts and 63 percent
(402/636) of low-diversity Latino tracts retained their 1990 status in 2000. The largest churn
takes place in the highly diverse neighborhoods with only 14% (89/619) of the highly diverse
The Racially Fragmented City? 17
tracts in 2000 being in this class in 1990. This evidence is consistent with the idea that highly
mixed neighborhoods may not be stably integrated and may only exist as diverse for a short
period of time as they transition from dominance by one group – typically whites – to
dominance by another.
Transition matrices offer one perspective on all this—maps offer another. Space limitations in a
journal format preclude us from showing maps of all 16 MSAs for 1990-2000. Accordingly, we
offer our impressions of the patterns we find in three MSAs: Atlanta, Los Angeles, and
Washington DC. Although we only include maps and accompanying transition matrices for
each of these MSAs in this essay we encourage readers to explore neighborhood patterns for all
16 metropolitan regions cartographically at www.mixedmetro.us. This web-based form allows
users to interact MSA maps based on our classification scheme with detailed background
features (layers) such as roads, place names, and the physical landscape. The web maps also
allow users to zoom in on particular areas, perhaps with which they are familiar.
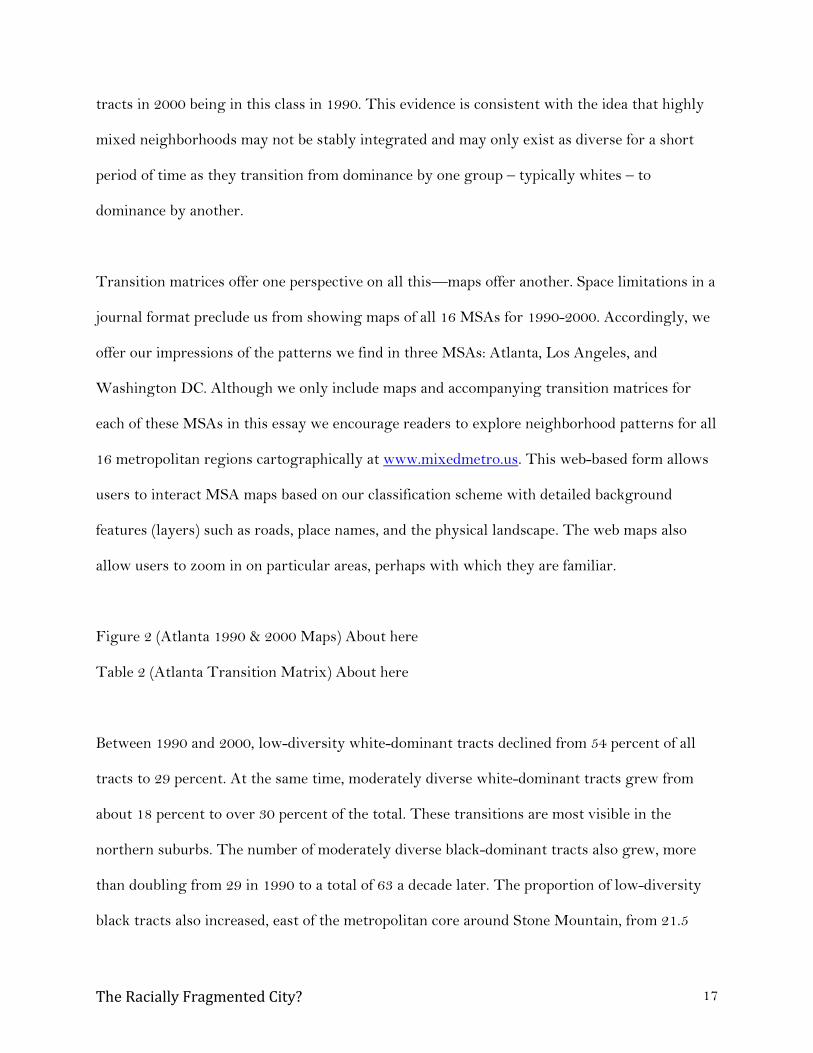
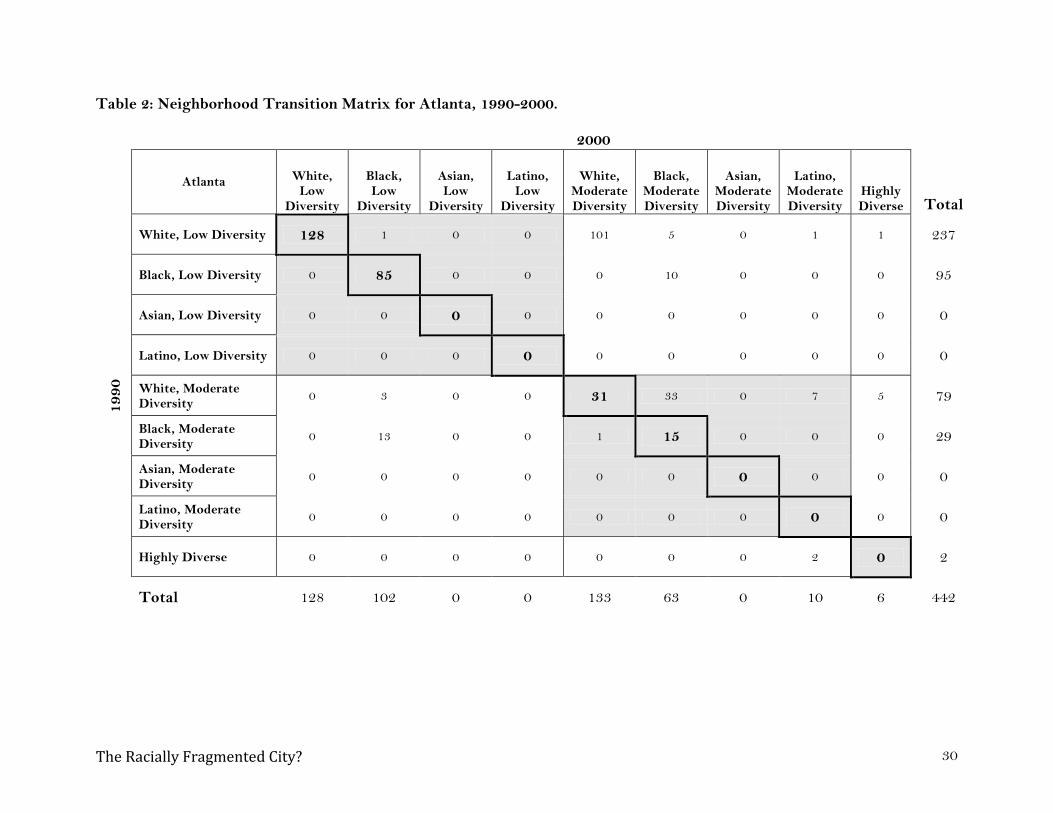
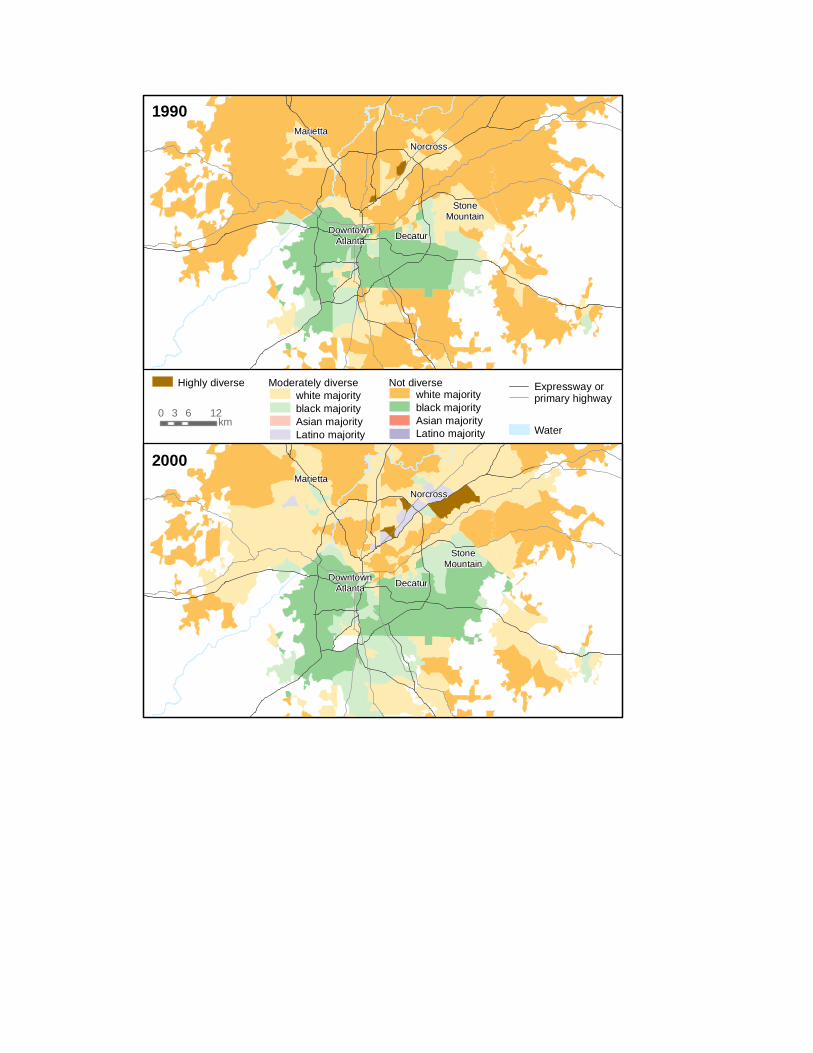
Figure 2 (Atlanta 1990 & 2000 Maps) About here
Table 2 (Atlanta Transition Matrix) About here
Between 1990 and 2000, low-diversity white-dominant tracts declined from 54 percent of all
tracts to 29 percent. At the same time, moderately diverse white-dominant tracts grew from
about 18 percent to over 30 percent of the total. These transitions are most visible in the
northern suburbs. The number of moderately diverse black-dominant tracts also grew, more
than doubling from 29 in 1990 to a total of 63 a decade later. The proportion of low-diversity
black tracts also increased, east of the metropolitan core around Stone Mountain, from 21.5
The Racially Fragmented City? 18
percent of the total to 23 percent. Proximate to the two highly diverse tracts in 1990 and the 6
in 2000, ten moderately diverse Latino tracts emerged in the 1990s in and around Norcross
(locals refer to this as the Buford Highway corridor, which parallels I-85) to the north.
Atlanta‘s Latino population began to leave a mark on the landscape in the 1990s in one area of
the metropolitan region. In Los Angeles, their presence was far more ubiquitous.
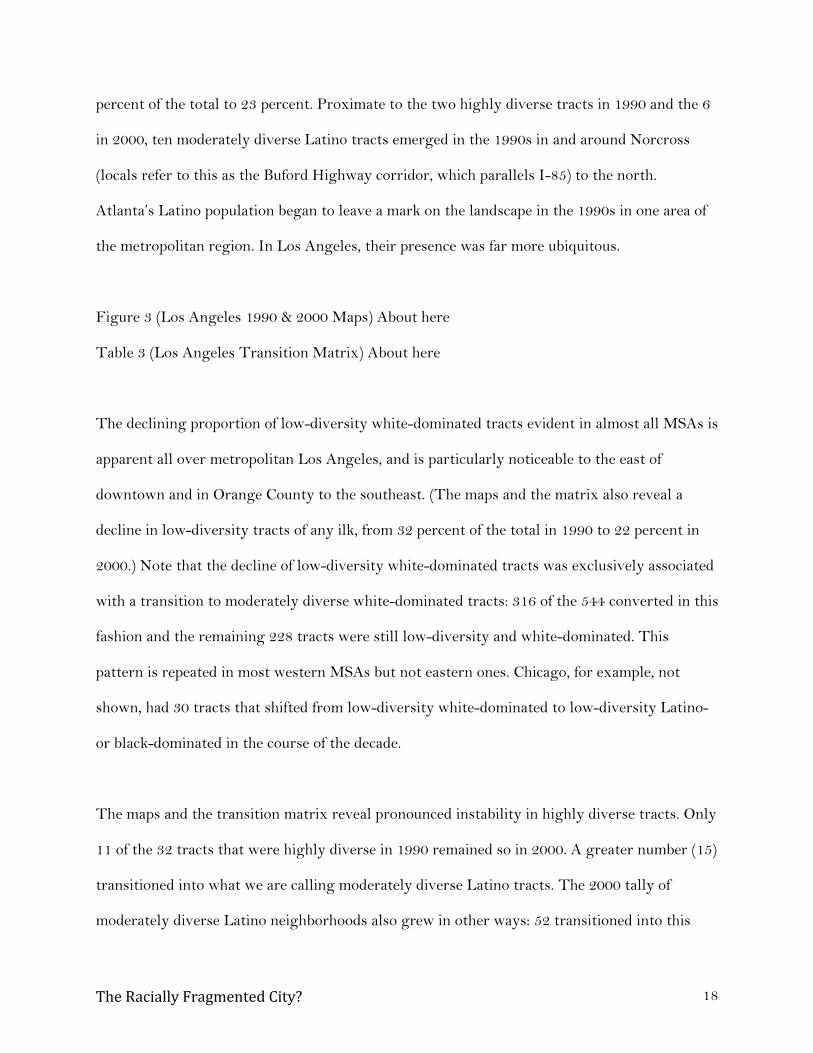
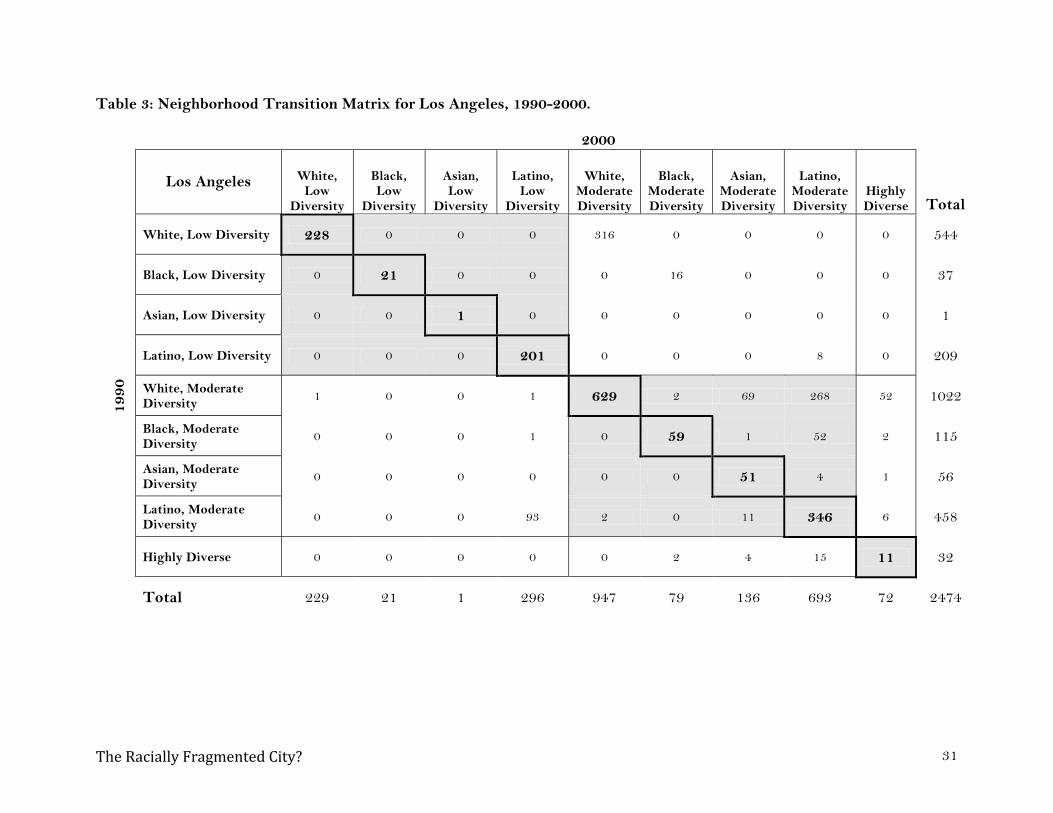
Figure 3 (Los Angeles 1990 & 2000 Maps) About here
Table 3 (Los Angeles Transition Matrix) About here
The declining proportion of low-diversity white-dominated tracts evident in almost all MSAs is
apparent all over metropolitan Los Angeles, and is particularly noticeable to the east of
downtown and in Orange County to the southeast. (The maps and the matrix also reveal a
decline in low-diversity tracts of any ilk, from 32 percent of the total in 1990 to 22 percent in
2000.) Note that the decline of low-diversity white-dominated tracts was exclusively associated
with a transition to moderately diverse white-dominated tracts: 316 of the 544 converted in this
fashion and the remaining 228 tracts were still low-diversity and white-dominated. This
pattern is repeated in most western MSAs but not eastern ones. Chicago, for example, not
shown, had 30 tracts that shifted from low-diversity white-dominated to low-diversity Latino-
or black-dominated in the course of the decade.
The maps and the transition matrix reveal pronounced instability in highly diverse tracts. Only
11 of the 32 tracts that were highly diverse in 1990 remained so in 2000. A greater number (15)
transitioned into what we are calling moderately diverse Latino tracts. The 2000 tally of
moderately diverse Latino neighborhoods also grew in other ways: 52 transitioned into this
The Racially Fragmented City? 19
status from moderately diverse white neighborhoods, 2 from moderately diverse black, 6 from
moderately diverse Latino, and 1 from moderately diverse Asian.
Los Angeles, of course, is increasingly Latino (Davis 2000). Not surprisingly, the number of
Latino-dominated tracts between 1990 and 2000 increased from 667 to about 1000. About half
the moderately diverse Black tracts in 1990 transitioned to moderately diverse Latino tracts in
2000. The bulk of the gains in Latino dominated tracts, however, derived from neighborhoods
transitioning from moderately diverse white to moderately diverse Latino.
The number of Asian-dominated tracts (all but one are moderately diverse) increased from 57
in 1990 to 137 in 2000. 51 of those 57 tracts remained moderately diverse Asian places; most of
the gains in this category derived from the transition of 69 moderately diverse white tracts and
11 moderately diverse Latino tracts to Asian dominance. Geographically, Asian areas diffused
from Monterey Park in the central the San Gabriel Valley (Li 2009). The other areas that grew
are the upland parts of the eastern San Gabriel Valley -- the Walnut/Diamond Bar region.
Note that the one low-diverse, Asian-dominated tract in both 1990 and 2000 is the downtown
Chinatown.
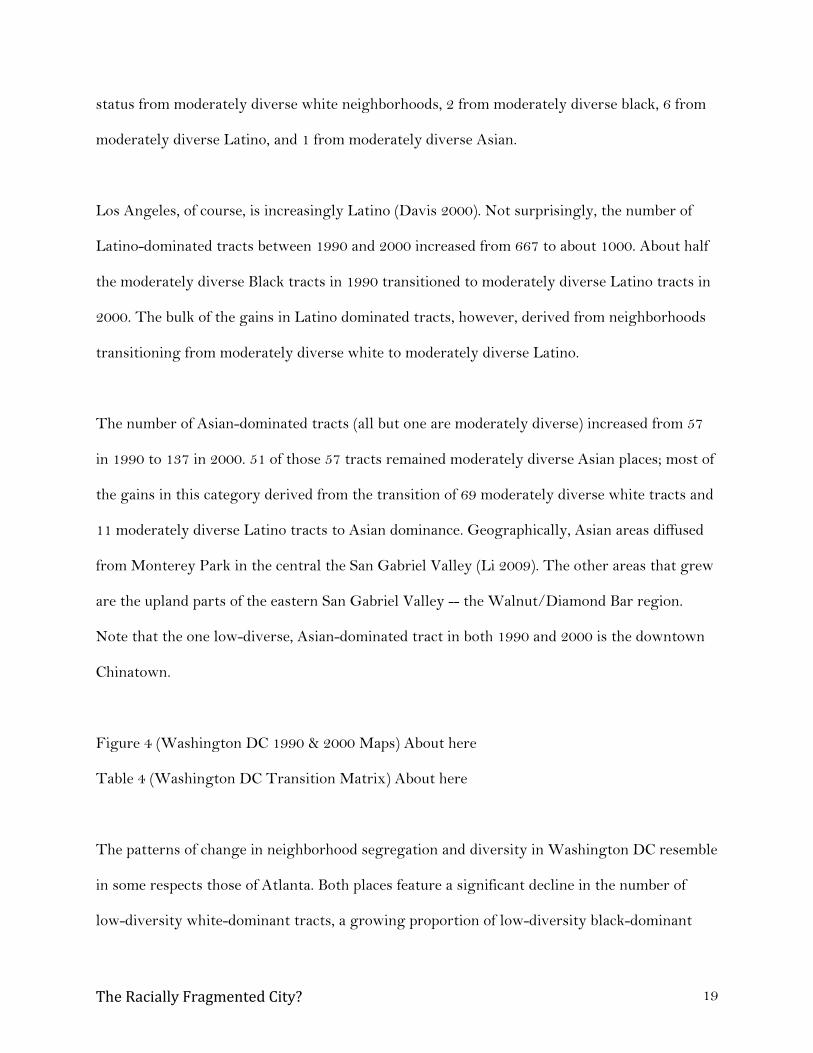
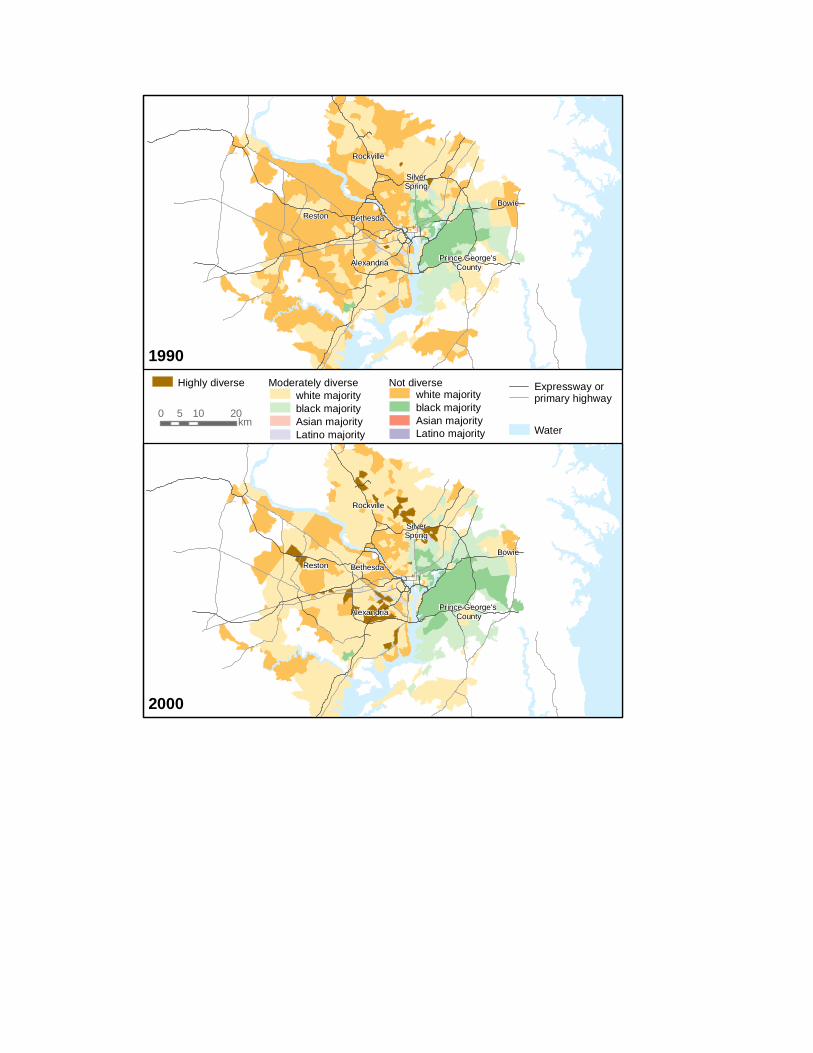
Figure 4 (Washington DC 1990 & 2000 Maps) About here
Table 4 (Washington DC Transition Matrix) About here
The patterns of change in neighborhood segregation and diversity in Washington DC resemble
in some respects those of Atlanta. Both places feature a significant decline in the number of
low-diversity white-dominant tracts, a growing proportion of low-diversity black-dominant

The Racially Fragmented City? 20
tracts and the emergence of more highly diverse tracts geographically proximate to an
incipient set of moderately diverse Latino-dominant neighborhoods. Both regions have also
experienced a growth in the white proportion of the central-city population, which is still an
unusual trend in national terms (Dewan 2006). Washington DC, however, differs from Atlanta
in some important respects. The growth (from 5 to 46) of the number of highly diverse tracts is
the fastest growth rate for this category in any of the MSAs examined. Also, there are several
clusters of such tracts: a pair of tracts in DC itself, a cluster near Reston, one centered on
Alexandria, another to the southeast of that, and a string to the north running from Silver
Spring to Rockville. Many of the very diverse areas likely formed as a result of relatively recent
immigrant flows. These neighborhoods offered employment and relatively inexpensive housing
to newcomers (Price and Singer 2008).
Discussion and Conclusions
The analysis reported here offers a new distinctly geographical way of apprehending and
visualizing neighborhood racial mixing and segregation. The US is becoming more diverse and
this is apparent at scales from the nation, to the region, the metropolitan area, to the
neighborhood, to the household, to the body. Metropolitan residential neighborhoods are, in
some important ways, becoming more racially diverse while significant sections of many urban
landscapes remain stubbornly segregated. Moreover, our analysis confirms our expectation that
segregation and diversity are not simply the mirror images of one another. Diversity became
enfolded within segregation (and vice-versa) in complex ways. Even so, one narrative persists;
the geographies of increased diversity have not eliminated the persistence of segregation of
Latinos and Blacks from other groups.
The Racially Fragmented City? 21
We are, of course, by no means the first scholars to acknowledge that the relationship between
diversity and segregation is complex and that approaches to urban segregation must account
for the increasingly multiethnic nature of the urban experience (e.g., Fong and Shibuya 2005).
But the approach we outline in this essay offers a new means to understand some fundamental
questions about segregation and diversity. For example, Glaeser and Vigdor (2001) (among
others) celebrate the absence post 2000 of completely white tracts in most MSAs. Their
gradational perspective on segregation misses key trends in urban processes that our approach
picks out. For example, our method reveals that low-diversity white-dominated tracts, while
fewer in number, were still the most frequently observed tract type in 2000: that is, almost 32
percent of all tracts. We also show that the number of low-diversity black-dominated tracts fell
only slightly over the 1990-2000 period (although about 10 percent of these tracts underwent
some form of racial transition during the decade).
We don‘t anticipate that our framework will ―dethrone‖ traditional segregation statistics (cf.
Peach 2009), or the increasing attention being paid to diversity (via, e.g., entropy-based
measures) and innovative spatial measures of segregation; rather, we simply wish to press the
point that neighborhood racial transitions cannot be adequately captured by either a one-sided
focus on segregation or an exclusive focus on diversity. Instead, by examining the juncture
between segregation and diversity, our method shows how racial divisions are enfolded within
the context of an increasingly diverse urban world. Put differently, we offer an approach to
visualize how increasing diversity occurs side-by-side with patterns of persistent segregation.
The Racially Fragmented City? 22
Borrowing Steven Vertovec‘s phrase, ―diversity isn‘t what it used to be‖ (2007: 1024), this essay
not only describes a new approach in segregation/diversity studies, but also sets the stage for
an exciting new research agenda. For example, building directly on the analysis presented here,
future research should explore the low-diversity white-dominated tracts that shifted radically.
Further research would help unpack the processes at work in these places (e.g., is this ―white
flight‖?). What processes differentiate stably diverse places from newly diverse places? We
suspect the answer to this and other questions about transitions in neighborhood racial
configurations may lie in the connections they have to other measures of neighborhood
socioeconomic status. For example, how does the age or income structure of tracts relate to the
configurations of diversity and racial dominance observed in neighborhoods? How do these and
other measures of socioeconomic structure condition the types of transformations observed in
our neighborhood racial classification scheme?
The Racially Fragmented City? 23
Notes:
1 We follow the convention of scholars using Census data in defining as Latino all
respondents reported as having Hispanic origin, regardless of their reported race. We
understand well the conceptual inadequacy of this single category to capture the rich
and varied histories and contemporary realities of racial identity for persons with
Latin American heritage.
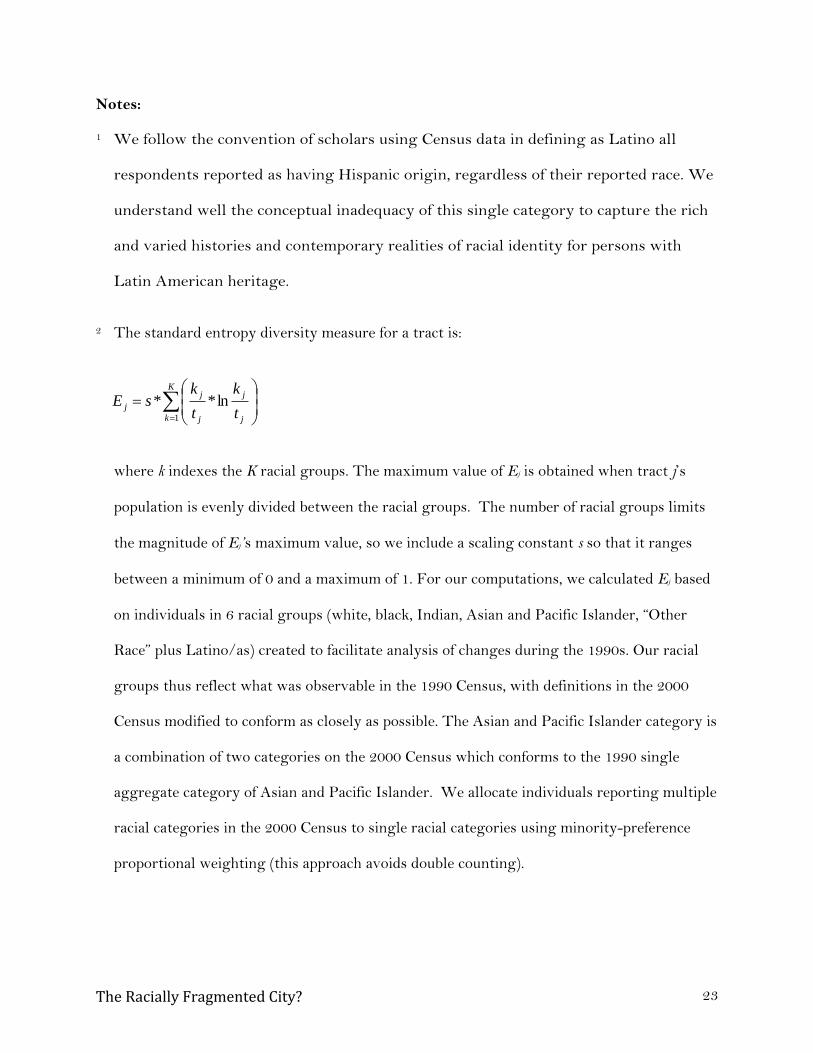
2 The standard entropy diversity measure for a tract is:
where k indexes the K racial groups. The maximum value of Ej is obtained when tract j‘s
population is evenly divided between the racial groups. The number of racial groups limits
the magnitude of Ej’s maximum value, so we include a scaling constant s so that it ranges
between a minimum of 0 and a maximum of 1. For our computations, we calculated Ej based
on individuals in 6 racial groups (white, black, Indian, Asian and Pacific Islander, ―Other
Race‖ plus Latino/as) created to facilitate analysis of changes during the 1990s. Our racial
groups thus reflect what was observable in the 1990 Census, with definitions in the 2000
Census modified to conform as closely as possible. The Asian and Pacific Islander category is
a combination of two categories on the 2000 Census which conforms to the 1990 single
aggregate category of Asian and Pacific Islander. We allocate individuals reporting multiple
racial categories in the 2000 Census to single racial categories using minority-preference
proportional weighting (this approach avoids double counting).
K
k j
j
j
j
jt
k
t
ksE
1
ln**
The Racially Fragmented City? 24
3 If any of the 5 minority groups constitutes less than 3% of tract population, scaled entropy
drops rapidly.
4 We initially evaluated a 50% rule (i.e., no group constitutes an absolute majority) based on
precedent in the literature, but that approach captured too many tracts, and tracts with odd
characteristics. The minimum scaled entropy for a tract satisfying the 45% rule would be a
relatively low .53 – but setting a threshold at .53 would allow tracts into the ―High
Diversity‖ category that we did not consider to be highly diverse.
5 The fact that the threshold for defining ―High Diversity‖ tracts is twice the threshold for
defining ―Low Diversity‖ tracts is purely coincidental.
6 It would be easy to also identify the dominant racial group in tracts defined as ―High
Diversity‖. We chose not to do so in this paper because (a) we want to highlight that in high
diversity tracts, no single group is in the clearly visible majority and (b) there were
numerically few tracts that satisfied our criteria, and depicting variants of these tracts based
on the dominant group introduced too much complexity into our analysis, especially the
cartographic representations.
The Racially Fragmented City? 25
References:
Brown, L.A. and S. Chung. 2006. Spatial segregation, segregation indices and the geographical
perspective. Population, Space and Place 12:125-43.
Cortese, C.F., R.F. Falk, and J. K. Cohen. 1976. Further considerations on the methodological
analysis of segregation indices. American Sociological Review 41:630-37.
Davis, M. 2000. Magical Urbanism: Latinos Reinvent the US City. London and New York: Verso.
Delaney, D. 2002: The space that race makes. The Professional Geographer 54:6-14.
Denton, N. and D. S. Massey 1991. Patterns of neighborhood transition in a multiethnic world:
US metropolitan areas 1970-80. Demography 28:41-63.
Dewan, S. 2006. Gentrification changing face of New Atlanta. New York Times.
http://www.nytimes.com/2006/03/11/national/11atlanta.html?sq=gentrification%20fa
ce%20atlanta&st=cse&scp=1&pagewanted=print Last accessed 9/20/09.
DuBois, W.E.B. 1903 (1996) The Souls of Black Folk. Penguin: New York.
Ellen, I. G. 2000. Sharing America’s neighborhoods: the prospects for stable racial integration.
Harvard University Press: Cambridge, MA.
Ellis, M., S. Holloway, R. Wright, and M. East. 2007. The effects of mixed-race households on
residential segregation. Urban Geography. 28:554-77.
Falk R. F., C. F. Cortese, and J. Cohen. 1976. Utilizing standardized indices of residential
segregation: comment on Winship. Social Forces. 57:713-6.
Fasenfest, D., J. Booza, K. Metzger. 2006. Living together: a new look at racial and ethnic
integration in metropolitan neighborhoods, 1990–2000. In Redefining Urban & Suburban
America: Evidence from Census 2000 Volume III, eds. A. Berube, B. Katz & R.E. Lang, 93-
117. Washington, DC: Brookings Institution Press,.
Fong, E. and K Shibuya. 2005. Multiethnic Cities in North America. Annual Review of Sociology
31: 285-304.
Friedman, S. 2008. Do declines in residential segregation mean stable neighborhood racial
integration in metropolitan America? A research note. Social Science Research 37: 920-33.
Glaeser E. L. and J. L. Vigdor 2001. Racial Segregation in the 2000 Census: Promising News.

The Racially Fragmented City? 26
Washington DC: Brookings Institution.
Iceland J. 2004. Beyond black and white: metropolitan residential segregation in multi-ethnic
America. Social Science Research 33:248-71.
Jakubs, J., 1977. Residential segregation - Taeuber index reconsidered. Journal of Regional
Science 17:281-3.
Jakubs, J., 1981. A distance-based segregation index. Socio-economic Planning Sciences 15:129-36.
Johnston, R. J., M. Poulsen, and J. Forrest. 2003. And did the walls come tumbling down?
Ethnic residential segregation in four U.S. metropolitan areas 1980-200. Urban Geography
24:560-81.
Johnston, R. J., M. Poulsen, and J. Forrest. 2004. The comparative study of ethnic residential
segregation in the USA, 1980-2000. Tijdschrift voor Economische en Sociale Geografie
95:550-69.
Johnston, R. J., M. Poulsen, and J. Forrest. 2005. On the measurement and meaning of
residential segregation: A response to Simpson. Urban Studies 42:1221-7.
Johnston, R. J., M. Poulsen, and J. Forrest. 2006a. Blacks and Hispanics in urban America:
similar patterns of residential segregation? Population Space and Place 12:389-406.
Johnston, R. J., M. Poulsen, and J. Forrest. 2006b. Modern and post-modern cities and ethnic
residential segregation: Is Los Angeles different? Geoforum 37:318-30.
Johnston, R. J., M. Poulsen, and J. Forrest. 2007. The geography of ethnic residential
segregation: A comparative study of five countries. Annals of the Association of American
Geographers 97:713-38.
Johnston, R. J., M. Poulsen, and J. Forrest. 2009. Research Note—Measuring ethnic residential
segregation: putting some more geography in. Urban Geography 30:91-109.
Jones, R., 2008. The ambiguous roles of suburbanization and immigration in ethnic
segregation: The case of San Antonio. Urban Geography, 29:196-223.
Lee, B.A. 1985. Racially Mixed Neighborhoods During the 1970s: Change or Stability? Social
Science Quarterly 66:346-64.
Lee, B. A. and P. B. Wood. 1990. The fate of residential integration in American cities: evidence
for racially mixed neighborhoods 1970-1980. Journal of Urban Affairs 12:425-36.
The Racially Fragmented City? 27
Li, W. 2009. Ethnoburb: The New Ethnic Community in Urban America. Honolulu: University of
Hawaii Press.
Maly, M., 2000. The Neighborhood Diversity Index: A complementary measure of racial
residential settlement. Journal of Urban Affairs 22:37-47.
Massey, D.S. 1978. Measurement of segregation as a random variable - comment. American
Sociological Review 43:587-90.
Massey, D.S. and N. Denton. 1988. The dimensions of residential segregation. Social Forces,
67:281-315.
Poulsen, M., Johnston, R.J. and J. Forrest. 2002a. Plural cities and ethnic enclaves: introducing
a measurement procedure for comparative study. International Journal of Urban and
Regional Research 26:229–43.
Poulsen, M.,Forrest, J. and R. J. Johnston 2002b. From Modern to Post-modern?:
contemporary ethnic residential segregation in four US metropolitan areas. Cities 19:161-
72.
Park, R. E. & E. W. Burgess. 1984 [1925]. The City: Suggestions for Investigations of Human
Behavior in the Urban Environment. Chicago: University of Chicago Press.
Peach, C. 2009. Slippery Segregation: Discovering or Manufacturing Ghettos? Journal of Ethnic
and Migration Studies 35:1381-95.
Price, M. and A. Singer. 2008. Edge Gateways: Immigrants, Suburbs, and the Politics of
Reception in Metropolitan Washington. In Twenty-First-Century Gateways Immigrant
Incorporation in Suburban America, eds. A. Singer, S.W. Hardwick, & C.B. Brettell, 137-68.
Washington DC: Brookings Institution Press.
Rawlings, L., L. Harris, and M. A. Turner (with S. Padilla). 2004. Race and Residence: Prospects
for Stable Neighborhood Integration. Washington, DC: The Urban Institute.
Reardon, S. F. and D. O‘Sullivan. 2004. Measures of spatial segregation. Sociological
Methodology 34:121-62.
Reibel, M. and M. Regelson. 2007. Quantifying neighborhood racial and ethnic transition
clusters in multiethnic cities. Urban Geography 28:361-76.
Sakoda, J. 1981. A generalized index of dissimilarity. Demography 18:245-50.
Sibley D. 1995. Geographies of Exclusion. New York: Routledge.
The Racially Fragmented City? 28
Simpson, L., 2004, Statistics of racial segregation: Measures, evidence and policy. Urban Studies
41:661-81.
Vertovec, S. 2007. Super-diversity and its implications. Ethnic and Racial Studies 30:1024-54.
White, M. 1986. Segregation and diversity measures in population-distribution. Population
Index 52:198-221.
Winship, C. 1977. A re-evaluation of indexes of residential segregation. Social Forces 55:1058-
66.
Winship, C. 1978. Desirability of using index of dissimilarity or any adjustment of it for
measuring segregation - reply. Social Forces, 57:717-20.
Wong, D. W. S. 1998. Measuring multiethnic spatial segregation. Urban Geography 19:77-87.
Wong, D. W. S. 2002, Modeling local segregation: A spatial interaction approach. Geographical
& Environmental Modeling 6:81-97.
Wong, D. W. S. 2008. A local multidimensional approach to evaluate changes in segregation.
Urban Geography 29:455-72.
Wu, X. B. and D. Z. Sui. 2001. An initial exploration of a lacuniarity-based segregation
measure. Environment and Planning B 28:433-446.

The Racially Fragmented City? 29
Table 1: Neighborhood Transition Matrix for All MSAs, 1990-2000.
2000
All MSAs White, Low
Diversity
Black, Low
Diversity
Asian, Low
Diversity
Latino, Low
Diversity
White, Moderate Diversity
Black, Moderate Diversity
Asian, Moderate Diversity
Latino, Moderate Diversity
Highly Diverse Total
1990
White, Low Diversity 5936 2 0 2 2897 60 1 35 7 8940
Black, Low Diversity 0 1449 0 0 2 164 0 1 0 1616
Asian, Low Diversity 0 0 7 0 0 0 3 0 0 10
Latino, Low Diversity 0 0 0 402 1 0 0 48 0 451
White, Moderate Diversity
39 17 0 15 2923 307 188 788 440 4717
Black, Moderate Diversity
3 136 0 1 39 757 6 152 50 1144
Asian, Moderate Diversity
0 0 3 0 2 0 160 9 9 183
Latino, Moderate Diversity
0 0 0 216 44 19 17 1090 24 1410
Highly Diverse 0 0 0 0 4 8 16 36 89 153
Total 5978 1604 10 636 5912 1315 391 2159 619 18624
The Racially Fragmented City? 30
Table 2: Neighborhood Transition Matrix for Atlanta, 1990-2000.
2000
Atlanta White, Low
Diversity
Black, Low
Diversity
Asian, Low
Diversity
Latino, Low
Diversity
White, Moderate Diversity
Black, Moderate Diversity
Asian, Moderate Diversity
Latino, Moderate Diversity
Highly Diverse Total
1990
White, Low Diversity 128 1 0 0 101 5 0 1 1 237
Black, Low Diversity 0 85 0 0 0 10 0 0 0 95
Asian, Low Diversity 0 0 0 0 0 0 0 0 0 0
Latino, Low Diversity 0 0 0 0 0 0 0 0 0 0
White, Moderate Diversity
0 3 0 0 31 33 0 7 5 79
Black, Moderate Diversity
0 13 0 0 1 15 0 0 0 29
Asian, Moderate Diversity
0 0 0 0 0 0 0 0 0 0
Latino, Moderate Diversity
0 0 0 0 0 0 0 0 0 0
Highly Diverse 0 0 0 0 0 0 0 2 0 2
Total 128 102 0 0 133 63 0 10 6 442
The Racially Fragmented City? 31
Table 3: Neighborhood Transition Matrix for Los Angeles, 1990-2000.
2000
Los Angeles White, Low
Diversity
Black, Low
Diversity
Asian, Low
Diversity
Latino, Low
Diversity
White, Moderate Diversity
Black, Moderate Diversity
Asian, Moderate Diversity
Latino, Moderate Diversity
Highly Diverse Total
1990
White, Low Diversity 228 0 0 0 316 0 0 0 0 544
Black, Low Diversity 0 21 0 0 0 16 0 0 0 37
Asian, Low Diversity 0 0 1 0 0 0 0 0 0 1
Latino, Low Diversity 0 0 0 201 0 0 0 8 0 209
White, Moderate Diversity
1 0 0 1 629 2 69 268 52 1022
Black, Moderate Diversity
0 0 0 1 0 59 1 52 2 115
Asian, Moderate Diversity
0 0 0 0 0 0 51 4 1 56
Latino, Moderate Diversity
0 0 0 93 2 0 11 346 6 458
Highly Diverse 0 0 0 0 0 2 4 15 11 32
Total 229 21 1 296 947 79 136 693 72 2474

The Racially Fragmented City? 32
Table 4: Neighborhood Transition Matrix for Washington DC, 1990-2000.
2000
Washington DC White, Low
Diversity
Black, Low
Diversity
Asian, Low
Diversity
Latino, Low
Diversity
White, Moderate Diversity
Black, Moderate Diversity
Asian, Moderate Diversity
Latino, Moderate Diversity
Highly Diverse Total
1990
White, Low Diversity 139 0 0 0 163 1 0 0 0 303
Black, Low Diversity 0 138 0 0 0 17 0 0 0 155
Asian, Low Diversity 0 0 0 0 0 0 0 0 0 0
Latino, Low Diversity 0 0 0 0 0 0 0 0 0 0
White, Moderate Diversity 3 0 0 0 221 43 1 4 41 313
Black, Moderate Diversity 0 15 0 0 3 52 0 1 3 74
Asian, Moderate Diversity 0 0 0 0 1 0 0 0 0 1
Latino, Moderate Diversity
0 0 0 0 0 0 0 6 0 6
Highly Diverse 0 0 0 0 0 0 0 3 2 5
Total 143 153 0 0 390 113 1 14 46 857

The Racially Fragmented City? 33
Figure Captions:
Figure 1: Distribution of Neighborhood Types by MSA, 1990 and 2000
Figure 2: Atlanta Neighborhoods Classified by Diversity and Racial Dominance, 1990 and 2000
Figure 3: Los Angeles Neighborhoods Classified by Diversity and Racial Dominance, 1990 and
2000
Figure 4: Washington DC Neighborhoods Classified by Diversity and Racial Dominance, 1990
and 2000

0%
10%
20%
30%
40%
50%
60%
70%
80%
90%
100%
19
90
20
00
19
90
20
00
19
90
20
00
19
90
20
00
19
90
20
00
19
90
20
00
19
90
20
00
19
90
20
00
19
90
20
00
19
90
20
00
19
90
20
00
19
90
20
00
19
90
20
00
19
90
20
00
19
90
20
00
19
90
20
00
19
90
20
00
Total Minneapolis Seattle Boston Philly Detroit Phoenix Atlanta Chicago New York Dallas San Diego W DC San Fran Houston Miami Los Angeles
Highly Diverse
Moderate Diversity Asian
Low Diversity Asian
Moderate Diversity, Latino
Low Diversity Latino
Moderate Diversity Black
Low Diversity Black
Moderate Diversity, White
Low Diversity, White
0 6 123 km
1990
2000
white majorityblack majorityAsian majorityLatino majority
Not diverseModerately diversewhite majorityblack majorityAsian majorityLatino majority Water
Expressway orprimary highway
Highly diverse
Decatur
MariettaNorcross
DowntownAtlanta
StoneMountain
Decatur
MariettaNorcross
DowntownAtlanta
StoneMountain

0 9 184.5 km
1990
2000
white majorityblack majorityAsian majorityLatino majority
Not diverseModerately diversewhite majorityblack majorityAsian majorityLatino majority Water
Expressway orprimary highway
Highly diverse
Downtown LA
LongBeach
SantaMonica
Downtown LA
LongBeach
SantaMonica
Anaheim
Anaheim
San GabrielValley
San GabrielValley
0 10 205 km
1990
2000
white majorityblack majorityAsian majorityLatino majority
Not diverseModerately diversewhite majorityblack majorityAsian majorityLatino majority Water
Expressway orprimary highway
Highly diverse
Bowie
Alexandria
SilverSpring
BethesdaReston
Rockville
Prince George's County
Bowie
Alexandria
SilverSpring
BethesdaReston
Rockville
Prince George's County


