
UniversitätZürichIBW–InstitutfürBetriebswirtschaftslehre
Working Paper No. 142 The Relative Importance of Personal Characteristics for the Hiring of Young Workers
Peter Hoeschler and Uschi Backes-Gellner

December 2017; this version: January 2018 First Draft. Preliminary Results.
Die Discussion Papers dienen einer möglichst schnellen Verbreitung von neueren Forschungsarbeiten des Leading Houses und seiner Konferenzen und Workshops. Die Beiträge liegen in alleiniger Verantwortung der
Autoren und stellen nicht notwendigerweise die Meinung des Leading House dar.
Disussion Papers are intended to make results of the Leading House research or its conferences and workshops promptly available to other economists in order to encourage discussion and suggestions for revisions. The
authors are solely responsible for the contents which do not necessarily represent the opinion of the Leading House.
The Swiss Leading House on Economics of Education, Firm Behavior and Training Policies is a Research Program of the Swiss State Secretariat for Education, Research, and Innovation (SERI).
www.economics-of-education.ch
Working Paper No. 142 The Relative Importance of Personal Characteristics for the Hiring of Young Workers
Peter Hoeschler and Uschi Backes-Gellner
The Relative Importance of Personal Characteristics for the Hiring of
Young Workers⇤
Peter Hoeschler† and Uschi Backes-Gellner‡
January, 2018
First Draft. Preliminary Results.
Abstract
We investigate the relative importance of di↵erent personal characteristics for firms’ hiring decisions.Our design allows firms to observe potential workers during a long screening period. At the end ofthat period firms can decide to make job o↵ers, thereby revealing their preferences about workers’personal characteristics. We connect real-world job o↵ers and workers’ personal characteristics,both of which are usually unobserved. To investigate the relative importance of various personalcharacteristics for the likelihood to receive a job o↵er, we use a unique panel data set of entry-level workers. We find that grades and non-cognitive skills are important for receiving a job o↵er,with the Big Five Personality traits being the most important predictor. We find no e↵ects forintelligence or economic preferences.
Keywords: Job O↵ers, Ability, Non-Cognitive Skills, Preferences, Vocational Education.
JEL Classification: D03, M51, J24.
⇤ We would like to thank Simone Balestra, Eric Bettinger, Thomas Dohmen, Edward Lazear, Ofer Malamud, JensMohrenweiser, Samuel Muehlemann, Simon Janssen, Carmit Segal, Stefan Wolter, Thomas Zwick, and seminar par-ticipants at the University of Zurich for helpful comments. This study is partly funded by the Swiss Federal O�cefor Professional Education and Technology through its Leading House on the Economics of Education, Firm Behaviorand Training Policies. Peter Hoeschler benefited from a grant provided by the Swiss National Science Foundation for aresearch stay at the University of Chicago Harris School of Public Policy (project P1ZHP1-161627), and is grateful tohis colleagues at Harris for their great inspiration and support.
† Corresponding author: University of Zurich, Switzerland. Telephone: +4144 634 42 74; e-mail:[email protected]. Address: Plattenstrasse 14, CH-8032 Zurich, Switzerland.
‡ University of Zurich, Switzerland. Telephone: +4144 634 42 81; e-mail: [email protected]. Address:Plattenstrasse 14, CH-8032 Zurich, Switzerland.
1 Introduction
When making job o↵ers, employers reveal their preferences about workers’ personal characteristics
(skills, abilities, and traits). However, employers face uncertainty as to certain personal characteristics
that might be unobservable. Non-cognitive skills, which a growing literature shows to be important
in the labor market (e.g., Deming, 2016; Heckman & Kautz, 2012; Heckman, Stixrud, & Urzua,
2006), tend to be particularly di�cult for employers to observe. This uncertainty might be even more
pronounced for entry-level workers who have no employment history. To reduce this uncertainty,
firms might screen entry-level workers’ personal characteristics during programs such as internships,
traineeships, or apprenticeships. For example, firms engaging in apprenticeship training learn about
the ability of their trainees during the intense training period of several years (e.g., Acemoglu &
Pischke, 1998). Afterwards, firms can decide to make job o↵ers to these workers, thereby revealing their
preferences for certain personal characteristics. We study these revealed preferences by investigating
the influence of various personal characteristics on firms’ job o↵ers at the end of apprenticeship training.
A growing literature applies various research designs to investigate which personal characteristics
employers value. This literature, which also suggests that non-cognitive skills are very important, uses
five research designs. First, some studies use stated (discrete) choice experiments to elicit employer
preferences over personal characteristics. In these studies, employers receive a set of CVs (or results
from assessment centers) of potential applicants and are asked to select the candidates to whom
they would o↵er a job (e.g., Biesma, Pavlova, van Merode, & Groot, 2007; Humburg & van der
Velden, 2015). Second, correspondence studies attempt to identify the e↵ect of the characteristics by
exploiting real-world firm decisions. In these studies, researchers send out fake CVs with di↵ering
signals of personality to firms with job openings and observe the response rates (e.g., Protsch & Solga,
2015).
Third, researchers simply ask employers for their preferences across a fixed set of personal char-
acteristics (e.g., Biesma et al., 2007; Teijeiro, Rungo, & Freire, 2013). Such employer skill surveys
are also frequently conducted by government agencies in various countries (e.g., CEDEFOP, 2014).
Fourth, laboratory experiments study the e↵ect of perceived personality on the likelihood of receiv-
1

ing a job (Baert & Decuypere, 2014). Fifth, to derive the skill demands of employers, some studies
investigate job opening postings (e.g., Deming & Kahn, 2017). This approach is gaining popularity
because such postings have become more easily accessible through increasing online job searches.
However, all five approaches are limited, for at least two reasons, in their ability to study employers’
preferences. The first reason is related to firms’ stated and revealed preferences: No study uses real-
world high-stakes firm decisions that are relatively costly for the firms and that therefore should reveal
their true preferences. The second reason is related to firms’ limited ability to observe important
personal characteristics. To fully evaluate the relative importance of all personal characteristics,
studies may use designs in which firms also know about the less-observable personal characteristics of
individuals. Even though some studies have attempted to tackle this problem (e.g., Baert & Decuypere,
2014), none includes a substantial screening period during which employers can fully learn about the
workers’ characteristics. In contrast, our research design both includes an extended screening period,
thereby accounting for the limited observability of various personal characteristics, and uses job o↵ers
that result in real employment.
Using this research design, we investigate the link between personal characteristics and job of-
fers, both of which generally are hard to observe for researcher. We use a unique data set of Swiss
apprentices, data that provides us with high-quality and well-established measures of intelligence,
non-cognitive skills, and economic preferences—dimensions that many studies regard as unobservable
ability. Moreover, we observe explicit job o↵ers after an intense training and screening period. In
our analysis we combine this information and compare the relative importance of di↵erent personal
characteristics for the likelihood of receiving an o↵er. With our analysis we aim at answering the
following questions: Which personal characteristics are important for receiving a job o↵er at the end
of apprenticeship training? Are these personal characteristics the same that make retained apprentices
more likely to stay in the firm permanently? Do these o↵ers matter for later labor market outcomes?
We use jobs o↵ers at the end of apprenticeship training because they are likely to reveal firms’
true preferences.1 Towards the pre-specified end of the training, training firms can make job o↵ers
1The transitions at the end of apprenticeship has been intensively studied. These studies focus primarily on theanalysis of wage di↵erences between firm movers and firm stayers (e.g., Acemoglu & Pischke, 1998; Harho↵ & Kane,
2
and, if they do not, they face no firing costs because the training contracts simply run out. Moreover,
in our sample, o↵ers are selective: Only 70 percent of the apprentices receive a job o↵er at the end
of the training period. Of the subsample that received an o↵er, 94 percent accepted. In addition,
the distribution of the absolute values of the o↵ers has a high mean and is very limited in range.
Therefore, firms make job o↵ers only to apprentices whom they really want to keep. In sum, these job
o↵ers are selective, result in employment at high wages, and thus are clearly not cheap talk.
In our main analysis we assess the power of di↵erent personal characteristics in explaining the
likelihood of receiving a job o↵er. Our type of analysis is related to Humphries and Kosse (2017),
who investigate the importance of cognitive ability, personality, and economic preferences for high
school grade point average; to Burks et al. (2015), who investigate the importance of cognitive ability,
personality, and economic preferences for college outcomes; and to Becker, Deckers, Dohmen, Falk, and
Kosse (2012), who investigate the importance of economic preferences and personality for education,
labor market, and health outcomes. We add to these studies, which focus mainly on educational
outcomes, by investigating firms’ hiring decisions in detail.
We find that grades and non-cognitive skills are important for the likelihood of receiving a job
o↵er. In contrast, we find no e↵ects for intelligence or economic preferences. To investigate the
relative importance of the di↵erent personal characteristics, we compare the predictive power of several
personal characteristics. Only the models for grades, Grit, and the Big Five have predictive power
in explaining o↵ers. The relative predictive power of the Big Five is particularly striking, and they
are by far the most important predictors. For the Big Five, we find that the baseline scores at the
beginning of the training matter most, while for Grit we find that its development during training is
most important.
Our results show that firms base their job o↵ers on hard-to-observe non-cognitive skills. Firms take
this phenomenon into account by extensively o↵ering programs that allow them to screen entry-level
workers. Firms appear to use these programs to screen primarily for non-cognitive skills. For policy
1997; Mueller & Schweri, 2015; von Wachter & Bender, 2006) and on factors a↵ecting the probability of staying in thetraining firm (Euwals & Winkelmann, 2004; Franz & Zimmermann, 2002; Mohrenweiser, Wydra-Somaggio, & Zwick,2017).
3
makers, our results imply that policies targeted towards the preparation of young people for entering
the labor market should also focus on improving non-cognitive skills because employers not only value
those skills but also changes in them. Indeed, Hoeschler, Balestra, and Backes-Gellner (2018) show that
non-cognitive skills change during adolescence and adulthood. Moreover, policy makers may facilitate
training programs that include screening periods in which individuals can communicate their valuable
non-cognitive skills to potential employers.
To show the importance of the job o↵ers we investigated, we relate them to later labor market
outcomes. First, individuals who receive a job o↵er at the end of the training period heavily reduce
their search activities for other jobs. We observe significant and large di↵erences in the number of job
applications sent out and the number of months spent on job search. Second, we test whether the
wages two years after training di↵er for individuals both with and without o↵ers, and find significantly
higher full-time wages for those who received an o↵er. The wage di↵erence between the two groups is
equal to 605 Swiss Francs (CHF), or about 13 percent. In sum, we show that job o↵ers are related
to further labor market outcomes, and—because we show in our main analysis that the strongest
predictors for receiving a job o↵er are the trainees’ non-cognitive skills—provide an indication that
employers value non-cognitive skills.
The link between o↵ers—which are related to non-cognitive skills—and wages provides valuable
insights into labor market selection processes. Studies that examine wage di↵erences between firm
movers and firm stayers usually put great e↵ort into establishing research designs that help reduce
the selection issues between the two groups (e.g., Acemoglu & Pischke, 1998; von Wachter & Bender,
2006). For example, while von Wachter and Bender (2006) find substantial wage di↵erences between
firm movers and stayers when not accounting for the selection into the two groups, they find no wage
di↵erences when estimating the causal e↵ect of moving and staying. By describing this non-random
selection process, our study reveals di↵erences in non-cognitive skills between movers and stayers,
di↵erences that explain the di↵erent results in, for example, von Wachter and Bender (2006).
By showing that firms use non-cognitive skills when deciding to make retention o↵ers, we also
contribute to the growing literature on the importance of skills other than pure cognitive ability (e.g.,
4

Deming, 2016; Heckman et al., 2006). However, while the wage returns to non-cognitive skills are
established in a causal manner (e.g., Heckman et al., 2006), in this paper we make no causal claims.
Instead we describe the usually unobserved selection processes into employment. As this is a major
selection issue in labor economics, our study provides valuable insights for researchers, firms, and
policy makers alike. To investigate this selection process, we use a unique research design that we
describe extensively in the next section.
2 Research Design
Our research design has several favorable elements that enable us to tackle our questions. These ele-
ments are based on both our panel data, which gives us extensive measures of personal characteristics,
and on the unique institutional setting of the Swiss apprenticeship training system. This sections
describes both factors.
2.1 Data
We use the Leading House Apprenticeship Panel, a panel data set started in 2009 with individuals
who had just begun their apprenticeship training in Zurich, Switzerland.2 The training is conducted
in three major occupations (commercial employee, electrician, and polymechanic) and takes three to
four years.3 While the students receive one to two days per week of classroom learning in a vocational
school, they receive most of their training in a host company (Wolter & Ryan, 2011). Given that the
host company conducts such a substantial part of the training, it should be able to fully observe the
trainee’s personal characteristics.
We collected measures at the start of the apprenticeship training (at age 15-16), during the training,
and two years after the training (at age 21-22). Figure A1 provides an overview of the time structure
of the project. The training last three years for commercial employees and four years for technicians
(electricians and polymechanics). For the main analysis, we use information provided in the initial and
2For a detailed description of the data and an overview of the entire project, see Oswald and Backes-Gellner (2014).3Vocational education and training is the main route of secondary education in Switzerland, serving 70 percent of
young people (Ho↵man & Schwartz, 2015). The occupations investigated in our study all rank in the top ten of theapprenticeship training occupations, with commercial employees outnumbering all other occupations by far (SERI, 2014).
5

the final surveys. The initial survey provides us with rich baseline measures of personal characteristics
and additional background variables. The final survey, which took place two years after the respective
training ended, includes information on retention o↵ers and further labor market outcomes.
[Insert Figure A1 about here.]
By giving us detailed information on job o↵ers and personal characteristics, our data set is ideal for
answering our research questions. First, it allows us to directly observe job o↵ers, which register, firm-
level, and large survey data sets rarely include. To this end, our data set provides detailed information
on job o↵ers by the training firm at the end of the training. By asking the trainees in great detail about
their o↵ers, we are confident that trainees truly report their o↵ers.4 Second, the data set gives us
measures for intelligence, economic preferences (time preferences and risk aversion), and non-cognitive
skills (Grit and the Big Five). Given such an extensive bundle of personal characteristics, our data
set provides us with the unique opportunity to investigate the importance of all these characteristics
for the likelihood of receiving a job o↵er.
Another advantage of our data is that the surveyed population is very homogeneous with respect
to occupation, education, and region. As all individuals received the same level of training, the re-
striction on range reduces selection issues. The setting we use is also similar to the reality of the
hiring process, in which firms select workers for a given position within a given occupation. Moreover,
studies investigating individual wage di↵erences usually control for occupation, and therefore inves-
tigate di↵erences within occupations rather than between them (e.g., von Wachter & Bender, 2006).
Therefore, in line with Deming and Kahn (2017), we investigate the relative importance of various
personal characteristics within narrowly defined occupations.
As with all panel data sets, we have to investigate attrition issues. The initial sample in 2009
4Ideally, we would like to match the trainee’s information on the o↵ers with additional information provided by thefirms. However, as the Leadinghouse Apprenticeship Panel exclusively surveys individuals, not firms, such matching isnot feasible.
6

consists of 265 individuals, 235 of whom provide measures of intelligence, grades, economic preferences,
non-cognitive skills, and background variables. In the final wave, six years later, 159 individuals
responded to our intense survey e↵orts (via e-mails, letters, phone calls, and social media), and 135
provided all analyzed measures. We view all our results as conditional on finishing apprenticeship
training and staying in the sample. However, the overall attrition, which is 40 percent, is unrelated
to intelligence, baseline non-cognitive skills, economic preferences, or various background variables
(results available from the authors upon request).
2.2 Measures of Personal Characteristics
To measure personal characteristics, we use well-established measures of intelligence, economic pref-
erences (time preferences and risk aversion), and non-cognitive skills (Grit and the Big Five).5 As
our measures of intelligence, we use two tests: a general intelligence (IQ) test and the Cognitive Re-
flection Test (CRT). Our IQ test is one of the 11 modules of the Wechsler Adult Intelligence Scale
(WAIS-III)—one of the most widely used IQ tests (Kaufman & Lichtenberger, 1998). We use the digit
symbol-coding test, which asks subjects to match as many digits and symbols according to a given key
as possible in a fixed time (for details, see Dohmen, Falk, Hu↵man, & Sunde, 2010). Our other mea-
sure of intelligence, the CRT, developed in Frederick (2005), asks subjects three questions, each having
an intuitive answer that is incorrect. Finding the correct answer requires some cognitive reflection.
However, once explained, the correct answer is easily understood. Both measures of intelligence are
well established and appear to measure di↵erent facets of intelligence. Indeed, the correlation between
the two measures is basically zero.
Using these measures of intelligence, we show that the apprentices in our data set are average-
ability students. The mean IQ score in our sample (table A1) is equal to the 50th-percentile score of
a general sample of 16- to 17-year-olds in Austria, Germany, and Switzerland (von Aster, Neubauer,
& Horn, 2009). Comparing the mean CRT score in our sample (0.926) to the scores of undergraduate
students at selected public U.S. colleges (Frederick, 2005), we find that our score is in the range of the
5For a detailed overview of the measures, see also Bessey (2010).
7
reported scores at the University of Michigan at Ann Arbor (1.18), Bowling Green State University
(0.87), the University of Michigan at Dearborn (0.83), and Michigan State University (0.79). Moreover,
Branas-Garza, Kujal, and Lenkei (2015) survey 118 studies using the CRT and calculate for a total
population of 44,558 students and non-students a mean of 1.19. Thus the apprentices in our data are
clearly within the average-ability range.6
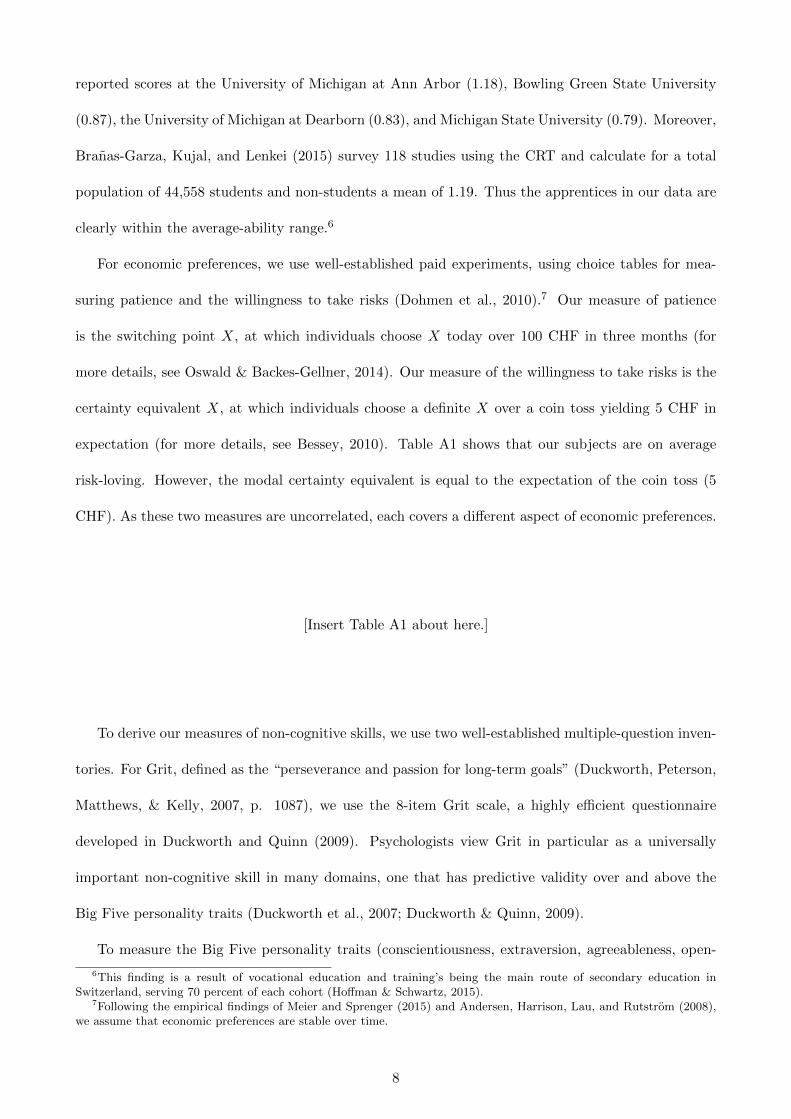
For economic preferences, we use well-established paid experiments, using choice tables for mea-
suring patience and the willingness to take risks (Dohmen et al., 2010).7 Our measure of patience
is the switching point X, at which individuals choose X today over 100 CHF in three months (for
more details, see Oswald & Backes-Gellner, 2014). Our measure of the willingness to take risks is the
certainty equivalent X, at which individuals choose a definite X over a coin toss yielding 5 CHF in
expectation (for more details, see Bessey, 2010). Table A1 shows that our subjects are on average
risk-loving. However, the modal certainty equivalent is equal to the expectation of the coin toss (5
CHF). As these two measures are uncorrelated, each covers a di↵erent aspect of economic preferences.
[Insert Table A1 about here.]
To derive our measures of non-cognitive skills, we use two well-established multiple-question inven-
tories. For Grit, defined as the “perseverance and passion for long-term goals” (Duckworth, Peterson,
Matthews, & Kelly, 2007, p. 1087), we use the 8-item Grit scale, a highly e�cient questionnaire
developed in Duckworth and Quinn (2009). Psychologists view Grit in particular as a universally
important non-cognitive skill in many domains, one that has predictive validity over and above the
Big Five personality traits (Duckworth et al., 2007; Duckworth & Quinn, 2009).
To measure the Big Five personality traits (conscientiousness, extraversion, agreeableness, open-
6This finding is a result of vocational education and training’s being the main route of secondary education inSwitzerland, serving 70 percent of each cohort (Ho↵man & Schwartz, 2015).
7Following the empirical findings of Meier and Sprenger (2015) and Andersen, Harrison, Lau, and Rutstrom (2008),we assume that economic preferences are stable over time.
8
ness, and emotional stability),8 we use a well-established 3-item-per-trait scale based on the original
Big Five Inventory (BFI) scale and further developed in Gerlitz and Schupp (2005).9 The Big Five
construct is the standard taxonomy for classifying personality traits (John, Naumann, & Soto, 2008).
As previously mentioned, some non-cognitive skills change during apprenticeship training (Hoeschler
et al., 2018). Therefore, for all measures of non-cognitive skills, we include changes over time (deltas),
which are the di↵erences between the respective measure before and after the apprenticeship training
(table A1). By construction each measure’s delta is correlated with its initial value.10
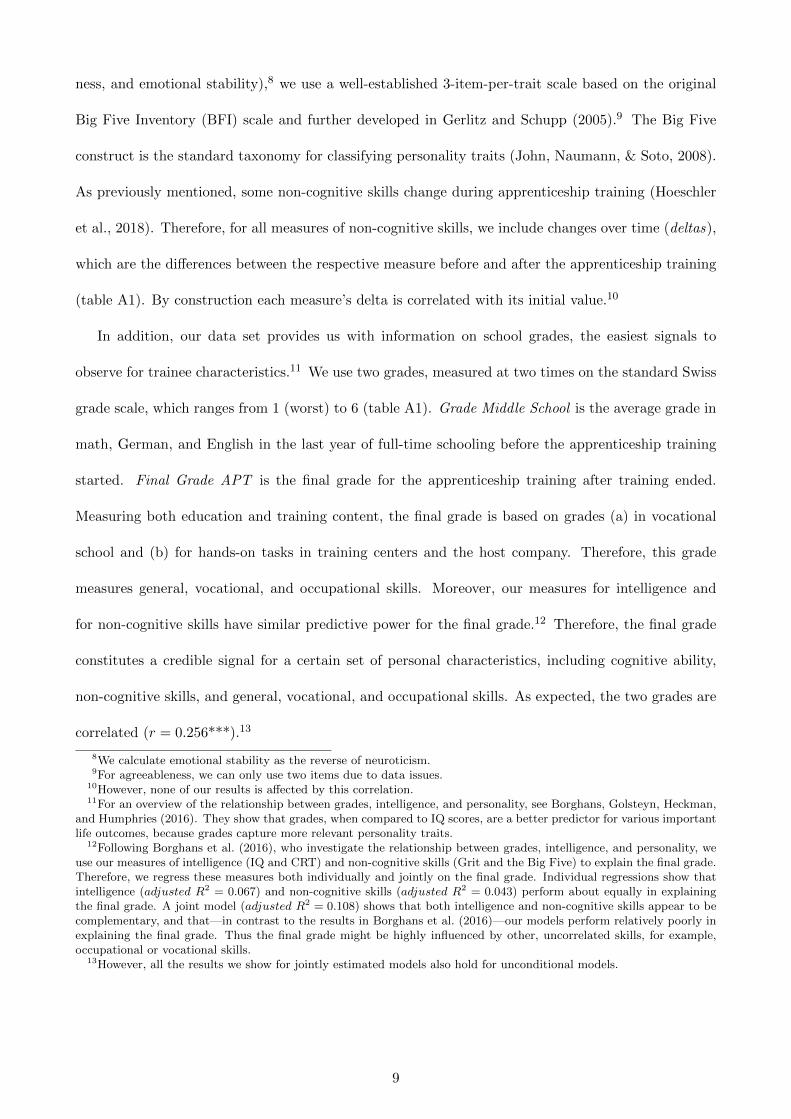
In addition, our data set provides us with information on school grades, the easiest signals to
observe for trainee characteristics.11 We use two grades, measured at two times on the standard Swiss
grade scale, which ranges from 1 (worst) to 6 (table A1). Grade Middle School is the average grade in
math, German, and English in the last year of full-time schooling before the apprenticeship training
started. Final Grade APT is the final grade for the apprenticeship training after training ended.
Measuring both education and training content, the final grade is based on grades (a) in vocational
school and (b) for hands-on tasks in training centers and the host company. Therefore, this grade
measures general, vocational, and occupational skills. Moreover, our measures for intelligence and
for non-cognitive skills have similar predictive power for the final grade.12 Therefore, the final grade
constitutes a credible signal for a certain set of personal characteristics, including cognitive ability,
non-cognitive skills, and general, vocational, and occupational skills. As expected, the two grades are
correlated (r = 0.256***).13
8We calculate emotional stability as the reverse of neuroticism.9For agreeableness, we can only use two items due to data issues.
10However, none of our results is a↵ected by this correlation.11For an overview of the relationship between grades, intelligence, and personality, see Borghans, Golsteyn, Heckman,
and Humphries (2016). They show that grades, when compared to IQ scores, are a better predictor for various importantlife outcomes, because grades capture more relevant personality traits.
12Following Borghans et al. (2016), who investigate the relationship between grades, intelligence, and personality, weuse our measures of intelligence (IQ and CRT) and non-cognitive skills (Grit and the Big Five) to explain the final grade.Therefore, we regress these measures both individually and jointly on the final grade. Individual regressions show thatintelligence (adjusted R2 = 0.067) and non-cognitive skills (adjusted R2 = 0.043) perform about equally in explainingthe final grade. A joint model (adjusted R2 = 0.108) shows that both intelligence and non-cognitive skills appear to becomplementary, and that—in contrast to the results in Borghans et al. (2016)—our models perform relatively poorly inexplaining the final grade. Thus the final grade might be highly influenced by other, uncorrelated skills, for example,occupational or vocational skills.
13However, all the results we show for jointly estimated models also hold for unconditional models.
9
2.3 Job O↵ers
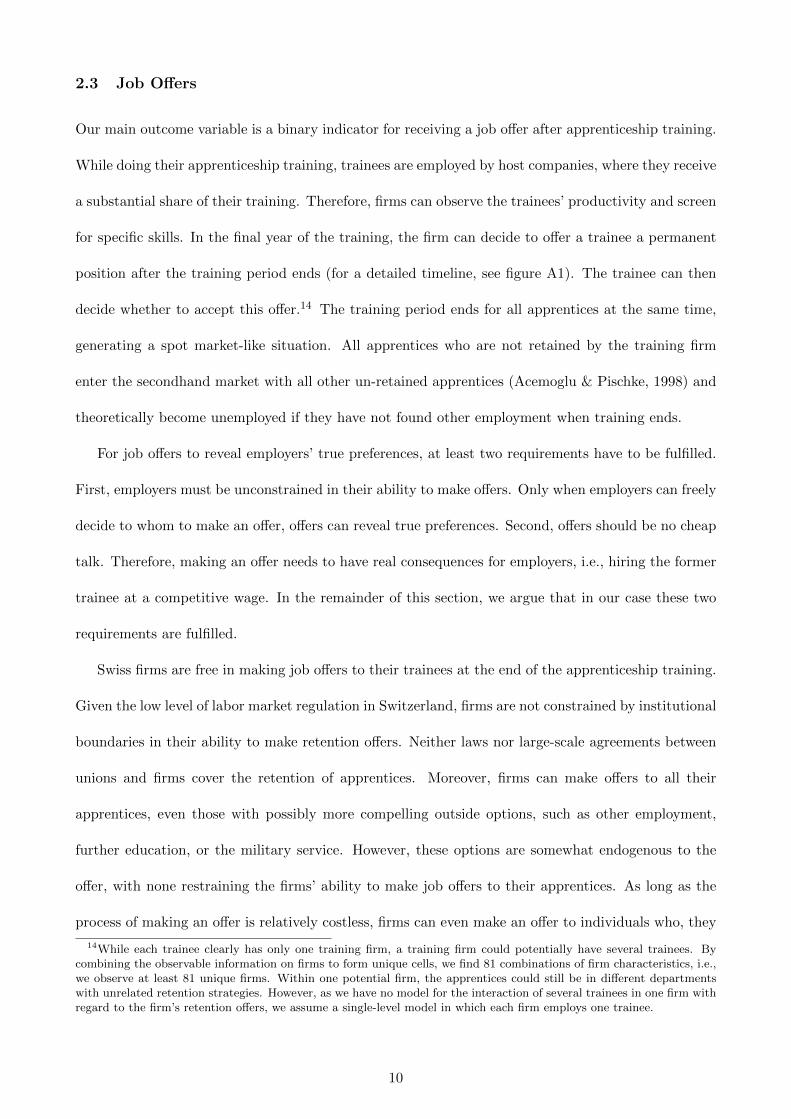
Our main outcome variable is a binary indicator for receiving a job o↵er after apprenticeship training.
While doing their apprenticeship training, trainees are employed by host companies, where they receive
a substantial share of their training. Therefore, firms can observe the trainees’ productivity and screen
for specific skills. In the final year of the training, the firm can decide to o↵er a trainee a permanent
position after the training period ends (for a detailed timeline, see figure A1). The trainee can then
decide whether to accept this o↵er.14 The training period ends for all apprentices at the same time,
generating a spot market-like situation. All apprentices who are not retained by the training firm
enter the secondhand market with all other un-retained apprentices (Acemoglu & Pischke, 1998) and
theoretically become unemployed if they have not found other employment when training ends.
For job o↵ers to reveal employers’ true preferences, at least two requirements have to be fulfilled.
First, employers must be unconstrained in their ability to make o↵ers. Only when employers can freely
decide to whom to make an o↵er, o↵ers can reveal true preferences. Second, o↵ers should be no cheap
talk. Therefore, making an o↵er needs to have real consequences for employers, i.e., hiring the former
trainee at a competitive wage. In the remainder of this section, we argue that in our case these two
requirements are fulfilled.
Swiss firms are free in making job o↵ers to their trainees at the end of the apprenticeship training.
Given the low level of labor market regulation in Switzerland, firms are not constrained by institutional
boundaries in their ability to make retention o↵ers. Neither laws nor large-scale agreements between
unions and firms cover the retention of apprentices. Moreover, firms can make o↵ers to all their
apprentices, even those with possibly more compelling outside options, such as other employment,
further education, or the military service. However, these options are somewhat endogenous to the
o↵er, with none restraining the firms’ ability to make job o↵ers to their apprentices. As long as the
process of making an o↵er is relatively costless, firms can even make an o↵er to individuals who, they
14While each trainee clearly has only one training firm, a training firm could potentially have several trainees. Bycombining the observable information on firms to form unique cells, we find 81 combinations of firm characteristics, i.e.,we observe at least 81 unique firms. Within one potential firm, the apprentices could still be in di↵erent departmentswith unrelated retention strategies. However, as we have no model for the interaction of several trainees in one firm withregard to the firm’s retention o↵ers, we assume a single-level model in which each firm employs one trainee.
10

assume, would never accept it. In sum, firms are neither obligated to make o↵ers to any of their
apprentices nor restrained from making o↵ers to all of them.
Another reason that Swiss firms are free in making o↵ers is that they do not face any costs when
deciding not to make one. On average, training firms face no training costs from apprenticeship
training (Muehlemann, Pfeifer, Walden, Wenzelmann, & Wolter, 2010)15 and therefore do not need to
retain a certain number of trainees to recoup such costs. Neither do firms face firing costs if they do not
retain a trainee, as all training contracts just expire at the fixed end of the training. Not having any
costs of separation is a major di↵erence between our setting and up-or-out contracts, promotions in
general, or other forms of retention that may also provide settings for studying employer preferences.
Our setting has the advantage of allowing firms to truly state their preferences without taking into
account firing issues. In sum, firms are totally free in making o↵ers.
Investigating the second requirement, we show that o↵ers have a high likelihood of resulting in
employment at high wages. In our sample, 70 percent of the apprentices receive a job o↵er at the end
of the training period (table A2). Therefore, o↵ers are selective, and—as not all trainees receive one—
we can use them to infer employer preferences. Figure A2 shows the distribution of retention wages.
This distribution has a high mean, a clear lower threshold, and only limited variation.16 O↵ers have
a high mean wage of 4,647 CHF per month (or 55,763 CHF per year), with a low standard deviation
of 392.17 Such a limited variation in wages of young workers with the same level of education is in
line with the earnings dispersion literature, which shows that earnings fan out with workers’ age (for
an overview, see Neal & Rosen, 2000). Indeed, the limited variation in retention wages is the reason
for our focus on explaining the likelihood of receiving an o↵er, not on explaining the amount o↵ered.
15Di↵erent occupations have di↵erent training costs. The technical occupations investigated in this study tend to leadto positive net training costs on average but with a high variance between firms (Strupler & Wolter, 2012). Moreover, thecommercial apprenticeship training causes no substantial training costs on average (Strupler & Wolter, 2012). Therefore,we assume that for our full sample positive training costs play no major role. We further examine this issue in section4.1.
16Figure A2 shows a clear cut-o↵, as there are no o↵ers below a certain threshold (3,500 CHF). Despite no generalminimum wage in Switzerland, some sector-specific wage floors exist. In addition, firms appear to agree on an implicitlower bound for the wage o↵er. The observed distribution implies an equilibrium in which not every trainee simplyreceives an o↵er according to his or her marginal productivity but in which only the “best” apprentices receive o↵ersand in which, therefore, o↵ers can act as a credible signal for ability.
17The mean wage o↵er di↵ers by occupation. Electricians have a statistically significant higher mean o↵er (4,938 CHF)than commercial employees (4,564 CHF) or polymechanics (4,691 CHF). The o↵ered fixed pay per month is measuredin intervals of 500 CHF. All reported additional payments are converted to monthly wages and added to the fixed pay.The limited variation might be partly due to the measuring of wages in relatively large intervals.
11
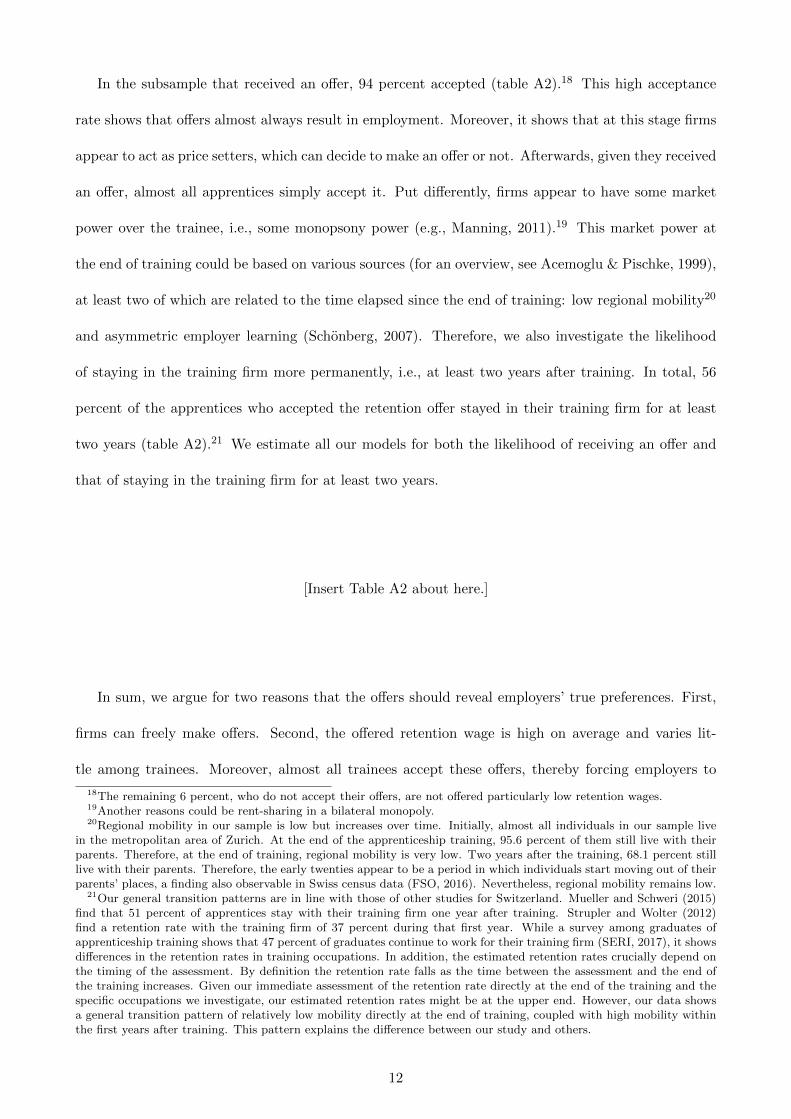
In the subsample that received an o↵er, 94 percent accepted (table A2).18 This high acceptance
rate shows that o↵ers almost always result in employment. Moreover, it shows that at this stage firms
appear to act as price setters, which can decide to make an o↵er or not. Afterwards, given they received
an o↵er, almost all apprentices simply accept it. Put di↵erently, firms appear to have some market
power over the trainee, i.e., some monopsony power (e.g., Manning, 2011).19 This market power at
the end of training could be based on various sources (for an overview, see Acemoglu & Pischke, 1999),
at least two of which are related to the time elapsed since the end of training: low regional mobility20
and asymmetric employer learning (Schonberg, 2007). Therefore, we also investigate the likelihood
of staying in the training firm more permanently, i.e., at least two years after training. In total, 56
percent of the apprentices who accepted the retention o↵er stayed in their training firm for at least
two years (table A2).21 We estimate all our models for both the likelihood of receiving an o↵er and
that of staying in the training firm for at least two years.
[Insert Table A2 about here.]
In sum, we argue for two reasons that the o↵ers should reveal employers’ true preferences. First,
firms can freely make o↵ers. Second, the o↵ered retention wage is high on average and varies lit-
tle among trainees. Moreover, almost all trainees accept these o↵ers, thereby forcing employers to
18The remaining 6 percent, who do not accept their o↵ers, are not o↵ered particularly low retention wages.19Another reasons could be rent-sharing in a bilateral monopoly.20Regional mobility in our sample is low but increases over time. Initially, almost all individuals in our sample live
in the metropolitan area of Zurich. At the end of the apprenticeship training, 95.6 percent of them still live with theirparents. Therefore, at the end of training, regional mobility is very low. Two years after the training, 68.1 percent stilllive with their parents. Therefore, the early twenties appear to be a period in which individuals start moving out of theirparents’ places, a finding also observable in Swiss census data (FSO, 2016). Nevertheless, regional mobility remains low.
21Our general transition patterns are in line with those of other studies for Switzerland. Mueller and Schweri (2015)find that 51 percent of apprentices stay with their training firm one year after training. Strupler and Wolter (2012)find a retention rate with the training firm of 37 percent during that first year. While a survey among graduates ofapprenticeship training shows that 47 percent of graduates continue to work for their training firm (SERI, 2017), it showsdi↵erences in the retention rates in training occupations. In addition, the estimated retention rates crucially depend onthe timing of the assessment. By definition the retention rate falls as the time between the assessment and the end ofthe training increases. Given our immediate assessment of the retention rate directly at the end of the training and thespecific occupations we investigate, our estimated retention rates might be at the upper end. However, our data showsa general transition pattern of relatively low mobility directly at the end of training, coupled with high mobility withinthe first years after training. This pattern explains the di↵erence between our study and others.
12

pay these wages. Therefore, by investigating the likelihood of receiving a job o↵er, we can observe
employers’ true preferences for certain personal characteristics.
3 Results
3.1 Relation of Personal Characteristics and Job O↵ers
To derive our results, we estimate OLS models. First, we run individual regressions for each personal
characteristic, including a set of control variables. Second, to compare the relative predictive power
of each personal characteristic, we compare the adjusted R2s of models without control variables (for
a similar approach, see Borghans et al., 2016). We use OLS in our main analysis, as it provides a
well-established measure of relative predictive power (adjusted R2) that accounts for di↵ering numbers
of regressors.22 Given that our personal characteristics consist of di↵ering numbers of variables, such
a measure is crucial for our analysis. Nonetheless, we show that all our results are robust to various
other model specifications.
By providing the raw correlations between our personal characteristics and the likelihood of re-
ceiving an o↵er, Table A1 shows overall our main result that grades and various non-cognitive skills
are important for receiving an o↵er. Moreover, Table A1 shows in detail that the final grade of the
apprenticeship training is positively correlated with job o↵ers. For the non-cognitive skills, the changes
in Grit and some of the Big Five variables are significant. Positive changes in Grit, higher initial level
of conscientiousness, lower initial levels of openness, and positive changes in emotional stability are
all correlated with the likelihood of receiving an o↵er. However, given that we will primarily estimate
joint models with all Big Five traits, the raw correlation of each trait is only of limited information.
When investigating these joint models, as we have no theoretical expectation of the e↵ect direction
for each trait, we therefore, interpret the Big Five traits as a bundle and—in line with other studies
(e.g., Becker et al., 2012)—do not discuss the e↵ect direction of any single trait. Indeed, each e↵ect is
22The relationship between the R2 and the adjusted R2 (for degrees of freedom) is given as: adjusted R2 = 1 �(n�1)(n�K) (1�R2), with n being the number of observations and K being the number of estimated coe�cients. If the R2 issu�ciently close to zero, i.e., when the sample correlation between the explanatory variables and the outcome is basicallyzero, the adjusted R2 becomes negative.
13

simply a residual one conditioned on all the other traits. Given no clear procedure for attaching any
meaning to these residual e↵ects, we therefore treat all the Big Five initial values as one variable and
all the deltas as a second variable. Our main line of argumentation for all personal characteristics is
then based on F -tests of joint significance and adjusted R2s.
Moving towards the regression results, we find that the final training grade is a significant predictor
for receiving a job o↵er after training (table A3, column 2). Given that the training firm has three to
four years to observe the trainee’s abilities, the firm does not need to rely on grades as a signal for
ability. In contrast, we find no significant relationship between the likelihood of receiving an o↵er and
intelligence (measured by IQ and CRT).23 These contradictory findings suggest that training firms
value the final grade not because they constitute a measure of pure cognitive ability but because they
measure occupational, vocational, and non-cognitive skills. As with our results for intelligence, we
find no e↵ects for economic preferences, i.e., for patience or the willingness to take risks (table A3,
column 3).
In contrast, we find that various non-cognitive skills have an impact on the likelihood to receive
an o↵er (table A3, columns 4 and 5). For Grit, this likelihood is strongly related to its development
during training. This result shows that employers value changes in certain non-cognitive skills.24 For
the Big Five, the likelihood of receiving an o↵er is strongly related to the baseline personality at the
beginning of training. However, all the changes taken as one group are not significant. An explanation
for this result could be that training firms might be biased by the initial personality traits and might
change their priors only slowly over time. In sum, for the Big Five, the initial levels appear more
important, while for Grit the importance lies on the changes over time. However, for both the Big
Five and Grit, we find that initial values and deltas are jointly significant, not a surprising finding
given the high correlation between the two measures.
23When including four dummies, one for each potential outcome of the CRT, thereby allowing the CRT score to a↵ecto↵ers in a more flexible manner, we also find no e↵ect for CRT.
24Therefore, incorporating the development of non-cognitive skills over time when investigating the returns to non-cognitive skills is critical.
14

[Insert Table A3 about here.]
The findings in Table A3 are robust to various model specifications and estimation methods in the
following four ways.25 First, none of the e↵ects depend on the inclusion of control variables (being
a native speaker, mother’s education, gender, and age), and the e↵ects are virtually identical when
we include controls for occupation. Therefore, our results are similar across occupations and our
personal characteristics do not merely pick up di↵erences across occupations. Second, the results
do not depend on the applied grouping of personal characteristics. In Table A3 we include two
variables for each personal characteristic (treating the Big Five as only two variables, initial values
and deltas). However, this grouping has no e↵ect on the results, because the significant e↵ects still
remain significant in unconditional models with only one variable at a time. Third, when we estimate
probit regressions, all e↵ects remain significant. Given that our outcome is a binary variable, testing
for such model specifications is crucial. Fourth, all e↵ects remain significant when we use HC3 standard
errors to correct for the limited sample size. Thus our overall conclusions depend on no particular
model specification or estimation method, and are robust to several other approaches.
Next, assessing the predictive power of the di↵erent characteristics, we find that the Big Five are
the most important predictors for receiving a job o↵er. To display the relative importance of the
di↵erent personal characteristics, Figure A3 shows adjusted R2s for similar models as in Table A3 but
without any control variables. Only the models for grades, Grit, and the Big Five explain the variance
in the likelihood of receiving an o↵er. More specifically, grades and Grit perform about equally well,
while the relative predictive power of the Big Five is striking—about six times higher than for grades
or Grit. Running a full model with all personal characteristics (figure A3, column 6) shows that Grit,
grades, and the Big Five all have incremental predictive power, as the bars of the separate models
add up nicely in the full model. This finding shows that grades, Grit, and the Big Five appear to be
complements.26
25In some specifications, the e↵ects for final grade and the Big Five initial values remain significant only at the 15percent level. Specific results are available upon request.
26We test three additional specifications. First, including both measures that capture cognitive ability—intelligence
15
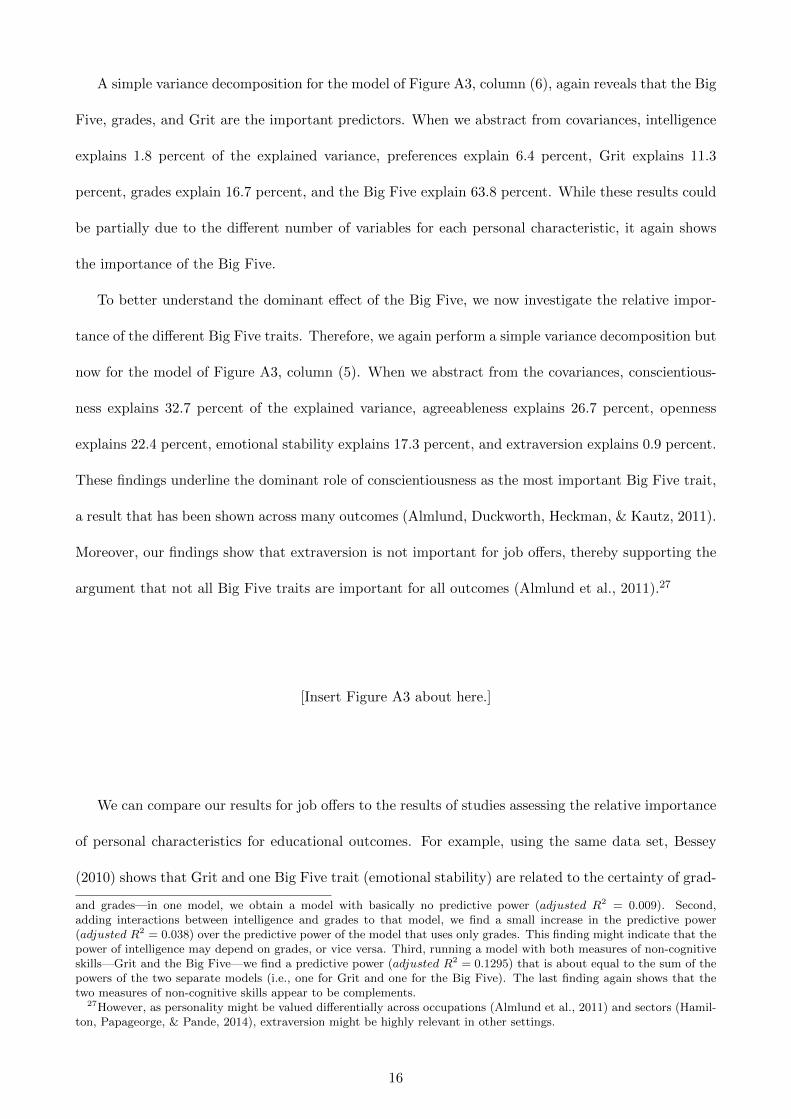
A simple variance decomposition for the model of Figure A3, column (6), again reveals that the Big
Five, grades, and Grit are the important predictors. When we abstract from covariances, intelligence
explains 1.8 percent of the explained variance, preferences explain 6.4 percent, Grit explains 11.3
percent, grades explain 16.7 percent, and the Big Five explain 63.8 percent. While these results could
be partially due to the di↵erent number of variables for each personal characteristic, it again shows
the importance of the Big Five.
To better understand the dominant e↵ect of the Big Five, we now investigate the relative impor-
tance of the di↵erent Big Five traits. Therefore, we again perform a simple variance decomposition but
now for the model of Figure A3, column (5). When we abstract from the covariances, conscientious-
ness explains 32.7 percent of the explained variance, agreeableness explains 26.7 percent, openness
explains 22.4 percent, emotional stability explains 17.3 percent, and extraversion explains 0.9 percent.
These findings underline the dominant role of conscientiousness as the most important Big Five trait,
a result that has been shown across many outcomes (Almlund, Duckworth, Heckman, & Kautz, 2011).
Moreover, our findings show that extraversion is not important for job o↵ers, thereby supporting the
argument that not all Big Five traits are important for all outcomes (Almlund et al., 2011).27
[Insert Figure A3 about here.]
We can compare our results for job o↵ers to the results of studies assessing the relative importance
of personal characteristics for educational outcomes. For example, using the same data set, Bessey
(2010) shows that Grit and one Big Five trait (emotional stability) are related to the certainty of grad-
and grades—in one model, we obtain a model with basically no predictive power (adjusted R2 = 0.009). Second,adding interactions between intelligence and grades to that model, we find a small increase in the predictive power(adjusted R2 = 0.038) over the predictive power of the model that uses only grades. This finding might indicate that thepower of intelligence may depend on grades, or vice versa. Third, running a model with both measures of non-cognitiveskills—Grit and the Big Five—we find a predictive power (adjusted R2 = 0.1295) that is about equal to the sum of thepowers of the two separate models (i.e., one for Grit and one for the Big Five). The last finding again shows that thetwo measures of non-cognitive skills appear to be complements.
27However, as personality might be valued di↵erentially across occupations (Almlund et al., 2011) and sectors (Hamil-ton, Papageorge, & Pande, 2014), extraversion might be highly relevant in other settings.
16
uating from apprenticeship training while finding no significant relationships for intelligence, grades,
or economic preferences. However, she provides no F -tests for the joint significance of the Big Five
and, as she conducts her analysis at the beginning of the apprenticeship training, does not include
changes in non-cognitive skills. Burks et al. (2015), for a sample of U.S. college students, show that
conscientiousness and—to a limited extent—patient time preferences are important for grade point
average and graduation on time. They find no e↵ect for intelligence when running a full model that
includes several non-cognitive skills. In addition, Borghans et al. (2016) show that non-cognitive skills
predict test scores and grades above and beyond IQ scores. Therefore, the general pattern of our
results, which explain the selection in the labor market, is in line with other studies using educational
outcomes: that non-cognitive skills are the most important predictor across a variety of outcomes.
In sum, we show that the Big Five personality traits are by far the most predictive personal
characteristic for explaining job o↵ers. Moreover, we show a minor predictive role for Grit, another
non-cognitive skill, and for grades, which capture a variety of skills, including non-cognitive ones. In
contrast, neither intelligence nor economic preferences predict job o↵ers. Therefore, we show that
firms rely heavily on non-cognitive skills when making job o↵ers after apprenticeship training.
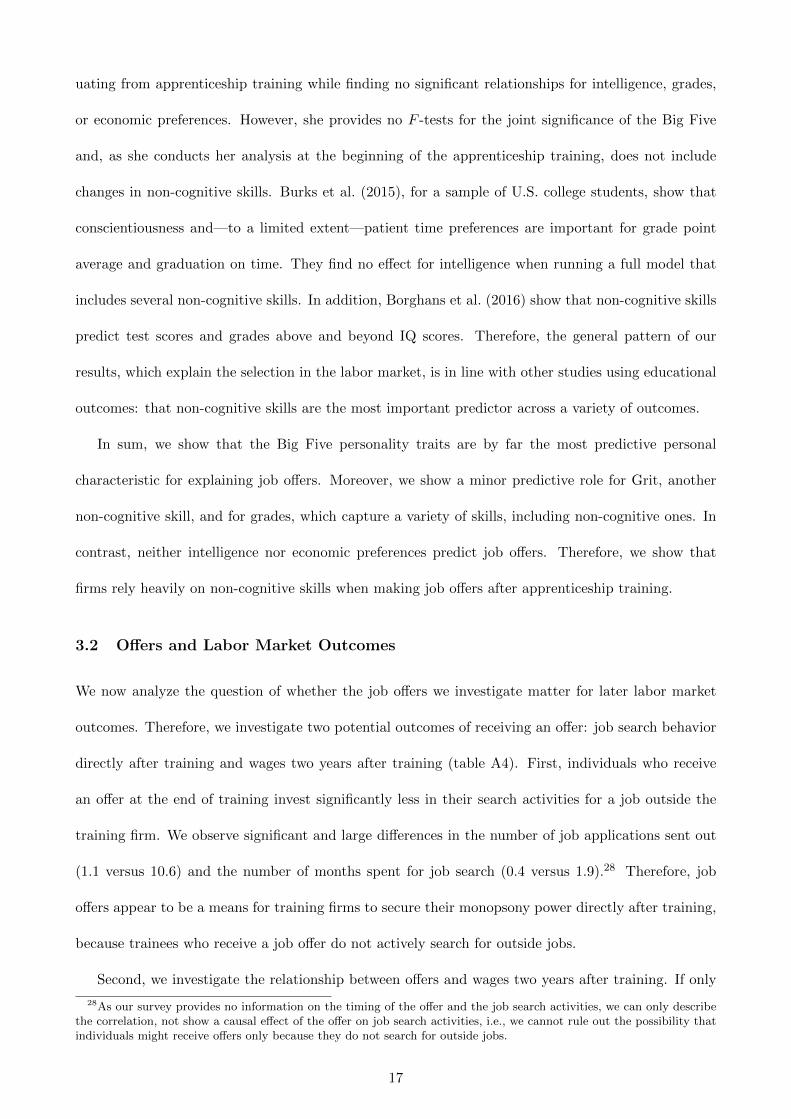
3.2 O↵ers and Labor Market Outcomes
We now analyze the question of whether the job o↵ers we investigate matter for later labor market
outcomes. Therefore, we investigate two potential outcomes of receiving an o↵er: job search behavior
directly after training and wages two years after training (table A4). First, individuals who receive
an o↵er at the end of training invest significantly less in their search activities for a job outside the
training firm. We observe significant and large di↵erences in the number of job applications sent out
(1.1 versus 10.6) and the number of months spent for job search (0.4 versus 1.9).28 Therefore, job
o↵ers appear to be a means for training firms to secure their monopsony power directly after training,
because trainees who receive a job o↵er do not actively search for outside jobs.
Second, we investigate the relationship between o↵ers and wages two years after training. If only
28As our survey provides no information on the timing of the o↵er and the job search activities, we can only describethe correlation, not show a causal e↵ect of the o↵er on job search activities, i.e., we cannot rule out the possibility thatindividuals might receive o↵ers only because they do not search for outside jobs.
17

the “good” workers receive job o↵ers, we should observe higher wages for workers who received an
o↵er. Therefore, we test whether the wages two years after training di↵er for workers with and without
an o↵er. We find significant higher full-time wages two years after training for workers who received
an o↵er.29 The wage di↵erence between the two groups is equal to 605 CHF, or about 13 percent
(table A4). Therefore, the o↵ers are highly important for the average trainee. While o↵ers might also
have a causal impact on wages, we view the wage di↵erences primarily as a result of selection, and the
o↵er as a signal for personality characteristics. In the next section, by looking at the group of retained
apprentices in more detail, we further investigate this question. Therefore, we examine what a↵ects
the mobility patterns of retained apprentices after training and whether these mobility patterns have
an e↵ect on wage di↵erences within this group.
[Insert Table A4 about here.]
3.3 Labor Market Mobility after Accepting O↵er
We investigate the more permanent outcome of a job o↵er by explaining the likelihood of staying with
the training firm for at least two years after accepting the o↵er. At this later stage, when various
market forces start to work, the training firm has much less influence. First, the raiding activities of
other firms and the training firm’s interest in and ability to match outside o↵ers become important
(Lazear, 1986; Waldman, 1990).30 Over time, o↵ers become public knowledge, i.e., employer learning
becomes symmetric (Schonberg, 2007). Individuals who received a job o↵er might use this o↵er as
a credible signal during their subsequent career development. Given the institutional setting of the
29The percentage of individuals working full-time is relatively low two years after training (62 percent). The mainreason indicated in our survey is “enrollment in further education and training.” A high level of further education andtraining during the period following the initial apprenticeship training is a major characteristic of the Swiss educationsystem (Ho↵man & Schwartz, 2015; SERI, 2014).
30In line with Waldman (1990), we find that the wage two years after training (mean: 4,525 CHF, sd: 2,053; full-timeworkers only: mean: 5,340 CHF, standard deviation: 930) varies much more than the retention wage o↵ered (mean:4,646 CHF, standard deviation: 399). However, this finding might be based on the survey design, as both wages aremeasured in intervals of 500 Francs and these intervals appear to allow only for limited di↵erentiation between the earlier(lower) wages.
18
Swiss apprenticeship system, outside firms appear unable to directly observe the training firm’s o↵er
or to act on it by giving a counter o↵er. However, individuals who receive an o↵er and stay at the
training firm reveal their o↵er by means of their employment patterns, thereby, allowing outside firms
to observe it over time.
Second, the apprentices’ preferences for employment may become more heterogeneous. While they
might be primarily interested in securing any kind of employment at the very end of training, they
might later develop further interests, for example, switching employers to obtain di↵erent types of
working experience or enrolling in further training. Therefore, we expect personal characteristics to
be much less important at this later stage.
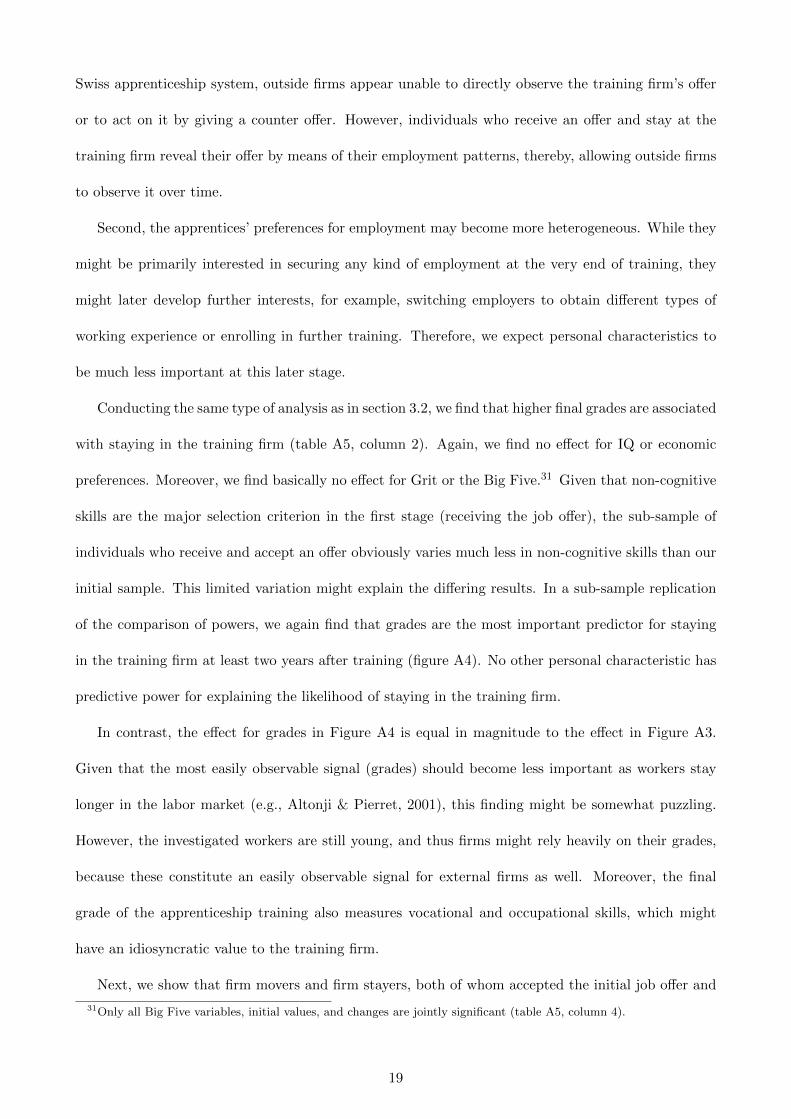
Conducting the same type of analysis as in section 3.2, we find that higher final grades are associated
with staying in the training firm (table A5, column 2). Again, we find no e↵ect for IQ or economic
preferences. Moreover, we find basically no e↵ect for Grit or the Big Five.31 Given that non-cognitive
skills are the major selection criterion in the first stage (receiving the job o↵er), the sub-sample of
individuals who receive and accept an o↵er obviously varies much less in non-cognitive skills than our
initial sample. This limited variation might explain the di↵ering results. In a sub-sample replication
of the comparison of powers, we again find that grades are the most important predictor for staying
in the training firm at least two years after training (figure A4). No other personal characteristic has
predictive power for explaining the likelihood of staying in the training firm.
In contrast, the e↵ect for grades in Figure A4 is equal in magnitude to the e↵ect in Figure A3.
Given that the most easily observable signal (grades) should become less important as workers stay
longer in the labor market (e.g., Altonji & Pierret, 2001), this finding might be somewhat puzzling.
However, the investigated workers are still young, and thus firms might rely heavily on their grades,
because these constitute an easily observable signal for external firms as well. Moreover, the final
grade of the apprenticeship training also measures vocational and occupational skills, which might
have an idiosyncratic value to the training firm.
Next, we show that firm movers and firm stayers, both of whom accepted the initial job o↵er and
31Only all Big Five variables, initial values, and changes are jointly significant (table A5, column 4).
19
started to work for the training firm, do not di↵er in labor market outcomes (table A6). First, we find
no significant di↵erences in job search activities at the end of training—a finding that is not surprising,
given that both groups accepted the o↵er of the training firm. However, this finding also shows that
firm movers do not accept the initial o↵er simply because they could not find a better job. Indeed, at
the end of training, neither group searches for jobs outside the training firm. Second, we investigate
the wage di↵erences between firm movers and firm stayers two years after training. Again, we focus
only on full-time employed workers. Given that firm stayers by definition remain still employed while
firm movers could be anywhere, this restriction is crucial for comparing the two groups. In contrast to
our findings in section 3.2, we find no statistically significant wage di↵erences between the two groups.
In sum, when workers receive and accept an o↵er, whether they stay with the training firm or move
to another firm within two years after the training is irrelevant for labor market outcomes.
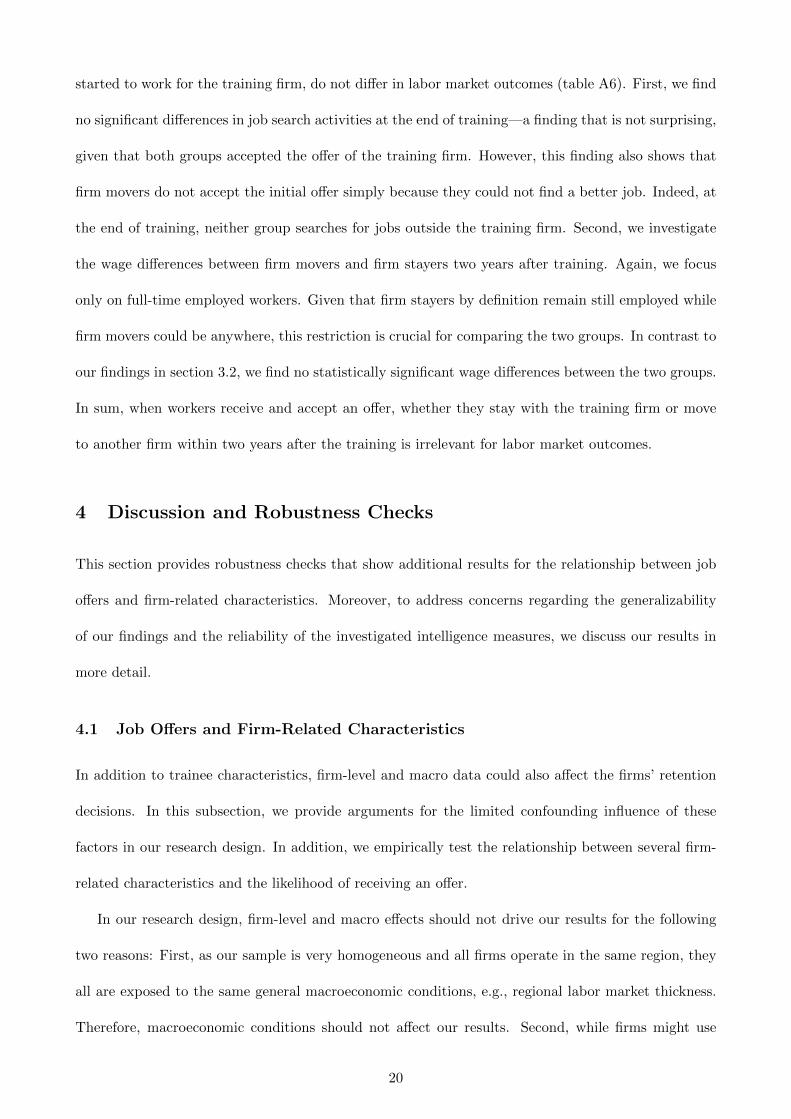
4 Discussion and Robustness Checks
This section provides robustness checks that show additional results for the relationship between job
o↵ers and firm-related characteristics. Moreover, to address concerns regarding the generalizability
of our findings and the reliability of the investigated intelligence measures, we discuss our results in
more detail.
4.1 Job O↵ers and Firm-Related Characteristics
In addition to trainee characteristics, firm-level and macro data could also a↵ect the firms’ retention
decisions. In this subsection, we provide arguments for the limited confounding influence of these
factors in our research design. In addition, we empirically test the relationship between several firm-
related characteristics and the likelihood of receiving an o↵er.
In our research design, firm-level and macro e↵ects should not drive our results for the following
two reasons: First, as our sample is very homogeneous and all firms operate in the same region, they
all are exposed to the same general macroeconomic conditions, e.g., regional labor market thickness.
Therefore, macroeconomic conditions should not a↵ect our results. Second, while firms might use
20
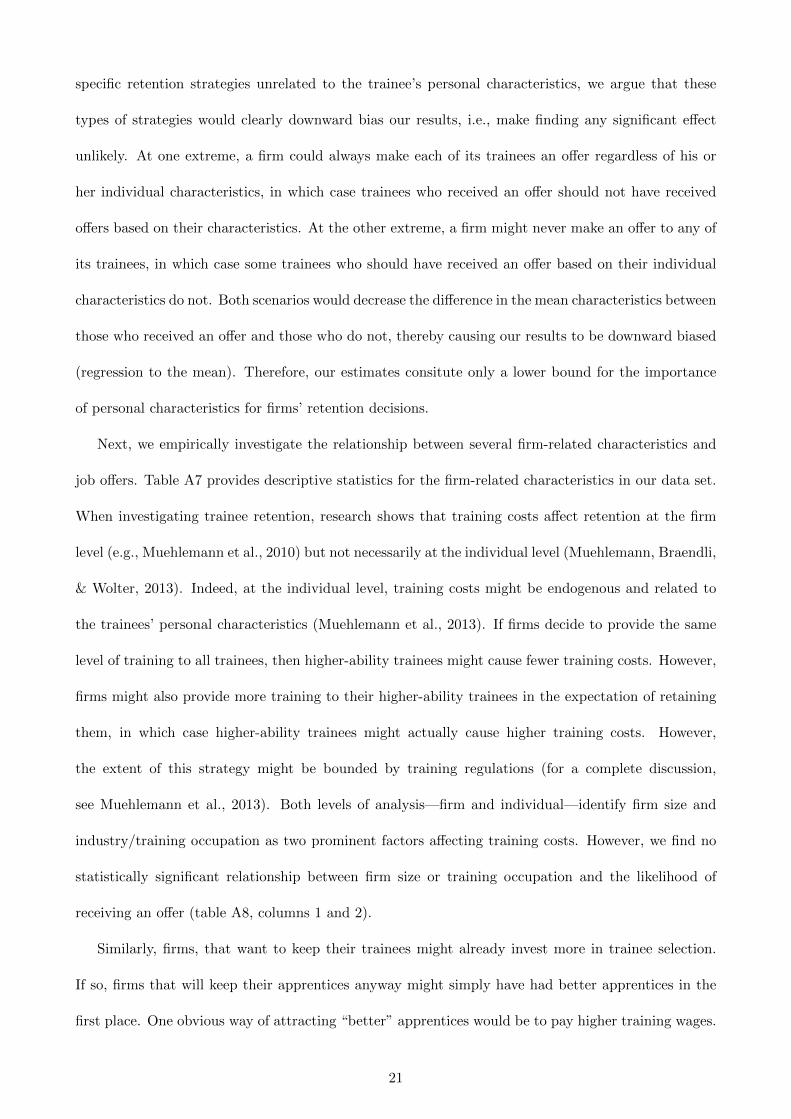
specific retention strategies unrelated to the trainee’s personal characteristics, we argue that these
types of strategies would clearly downward bias our results, i.e., make finding any significant e↵ect
unlikely. At one extreme, a firm could always make each of its trainees an o↵er regardless of his or
her individual characteristics, in which case trainees who received an o↵er should not have received
o↵ers based on their characteristics. At the other extreme, a firm might never make an o↵er to any of
its trainees, in which case some trainees who should have received an o↵er based on their individual
characteristics do not. Both scenarios would decrease the di↵erence in the mean characteristics between
those who received an o↵er and those who do not, thereby causing our results to be downward biased
(regression to the mean). Therefore, our estimates consitute only a lower bound for the importance
of personal characteristics for firms’ retention decisions.
Next, we empirically investigate the relationship between several firm-related characteristics and
job o↵ers. Table A7 provides descriptive statistics for the firm-related characteristics in our data set.
When investigating trainee retention, research shows that training costs a↵ect retention at the firm
level (e.g., Muehlemann et al., 2010) but not necessarily at the individual level (Muehlemann, Braendli,
& Wolter, 2013). Indeed, at the individual level, training costs might be endogenous and related to
the trainees’ personal characteristics (Muehlemann et al., 2013). If firms decide to provide the same
level of training to all trainees, then higher-ability trainees might cause fewer training costs. However,
firms might also provide more training to their higher-ability trainees in the expectation of retaining
them, in which case higher-ability trainees might actually cause higher training costs. However,
the extent of this strategy might be bounded by training regulations (for a complete discussion,
see Muehlemann et al., 2013). Both levels of analysis—firm and individual—identify firm size and
industry/training occupation as two prominent factors a↵ecting training costs. However, we find no
statistically significant relationship between firm size or training occupation and the likelihood of
receiving an o↵er (table A8, columns 1 and 2).
Similarly, firms, that want to keep their trainees might already invest more in trainee selection.
If so, firms that will keep their apprentices anyway might simply have had better apprentices in the
first place. One obvious way of attracting “better” apprentices would be to pay higher training wages.
21

However, we find no significant correlation between training wages and the likelihood of receiving
an o↵er (table A8, column 3). Finally, we investigate whether the likelihood of receiving an o↵er
depends on the interpersonal relationships of the trainee and his or her training supervisors and co-
workers. Again, we find no statistically significant relationship (table A8, column 4). In sum, we find
no significant relationship between characteristics related to the training firm and the likelihood of
receiving an o↵er from it. Similarly, for the subsample that accepted an o↵er we find no significant
relationship between firm characteristics and the likelihood of staying in the training firm for at least
two years (table A8, columns 5 to 8).
4.2 Initial Selection of Training Firms
Following up on the role of the firm in our setting, we further discuss the potential selection issue
that arises because training firms choose their apprentices at the beginning of training and personal
characteristics might already influence the selection process. Initially, students apply for apprentice-
ships with firms; then firms choose their apprentices from the pool of applicants. Ideally, to rule out
the possibility that the characteristics that we find unimportant might actually be very important in
the initial selection, we would like to replicate our study for the initial selection process. However,
for such an investigation, we would need information on the personal characteristics of the full set
of applicants, including those who received no apprenticeship position. Even if we had access to this
data, such a design would not address the limited observability of non-cognitive skills and thus would
most likely yield very di↵erent results. Moreover, some of our results indicate that the initial selection
process might be less important. First, we find no significant relationship between training wages and
o↵ers. Second, we find that changes in Grit during the training are important for receiving an o↵er.
Nevertheless, taking this potential limitation into account, we have to be clear that we address the
question of which skills are valued by employers conditional on having a pre-selected group of workers,
i.e., trainees. This question is a common one that researchers investigate when studying all kinds
of job promotions. However, when interpreting our results, we need to be aware that all reported
e↵ects are conditioned on the first selection into the apprenticeships. Thus we can not rule out the
22
possibility that economic preferences or intelligence might be highly predictive for entering into the
apprenticeship training program.
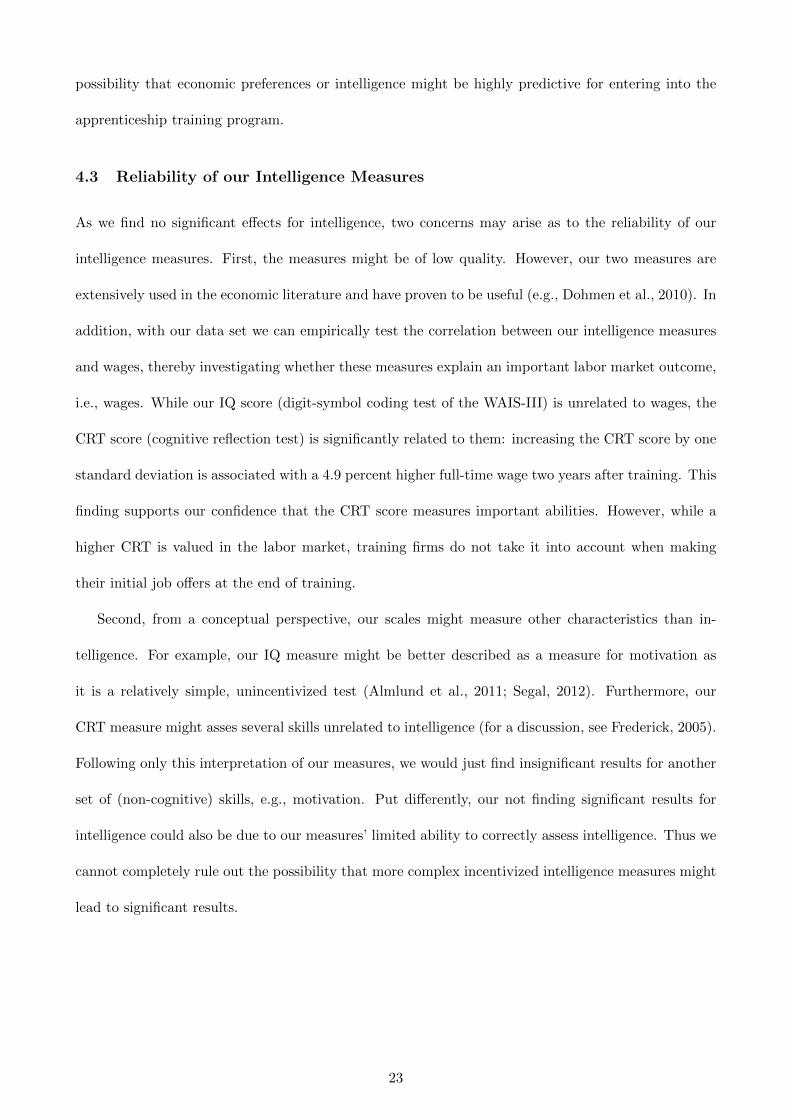
4.3 Reliability of our Intelligence Measures
As we find no significant e↵ects for intelligence, two concerns may arise as to the reliability of our
intelligence measures. First, the measures might be of low quality. However, our two measures are
extensively used in the economic literature and have proven to be useful (e.g., Dohmen et al., 2010). In
addition, with our data set we can empirically test the correlation between our intelligence measures
and wages, thereby investigating whether these measures explain an important labor market outcome,
i.e., wages. While our IQ score (digit-symbol coding test of the WAIS-III) is unrelated to wages, the
CRT score (cognitive reflection test) is significantly related to them: increasing the CRT score by one
standard deviation is associated with a 4.9 percent higher full-time wage two years after training. This
finding supports our confidence that the CRT score measures important abilities. However, while a
higher CRT is valued in the labor market, training firms do not take it into account when making
their initial job o↵ers at the end of training.
Second, from a conceptual perspective, our scales might measure other characteristics than in-
telligence. For example, our IQ measure might be better described as a measure for motivation as
it is a relatively simple, unincentivized test (Almlund et al., 2011; Segal, 2012). Furthermore, our
CRT measure might asses several skills unrelated to intelligence (for a discussion, see Frederick, 2005).
Following only this interpretation of our measures, we would just find insignificant results for another
set of (non-cognitive) skills, e.g., motivation. Put di↵erently, our not finding significant results for
intelligence could also be due to our measures’ limited ability to correctly assess intelligence. Thus we
cannot completely rule out the possibility that more complex incentivized intelligence measures might
lead to significant results.
23

5 Conclusion
We find that trainees’ final grades and non-cognitive skills (Grit and the Big Five) predict job o↵ers
after apprenticeship training. These characteristics develop both before and during training. We show
that the Big Five personality traits are the most important predictor. To show that job o↵ers are a
relevant outcome, we provide evidence for the labor market importance of the o↵ers we investigate:
An o↵er is associated with fewer job search activities at the end of training and a substantially higher
wage two years after training.
However, our results are limited in two ways, both of which provide opportunities for future
research. First, our sample size is small. On the one hand, smaller samples make finding significant
results less likely. Therefore, finding significant e↵ects in a small sample supports the robustness
of our results. On the other hand, our significant results might gain even more credibility when
replicated in larger samples for a larger set of occupations. Moreover, in larger samples, not finding
statistically significant results for certain characteristics is a stronger argument for the minor role of
these characteristics, because missing statistical power is less of a concern. While our small sample
size makes our insignificant results—especially for intelligence—less credible, it makes our significant
results for the final grade, Grit, and Big Five more credible.
Second, our data provides no long-term labor market outcomes. Given the substantial percentage
of part-time workers (38 percent), because many choose further training immediately after the initial
apprenticeship, future research should assess the labor market relevance of the o↵er in the longer term.
Large longitudinal data sets with measures of personal characteristics, job o↵ers, and wages would be
necessary for overcoming the limitations of this paper.
By showing that firms use primarily non-cognitive skills when making job o↵ers after training,
our results have implications for the literature on young workers. By describing the process of hiring
decisions after apprenticeship training, we show that hiring after training is non-random (Gibbons &
Katz, 1991) and that it is indeed best explained by di↵erences in non-cognitive skills. In this regard, the
results of our study show that accounting for the non-randomness of hiring is crucial when identifying
the causal e↵ect on wages of moving versus staying (e.g., von Wachter & Bender, 2006). However,
24

we show that the worrisome selection is based on non-cognitive skills, not on cognitive ability, in line
with recent research emphasizing the importance of skills other than cognitive ability (e.g., Deming,
2016; Heckman & Kautz, 2012).
Our results have implications for both firms and policy makers. We show that firms base their
job o↵ers after apprenticeship training primarily on hard-to-observe non-cognitive skills. One way in
which firms take this phenomenon into account is by extensively o↵ering specific programs to entry-
level workers, programs that allow them to screen these workers (e.g., internships, traineeships, or
apprenticeships). Using these programs, firms screen primarily for non-cognitive skills. As another
way of learning about applicants’ non-cognitive skills, firms could also simply use personality tests
with scales similar to those we use in this study. However, faking personality tests is very easy, and
one always needs to consider test-takers’ incentives when interpreting such test results (for a general
discussion, see Almlund et al., 2011). Job applicants in particular frequently fake personality tests
and—with individual di↵erences in the tendency to fake such tests—this behavior heavily a↵ects hiring
decisions based on such tests (Rosse, Stecher, Miller, & Levin, 1998). In sum, our results show the
importance of non-cognitive skills for firms’ hiring decisions and—as personality tests are no convincing
alternative—of extensive screening periods for learning about these hard-to-observe skills.
For policy makers, our study provides a guideline for the preparation of young people for the labor
market. Indeed, once young people have attained a certain level of education, such e↵orts should
focus on programs targeting the formation of non-cognitive skills. Moreover, policy makers may
facilitate training programs that include substantial screening periods, thereby allowing individuals to
communicate their valuable non-cognitive skills to potential employers.
25

References
Acemoglu, D., & Pischke, J.-S. (1998). Why Do Firms Train? Theory and Evidence. Quarterly
Journal of Economics , 113 (1), 79–119.
Acemoglu, D., & Pischke, J.-S. (1999). Beyond Becker: Training in Imperfect Labour Markets.
Economic Journal , 109 (453), 112–142.
Almlund, M., Duckworth, A. L., Heckman, J. J., & Kautz, T. (2011). Personality Psychology and
Economics. In E. A. Hanushek, S. J. Machin, & L. Woessmann (Eds.), Handbook of the economics
of education (pp. 1–181). Amsterdam: Elsevier.
Altonji, J. G., & Pierret, C. R. (2001). Employer Learning and Statistical Discrimination. Quarterly
Journal of Economics , 116 (1), 313–350.
Andersen, S., Harrison, G. W., Lau, M. I., & Rutstrom, E. E. (2008). Lost in State Space: Are
Preferences Stable? International Economic Review , 49 (3), 1091–1112.
Baert, S., & Decuypere, L. (2014). Better Sexy Than Flexy? A Lab Experiment Assessing the Impact
of Perceived Attractiveness and Personality Traits on Hiring Decisions. Applied Economics
Letters, 21 (9), 597–601.
Becker, A., Deckers, T., Dohmen, T., Falk, A., & Kosse, F. (2012). The Relationship Between
Economic Preferences and Psychological Personality Measures. Annual Review of Economics,
4 (1), 453–478.
Bessey, D. (2010). Educational Investment of Youths: Empirical and Experimental Evidence. Retrieved
from the Catalogue of University Dissertations UZH (No. 006206640): Dissertation University
of Zurich.
Biesma, R. G., Pavlova, M., van Merode, G. G., & Groot, W. (2007). Using Conjoint Analysis
to Estimate Employers Preferences for Key Competencies of Master Level Dutch Graduates
Entering the Public Health Field. Economics of Education Review , 26 (3), 375–386.
Borghans, L., Golsteyn, B. H. H., Heckman, J. J., & Humphries, J. E. (2016). What Grades and
Achievement Tests Measure. Proceedings of the National Academy of Sciences, 113 (47), 13354–
13359.
Branas-Garza, P., Kujal, P., & Lenkei, B. (2015). Cognitive Reflection Test: Whom, How and When.
MPRA Working Paper , 68049 .
Burks, S. V., Lewis, C., Kivi, P. A., Wiener, A., Anderson, J. E., Gotte, L., . . . Rustichini, A.
(2015). Cognitive Skills, Personality, and Economic Preferences in Collegiate Success. Journal
of Economic Behavior & Organization, 115 , 30–44.
CEDEFOP. (2014). Piloting a European Employer Survey on Skill Needs. European Center for the
Development of Vocational Training Research Papers, 36 .
Deming, D. (2016). The Growing Importance of Social Skills in the Labor Market. NBER Working
Paper Series, 21473 .
Deming, D., & Kahn, L. (2017). Skill Requirements Across Firms and Labor Markets: Evidence From
Job Postings for Professionals. NBER Working Paper Series , 23328 .
Dohmen, T., Falk, A., Hu↵man, D., & Sunde, U. (2010). Are Risk Aversion and Impatience Related
26
to Cognitive Ability? American Economic Review , 100 (3), 1238–1260.
Duckworth, A. L., Peterson, C., Matthews, M. D., & Kelly, D. R. (2007). Grit: Perseverance and
Passion for Long-Term Goals. Journal of Personality and Social Psychology , 92 (6), 1087–1101.
Duckworth, A. L., & Quinn, P. D. (2009). Development and Validation of the Short Grit Scale
(Grit-S). Journal of Personality Assessment , 91 (2), 166–174.
Euwals, R., & Winkelmann, R. (2004). Training Intensity and First Labor Market Outcomes of
Apprenticeship Graduates. International Journal of Manpower , 25 (5), 447–462.
Franz, W., & Zimmermann, V. (2002). The Transition From Apprenticeship Training to Work.
International Journal of Manpower , 23 (5), 411–425.
Frederick, S. (2005). Cognitive Reflection and Decision Making. Journal of Economic Perspectives ,
19 (4), 25–42.
FSO. (2016). Newsletter 2/2016. Federal Statistical O�ce.
Gerlitz, J.-Y., & Schupp, J. (2005). Zur Erhebung der Big-Five-Basierten Personlichkeitsmerkmale
im SOEP. DIW Research Notes , 2005-4 .
Gibbons, R., & Katz, L. F. (1991). Layo↵s and Lemons. Journal of Labor Economics, 9 (4), 351–380.
Hamilton, B. H., Papageorge, N. W., & Pande, N. (2014). The Right Stu↵? Personality and En-
trepreneurship. SSRN Working Papers , 2438944 .
Harho↵, D., & Kane, T. J. (1997). Is the German Apprenticeship System a Panacea for the U.S.
Labor Market? Journal of Population Economics, 10 (2), 171–196–196.
Heckman, J. J., & Kautz, T. (2012). Hard Evidence on Soft Skills. Labour Economics , 19 (4), 451–464.
Heckman, J. J., Stixrud, J., & Urzua, S. (2006). The E↵ects of Cognitive and Noncognitive Abilities
on Labor Market Outcomes and Social Behavior. Journal of Labor Economics, 24 (3), 411–482.
Hoeschler, P., Balestra, S., & Backes-Gellner, U. (2018). The Development of Non-Cognitive Skills in
Adolescence. Economics Letters, 163 , 40–45.
Ho↵man, N., & Schwartz, R. (2015). Gold Standard: The Swiss Vocational Education and Training
System. Washington, DC: National Center on Education and the Economy.
Humburg, M., & van der Velden, R. (2015). Skills and the Graduate Recruitment Process: Evidence
From Two Discrete Choice Experiments. Economics of Education Review , 49 , 24–41.
Humphries, J. E., & Kosse, F. (2017). On the Interpretation of Non-Cognitive Skills: What Is Being
Measured and Why It Matters . Journal of Economic Behavior & Organization, 136 , 174–185.
John, O. P., Naumann, L. P., & Soto, C. J. (2008). Paradigm Shift to the Integrative Big Five
Trait Taxonomy. In O. P. John, R. W. Robins, & L. A. Pervin (Eds.), Handbook of personality:
Theory and research (pp. 114–158). New York, NY: Guilford Press.
Kaufman, A. S., & Lichtenberger, E. O. (1998). Intellectual Assessment. In A. S. Bellack & M. Hersen
(Eds.), Comprehensive clinical psychology (pp. 187–238). Oxford: Pergamon.
Lazear, E. P. (1986). Raids and O↵er Matching. Research in Labor Economics, 8 (A), 577–601.
Manning, A. (2011). Imperfect Competition in the Labor Market. In D. Card & O. Ashenfelter (Eds.),
27

Handbook of labor economics (pp. 973–1041). Amsterdam: Elsevier.
Meier, S., & Sprenger, C. D. (2015). Temporal Stability of Time Preferences. Review of Economics
and Statistics, 97 (2), 273–286.
Mohrenweiser, J., Wydra-Somaggio, G., & Zwick, T. (2017). Soft Skills as a Source for Information
Advantages of Training Employers. Swiss Leading House of Economics of Education Working
Paper Series, 121 .
Muehlemann, S., Braendli, R., & Wolter, S. C. (2013). Invest in the Best or Compensate the Weak?
Evidence-based HRM , 1 (1), 80–95.
Muehlemann, S., Pfeifer, H., Walden, G., Wenzelmann, F., & Wolter, S. C. (2010). The Financing of
Apprenticeship Training in the Light of Labor Market Regulations. Labour Economics, 17 (5),
799–809.
Mueller, B., & Schweri, J. (2015). How Specific Is Apprenticeship Training? Evidence From Inter-Firm
and Occupational Mobility After Graduation. Oxford Economic Papers, 67 (4), 1057–1077.
Neal, D., & Rosen, S. (2000). Theories of the Distribution of Earnings. In A. B. Atkinson &
F. Bourguignon (Eds.), Handbook of income distribution (pp. 379–427). Amsterdam: Elsevier.
Oswald, Y., & Backes-Gellner, U. (2014). Learning for a Bonus: How Financial Incentives Interact
with Preferences. Journal of Public Economics, 118 , 52–61.
Protsch, P., & Solga, H. (2015). How Employers Use Signals of Cognitive and Noncognitive Skills at
Labour Market Entry: Insights from Field Experiments. European Sociological Review , 31 (5),
521–532.
Rosse, J. G., Stecher, M. D., Miller, J. L., & Levin, R. A. (1998). The Impact of Response Distortion
on Preemployment Personality Testing and Hiring Decisions. Journal of Applied Psychology ,
83 (4), 634–644.
Schonberg, U. (2007, October). Testing for Asymmetric Employer Learning. Journal of Labor Eco-
nomics, 25 (4), 651–691.
Segal, C. (2012). Working When No One Is Watching: Motivation, Test Scores, and Economic Success.
Management Science, 58 (8), 1438–1457.
SERI. (2014). Vocational and Professional Education and Training in Switzerland. State Secretariat
for Education, Research and Innovation.
SERI. (2017). Evaluation EBA II. State Secretariat for Education, Research and Innovation.
Strupler, M., & Wolter, S. C. (2012). Die duale Lehre: eine Erfolgsgeschichte-auch fur Betriebe.
Zurich: Ruegger Verlag.
Teijeiro, M., Rungo, P., & Freire, M. J. (2013). Graduate Competencies and Employability: the
Impact of Matching Firms’ Needs and Personal Attainments. Economics of Education Review ,
34 , 286–295.
von Aster, M., Neubauer, A., & Horn, R. (2009). Wechsler-Intelligenztest fur Erwachsene. Frankfurt:
Pearson.
von Wachter, T., & Bender, S. (2006). In the Right Place at the Wrong Time: The Role of Firms
and Luck in Young Workers’ Careers. American Economic Review , 96 (5), 1679–1705.
28

Waldman, M. (1990). Up-or-Out Contracts: A Signaling Perspective. Journal of Labor Economics,
8 (2), 230–250.
Wolter, S. C., & Ryan, P. (2011). Apprenticeship. In E. A. Hanushek, S. Machin, & L. Woessmann
(Eds.), Handbook of the economics of education (pp. 521–576). Amsterdam: Elsevier.
29

Appendix
Figures
year
trainingdura,
on
2009
2010
2011
2012
2013
2014
2015
Ini,alsu
rvey:
Richbaselinedata
Reten,
onOffe
rs
(com
mercial)
Appren
,ceshiptraining(com
mercial)
Appren
,ceshiptraining(techn
ical)
Finalsurvey:
Follow-uplabo
rmarketo
utcomes
andchangesinno
n-cogni,vesk
ills
(com
mercial)
Reten,
onOffe
rs
(technical)
Finalsurvey:
Follow-uplabo
rmarketo
utcomes
andchangesin
non-cogni,vesk
ills
(technical)
Figure
A1:
Tim
eStructure
30
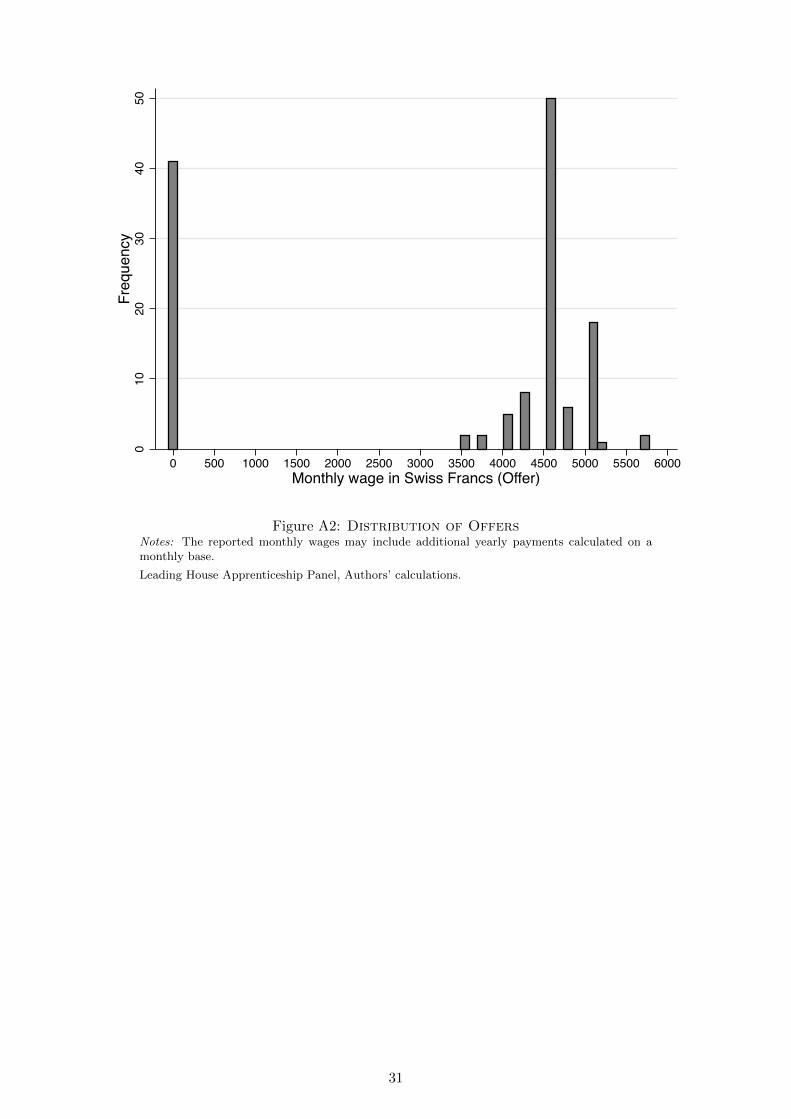
010
2030
4050
Freq
uenc
y
0 500 1000 1500 2000 2500 3000 3500 4000 4500 5000 5500 6000Monthly wage in Swiss Francs (Offer)
Figure A2: Distribution of OffersNotes: The reported monthly wages may include additional yearly payments calculated on amonthly base.
Leading House Apprenticeship Panel, Authors’ calculations.
31
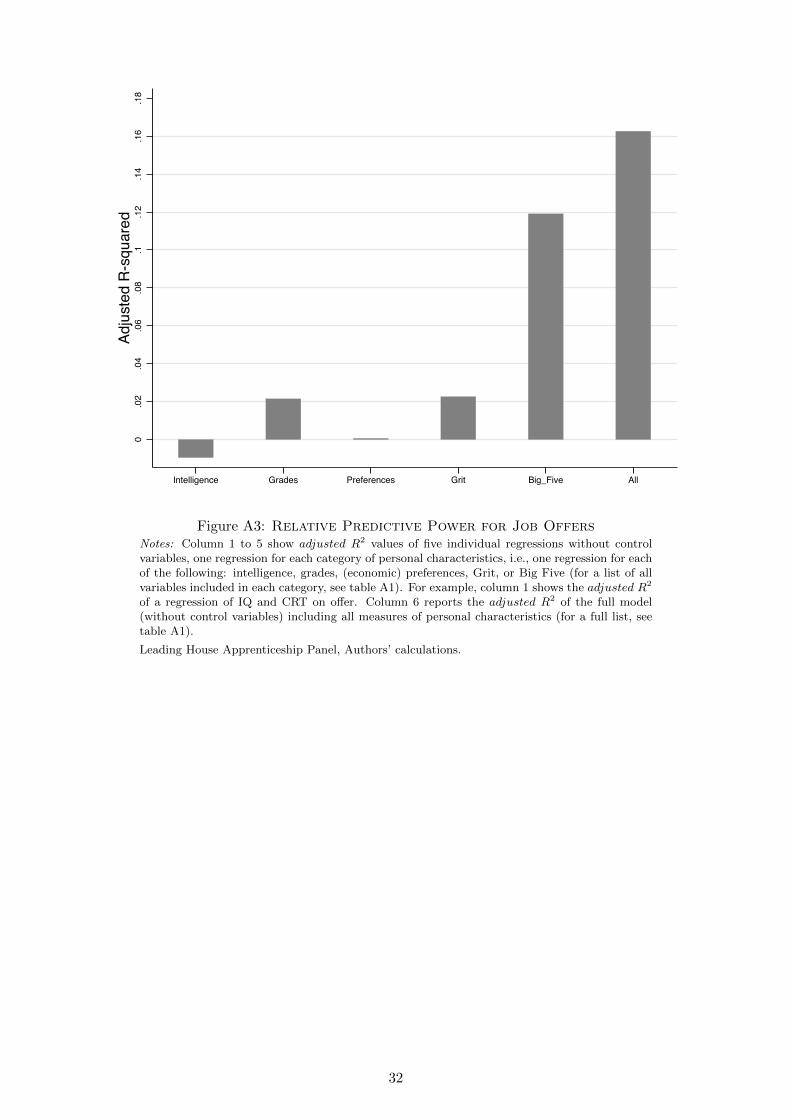
0.0
2.0
4.0
6.0
8.1
.12
.14
.16
.18
Adju
sted
R-s
quar
ed
Intelligence Grades Preferences Grit Big_Five All
Figure A3: Relative Predictive Power for Job OffersNotes: Column 1 to 5 show adjusted R2 values of five individual regressions without controlvariables, one regression for each category of personal characteristics, i.e., one regression for eachof the following: intelligence, grades, (economic) preferences, Grit, or Big Five (for a list of allvariables included in each category, see table A1). For example, column 1 shows the adjusted R2
of a regression of IQ and CRT on o↵er. Column 6 reports the adjusted R2 of the full model(without control variables) including all measures of personal characteristics (for a full list, seetable A1).
Leading House Apprenticeship Panel, Authors’ calculations.
32
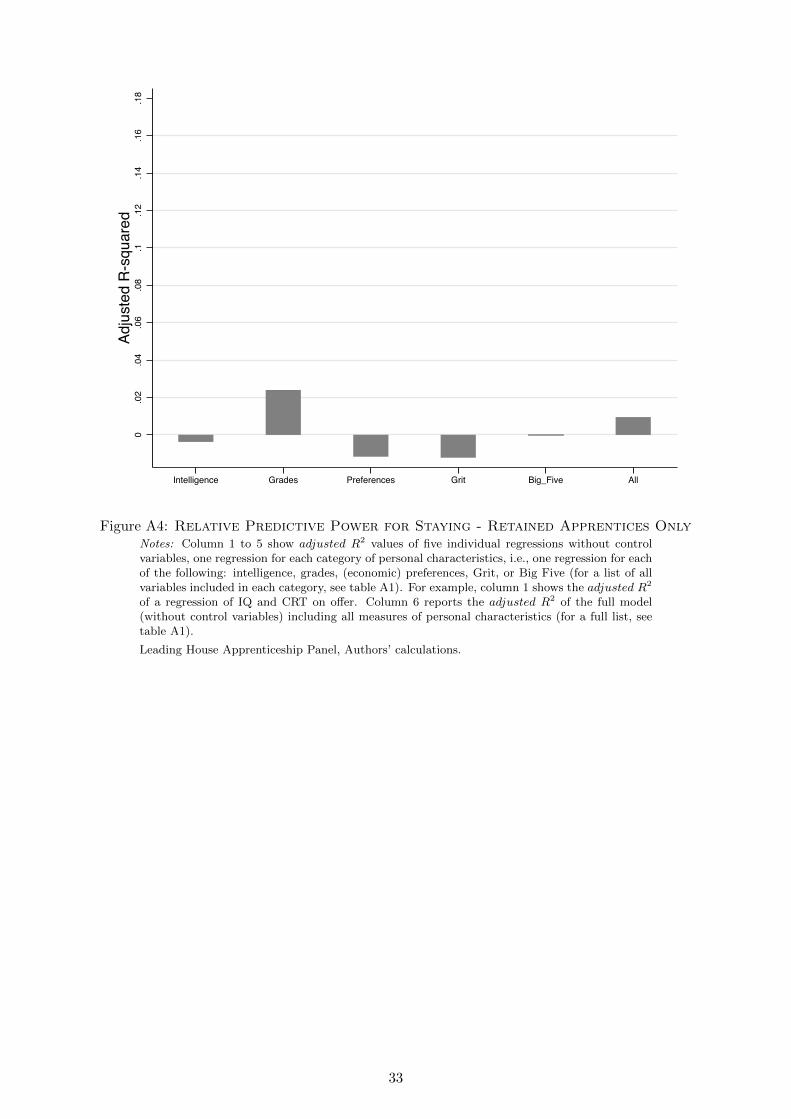
0.0
2.0
4.0
6.0
8.1
.12
.14
.16
.18
Adju
sted
R-s
quar
ed
Intelligence Grades Preferences Grit Big_Five All
Figure A4: Relative Predictive Power for Staying - Retained Apprentices OnlyNotes: Column 1 to 5 show adjusted R2 values of five individual regressions without controlvariables, one regression for each category of personal characteristics, i.e., one regression for eachof the following: intelligence, grades, (economic) preferences, Grit, or Big Five (for a list of allvariables included in each category, see table A1). For example, column 1 shows the adjusted R2
of a regression of IQ and CRT on o↵er. Column 6 reports the adjusted R2 of the full model(without control variables) including all measures of personal characteristics (for a full list, seetable A1).
Leading House Apprenticeship Panel, Authors’ calculations.
33

Tables
Table A1: Summary Statistics of Personal Characteristics
Descriptive Statistics Correlation with O↵er
(1) (2)
mean sd min max coe�cient
Intelligence
IQ 75.326 14.097 14.000 116.000 0.0199
CRT 0.807 0.926 0.000 3.000 0.0716
Grades
Grade Middle School 4.883 0.399 3.667 5.667 -0.0602
Final Grade APT 4.779 0.268 4.200 5.400 0.1588*
Economic Preferences
Willingness to Take Risks 5.881 1.588 1.000 10.000 0.0930
Patience 76.037 20.462 10.000 100.000 0.0771
Grit
Grit Initial 19.222 4.119 9.000 29.000 -0.0467
Grit Delta 1.963 4.821 -11.000 14.000 0.1827**
Big Five
Conscientiousness Initial 11.556 3.173 2.000 18.000 0.1925**
Extraversion Initial 12.430 3.939 0.000 18.000 -0.0303
Agreeableness Initial 8.437 2.323 0.000 12.000 -0.1328
Openness Initial 11.222 3.220 3.000 18.000 -0.1551*
Emotional Stability Initial 8.800 3.568 1.000 18.000 -0.1323
Conscientiousness Delta 1.778 3.409 -7.000 10.000 -0.0906
Extraversion Delta 0.178 3.663 -9.000 10.000 0.1028
Agreeableness Delta 0.785 2.107 -5.000 7.000 0.0782
Openness Delta -0.096 3.498 -11.000 11.000 0.1250
Emotional Stability Delta 1.570 3.686 -8.000 10.000 0.1683*
Notes: N=135. *** p < 0.01, ** p < 0.05, * p < 0.10. IQ is the number of successively correctly matched symbols onthe digit symbol-coding test of the WAIS-III. CRT is the number of correctly answered questions on the cognitivereflection test. The values for economic preferences indicate switching points in choice tables. The grit measure is thesum of eight Likert scale items (0-4). The agreeableness measure is the sum of two Likert scale items (0-6). Each ofthe other Big Five measures is the sum of three Likert scale items (0-6). Emotional stability is calculated as thereverse of neuroticism. The delta for each non-cognitive skill represents the di↵erence between the respective finalvalue and the initial value.
Leading House Apprenticeship Panel, Authors’ calculations.
34
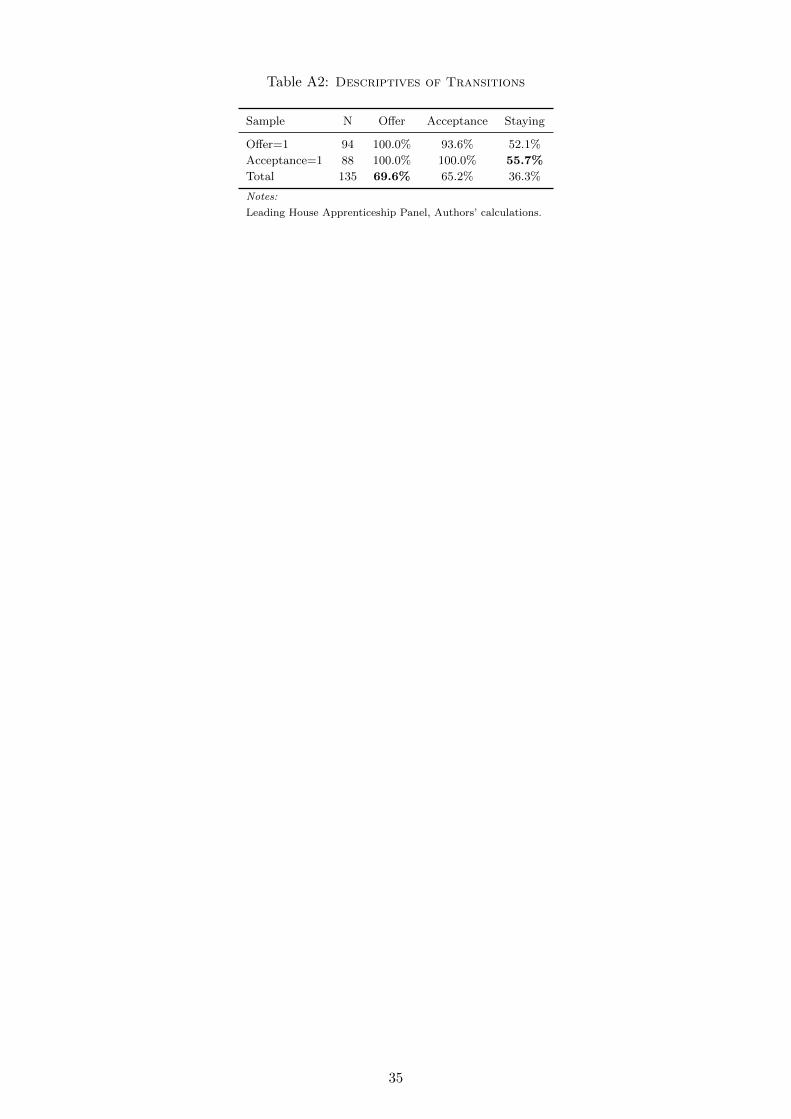
Table A2: Descriptives of Transitions
Sample N O↵er Acceptance Staying
O↵er=1 94 100.0% 93.6% 52.1%
Acceptance=1 88 100.0% 100.0% 55.7%
Total 135 69.6% 65.2% 36.3%
Notes:
Leading House Apprenticeship Panel, Authors’ calculations.
35

Table A3: Job Offers and Personal Characteristics (OLS)
(1) (2) (3) (4) (5)
O↵er O↵er O↵er O↵er O↵er
IQ 0.0404
(0.0451)
CRT 0.0044
(0.0424)
Grade Middle School -0.0382
(0.0355)
Final Grade APT 0.0760*
(0.0437)
Willingness to Take Risks 0.0405
(0.0357)
Patience 0.0474
(0.0411)
Grit Initial 0.0374
(0.0458)
Grit Delta 0.1063**
(0.0477)
Conscientiousness Initial 0.1378**
(0.0535)
Extraversion Initial 0.0418
(0.0516)
Agreeableness Initial -0.1449***
(0.0550)
Openness Initial -0.1193**
(0.0465)
Emotional Stability Initial -0.0996*
(0.0541)
Conscientiousness Delta -0.0068
(0.0511)
Extraversion Delta 0.0393
(0.0470)
Agreeableness Delta -0.0740
(0.0488)
Openness Delta 0.0126
(0.0482)
Emotional Stability Delta 0.0363
(0.0475)
Controls YES YES YES YES YES
F -test Joint 0.6318 0.1666 0.3021 0.0702 0.0002
F -test Joint Initial Values 0.0011
F -test Joint Deltas 0.6097
R-squared 0.055 0.073 0.065 0.087 0.213
N 135 135 135 135 135
Notes: *** p < 0.01, ** p < 0.05, * p < 0.10. Coe�cients are indicated. Robust standard errorsare in parentheses. All personal characteristics are standardized to have mean 0 and standarddeviation 1. Controls include being a native speaker, mother’s education, gender, and age. Listedis the p-value from a F -test for the joint significance of the indicated personal characteristics.
Leading House Apprenticeship Panel, Authors’ calculations.
36
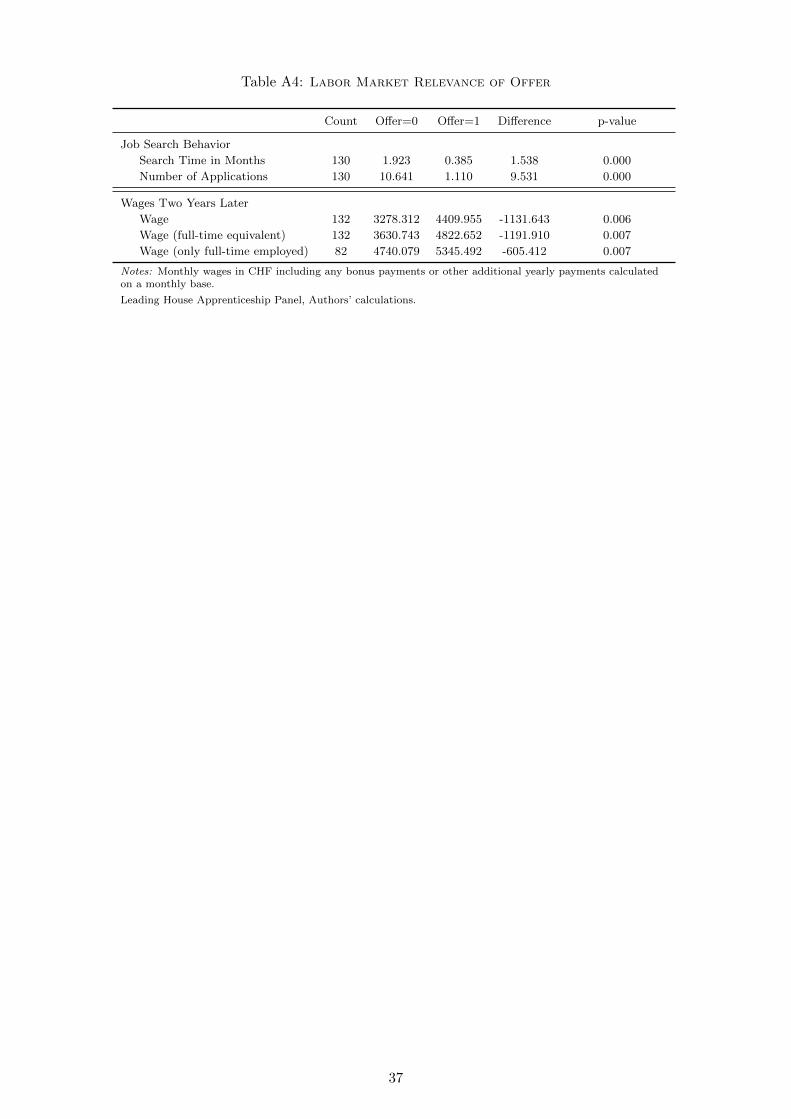
Table A4: Labor Market Relevance of Offer
Count O↵er=0 O↵er=1 Di↵erence p-value
Job Search Behavior
Search Time in Months 130 1.923 0.385 1.538 0.000
Number of Applications 130 10.641 1.110 9.531 0.000
Wages Two Years Later
Wage 132 3278.312 4409.955 -1131.643 0.006
Wage (full-time equivalent) 132 3630.743 4822.652 -1191.910 0.007
Wage (only full-time employed) 82 4740.079 5345.492 -605.412 0.007
Notes: Monthly wages in CHF including any bonus payments or other additional yearly payments calculatedon a monthly base.
Leading House Apprenticeship Panel, Authors’ calculations.
37
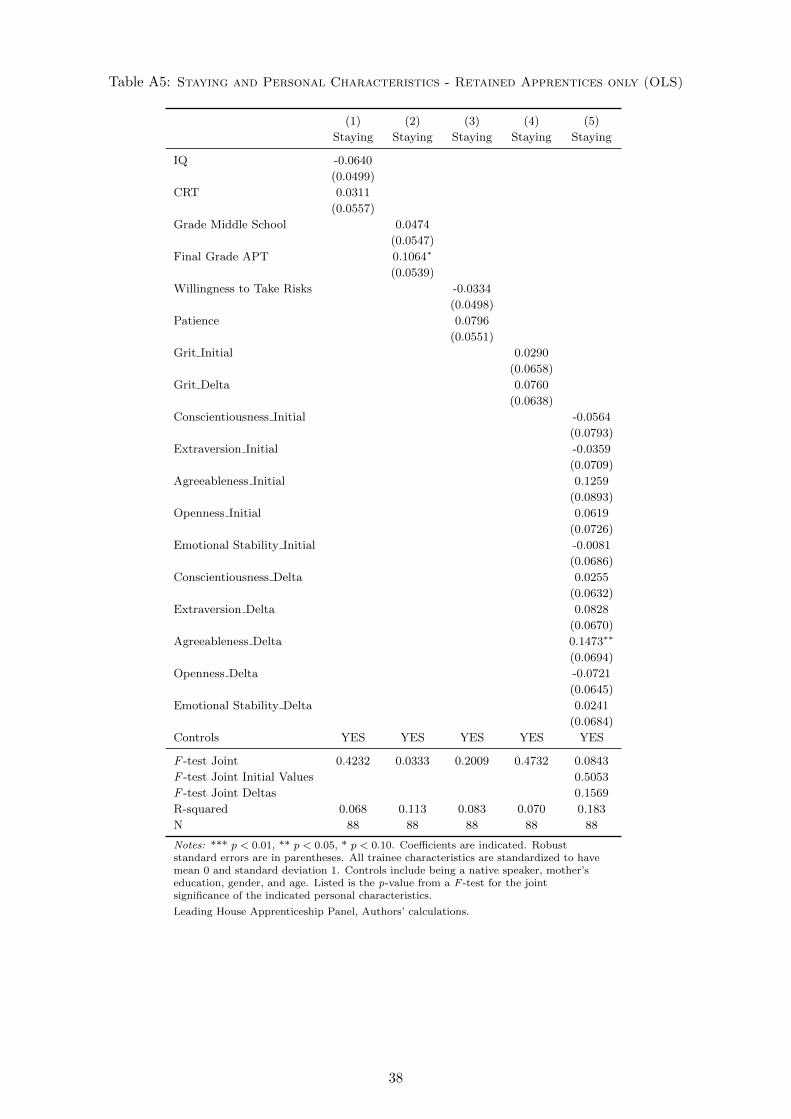
Table A5: Staying and Personal Characteristics - Retained Apprentices only (OLS)
(1) (2) (3) (4) (5)
Staying Staying Staying Staying Staying
IQ -0.0640
(0.0499)
CRT 0.0311
(0.0557)
Grade Middle School 0.0474
(0.0547)
Final Grade APT 0.1064⇤
(0.0539)
Willingness to Take Risks -0.0334
(0.0498)
Patience 0.0796
(0.0551)
Grit Initial 0.0290
(0.0658)
Grit Delta 0.0760
(0.0638)
Conscientiousness Initial -0.0564
(0.0793)
Extraversion Initial -0.0359
(0.0709)
Agreeableness Initial 0.1259
(0.0893)
Openness Initial 0.0619
(0.0726)
Emotional Stability Initial -0.0081
(0.0686)
Conscientiousness Delta 0.0255
(0.0632)
Extraversion Delta 0.0828
(0.0670)
Agreeableness Delta 0.1473⇤⇤
(0.0694)
Openness Delta -0.0721
(0.0645)
Emotional Stability Delta 0.0241
(0.0684)
Controls YES YES YES YES YES
F -test Joint 0.4232 0.0333 0.2009 0.4732 0.0843
F -test Joint Initial Values 0.5053
F -test Joint Deltas 0.1569
R-squared 0.068 0.113 0.083 0.070 0.183
N 88 88 88 88 88
Notes: *** p < 0.01, ** p < 0.05, * p < 0.10. Coe�cients are indicated. Robuststandard errors are in parentheses. All trainee characteristics are standardized to havemean 0 and standard deviation 1. Controls include being a native speaker, mother’seducation, gender, and age. Listed is the p-value from a F -test for the jointsignificance of the indicated personal characteristics.
Leading House Apprenticeship Panel, Authors’ calculations.
38
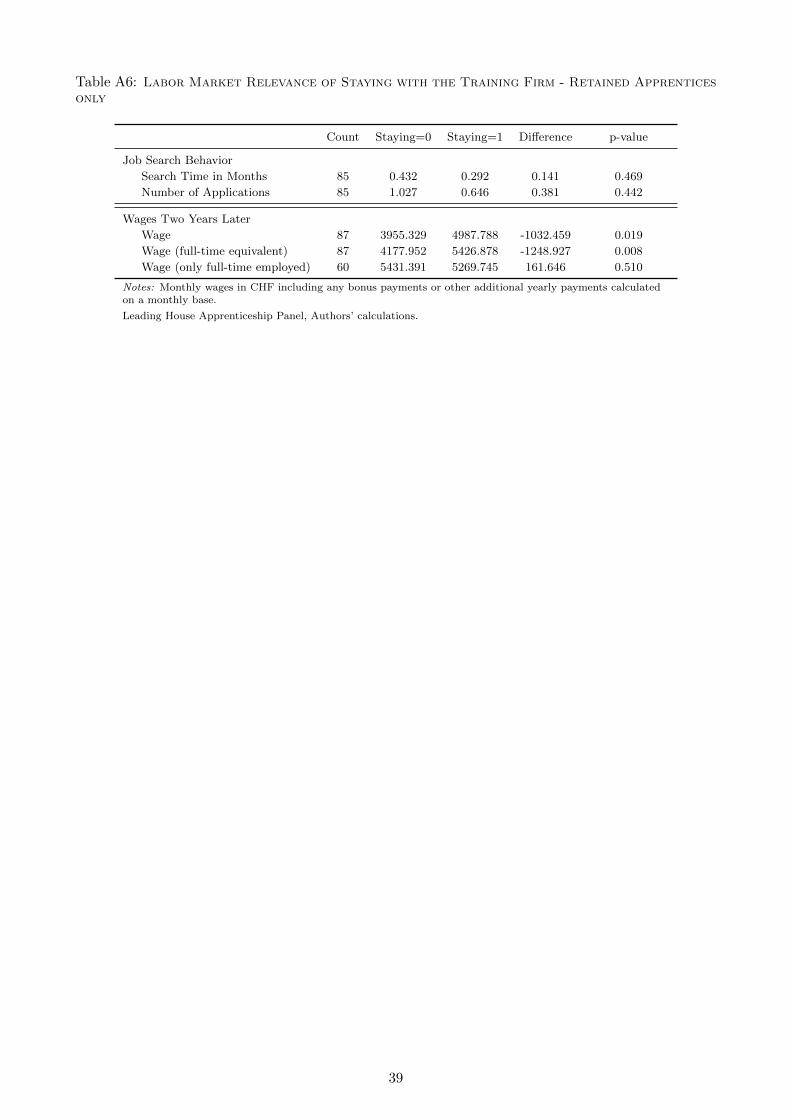
Table A6: Labor Market Relevance of Staying with the Training Firm - Retained Apprenticesonly
Count Staying=0 Staying=1 Di↵erence p-value
Job Search Behavior
Search Time in Months 85 0.432 0.292 0.141 0.469
Number of Applications 85 1.027 0.646 0.381 0.442
Wages Two Years Later
Wage 87 3955.329 4987.788 -1032.459 0.019
Wage (full-time equivalent) 87 4177.952 5426.878 -1248.927 0.008
Wage (only full-time employed) 60 5431.391 5269.745 161.646 0.510
Notes: Monthly wages in CHF including any bonus payments or other additional yearly payments calculatedon a monthly base.
Leading House Apprenticeship Panel, Authors’ calculations.
39
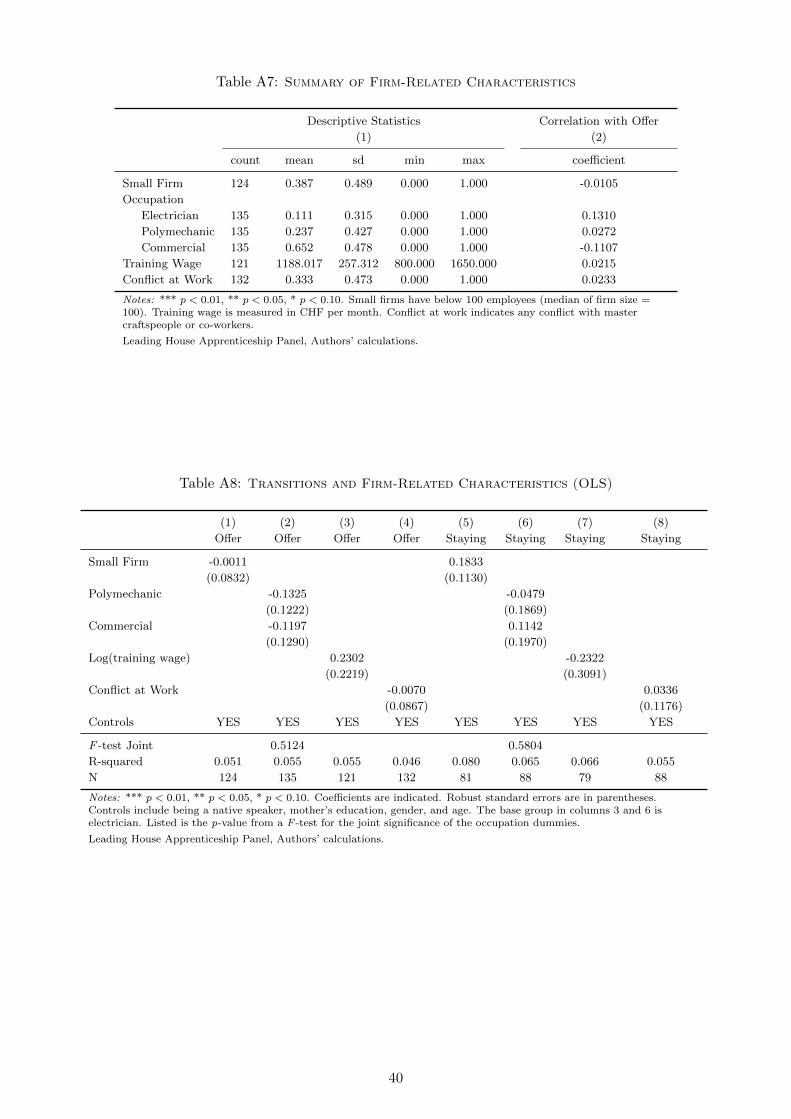
Table A7: Summary of Firm-Related Characteristics
Descriptive Statistics Correlation with O↵er
(1) (2)
count mean sd min max coe�cient
Small Firm 124 0.387 0.489 0.000 1.000 -0.0105
Occupation
Electrician 135 0.111 0.315 0.000 1.000 0.1310
Polymechanic 135 0.237 0.427 0.000 1.000 0.0272
Commercial 135 0.652 0.478 0.000 1.000 -0.1107
Training Wage 121 1188.017 257.312 800.000 1650.000 0.0215
Conflict at Work 132 0.333 0.473 0.000 1.000 0.0233
Notes: *** p < 0.01, ** p < 0.05, * p < 0.10. Small firms have below 100 employees (median of firm size =100). Training wage is measured in CHF per month. Conflict at work indicates any conflict with mastercraftspeople or co-workers.
Leading House Apprenticeship Panel, Authors’ calculations.
Table A8: Transitions and Firm-Related Characteristics (OLS)
(1) (2) (3) (4) (5) (6) (7) (8)
O↵er O↵er O↵er O↵er Staying Staying Staying Staying
Small Firm -0.0011 0.1833
(0.0832) (0.1130)
Polymechanic -0.1325 -0.0479
(0.1222) (0.1869)
Commercial -0.1197 0.1142
(0.1290) (0.1970)
Log(training wage) 0.2302 -0.2322
(0.2219) (0.3091)
Conflict at Work -0.0070 0.0336
(0.0867) (0.1176)
Controls YES YES YES YES YES YES YES YES
F -test Joint 0.5124 0.5804
R-squared 0.051 0.055 0.055 0.046 0.080 0.065 0.066 0.055
N 124 135 121 132 81 88 79 88
Notes: *** p < 0.01, ** p < 0.05, * p < 0.10. Coe�cients are indicated. Robust standard errors are in parentheses.Controls include being a native speaker, mother’s education, gender, and age. The base group in columns 3 and 6 iselectrician. Listed is the p-value from a F -test for the joint significance of the occupation dummies.
Leading House Apprenticeship Panel, Authors’ calculations.
40


