Download - The role of monitoring and engagement Martin Barker Louise de Raad Andy Yule Photo: Getty Gallery

The role of monitoring and engagement
Martin BarkerLouise de RaadAndy Yule
Photo: Getty Gallery

Photos: Free Digital Images
What does disengagement look like?
Photo: Getty Gallery Photo: Getty Gallery
Linking attendance and attrition
Within-course engagement and retention

Signs of struggling:• Poor/uneven academic performance• Poor/uneven attendance
What does disengagement look like?
Photo: Getty Gallery
Why monitor:• Compliance with specific learning outcomes• Lectures increasingly interactive• UK Border Agency Tier 4 monitoring• Positive reinforcement, ‘fair play’• Reveal any trends (e.g. time/day/content)

Case study 1: Level 2 Exp design | stats
Individual attendances
cumulative attendance

C6
C6, C
7
e-m
ail
e-m
ail
___% attendance
1 2 3 4 5 6 7 8 9 10 11 12 13 14 15 16 17 18 19 20 21 22 23 240
10
20
30
40
50
60
70
80
90
100
session
75%
Mean=80%
Case study 1: Level 2 Exp design | stats • long courses
• low stakes (?)• large classes
e-mail prompts when attendance <65%

Case study 2: Level 2 Ocean Biology
attendance taken randomly x 7
C6s issued to 25 studentsalmost all were interviewed:1. 9am lectures2. conflicts with paid
work3. Illness4. boring lectures5. lack of motivation6. personal issues
MyAberdeen ‘early warning system’ also used
is teaching an issue?

Case study 3: Level 3 Animal Pop Ecology • short courses
• high stakesN=121 students• 19 lectures (70% attendance required)• 7 practicals (100% attendance required)
• Missed 3+ lectures (/4) during 1st week: emailed
• Missed practical: submit practical report.
• Missed 6 lectures: emailed warning of C6.
• Failure to to take 1 online test: C6• Failure take 2 online tests: C7
21 students
7 students5 students
78%98%
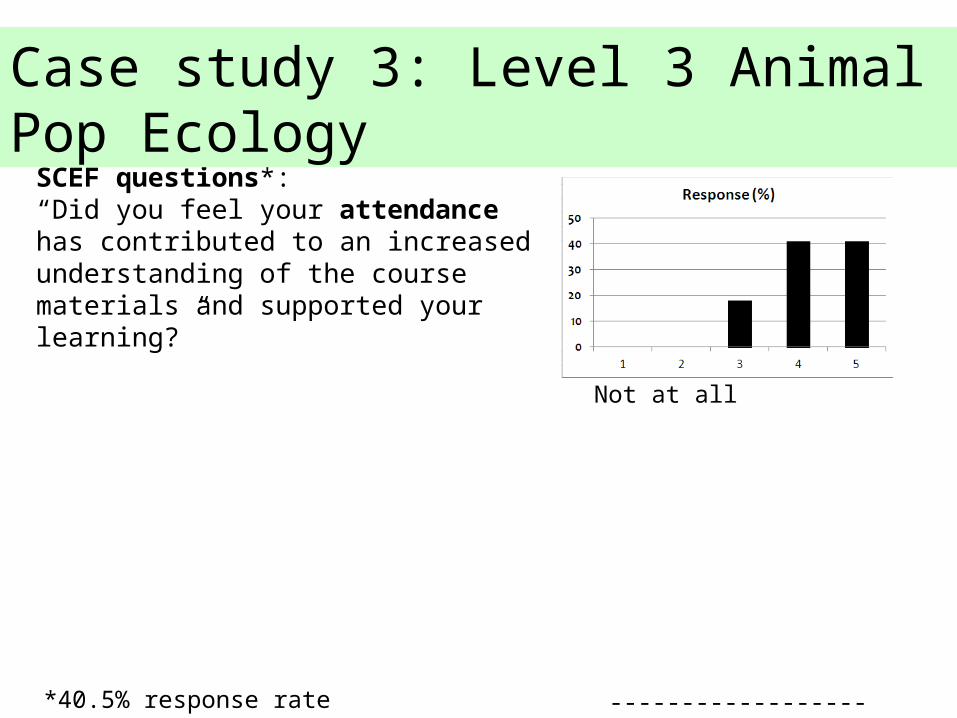
SCEF questions*:“Did you feel your attendance has contributed to an increased understanding of the course materials and supported your learning?”
“During this course, attendance was strictly monitored. Has this contributed to increased attendance at lectures and practicals (i.e, more so than you would have attended without monitoring attendance)?”
*40.5% response rate (n=49 students)
Case study 3: Level 3 Animal Pop Ecology
Not at all ------------------ Totally
Not at all ------------------ Totally

Case study 3: Level 3 Animal Pop Ecology
“It make me feel like somebody actually cared about whether I showed up or not - and noticed me".
“It felt that we were being treated a bit like children”".
Student feedback (SCEFs)
Photo: Getty Gallery

Lower attendance towards the end of the courseA
tten
dan
ce
Lecture number
Pearson correlation = -0.432, p=0.073 (n=18)
Case study 3: Level 3 Animal Pop Ecology

Att
end
ance
Lecture number
Kruskal Wallis test Z= 2.19, p<0.05
Morning lecture attendance (65%, n=8) is significantly lower than afternoon lecture attendance (85%, n= 10)
Lower attendance in the mornings
Case study 3: Level 3 Animal Pop Ecology
Morning
Afternoon

CA
S m
ark
Attendance
Pearson correlation = 0.375, p<0.001 (n=116) – Median mark = CAS 16 (n=116)
Correlation between attendance and coursemark
Case study 3: Level 3 Animal Pop Ecology

Case study 4: Level 3 Marine Ecology
9080706050403020100
18
16
14
12
10
8
6
Percent lecture attendance
CA
S
Significant positive correlation (r = 0.529, df = 53, p <0.001). The quadratic fits quite well but probably infers a levelling off at above 60% attendanceNB the %age attendance is NOT the whole course simply 7 selected lectures

Difficulties with monitoring:• Administration / workload• Need for follow-up; ‘assertive outreach’• Timing, interventions• Resentment?• Impersonation
The role of monitoring and engagement
Photo: Getty Gallery

The role of monitoring and engagementWouldn’t we all like to be known better?
Photo: Getty Gallery

![[Linguistics] - Yule, George - Pragmatics](https://cdn.vdocuments.net/doc/165x107/5531e747550346dd568b4bb0/linguistics-yule-george-pragmatics.jpg)


