
The State of Webber PondUnderstanding the Factors
Affecting Water Quality in the Webber Pond Watershed
Colby Environmental Assessment TeamColby College Biology Dept.
December 5, 2002Vassalboro Town Office
PART 2

Presentation OverviewIntroduction
Water Quality Analysis
Land Use Analysis
- Intermission -
GIS Analysis and Models
Future Predictions
Remediation Measures
Recommendations

Geographic Information Systems Maps and Models of the Webber Pond
Watershed
Lauren Bliss

GIS and Modeling• Geographic Information System (GIS)
- Combines geographic data with thematic attributes
- Creates layers of maps with themes aligned in a common coordinate system (“georeferenced”)
• Modeling
- Representation of reality that helps to predict how natural systems will work
- Simplifies systems by assessing pertinent factors
- Uses ModelBuilder extension

Bathymetry MapImportant for identifying sub-basins and water sampling sites,
computing lake volume, and predicting the occurrence of
organisms in Webber Pond
ModelBuilder
Bathymetry MapPEARL Depth Map
QuickTime™ and aPhoto - JPEG decompressor
are needed to see this picture.

Bathymetry Map
QuickTime™ and aPhoto - JPEG decompressor
are needed to see this picture.
• Webber Pond is primarily shallow
• 61% less than 16 feet deep
• Basin in southern portion
• Deepest point is 41 feet

Soils• Organized into phases and grouped into series
• Classification depends on a number of factors:
• Important to consider soil type when developing in watershed
• Nutrients bind to soil particles and enter lake via runoff
• Erosion factors important

Georeferencing
Aligning Print Maps
Soil Map: An Overview
Digitizing the Print Map
Soil Map

Soil Map Theme Table with Multiple Attribute Fields
K value
- Erosion factor (0.00 to 0.49 for Webber Pond watershed soils)
- Based on a standard size plot tilled and plowed
- Value based on amount of water and sediments in runoff

Soil Map• 31 phases divided into 16 series
• Majority (82.3%) of watershed composed of five soil series
• Septic limitations severe for most Webber Pond watershed soils
• Majority of K values (erosion factor) range from 0.20 to 0.32
QuickTime™ and aPhoto - JPEG decompressor
are needed to see this picture.

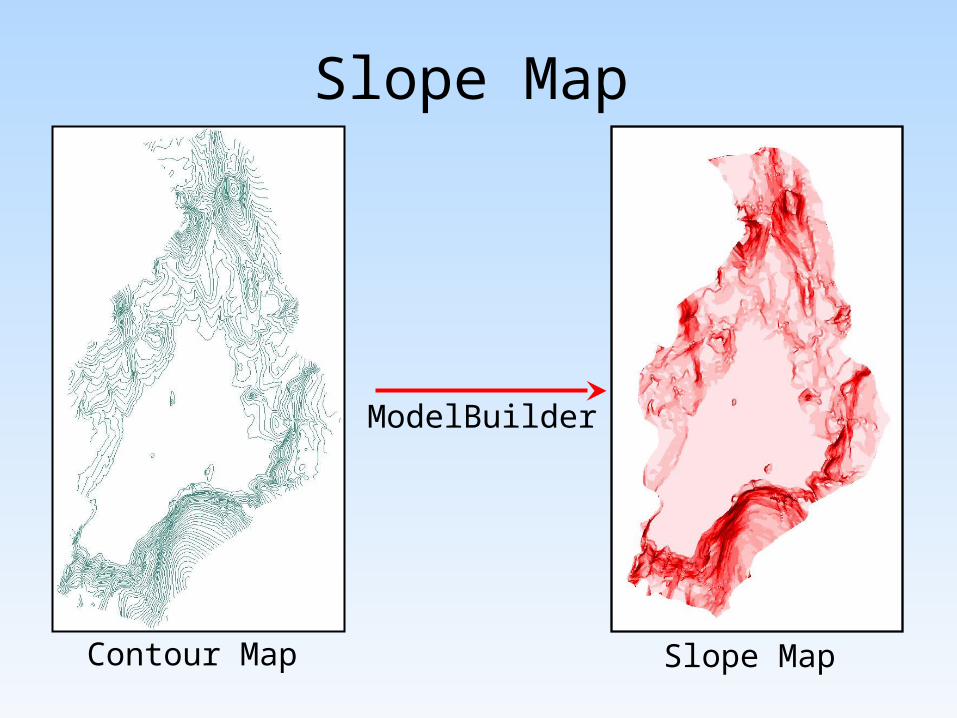
Slope Map
Contour Map
ModelBuilder
Slope Map

Septic Suitability Model
• Open residential land increased from 0.7% of the watershed in 1956 to 7.1% in 1997
• Inadequate septic systems (leach fields) associated with residential or commercial land can contribute to non-point source nutrient loading into Webber Pond
• Beneficial to understand where septic system installment is suitable in the Webber Pond watershed

+
Slope Map Soil Map Septic Suitability
Septic Suitability ModelFactors that influence septic suitability:
Weighted Overlay

Septic Suitability Model
Unsuitable areas• Steep grade
• High septic rank
• Indicated by light purple shading
Highly suitable areas• Gentle slope
• Low septic rank
• Indicated by pale yellow shading
SepticLimitations
SepticRank Slope
SlightModerate
Severe
159
A range from 0-55percent and rankedon a scale from 1 to 9

Septic Suitability Model
• 99% of the watershed is highly unsuitable for septic system development (rank of 4 or above) without prior modifications
• Attributed to steep slopes and soil composition
• Area near Quaker Lane most suitable
• Recommend working with the Kennebec County Soil and Water Conservation Service

GIS, Phosphorus Model, and Future Predictions
Bill McCloy

Erosion Potential Model
Inputs
1. Soil Map
2. Land Use Map
3. Slope Map
Weighted Overlay

Soil Map
• K values represent a soil’s erodibility
• K values were reclassified to range from 1 to 9
• 9 represents the most erodible soil types and 1 represents the least

Land Use MapErosion Risk ValuesMature Forest - 1Wetlands - 1Transitional Forest - 3Reverting Land - 4Pasture - 7Golf Course - 7Cleared Residential Land - 8Cleared Land - 9Crop Land - 9Commercial / Municipal - 9Roads - 9
Slope Map
ModelBuilder
Contour Map Slope Map
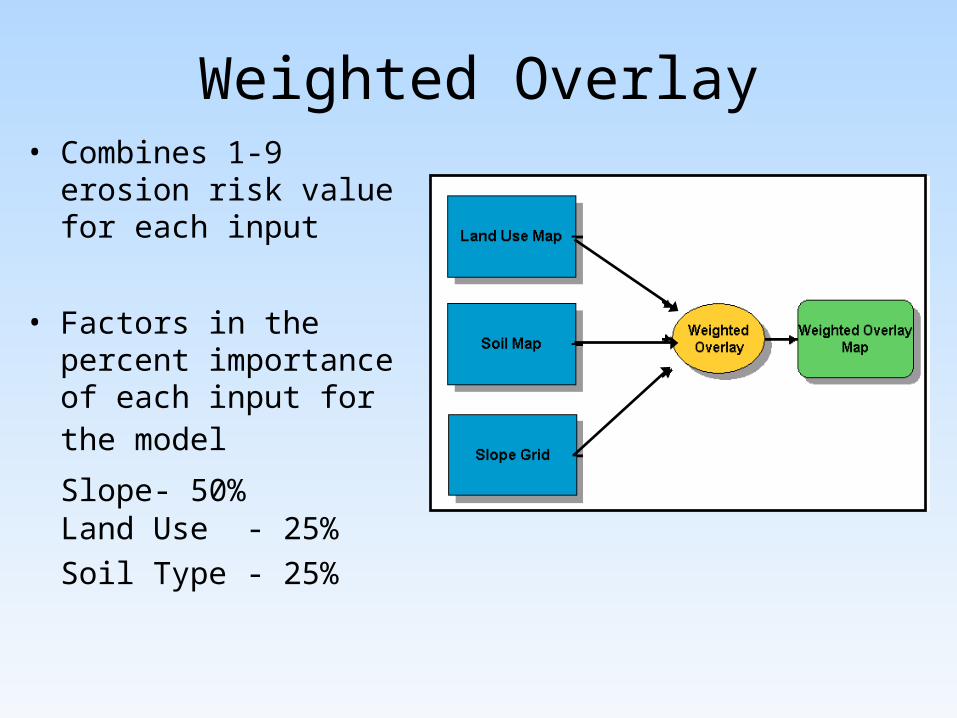
Weighted Overlay• Combines 1-9 erosion risk
value for each input
• Factors in the percent importance of each input for the model
Slope - 50% Land Use - 25%
Soil Type - 25%

Erosion Model Inputs
+ + =

Final Erosion Potential Map
• 93.9% of Webber Pond watershed ranks 5 and below for erosion potential
• Only 6.1% of watershed ranks above 5
• No part of watershed ranks very high

Water Budget
Threemile Pond
Mud Pond
Threecornered Pond
Webber Pond
• A water budget measures a ponds inputs and output of water
• The water budget helps determine the flushing rate for a pond or lake
• The flushing rate is a measure of how many times the pond’s water is replaced per year

Data needed for calculation:1. Evaporation Rates2. Precipitation (10 year average)3. Runoff4. Watershed area5. Pond area6. Average pond depth
Areas calculated using ArcView® GIS
Calculation
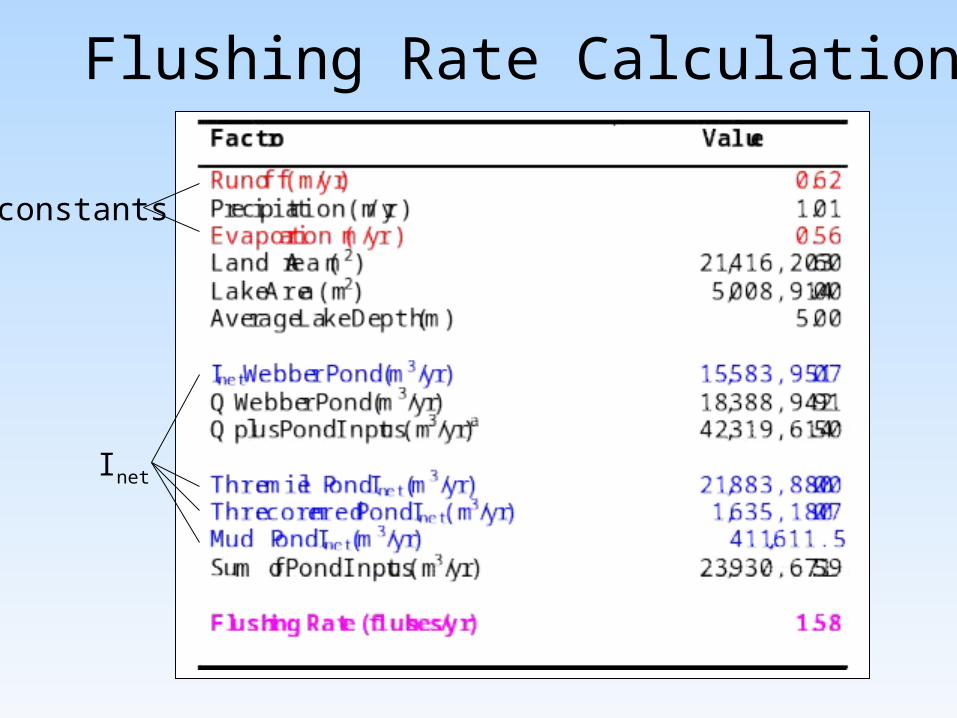
Flushing Rate Calculation
constants
Inet

Phosphorus Loading Model• Predicts total phosphorus concentrations
• Predicts relative phosphorus loading from each input category
• Input categories:1. Land use patterns2. Atmosphere3. Septic systems4. Soil retention potential5. Sediment release
• Used to predict impact of future development in watershed

Creating the Model
• Area of input categories
• Export coefficients
• Surface area of lake
• Annual total water inflow
• Number of capita years
- Lower for seasonal residences
- Higher for year-round residences
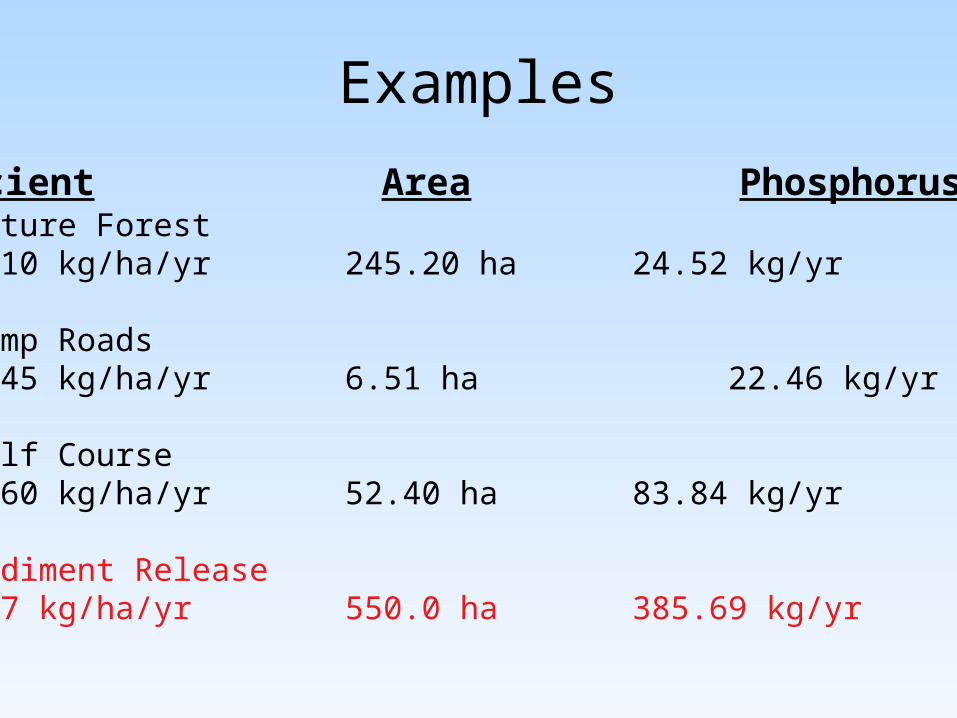
Examples
Mature Forest0.10 kg/ha/yr 245.20 ha 24.52 kg/yr
Camp Roads3.45 kg/ha/yr 6.51 ha 22.46 kg/yr
Golf Course1.60 kg/ha/yr 52.40 ha 83.84 kg/yr
Sediment Release0.7 kg/ha/yr 550.0 ha 385.69 kg/yr
Coefficient Area Phosphorus Loading

Calculated Phosphorus Concentrations
CEAT/MDEP Sampling: 22.97 ppba
Phosphorus Loading Model: 23.35 ppbb
a Mean epicore concentration from Site 1
b Best estimate

Percent Contribution for Different External Loading Categories
3%
3%
7%
6%
4%
1% 6%
12%
10%
10%
28%4%
1%2%3%
Atmospheric Input
Mature Forest
Transitional Forest
Agricultural Land
Wetlands
Cleared Land
Commercial Land
Camp Roads
State/ Town Roads
Golf Course
Reverting Land
Shoreline Development
Non-shoreline Development
Shoreline Septic Systems
Non-shoreline Septic Systems
Institutional

Historical Population Trends and Future Population Predictions
• 1950 - 2000: 1.26% annual pop. growth
• 1990 - 2000: 10% growth in population
• Webber Pond watershed population growing at about same rate as Vassalboro population
• Projected growth: 0.7% annual increase for next 25 years
• Projected 2022 population: 4,698

Future Development Predictions for Webber Pond Watershed
Increased ResidentialDevelopment Scenario
1. Incorporates new shoreline and non-shorelineresidential land
2. Incorporates estimated population in 2022
3. Decrease in agriculture in watershed
No Increase in Residential DevelopmentScenario
1. Incorporates natural forestsuccession
2. No increase in residentialland
3. Decrease in agriculture in watershed

Predicted Land Use Changes with Increase in Residential Land
in 2022
• Mature Forest 602.54 acre increase• Shoreline Residential 10.50 acre increase• Non-Shoreline Residential 212.00 acre increase• Transitional Forest 610.60 acre decrease• Reverting Land 52.19 acre decrease• Agriculture 145.57 acre decrease• Cleared Land 10.00 acre decrease

Phosphorus Loading Model Predictions
Increased Residential Land
• 2002 phosphorus concentration: 23.35 ppb
• 2022 phosphorus concentration estimate: 23.52 ppb
• 0.17 ppb increase
No Increase in Residential Land
• 2002 phosphorus concentration: 23.35 ppb
• 2022 phosphorus concentration estimate: 22.82 ppb
• 0.53 ppb decrease
• Very small changes due to high level of internal phosphorus release, and also phosphorus input from Threemile Pond

Remediation Techniques and Recommendations
Melanie Newton
Remediation
Problem- Reducing phosphorus loadingDirect Control - Decreasing amount of phosphorus that
enters the watershed• Point source diversion• Erosion control
Nutrient Control - Reducing sediment release of phosphorus• Water Drawdown• Phosphorus inactivation• Hypolimnetic withdrawal

Point Source Diversion
Diverting tributaries or point sources high in nutrients
Seaward Mills Brook Tributary from Threemile Pond

Nutrient Interception
• Erosion carries sediment, nutrients, pesticides, and pathogens into the watershed
• Methods to control erosion:
• Maintenance of roads
• Control of shoreline erosion
• Construction of vegetated buffers
• Agriculture BMPs

Ideal Road
• Constructed of proper
materials
• Graded and Crowned
• Diversions, turnouts,
buffers, and ditches

Road Surface• Larger gravel for base, finer gravel on top• A crown should be 1/4 inch high for each foot of road
width• Grading uses a steel blade to level the soil material on the
road’s surface.• Grading should be done often and crowning should be
done annually
QuickTime™ and aPhoto - JPEG decompressor
are needed to see this picture.

Ditches
• Flat bottom and surface
• Gradually graded sides
• Trapezoidal or parabolic in
cross-section
• Stone-lined or vegetated
• Sufficiently wide and deep

Culverts
• Convey water under road surface• Discharge water into ditch or vegetated buffer area• Should be adequately sized and have a 2% slope• At least a foot of soil covering
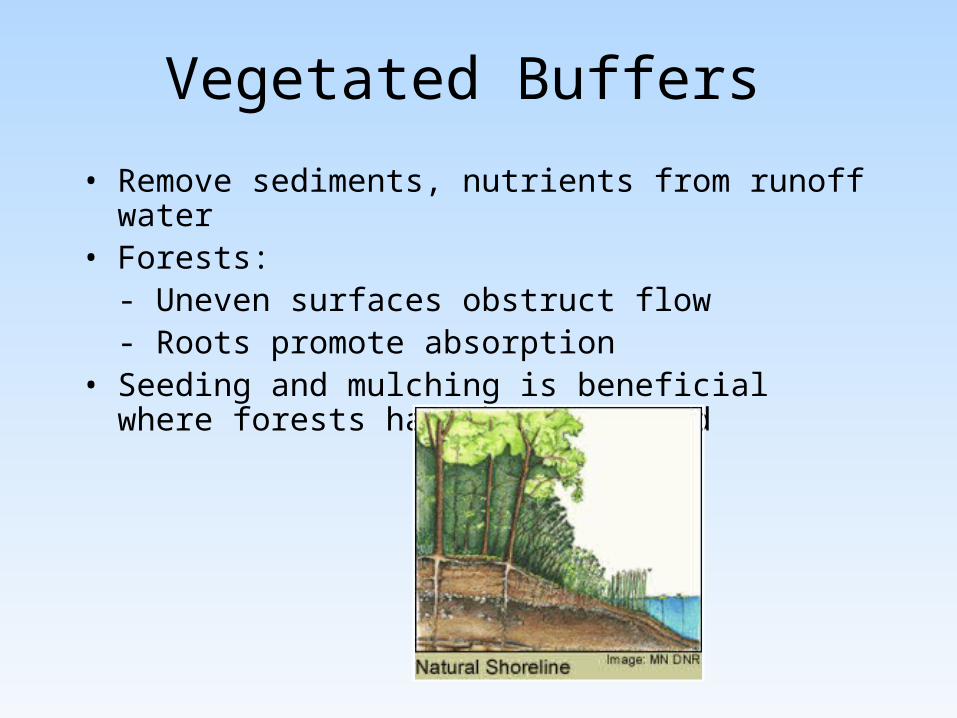
Vegetated Buffers
• Remove sediments, nutrients from runoff water• Forests:
- Uneven surfaces obstruct flow- Roots promote absorption
• Seeding and mulching is beneficial where forests have been removed

Shoreline Erosion
• 914 m (6%) are high risk
shoreline
• Several residents have
taken action by constructing
• Concrete walls
• Log crib
• Riprap
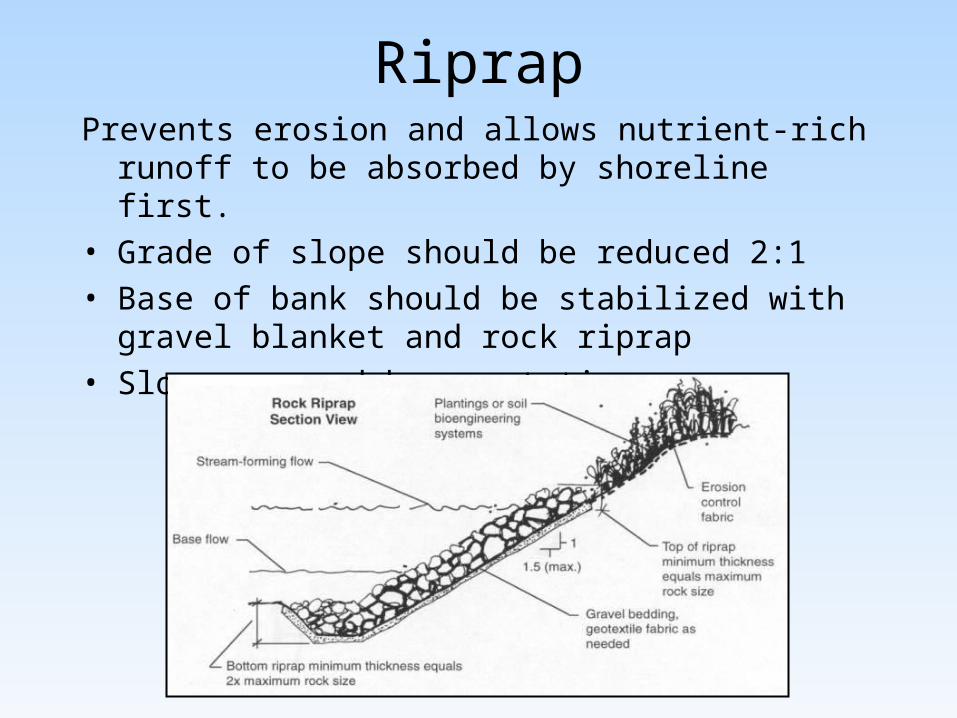
RiprapPrevents erosion and allows nutrient-rich runoff to be
absorbed by shoreline first.
• Grade of slope should be reduced 2:1
• Base of bank should be stabilized with gravel blanket and rock riprap
• Slope covered by vegetation
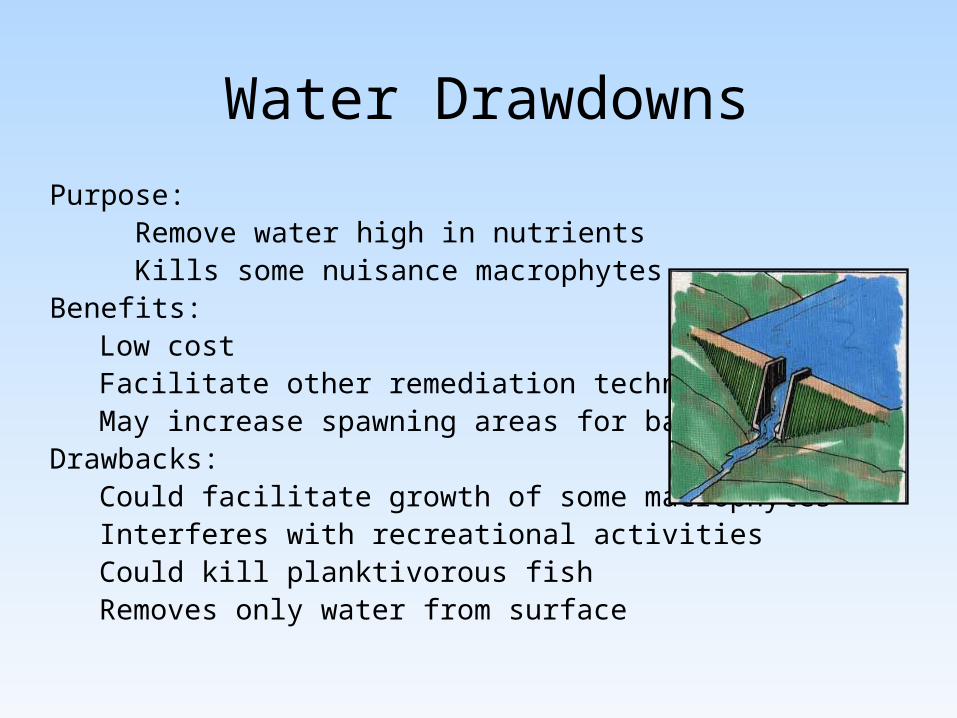
Water Drawdowns
Purpose:Remove water high in nutrientsKills some nuisance macrophytes
Benefits:Low costFacilitate other remediation techniquesMay increase spawning areas for bass
Drawbacks:Could facilitate growth of some macrophytesInterferes with recreational activitiesCould kill planktivorous fishRemoves only water from surface

DEP Drawdown Management Plan
Presented in 1991 to Webber Pond Association
• Water Quality Manager, Dam ManagerWater Level Coordinator
• Bi-weekly transparency readings• Algal bloom before July, no drawdown• Algal bloom late August, drawdown
as soon as possible• Drawdown 1.5 ft. below spillway by
Labor Day• Drawdown no later then September 3rd

CompromiseResidents
Recreational use of Webber PondSwimming, Boating, Fishing, until Labor Day
Natanis Golf CourseDraws water from Webber Pond to
maintain holes
Best Biological PracticeDrawdown occur as soon as possible after algal
bloom, when nutrient levels are highest

Phosphorus Inactivation Process
• Al2(SO4)3 and sodium aluminate added to water, bind with phosphorus forming AlPO4
• Falls as floc onto sediment
• Aluminum best in anaerobic conditions
• pH must be between 6-8. pH below 6 forms toxic Al(III)

Phosphorus Inactivation as Remediation
PurposeTo reduce internal phosphorus
BenefitsVery effectivelong-term benefits
DrawbacksCostly. Estimates for Webber Pond
from $180,000-$890,000Potentially toxicIncrease in macrophyte growth

Hypolimnetic Withdrawal
Purpose
To remove nutrient-rich, deoxygenated
water from hypolimnion
Benefits
Cheap
Effective reduce from
200 mg/L to 91 mg/L
Drawbacks
Where will water go?
Pipes for hypolimnetic withdrawal

Possible Collaboration with Natanis Golf Course
• Golf Course uses approximately 1 million gallons of water from Webber Pond each year
• If golf course could extend pipe deeper than 6 m into hypolimnion, it could drain nutrient-rich water
• Golf course could use this in irrigation and possible fertilization
• Remove nutrients from Webber Pond

Recommendations
The primary problem at Webber Pond is cultural eutrophication
• Nutrient run-off from agriculture, roads, residential, and commercial land uses
• Historical cultural eutrophication created the problem in high internal phosphorus recycling levels
• Remediation must address both of these issues

Monitoring Suggestions
• Bi-weekly transparency readings from May through August
• Test surface and epicore samples for phosphorus yearlyDEP Site (Site 1)Green Valley Campground (Site 6), Natanis Golf Course (Site 9),Dam (Site 10).
• Transparency and Dissolved Oxygen profile at Site 1 monthly May-September

Regulatory Measures
AgricultureIncrease use of BMPs in agricultureBetter monitoring of these farms
ForestryRestrict future timber harvestingIf harvesting occurs follow a BMP
RoadsConduct road surveys frequently to identify trouble spotsRepair Trouble Spots

Residential Measures• Encourage addition and enhancement of vegetated buffers
and riprap
• Encourage road improvements and maintenance by residents
• Limit use of lawn fertilizers
• Reduce shoreline alteration

Nutrient Control Measures• Continue the yearly drawdown, investigate the possibility
of drawing water down from hypolimnion not just surface
• Investigate the possibility of using nutrient-rich hypolimnetic water in irrigating the Natanis golf course
• Investigate the possibility of phosphorus inactivation

Educational Measures• Encourage the availability of this report to the general
public
• Work closely with the China Region Lake Alliance
• Develop and distribute pamphlets to homeowners (road repair, riprap, vegetated buffers, detergents, and water level drawdown)
• Involve local schools in monitoring Webber Pond
AcknowledgementsPeter Abello Kelly KarterRoy Bouchard Jim LucasBob & Julie Brown Kevin MichaudRussell Cole Judy MoodyGene Field Peter MosierDale Finesth Rebecca MantheyDavid Firmage Edward NoelBetsy Fitzgerald Frank RichardsNate Gray Bruce RuegerDavid Halliwell Dan Tierney
Vassalboro Town Office StaffMaine Department of Environmental Protection Staff
Maine Department of Inland Fisheries and Wildlife StaffMaine Soil and Water Conservation Staff
Green Valley Campground

Questions


