RESEARCH ARTICLE
The trisaccharide melezitose impacts honey
bees and their intestinal microbiota
Victoria Charlotte SeeburgerID1,2*, Paul D’Alvise2, Basel Shaaban3, Karsten Schweikert4,
Gertrud LohausID3, Annette Schroeder1, Martin HasselmannID
2
1 Apicultural State Institute, University of Hohenheim, Stuttgart, Baden-Wuerttemberg, Germany,
2 Department of Livestock Population Genomics, University of Hohenheim, Stuttgart, Baden-Wuerttemberg,
Germany, 3 Molecular Plant Science/ Plant Biochemistry, University of Wuppertal, Wuppertal, Nordrhein-
Westfalen, Germany, 4 Core Facility Hohenheim and Institute of Economics, University of Hohenheim,
Stuttgart, Baden-Wuerttemberg, Germany
Abstract
In general, honey bees (Apis mellifera L.) feed on honey produced from collected nectar. In
the absence of nectar, during certain times of the year or in monocultural landscapes, honey
bees forage on honeydew. Honeydew is excreted by different herbivores of the order Hemi-
ptera that consume phloem sap of plant species. In comparison to nectar, honeydew is com-
posed of a higher variety of sugars and additional sugars with higher molecular weight, like
the trisaccharide melezitose that can be a major constituent of honeydew. However, melezi-
tose-containing honey is known to cause malnutrition in overwintering honey bees. Follow-
ing the hypothesis that melezitose may be the cause for the so called ‘honeydew flow
disease’, three independent feeding experiments with caged bees were conducted in conse-
cutive years. Bees fed with melezitose showed increased food uptake, higher gut weights
and elevated mortality compared to bees fed a control diet. Moreover, severe disease symp-
toms, such as swollen abdomen, abdomen tipping and impaired movement were observed
in melezitose-fed bees. 16S-amplicon sequencing indicated that the melezitose diet
changed the species composition of the lactic acid bacteria community within the gut micro-
biota. Based on these results, we conclude that melezitose cannot be easily digested by the
host and may accumulate in the hindgut. Within cages or during winter, when there is no
opportunity for excretion, the accumulated melezitose can cause severe intestinal symp-
toms and death of the bees, probably as result of poor melezitose metabolism capabilities in
the intestinal microbiota. These findings confirm the causal relation between the trisaccha-
ride melezitose and the honeydew flow disease and indicate a possible mechanism of
pathogenesis.
Introduction
‘Honeydew flow disease’ is a common problem for managed honey bee colonies. The disease
occurs, when honey bees feed on honeydew honey, especially during winter [1,2]. The clinical
PLOS ONE
PLOS ONE | https://doi.org/10.1371/journal.pone.0230871 April 10, 2020 1 / 19
a1111111111
a1111111111
a1111111111
a1111111111
a1111111111
OPEN ACCESS
Citation: Seeburger VC, D’Alvise P, Shaaban B,
Schweikert K, Lohaus G, Schroeder A, et al. (2020)
The trisaccharide melezitose impacts honey bees
and their intestinal microbiota. PLoS ONE 15(4):
e0230871. https://doi.org/10.1371/journal.
pone.0230871
Editor: Olav Rueppell, University of North Carolina
at Greensboro, UNITED STATES
Received: December 13, 2019
Accepted: March 10, 2020
Published: April 10, 2020
Peer Review History: PLOS recognizes the
benefits of transparency in the peer review
process; therefore, we enable the publication of
all of the content of peer review and author
responses alongside final, published articles. The
editorial history of this article is available here:
https://doi.org/10.1371/journal.pone.0230871
Copyright: © 2020 Seeburger et al. This is an open
access article distributed under the terms of the
Creative Commons Attribution License, which
permits unrestricted use, distribution, and
reproduction in any medium, provided the original
author and source are credited.
Data Availability Statement: The 16S amplicon
sequence data generated during the current study
are available from Dryad using the doi: https://doi.
org/10.5061/dryad.3ffbg79f8.
symptoms of this food toxicosis are diverse: a high number of bees remain at the hive entrance
instead of foraging, bees experience massive loss of hair (which may indicate complication
with virus infections) and changes their behavioural patterns [3]. Even necrotic appearances
could be shown in the midgut of honey bees when fed with honeydew honey in tent experi-
ments [3]. This condition can deteriorate to a point where colonies collapse within short time.
This is known to beekeepers and discussed in beekeeping journals [4], but the precise reason
has remained unknown.
Honey bees primarily forage on nectar. The three most common nectar sugars are the two
monosaccharides glucose and fructose, and the disaccharide sucrose [5]. However, seasonally
or locally nectar plants are lacking, and nectar is not available. In such situations honey bees
tend to forage on honeydew, which is not produced from nectaries, but by herbivores of the
order Hemiptera as waste product from phloem sap of plant species [1]. In addition to the nec-
tar sugars, honeydew contains more disaccharides such as maltose and melibiose, and trisac-
charides such as erlose and melezitose [6]. These sugars are produced from aphids with α-
glucosidase/transglucosidase [7].
Honey bees process nectar into blossom honey and honeydew into honeydew honey. In
comparison to blossom honey, the mineral content (aluminium, boron, copper, magnesium,
manganese, nickel and zinc) of honeydew honeys is up to four times higher [8,9]. Moreover,
honeydew honey contains more oligosaccharides than blossom honey [10]. Oligosaccharides
are known to be poorly assimilated by honey bees and lead to increased losses of winter colo-
nies fed on honeydew honey [11]. In earlier literature, the reason for these losses were dis-
cussed, and it has been assumed that this specific kind of honey impacts wintering colonies
because of anatomical effects on the bee gut, microbial changes or restricted assimilation of
nutrients, which leads to a higher mortality rate [11]. Following the hypothesis that the
increased mineral contents of honeydew honeys could be the reason for the honeydew flow
disease, feeding experiments with sugar solutions of different mineral contents were con-
ducted [3]. However, the typical honeydew flow disease symptoms could not be produced,
even though physiological damages in the midgut of bees fed with sugar solutions with higher
mineral content occurred [3]. Despite these arising concerns about honeydew and the pro-
cessed honey, the exact reason for this honeydew flow disease symptoms are not identified yet.
In the present study we followed the hypothesis that honeydew flow disease could be caused
by the trisaccharide melezitose. Melezitose is the primary trisaccharide in honeydew, especially
in the more common honeydew of aphids that live on spruces, where it can constitute up to
70% of the sugar fraction [6]. This trisaccharide is composed of two glucose and one fructose
molecules [7]. It is not clear whether honey bees can digest melezitose; other hymenopteran
species are known to have the ability to process melezitose. Many studies discuss the prefer-
ence of ants for melezitose [12–17] and their capability for digesting melezitose is established
[18]. Before it can pass the intestinal epithelium, melezitose has to be metabolised to hexose
units by specific enzymes. The link between a fructose and a glucose unit can be broken down
by invertase [18], which is commonly present in the lumen of the ant gut [19]. Also under lab-
oratory conditions, it was observed that invertase can break down melezitose [20]. Invertase
can be detected in varying concentrations in honey bees. The concentration of invertase
increases with the age of the bees in summer bees and is constantly present in winter bees in
high concentration [21]. Since honey bees are also known to possess invertase [21,22], it is pos-
sible, that they are capable of breaking down melezitose in the same way as ants. In experi-
ments in which sucrose, maltose, melezitose and trehalose were fed to honey bees, their
melezitose metabolites glucose and fructose appeared in the haemolymph. However, melezi-
tose did also appear in the haemolymph as unmetabolised molecule, while sucrose and maltose
were metabolised to a greater extent [23]. Caged bees prefer sucrose over all other sugars,
PLOS ONE Melezitose impacts honey bee health
PLOS ONE | https://doi.org/10.1371/journal.pone.0230871 April 10, 2020 2 / 19
Funding: The project is supported by funds of the
Federal Ministry of Food and Agriculture (BMEL)
based on the decision of the Parliament of the
Federal Republic of Germany via the Federal Office
for Agriculture and Food (BLE) under the
innovation support program to A.S. (2816500114)
and G.L. (2816500214). The funders had no role in
study design, data collection and analysis, decision
to publish, or preparation of the manuscript. No
additional external funding was received for this
study. https://www.bmel.de/EN/Homepage/
homepage_node.html https://www.ble.de/EN/
Home/home_node.html.
Competing interests: The authors have declared
that no competing interests exist.

namely: arabinose, xylose, fructose, glucose, galactose, mannose, lactose, maltose, melibiose,
trehalose, raffinose and melezitose [24].
Further knowledge on possible dietary and health effects can be gained by characterising
the intestinal microbiota, which consists of only few species in honey bees [25–31]. Since
mono- and oligosaccharides constitute the main energy source for honey bees [24,32], compo-
nents of sugar uptake systems, such as phosphotransferase system family genes, are enriched
in their gut microbiota [28]. Genes for sugar transport and carbohydrate breakdown are
enriched specifically in the microbial species Gilliamella apicola, Bifidobacterium spp., and the
Lactobacillus species clusters Firm-4 and Firm-5 [27,28,33]. Especially the carbohydrate-
degrading enzymes found in Gilliamella apicola, Lactobacillus Firm-4, Lactobacillus Firm-5
and Bifidobacterium spp. are beneficial for breaking down nectar sugars to use them as energy
sources [27]. The bacteria digest carbohydrates and produce short-chain fatty acids as fermen-
tation products. Honey bees can utilise both the sugars and their fermentation products for
energy metabolism [34]. The gut microbiota could be important for degradation of more com-
plex sugars that may otherwise have toxic effects [27].
Honeydew with high contents of the trisaccharide melezitose could cause the severe clinical
symptoms of the honeydew flow disease in honey bees due to poor melezitose metabolism
capabilities of the intestinal microbiota. To understand the impact of melezitose on honey bee
health, feeding experiments with melezitose were performed, during which physiological con-
dition and behaviour of the bees were monitored, and the intestinal microbiota was analysed
by 16S-amplicon sequencing.
Material and methods
Performance of the feeding experiments
Four feeding experiments were performed during summer of the years 2017, 2018 and 2019.
European honey bees (Apis mellifera) were collected from the hives of the Apicultural State
Institute (University of Hohenheim, Germany). For every experiment, six brood combs with-
out adult bees were removed from three different donor colonies, caged and incubated at 33˚C
for 24 h. Newly emerged bees (day 1) were collected and pooled. Out of the pooled bees, 50
bees were randomly collected and placed in each one of twelve experimental cages. Bees were
held in cages, as previously described [35]. The cages were placed in a darkened climate cham-
ber in randomised block design at the typical brood nest temperature of 35˚C. Melezitose does
not crystallise at this temperature. The bees were fed ad libitum with control feed (39% (w/v)
fructose, 31% glucose, 30% sucrose) or melezitose feed (50% melezitose, 19.5% fructose, 15.5%
glucose), which mimicked the sugar spectrum of honeydew honey with high melezitose
content.
Six cages were supplied with control feed and six cages with melezitose feed. Both sugar
solutions were treated in the same way, dissolved in an ultrasonic bath that heats up in 30 min
from 23˚C to 70˚C. 2 ml of the respective sugar solution was freshly prepared daily to ensure
same viscosity and no effect on the degree of crystallisation. Solutions were administered
simultaneously with vials in each cage until all bees had died.
Feeding experiment 1 –Sugar analyses of crop content. In the first cage experiment, all
bees were frozen at day 21. This was necessary to for crop content analysis in order to prove
the ability of all bees to collect and process the food solutions with different sugar composi-
tions. The crop content, if present, was collected for sugar analysis (34 crops of control-fed
bees and 69 crops of melezitose-fed bees). The sugars were analysed according to Lohaus and
Schwerdtfeger [36].
PLOS ONE Melezitose impacts honey bee health
PLOS ONE | https://doi.org/10.1371/journal.pone.0230871 April 10, 2020 3 / 19

Feeding experiment 2 –Sugar analyses of processed sugar solution. In the second cage
experiment, bees of all six melezitose-fed cages collected the sugar solution in small honey
combs that they built from the provided wax foundation rectangle. The sugar proportions of
the collected, processed feed were analysed [36] for each cage (six processed sugar solutions).
Feeding experiment 3 –Analyses of processed sugar solution, gut microbiota and water
supply. Again, the bees in two of the melezitose-fed cages collected the sugar solution in
honey combs, and the sugar proportions were analysed [36] for each cage (two processed
sugar solutions).
In the third cage experiment, we performed a preliminary gut microbiome analysis. At day
10, one live bee was collected from one control-fed cage, and two live bees from two different
melezitose-fed cages. At day 15 and 20 this procedure was repeated. The collected bees (N = 9)
were frozen immediately at -80˚C. Further description of the preliminary gut microbiota anal-
ysis is provided below.
In the third cage experiment, distilled water was supplied ad libitum in centrifuge tubes; in
addition to the sugar feed solution.
Feeding experiment 4 –Analyses of gut microbiota. In the fourth cage experiment, gut
microbiota analysis was implemented. The results of the preliminary microbiota analysis in
cage experiment three indicated that for acquisition of a complete gut microbiota, the caged
bees needed contact to nurse bees [37,38]. To ensure this, the experimental design was
adjusted. 1’832 newly emerged bees from the donor colonies described above (day 1) were
marked with liquid water-proof marker in a colour representing their colony (1, 2 and 3).
Later, on the same day, the marked bees were placed back into their donor colonies. Four days
later (day 5), 20 marked bees from each donor colony were placed in each of the nine experi-
mental cages. Six cages were fed with the control solution and three cages with the melezitose
solution. Moreover, from day 10 on, three of the six control-fed cages were changed to melezi-
tose diet (“changed diet”).
For the gut microbiota analysis, bees were collected at different time points. On day 5, six
bees from each donor colony (3 donor colonies x 6 bees = 18 bees) were collected. On day 10,
six bees were collected from each of the three control and three melezitose-fed cages. Con-
stantly two of the collected bees per cage originated from donor colony 1, two from donor col-
ony 2 and two from donor colony 3, as identified by their colour marks (2 treatment groups x
3 cages x 3 donor colonies x 2 bees = 36 bees). On day 15, six bees were collected from each
cage (3 treatment groups x 3 cages x 3 donor colonies x 2 bees = 54 bees). The collected bees
(N = 108) were frozen immediately at -80˚C. Further procedures in the gut microbiota analysis
are described below.
Additional field experiments
Additionally, at five sampling sites in the black forest (Southern Germany), 100 bees from
three bee colonies per sampling site were collected during honeydew season in 2017 and 2018.
The crop contents from each hive were pooled for sugar analysis (5 sampling sites x 3 colonies
x 2 years = 30 analyses).
Analysis of the aspects of honey bee health
In order to measure the aspects of bee health (see Table 1) in feeding experiments 2–4, food
uptake per cage was recorded daily by weighing of the food [g]. The food uptake was then cal-
culated difference to the food weight given the day before. Mortality was recorded by counting
the dead bees exactly every 24 hours. The whole body weights without crop and the weights of
the dissected guts of the first ten dead bees in each cage were recorded.
PLOS ONE Melezitose impacts honey bee health
PLOS ONE | https://doi.org/10.1371/journal.pone.0230871 April 10, 2020 4 / 19

Gut microbiota profiling
To profile the gut microbiota, DNA of nine bees from the feeding experiment in 2018, as well
as from 108 bees from the feeding experiment in 2019 was extracted using a TRIzol protocol.
Whole single bees were extracted using our standard protocol because DNA and RNA can be
extracted simultaneously and be used for further experiments. The bees were placed in a 2 ml
lysis tube with five 0.8 mm steel beads, roughly 50 μl 0.1 mm glass/zirconia beads and 0.5 ml
TRIzol (Invitrogen). The bees were homogenised on a FastPrep24 (MP Bio) at 5.5 m/s for 50 s.
After 5 min of incubation at RT, 100 μl chloroform was added and the contents were mixed by
vigorous shaking, followed by 5 min of incubation at RT. The two phases were separated by 15
min centrifugation at 12.000 g and 4˚C. The aqueous phase was transferred to another tube for
RNA extraction. 250 μl back extraction buffer (4 M guanidine thio-cyanate, 50 mM sodium
citrate, 1 M TRIS base) was added to the rest of the homogenate and mixed by vigorous shak-
ing. After 10 min of incubation at RT and centrifugation for 15 min at 12.000 g and 4˚C, the
aqueous phase was transferred to a new tube with 200 μl isopropanol and mixed by repeated
inverting. After 5 min of incubation at RT and 15 min of centrifugation (12.000 g, 4˚C), the
supernatant was removed, the pellet was washed with 80% ethanol, dried for 10 min at RT and
centrifuged again (12.000 g, 4˚C) for 5 min. The supernatant was removed, the pellet dried for
5 min at RT and redissolved in 50 μl 8mM NAOH. After another centrifugation for 10 min
(12.000 g, RT) to remove the membrane lipids, the supernatant was transferred into 4.25 μl 0.1
M HEPES and 0.5 μl RNAse A (Amresco 10 mg/ml), mixed carefully and incubated for 1 h at
37˚C. DNA concentrations were determined using Qubit fluorometer (Thermo Fisher Scien-
tific). The resulting DNA concentrations ranged between 10.1–94.6 ng/μl. Amplicons from the
V3-V4 region of the 16S-rRNA-gene were generated and Illumina-sequenced using 20 ng tem-
plate DNA (Eurofins Genomics, Ebersberg, Germany). The PCR conditions, library prepara-
tion, sequencing and initial data preparation were described previously [39]. After
demultiplexing by demultiplexor_v3.pl (Perl 5.30) and initial quality filtering, OTU binning
(97% identity) was done by USEARCH 8.0 [40], as well as quality filtering and Chimera filter-
ing by UCHIME [41] (with RDP set 15 as a reference database). The sequencing data were
analysed on the Integrated Microbial NGS platform [42], using a 0.1% total abundance thresh-
old. This is a UPARSE based analysis pipeline reporting OTU sequences with�1% incorrect
bases in artificial microbial community tests [43]. Primary taxonomic classification was done
by RDP classifier version 2.11 training set 15 [44] and sequence alignment was done by MUS-
CLE [45]. The taxonomic classification was controlled and refined by BLAST-searching the
representative OTU sequences in the NCBI database (https://blast.ncbi.nlm.nih.gov).
Table 1. Overview of the analyses as well as the number of bees and cages per treatment of the feeding experiments performed between 2017 and 2019.
Feeding experiment Year Sugar analyses Microbiota analysis Aspects of bee health Treatment groups Cages per treatment Bees per cage
1 2017 Cf, Cc, Fw / / Co, Me 6 50
2 2017 Cc, Fw / FU, GW, ST Co, Me 6 50
3 2018 / 9 FU, GW, ST Co, Me 6 50+3
4 2019 / 108 FU, GW, ST Co, Me, M10 3 60+12
The sugar content was analysed in crops of bees in the field (Cf), crops of bees from the feeding experiments (Cc) and from feed the bees transported into the cells of the
beeswax foundation rectangle in the cages (Fw). Aspects of bee health monitored by daily food uptake per cage (FU), gut-body weight ratio of dead bees (GW) and
survival of all bees per cage (ST). The treatment groups were fed a control solution of sucrose, glucose and fructose (Co) or with a 1:1 solution of control and melezitose
(Me), in 2019 control-fed bees were fed with melezitose from day 10 (M10). The extra bees for microbiota analysis were marked and put in the cages additionally (noted
with +).
https://doi.org/10.1371/journal.pone.0230871.t001
PLOS ONE Melezitose impacts honey bee health
PLOS ONE | https://doi.org/10.1371/journal.pone.0230871 April 10, 2020 5 / 19

Normalisation, taxonomic binning, and statistical analyses were carried out using the RHEA
scripts [46] on R studio version 1.1.456.
Ethics statement
In accordance with the guidelines of the authors’ institutions’ and the applicable regulations,
no ethics approval was required or obtained for the present study. This study was carried out
in Baden-Wuerttemberg, Germany. Honey bees are no subjects of the German Animal Protec-
tion law. Additionally, neither endangered nor protected species were involved in this study.
Statistical analyses
The daily food uptake per bee was calculated in consideration of the number of bees alive on
the respective day. The gut-body weight ratio was calculated from the weight of the recorded
bee bodies (without crop) and their removed guts. In order to visualise the results for both
measures, box plots were created for each group in the respective year. A linear regression was
used to estimate the group differences in daily food uptake controlling for the number of bees
alive, daily and annual effects. Since the gut-body weight ratio range between 0 and 1, a frac-
tional logit regression model was employed to estimate group differences controlling for year
effects and the age of bees. Survival of bees was analysed in a Cox proportional hazards model.
Differences between bacterial species in the treatment groups were analysed with the Rhea R
pipeline [46]. All statistical tests were conducted and graphs were drawn using R version 3.5.2.
Table 2. Results of the linear regression model (daily food uptake), fractional logit regression model (gut-body
weight ratio) and Cox proportional hazard model (survival).
Coefficients Estimate St. Error Pr(>|t|)
Panel I: Daily food uptake
Intercept 0.1162 0.0096 <0.001
Melezitose 0.0027 0.0029 0.947
Melezitose day +10 0.0184 0.0061 0.003
2018 0.0109 0.0030 <0.001
2019 0.0151 0.0040 <0.001
Days -0.0018 0.0003 <0.001
Bees_alive -0.0017 0.0001 <0.001
Panel II: Gut-body weight ratio
Intercept -0.0520 0.1099 0.636
Melezitose 0.0866 0.0154 <0.001
Melezitose day +10 0.0550 0.0260 0.034
2018 0.0157 0.0136 0.248
2019 0.0028 0.0142 0.842
Days 0.0012 0.0016 0.440
Panel III: Survival
Melezitose 0.9319 0.0555 <0.001
Melezitose day +10 2.2514 0.1073 <0.001
2018 -0.1144 0.0584 0.050
2019 -0.8595 0.0771 <0.001
The multivariate R2 for the linear regression in Panel I is 0.253 and the F-test for overall significance yields F(6.893) =
50.4 (p < 0.001). For the fractional logit regression in Panel II, we report average partial effects. The multivariate R2
is 0.174 based on 330 observations. The log-rank test (4.1740) yields 628.1 (p < 0.001).
https://doi.org/10.1371/journal.pone.0230871.t002
PLOS ONE Melezitose impacts honey bee health
PLOS ONE | https://doi.org/10.1371/journal.pone.0230871 April 10, 2020 6 / 19

Results
The bees fed with melezitose in the experiments showed disease symptoms related to their
physiological condition and generic behaviour. Bees fed with the control diet stayed predomi-
nantly on the beeswax foundation rectangle (S1 Video) and bees fed with melezitose were
observed to crawl mostly on the bottom of the cage (S2 Video). In fact, towards the end of the
experiment, this behaviour was exhibited more frequently. Additionally, melezitose-fed bees
also moved more often and faster than the bees in the control-fed cages. Swollen abdomens,
abdomen tipping, impaired movement, twitching and terminal paralysis were observed during
all feeding experiments in the melezitose-fed bees (S2 Video and S3 Video).
Following our hypothesis that melezitose affects the health of honey bees, we conducted
several multivariate regression analyses investigating multiple aspects of honey bee health.
Using daily food uptake per bee, gut-body weight ratio and survival time as dependent vari-
ables, we can show that melezitose has a highly significant negative effect on honey bee health.
The results of our individual regression models are presented in Table 2.
Sugar analyses of crop contents in cage and field experiments and of
processed feed
The results of the sugar spectrum analysis in the crops of the caged bees point out that the tri-
saccharide melezitose was taken up and degraded into the small molecule sugars trehalose,
sucrose, glucose and fructose. While the melezitose proportion in the food was 50%, the mean
value in the crops from 69 bees was 18.88%.
The sugar analyses of the contents from the field and laboratory experiments showed that
the bees ingested melezitose. Presence of liquid in the crop indicated active feeding. The crops
of the field-collected bees contained up to 10.8% melezitose. Besides melezitose, these crops
contained (in ranking order) mainly glucose and fructose, less than 10% sucrose, trehalose,
turanose, maltose and erlose. Furthermore, less than 1% consisted of melibiose, raffinose and
stachyose.
The mean melezitose content in the processed feed in the combs formed from the beeswax
foundation rectangles in the cages was 28.92% (8 processed sugar solutions of melezitose-fed
cages) (Table 3).
Effects of melezitose feeding on water and food uptake
Bees did not take up more water when fed with melezitose feed, as compared to control solu-
tion and also did not show a significantly higher food uptake than control-fed bees (Fig 1). In
contrast, the food uptake of bees fed with melezitose starting from day 10 was 20 mg higher
(p< 0.01) than that of bees fed with the control solution and higher than that of bees fed with
melezitose from the first day onwards (p< 0.01). To illustrate the relative increase in food
uptake, we determined the average uptake per bee, which was 20 mg for control-fed bees. Cal-
culating from this value, a change from control to melezitose diet caused the bees to approxi-
mately double their food intake (Fig 1).
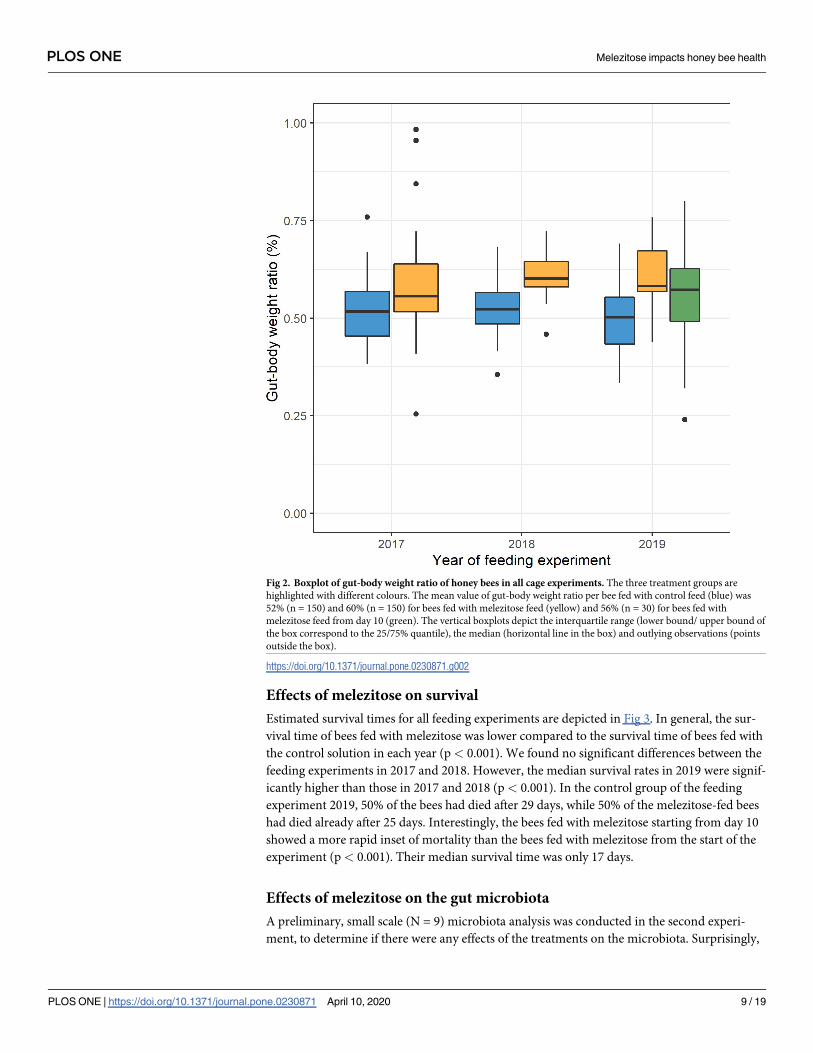
Effects of melezitose feeding on viscosity and weight of guts
The proportion of gut weight of the respective bee bodies was 52% in control-fed bees, 60% in
melezitose-fed bees and 56% in bees fed with melezitose from day 10 (Fig 2). We conducted a
fractional logit regression (R2(5,330) = 0.174) and found that both groups fed with melezitose
had significantly higher gut-body weight ratios than the control group (p < 0.001 for bees fed
with melezitose from day 1 and p< 0.05 for bees fed with melezitose from day 10). The effect
PLOS ONE Melezitose impacts honey bee health
PLOS ONE | https://doi.org/10.1371/journal.pone.0230871 April 10, 2020 7 / 19

of the higher gut-body weight ratio was numerically slightly weaker (six percentage-points
increase of gut-body-weight ratio instead of nine percentage points increase) for bees fed with
melezitose starting from day 10, which implies that a longer exposure to melezitose seems to
enlarge the gut of bees.
Table 3. Fructose, glucose, sucrose and melezitose proportion of the feed solution, crop content of honey bees collected from the first feeding experiment, field
experiment and the processed melezitose feed.
Analysed solution Fructose [%] Glucose [%] Sucrose [%] Melezitose [%]
Food solution 19.50 15.50 15.00 50.00
Crop content of feeding experiment (N = 69) 38.82 36.04 6.10 18.88
Crop content of field experiment (N = 15) 45.30 35.50 4.60 3.70
Processed sugar solution (N = 8) 24.71 37.59 8.79 28.92
https://doi.org/10.1371/journal.pone.0230871.t003
Fig 1. Boxplot of food uptake per day and bee in milligram (mg) in all cage experiments. The three treatment
groups are highlighted with different colours. The mean value of daily food uptake per bee fed with control feed (blue)
was 20 mg per day (n = 445) and 37 mg per day (n = 388) for bees fed with melezitose feed (yellow) and 70 mg per day
(n = 67) for bees fed with melezitose feed from day 10 (green) of all years. The vertical boxplots depict the interquartile
range (lower bound/ upper bound of the box correspond to the 25/75% quantile), the median (horizontal line in the
box) and outlying observations (points outside the box).
https://doi.org/10.1371/journal.pone.0230871.g001
PLOS ONE Melezitose impacts honey bee health
PLOS ONE | https://doi.org/10.1371/journal.pone.0230871 April 10, 2020 8 / 19
Effects of melezitose on survival
Estimated survival times for all feeding experiments are depicted in Fig 3. In general, the sur-
vival time of bees fed with melezitose was lower compared to the survival time of bees fed with
the control solution in each year (p< 0.001). We found no significant differences between the
feeding experiments in 2017 and 2018. However, the median survival rates in 2019 were signif-
icantly higher than those in 2017 and 2018 (p< 0.001). In the control group of the feeding
experiment 2019, 50% of the bees had died after 29 days, while 50% of the melezitose-fed bees
had died already after 25 days. Interestingly, the bees fed with melezitose starting from day 10
showed a more rapid inset of mortality than the bees fed with melezitose from the start of the
experiment (p< 0.001). Their median survival time was only 17 days.
Effects of melezitose on the gut microbiota
A preliminary, small scale (N = 9) microbiota analysis was conducted in the second experi-
ment, to determine if there were any effects of the treatments on the microbiota. Surprisingly,
Fig 2. Boxplot of gut-body weight ratio of honey bees in all cage experiments. The three treatment groups are
highlighted with different colours. The mean value of gut-body weight ratio per bee fed with control feed (blue) was
52% (n = 150) and 60% (n = 150) for bees fed with melezitose feed (yellow) and 56% (n = 30) for bees fed with
melezitose feed from day 10 (green). The vertical boxplots depict the interquartile range (lower bound/ upper bound of
the box correspond to the 25/75% quantile), the median (horizontal line in the box) and outlying observations (points
outside the box).
https://doi.org/10.1371/journal.pone.0230871.g002
PLOS ONE Melezitose impacts honey bee health
PLOS ONE | https://doi.org/10.1371/journal.pone.0230871 April 10, 2020 9 / 19

we found that the core microbiota members Gilliamella apicola and Snodgrassella alvi were
absent from all bees analysed (S1 Fig). This is remarkable, as they are usually, together with the
Lactobacillus species, the most common and persistent bacteria in free-living adult bees. This
absence of two core-microbiota bacteria was attributed to the circumstance that the bees used
in the first three experiments had emerged from their cells and were put into the cages without
contact to adult nest members. Therefore, it was decided to modify the experimental setup for
the third experiment in a way that the age-standardised bees come into contact with their
adult nest members for five days to allow natural development of the intestinal microbiota (S2
Fig). Diversity analyses of the 16S-amplicon sequence data revealed no significant differences
in the community composition between the treatment groups of the feeding experiment (S3
Fig). In the bees from the fourth experiment (N = 108) a total of ten gut bacteria species could
be detected. The five core members are Snodgrassella alvi, Gilliamella apicola, Bifidobacteriumspp., Lactobacillus Firm-4 and Lactobacillus Firm-5, as well as bacteria from the species
Frischella perrara, Gluconacetobacter spp., Parasaccharibacter apium, Bartonella apis and Lac-tobacillus kunkeei (S4 Fig).
At first glance, the microbial community appeared to be unaffected by the melezitose treat-
ment. However, on closer examination of the OTU composition, we found that the
Fig 3. Overall survival probability plots in all cage experiments. The survival rate of the honey bees in the control
(blue), in the melezitose group (yellow) and in the bees fed with melezitose from day 10 (green) (Cox regression, Log-
rank (4,1740): 628.1, p< 0.001).
https://doi.org/10.1371/journal.pone.0230871.g003
PLOS ONE Melezitose impacts honey bee health
PLOS ONE | https://doi.org/10.1371/journal.pone.0230871 April 10, 2020 10 / 19

proportions of the lactic acid bacteria differed between the treatment groups. Lactobacilluskunkeei increased over time in bees fed with the control diet, but was not present at all in bees
fed with melezitose, and it was very low in bees fed with melezitose from day 10 (F-statistic:
2.66 on 5 and 102 DF, p = 0.03). Also, the relative abundance of Lactobacillus Firm-4 increased
in control-fed bees and decreased in bees fed with melezitose from day 10 (Fig 5; F-statistic:
4.245 on 5 and 102 DF, p = 0.002). In contrast, the relative abundance of Lactobacillus Firm-5
decreased in bees fed with the control diet, but increased significantly in bees fed with melezi-
tose and bees fed with melezitose from day 10 (Fig 6; F-statistic: 7.048 on 5 and 102 DF,
p< 0.001).
Discussion
This study describes the multiple effects of melezitose in honey bees and indicates its key sig-
nificance for the occurrence of the described honeydew flow disease. This disease already led
to colony losses during winter [3], which are usually noticed by beekeepers and therefore doc-
umented in beekeepers’ journals [4]. In three feeding experiments, bees fed with melezitose
showed intestinal symptoms, and increased food uptake, gut weight and mortality.
In order to analyse the progress of uptake and digestion of melezitose, the relative propor-
tion of melezitose in the feed and in the crops was measured. The melezitose proportion
decreased from feed to crop (Table 3), suggesting that bees or their crop microbiota did meta-
bolise melezitose. In social insects, the proventriculus provides the individual with the amount
of food needed to cover their actual energy needs, leaving as much as possible in the crop [47].
Nevertheless, honey bees are known to digest harmful food to conserve the health of the colony
[48]. Thus, it can be assumed, that the individual honey bees foraging on honeydew will digest
as much of the harmful melezitose as possible. This ensures that the remaining colony is pro-
vided with easily digestible food which is processed into honey.
Interestingly, we found that bees fed with melezitose from day 10 had twice as much food
uptake than control-fed bees (Fig 1). Both the doubled food uptake and the increase of melezi-
tose can lead to an accumulation of food in the gut. The average gut-body weight ratio that
was eight percent higher in bees fed with melezitose (Fig 2) also explains the morphological
symptom of the swollen abdomen. These results lead us to the assumption that bees need
more time to digest melezitose or are unable to digest the absorbed melezitose and thus the
sugar content in the intestine increases. The rising amount of melezitose can lead to the severe
symptoms that were observed in these feeding experiments. Concentrating on the life expec-
tancy of bees, the symptoms of honeydew flow disease appeared with increasing age (first on
day 10 after emergence). A gradual accumulation of melezitose with the lifetime of honey bees
can be assumed. The shorter lifespan of bees fed with melezitose compared to the control
group could be explained by their digestive problems and their influence on the physiology of
their abdomen (Fig 3).
Consequently, we expected changes in their intestinal microbiota and performed 16S-
amplicon sequencing to check for microbial shifts. There was a significant shift in the lactic
acid bacteria species: Lactobacillus kunkeei did not occur in the bees fed with melezitose (Fig
4) and the proportion of Lactobacillus Firm-4 decreased (Fig 5). Conversely, the proportion of
Lactobacillus Firm-5 increased with feeding on melezitose (Fig 6). Lactobacillus species fer-
ment sugars to produce lactic or acetic acid and are adapted to sugar-rich environments with
high acidity [29]. They are known to be dominant in the crop and most abundant in the ileum
and rectum [37,38]. Within the bee-associated Lactobacilli, Lactobacillus mellifera and L. mellisform a distinct phylogenetic cluster referred as Lactobacillus Firm-4, and the species Lactoba-cillus apis, L helsingborgensis, L. kimbladii, L. kullabergensis, and L. melliventris are referred as
PLOS ONE Melezitose impacts honey bee health
PLOS ONE | https://doi.org/10.1371/journal.pone.0230871 April 10, 2020 11 / 19

Lactobacillus Firm-5 [49]. Both clusters are located within the hindgut, Lactobacillus Firm-4 in
the rectum, L. Firm-5 in the ileum and rectum [49,50]. While these two clusters are rarely
detected outside the hindgut, Lactobacillus kunkeei is also found outside the honey bee body in
the hive. L. mellifera, which belongs to the Firm-4 cluster is only capable of producing acids
from fructose, while the species of the Firm-5 cluster can also utilise the sugars galactose, man-
nose, sorbose and sucrose [49]. The more diverse capabilities for oligosaccharide metabolism
of Lactobacillus Firm-5 species may explain their increase within the melezitose-fed bees.
These findings point out the importance of lactic acid bacteria for the nutrition of their
host. The bees that were fed with control diet first and from day 10 on with melezitose diet
died earlier than those fed with melezitose from the fifth day onwards (Fig 3). This may be
seen as further evidence for the key role of an adapted microbiota in the processing of oligosac-
charides. Bees fed with melezitose from the fifth day may have grown an adapted intestinal
microbiota capable of degrading the oligosaccharides at an increased rate. The change in diet
from the control to melezitose diet on day 10 day may therefore have led to a rapid accumula-
tion of melezitose in the guts of unadapted bees with acute, often lethal effects.
Fig 4. Relative abundance of Lactobacillus kunkeei in the gut microbiota. The three treatment groups are
highlighted with different colours: control (blue), melezitose (not detected at all time points) and melezitose from day
10 (green). Significantly different groups are highlighted by the letters a, b and c (F-statistic: 2.66 on 5 and 102 DF,
p = 0.027). For each treatment group and each bee age, 18 individuals were used for analysis. Not detected bacteria are
marked with ND. The vertical boxplots depict the interquartile range (lower bound/ upper bound of the
box correspond to the 25%/ 75% quantile), the median (horizontal line in the box) and outlying observations (points
outside the box).
https://doi.org/10.1371/journal.pone.0230871.g004
PLOS ONE Melezitose impacts honey bee health
PLOS ONE | https://doi.org/10.1371/journal.pone.0230871 April 10, 2020 12 / 19

Honey with high proportion of melezitose is well-known to crystallise rapidly, often already
within the hives [1]. However, intestinal epithelial lesions, which might be caused by uptake of
melezitose crystals, are an unlikely cause of the observed symptoms, since crystallisation did
not occur under the experimental conditions. No crystals were found by microscopy during
the examination of the affected intestine. Another possible effect of melezitose might be dehy-
dration. However, the bees of the third experiment fed with melezitose diet did not ingest
more water than the control group; therefore dehydration can be ruled out as major cause of
these symptoms. It is well-known that oligosaccharides are poorly utilised by the gut micro-
biota of honey bees and beekeepers should therefore try to avoid them as food source for their
colonies [33,51]. Here, we to show this effect for the oligosaccharide melezitose, which is very
common in honeydew of spruce forests. The shift of the lactic acid bacteria in bees fed with
melezitose provides evidence for the bees’ struggle to digest melezitose. On the one hand,
honey bees used to live in forests, so that it can be assumed that their bacteria have had suffi-
cient evolution time for adapting to typical honeydew sugars. On the other hand, it should be
acknowledged that natural forests with their higher botanical diversity used to provide more
nectar than most forests today. The occurrence of melezitose at high concentrations in the col-
onies is a problem primarily caused by the beekeepers themselves. Bee colonies are, on
Fig 5. Relative abundance of Lactobacillus Firm-4 in the gut microbiota. The three treatment groups are highlighted
with different colours: control (blue), melezitose (yellow) and melezitose from day 10 (green). Significantly different
groups are highlighted by the letters a, b, c and d (F-statistic: 4.245 on 5 and 102 DF, p = 0.002). For each treatment
group and each bee age, 18 individuals were used for analysis. The vertical boxplots depict the interquartile range
(lower bound/ upper bound of the box correspond to the 25%/ 75% quantile), the median (horizontal line in the box)
and outlying observations (points outside the box).
https://doi.org/10.1371/journal.pone.0230871.g005
PLOS ONE Melezitose impacts honey bee health
PLOS ONE | https://doi.org/10.1371/journal.pone.0230871 April 10, 2020 13 / 19

purpose, relocated to forests with lack of nectar plants, because honeydew honey with its
strong malty-aromatic taste is very popular and has a high market value [9]. The situation of
bees in the cages of the feeding experiment is similar to that of bees in winter that cannot leave
the hive because of low outside air temperature and therefore cannot defecate [52]. Since bees
have a well-studied hygienic behaviour [53] and only defecate outside of the colony, the mele-
zitose inevitably remains in the hindgut. The gut microbiota of honey bees may be somewhat
capable of processing melezitose, however this process may take time and melezitose may
accumulate in the gut faster than it can be processed. Therefore, the melezitose remains in the
bee and leads to the typical symptoms of the disease. This explains the occurrence of honeydew
flow disease symptoms especially during winter. Since honey bees have a longer lifespan of sev-
eral months in winter instead of several weeks [54], they are more dependent on effective
digestion of the stored food, which may favour honeydew flow disease in winter.
Honeydew flow disease is a regional phenomenon, mainly noticed by beekeepers in Ger-
many, Austria and Switzerland, which can be explained by the coincidence of sufficiently cold
winters, large fir-dominated forests, and beekeepers aiming to produce honeydew honey.
However, wild-living honey bee colonies that are not maintained by beekeepers can be found
in forests all over Europe [55] and can come in contact with melezitose, too. It can be assumed,
Fig 6. Relative abundance of Lactobacillus Firm-5 in the gut microbiota. The three treatment groups are highlighted
with different colours: control (blue), melezitose (yellow) and melezitose from day 10 (green). Significantly different
groups are highlighted by the letters a, b, c and d (F-statistic: 7.048 on 5 and 102 DF, p< 0.001). For each treatment
group and bee age, 18 honey bee individuals were used for analysis. The vertical boxplots depict the interquartile range
(lower bound/ upper bound of the box correspond to the 25%/ 75% quantile), the median (horizontal line in the box)
and outlying observations (points outside the box).
https://doi.org/10.1371/journal.pone.0230871.g006
PLOS ONE Melezitose impacts honey bee health
PLOS ONE | https://doi.org/10.1371/journal.pone.0230871 April 10, 2020 14 / 19

that these wild honey bee colonies have adapted their behaviour to honeydew with high
amounts of melezitose. They probably decrease the melezitose amount in their stored honey
by intensely foraging for nectar. Apart from that, the proportion of melezitose in the excretion
of honeydew producer species is variable [6] and there can be regional differences.
It should be noted that other oligosaccharides such as erlose and raffinose may probably
cause similar problems as melezitose. Melezitose is the most common trisaccharide in the hon-
eydew of spruces, as the spruce is the host tree of most honeydew producer species in Europe
when pines are not present locally [56]. Nevertheless, the results of these experiments can be
used as an example and be transferred to the effects of other oligosaccharides. Therefore, feed-
ing experiments with other oligosaccharides would extend the knowledge gained from this
study. Further experiments with several different sugar solutions in each cage could show the
preference of bees, and a transfer of the experiments to the field would give deeper insights
into the effects on colony level to qualitatively different nutrition. Additionally, it should be
further investigated whether and how the bee’s hindgut is physiologically affected by feeding
with oligosaccharides.
From the experience gained during this study in respect of establishment of a complete, nat-
ural microbiota in experimental bees, we recommend to allow for contact between the newly
emerged experimental bees and nurse bees. Gut microbiota bacteria are acquired by newly
emerged bees by oral-oral transmission (especially lactic acid bacteria) and by faecal-oral
transmission through contact with other worker bees or hive material [37,38].
Altogether, the results of this study lead to the conclusion that melezitose affects the health
of honey bees. The trisaccharide may accumulate in the gut over time as the gut microbiota
needs more time to metabolise melezitose than for simple sugars. The present results show
that high amounts of melezitose play a key role in the occurrence of the honeydew flow disease
in bee colonies. Additionally, it can be assumed that the honeydew flow disease can affect
honey bees synergistically with pathogens, such as the paralysis viruses, which are most abun-
dant during honeydew season [57]. Bee colonies are superorganisms and can compensate dis-
eases through healthy new brood and maintenance of homeostasis [58]. However, if
melezitose accumulates in the combs and is not removed by the beekeeper, the bees will face
digestion problems during the winter when no brood can be reared. Based on the results of
this present study, it can be recommended to avoid honeydew with high contents of melezi-
tose. Beekeepers should therefore remove their colonies from the forests, when environmental
conditions favour melezitose production.
Supporting information
S1 Fig. Overall gut microbiota of sequenced DNA of honey bees from the third feeding
experiment (mean value of N = 9 analysed gut microbial communities). Honey bees were
removed from their colonies directly after emerging and had no contact to nurse bees. Bacte-
rial species are highlighted by colour and shown in the legend. Core-members of the honey
bee gut microbiota are written in bold.
(TIF)
S2 Fig. Overall gut microbiota of sequenced DNA of honey bees from the fourth feeding
experiment (mean value of analysed gut microbial communities of N = 108 bees). Honey
bees lived in bee hive colonies with contact to nurse bees until day 5. Bacterial species are
highlighted by colour and shown in the legend. Core-members of the honey bee gut micro-
biota are written in bold.
(TIF)
PLOS ONE Melezitose impacts honey bee health
PLOS ONE | https://doi.org/10.1371/journal.pone.0230871 April 10, 2020 15 / 19

S3 Fig. Differences in α-diversity, i.e. Shannon effective number of species, in the gut
microbiota of control (blue) and melezitose (yellow) fed bees and bees with a changed diet
(green) based on 16S RNA gene amplicon sequencing. No significant differences between
the groups were detected (Kruskal-Wallis chi-squared = 1.8162, df = 5, p-value = 0.8739). For
each treatment group and honey bee age, 18 honey bee individuals were used for analysis.
C = control-fed bees (blue), M = melezitose-fed bees (yellow), CM = bees first fed with control
and from day 10 with melezitose (green); 5, 10 and 15 shows the honey bee age in days. The
vertical boxplots depict the interquartile range (lower bound/ upper bound of the
box correspond to the 25%/ 75% quantile) and the median (horizontal line in the box).
(TIFF)
S4 Fig. Absolute abundances of ten microbiota members monitored in the feeding experi-
ment 2019. Absolute abundance of the ten monitored phylotypes: Snodgrassella alvi, Gillia-mella apicola, Bifidobacterium spp., Lactobacillus Firm-4, Lactobacillus Firm-5, Frischellaperrara, Gluconacetobacter spp., Parasaccharibacter apium, Bartonella apis and Lactobacilluskunkeei. The ten plots show the cumulative abundances for each bee. For each treatment
group, 18 honey bee individuals were used for analysis. C = control-fed bees (blue),
M = melezitose-fed bees (yellow), CM = bees first fed with control and from day 10 with mele-
zitose (green); 5, 10 and 15 shows the honey bee age in days. Significant differences between
the treatment groups could be shown for all Lactobacillus species and are demonstrated in Figs
4–6. The vertical boxplots depict the interquartile range (lower bound/ upper bound of the
box correspond to the 25%/ 75% quantile), the median (horizontal line in the box) and outly-
ing observations (points outside the box).
(TIFF)
S1 Video. Control-fed bees of one cage of feeding experiment three. The bees fed with con-
trol solution predominantly stayed on the beeswax foundation rectangle and moved only little.
(MP4)
S2 Video. Melezitose-fed bees of one cage of feeding experiment three. Bees fed with melezi-
tose were observed to mostly crawl on the bottom of the cage and moved very often and fast.
They displayed the disease symptoms: swollen abdomen, abdomen tipping, impaired move-
ment, twitching and terminal paralysis.
(MP4)
S3 Video. Melezitose-fed bees of one cage at the end of feeding experiment three. Bees fed
with melezitose showed swollen abdomens and impaired movements, which was more severe
towards the ends of their live. Eventually, they are unable move and succumb to the disease.
(MP4)
Author Contributions
Conceptualization: Victoria Charlotte Seeburger, Paul D’Alvise, Annette Schroeder, Martin
Hasselmann.
Data curation: Victoria Charlotte Seeburger, Paul D’Alvise, Basel Shaaban, Karsten
Schweikert.
Formal analysis: Victoria Charlotte Seeburger, Paul D’Alvise, Karsten Schweikert.
Funding acquisition: Basel Shaaban, Gertrud Lohaus, Annette Schroeder.
PLOS ONE Melezitose impacts honey bee health
PLOS ONE | https://doi.org/10.1371/journal.pone.0230871 April 10, 2020 16 / 19
Methodology: Victoria Charlotte Seeburger, Paul D’Alvise, Basel Shaaban, Gertrud Lohaus,
Annette Schroeder, Martin Hasselmann.
Project administration: Victoria Charlotte Seeburger.
Validation: Victoria Charlotte Seeburger, Paul D’Alvise, Martin Hasselmann.
Visualization: Victoria Charlotte Seeburger, Paul D’Alvise, Karsten Schweikert.
Writing – original draft: Victoria Charlotte Seeburger.
Writing – review & editing: Victoria Charlotte Seeburger, Paul D’Alvise, Basel Shaaban, Kar-
sten Schweikert, Gertrud Lohaus, Annette Schroeder, Martin Hasselmann.
References1. Hudson CS, Sherwood SF. The occurrence of melezitose in honey. J Am Chem Soc. 1919; 42: 116–
125. https://doi.org/10.1021/ja01446a016
2. Bailey L. The occurrence of chronic and acute bee paralysis viruses in bees outside britain. J Invertebr
Pathol. 1965; 7: 167–169. https://doi.org/10.1016/0022-2011(65)90031-5 PMID: 5827552
3. Horn H. Die Waldtrachtkrankheit der Honigbiene I. Der Einfluß des Mineralstoffgehaltes in Honigtauho-
nigen. Apidologie. 1985; 16: 139–156. https://doi.org/10.1051/apido:19850204
4. Imdorf A, Bogdanov S, Kilchenmann V. Zementhonig im Honig- und Brutraum–was dann. Schw Zent
Bienenforschung. 1985; 1: 1–16.
5. Baker HG, Baker I. Floral nectar sugar constituents in relation to pollinator type. Handbook Exp Poll
Biol. 1983; 1: 117–141. https://doi.org/10.2307/2443763
6. Shaaban B, Seeburger V, Schroeder A, Lohaus L. Sugar, amino acid and inorganic ion profiling of the
honeydew from different hemipteran species feeding on Abies alba and Picea abies. PLoS ONE. 2020;
15: 1–17. https://doi.org/10.1371/journal.pone.0228171 PMID: 31978201
7. Price DRG, Karley AJ, Ashford DA, Isaacs HV, Pownall ME, Wilkinson HS, et al. Molecular characteri-
sation of a candidate gut sucrase in the pea aphid, Acyrthosiphon pisum. Insect Biochem Molec Biol.
2007; 37: 307–317. https://doi.org/10.1016/j.ibmb.2006.12.005 PMID: 17368194
8. Lachman J, Kolihova D, Miholova D, Kosata J, Titěra D, Kult K. Analysis of minority honey components:
Possible use for the evaluation of honey quality. Food Chemistry. 2007; 101: 973–979. https://doi.org/
10.1016/j.foodchem.2006.02.049
9. Castro-Vazquez L, Dıaz-Maroto MC, Perez-Coello MS. Volatile composition and contribution to the
aroma of spanish honeydew honeys. Identification of a new chemical marker. J Agr Food Chem. 2006;
54: 4809–4813. https://doi.org/10.1021/jf0604384 PMID: 16787032
10. Sanz ML, Gonzalez M, Lorenzo C de, Sanz J, Martınez-Castro I. A contribution to the differentiation
between nectar honey and honeydew honey. Food Chem. 2005; 91: 313–317. https://doi.org/10.1016/
j.foodchem.2004.06.013
11. Pohorecka K., Skubida P. Healthfullness of honeybee colonies (Apis mellifera L.) wintering on the
stores with addition of honeydew honey. Bull Vet Inst Pulawy. 2004; 48: 409–413.
12. Vantaux A, Schillewaert S, Parmentier T, van den Ende WIM, Billen J, Wenseleers TOM. The cost of
ant attendance and melezitose secretion in the black bean aphid Aphis fabae. Ecol Entomol. 2015; 40:
511–517. https://doi.org/10.1111/een.12217
13. Banks CJ. Effects of the ant Lasius niger (L.) on insects preying on small populations of Aphis fabae
Scop. on bean plants. Ann Appl Biol. 1962; 50: 669–679. https://doi.org/10.1111/j.1744-7348.1962.
tb06067.x
14. Samways MJ. Interrelationship between an entomogenous fungus and two ant-homopteran (Hymenop-
tera: Formicidae-Hemiptera: Pseudococcidae & Aphididae) mutualisms on guava trees. Bull Entomol
Res. 1983; 73: 321. https://doi.org/10.1017/S0007485300008919
15. Fischer MK, Shingleton A.W. Host plant and ants influence the honeydew sugar composition of aphids.
Funct Ecol. 2001; 15: 544–550. https://doi.org/10.1046/j.0269-8463.2001.00550.x
16. Vantaux A, van den Ende W, Billen J, Wenseleers T. Large interclone differences in melezitose secre-
tion in the facultatively ant-tended black bean aphid Aphis fabae. J Ins Physiol. 2011; 57: 1614–1621.
https://doi.org/10.1016/j.jinsphys.2011.08.014 PMID: 21896277
PLOS ONE Melezitose impacts honey bee health
PLOS ONE | https://doi.org/10.1371/journal.pone.0230871 April 10, 2020 17 / 19

17. Woodring J. Honeydew amino acids in relation to sugars and their role in the establishment of ant-atten-
dance hierarchy in eight species of aphids feeding on tansy (Tanacetum vulgare). Physiol Entomol.
2004; 29: 311–319. https://doi.org/10.1111/j.0307-6962.2004.00386.x
18. Detrain C, Verheggen FJ, Diez L, Wathelet B, Haubruge E. Aphid-ant mutualism: how honeydew sugars
influence the behaviour of ant scouts. Physiol Entomol. 2010; 35: 168–174. https://doi.org/10.1111/j.
1365-3032.2010.00730.x
19. Heil M, Buchler R, Boland W. Quantification of Invertase Activity in Ants Under Field Conditions. J
Chem Ecol. 2005; 31: 431–437. https://doi.org/10.1007/s10886-005-1352-y PMID: 15856794
20. White JW, Maher J. Transglucosidation by Honey Invertase. Arch Biochem Biophys. 1953; 42: 360–
367. https://doi.org/10.1016/0003-9861(53)90365-8 PMID: 13031638
21. Simpson J, Riedel IBM, Wilding N. Invertase in the Hypopharyngeal Glands of the Honeybee. J Apic
Res. 1968; 7: 29–36. https://doi.org/10.1080/00218839.1968.11100184
22. Oddo LP, Piazza MG, Pulcini P. Invertase activity in honey. Apidologie. 1998; 30: 57–65. https://doi.
org/10.1051/apido:19990107
23. Maurizio A. Untersuchungen uber das Zuckerbild der Hamolymphe der Honigbiene (Apis mellifica L.) -
1. Das Zuckerbild des Blutes erwachsener Bienen. J Ins Physiol. 1965; 11: 745–763. https://doi.org/10.
1016/0022-1910(65)90155-1
24. Barker RJ, Lehner Y. Influence of diet on sugars found by thin-layer chromatography in thoraces of
honey bees, Apis mellifera L. J Exp Zool. 1974; 188: 157–164. https://doi.org/10.1002/jez.1401880204
PMID: 4825425
25. Kwong WK, Moran NA. Gut microbial communities of social bees. Nat Rev Microbiol. 2016; 14: 374–
384. https://doi.org/10.1038/nrmicro.2016.43 PMID: 27140688
26. Crotti E, Sansonno L, Prosdocimi EE, Vacchini V, Hamdi C, Cherif A, et al. Microbial symbionts of hon-
eybees: a promising tool to improve honeybee health. New Biotechnol. 2013; 30: 716–722. https://doi.
org/10.1016/j.nbt.2013.05.004 PMID: 23727340
27. Engel P, Martinson G. V, Moran NA. Functional diversity within the simple gut microbiota of the honey
bee. Proc Natl Acad Sci USA. 2012; 109: 11002–11007. https://doi.org/10.1073/pnas.1202970109
PMID: 22711827
28. Engel P, Moran NA. Functional and evolutionary insights into the simple yet specific gut microbiota of
the honey bee from metagenomic analysis. Gut Microb. 2013; 4: 60–65. https://doi.org/10.4161/gmic.
22517 PMID: 23060052
29. Anderson KE, Sheehan TH, Eckholm BJ, Mott BM, DeGrandi-Hoffman G. An emerging paradigm of col-
ony health: microbial balance of the honey bee and hive (Apis mellifera). Insect Soc. 2011; 58: 431–
444. https://doi.org/10.1007/s00040-011-0194-6
30. Evans JD, Schwarz RS. Bees brought to their knees: microbes affecting honey bee health. Trends
Microbiol. 2011; 19: 614–620. https://doi.org/10.1016/j.tim.2011.09.003 PMID: 22032828
31. Hamdi C, Balloi A, Essanaa J, Crotti E, Gonella E, Raddadi N, et al. Gut microbiome dysbiosis and hon-
eybee health. J Appl Entomol. 2011; 135: 524–533. https://doi.org/10.1111/j.1439-0418.2010.01609.x
32. Barker RJ, Lehner Y. Acceptance and sustenance value of naturally occurring sugars fed to newly
emerged adult workers of honey bees (Apis mellifera L.). J Exp Zool. 1974; 187: 277–286. https://doi.
org/10.1002/jez.1401870211
33. Moran NA. Genomics of the honey bee microbiome. Curr Opin Ins Sci. 2015; 10: 22–28. https://doi.org/
10.1016/j.cois.2015.04.003 PMID: 26140264
34. Lee W-J, Hase K. Gut microbiota-generated metabolites in animal health and disease. Nat Chem Biol.
2014; 10: 416–424. https://doi.org/10.1038/nchembio.1535 PMID: 24838170
35. Ziegelmann B, Abele E, Hannus S, Beitzinger M, Berg S, Rosenkranz P. Lithium chloride effectively
kills the honey bee parasite Varroa destructor by a systemic mode of action. Sci Rep. 2018; 8: 1–9.
https://doi.org/10.1038/s41598-017-17765-5
36. Lohaus G, Schwerdtfeger M. Comparison of sugars, iridoid glycosides and amino acids in nectar and
phloem sap of Maurandya barclayana, Lophospermum erubescens, and Brassica napus. PLoS ONE.
2014; 9: 1–8. https://doi.org/10.1371/journal.pone.0087689 PMID: 24489951
37. Powell E, Martinson VG, Urban-Mead K, Moran NA. Routes of Acquisition of the Gut Microbiota of the
Honey Bee Apis mellifera. Appl Environ Microbiol. 2014; 80: 7378–7387. https://doi.org/10.1128/AEM.
01861-14 PMID: 25239900
38. Martinson VG, Moy JK, Moran NA. Establishment of characteristic gut bacteria during development of
the honeybee worker. Appl Environ Microbiol. 2012; 78: 2830–2840. https://doi.org/10.1128/AEM.
07810-11 PMID: 22307297
PLOS ONE Melezitose impacts honey bee health
PLOS ONE | https://doi.org/10.1371/journal.pone.0230871 April 10, 2020 18 / 19

39. D’Alvise P, Bohme F, Codrea MC, Seitz A, Nahnsen S, Binzer M, et al. The impact of winter feed type
on intestinal microbiota and parasites in honey bees. Apidologie. 2018; 49: 252–264. https://doi.org/10.
1007/s13592-017-0551-1
40. Edgar RC. Search and clustering orders of magnitude faster than BLAST. Bioinformatics. 2010; 26:
2460–2461. https://doi.org/10.1093/bioinformatics/btq461 PMID: 20709691
41. Edgar RC, Haas BJ, Clemente JC, Quince C, Knight R. UCHIME improves sensitivity and speed of chi-
mera detection. Bioinformatics. 2011; 27: 2194–2200. https://doi.org/10.1093/bioinformatics/btr381
PMID: 21700674
42. Lagkouvardos I, Joseph D, Kapfhammer M, Giritli S, Horn M, Haller D, et al. IMNGS: A comprehensive
open resource of processed 16S rRNA microbial profiles for ecology and diversity studies. Sci Rep.
2016; 6: 1–9. https://doi.org/10.1038/s41598-016-0001-8
43. Edgar RC. UPARSE: highly accurate OTU sequences from microbial amplicon reads. Nat Methods.
2013; 10: 996–998. https://doi.org/10.1038/nmeth.2604 PMID: 23955772
44. Wang Q, Garrity GM, Tiedje JM, Cole JR. Naive Bayesian classifier for rapid assignment of rRNA
sequences into the new bacterial taxonomy. Appl Environ Microbiol. 2007; 73: 5261–5267. https://doi.
org/10.1128/AEM.00062-07 PMID: 17586664
45. Edgar RC. MUSCLE: multiple sequence alignment with high accuracy and high throughput. Nucleic
Acids Res. 2004; 32: 1792–1797. https://doi.org/10.1093/nar/gkh340 PMID: 15034147
46. Lagkouvardos I, Fischer S, Kumar N, Clavel T. Rhea: a transparent and modular R pipeline for microbial
profiling based on 16S rRNA gene amplicons. PeerJ. 2017; 5: 2836. https://doi.org/10.7717/peerj.2836
PMID: 28097056
47. Roces F, Blatt J. Haemolymph sugars and the control of the proventriculus in the honey bee Apis melli-
fera. J Ins Physiol. 1999; 45: 221–229. https://doi.org/10.1016/s0022-1910(98)00116-4
48. Colin M.E., Ball B.V. Kilani M. Bacterial diseases. Bee Dis Diagnosis. 1999; 25: 31–59.
49. Olofsson TC, Alsterfjord M, Nilson B, Butler E, Vasquez A. Lactobacillus apinorum sp. nov., Lactobacil-
lus mellifer sp. nov., Lactobacillus mellis sp. nov., Lactobacillus melliventris sp. nov., Lactobacillus kim-
bladii sp. nov., Lactobacillus helsingborgensis sp. nov. and Lactobacillus kullabergensis sp. nov.,
isolated from the honey stomach of the honeybee Apis mellifera. Int J Syst Evol Microbiol. 2014; 64:
3109–3119. https://doi.org/10.1099/ijs.0.059600-0 PMID: 24944337
50. Zheng H, Steele MI, Leonard SP, Motta EVS, Moran NA. Honey bees as models for gut microbiota
research. Lab Anim (NY). 2018; 47: 317–325. https://doi.org/10.1038/s41684-018-0173-x PMID:
30353179
51. Corby-Harris V, Maes P, Anderson KE. The bacterial communities associated with honey bee (Apis
mellifera) foragers. PLoS ONE. 2014; 9: e95056. https://doi.org/10.1371/journal.pone.0095056 PMID:
24740297
52. Wratt EC. The Pollinating Activities of Bumble Bees and Honeybees in Relation to Temperature, Com-
peting Forage Plants, and Competition from Other Foragers. J Apic Res. 1968; 7: 61–66. https://doi.
org/10.1080/00218839.1968.11100190
53. Sparks TH, Langowska A, Glazaczow A, Wilkaniec Z, Bienkowska M, Tryjanowski P. Advances in the
timing of spring cleaning by the honeybee Apis mellifera in Poland. Ecol Entomol. 2010; 35: 788–791.
https://doi.org/10.1111/j.1365-2311.2010.01226.x
54. Fukuda H, Sekiguchi K. Seasonal change of the honeybee wirker longevity in Sapporo, North Janan,
with notes on some factores affecting the life-span. Ecol Soc Japan. 1966; 16: 206–212. https://doi.org/
10.18960/seitai.16.5_206
55. Requier F, Paillet Y, Laroche F, Rutschmann B, Zhang J, Lombardi F, et al. Contribution of European
forests to safeguard wild honeybee populations. Conserv Lett. 2019; 62: 427. https://doi.org/10.1111/
conl.12693
56. Binazzi A, Scheurer S. Atlas of the honeydew producing conifer aphids of Europe. 1st ed. Roma: Ara-
cne; 2009.
57. D’Alvise P, Seeburger V, Gihring K, Kieboom M, Hasselmann M. Seasonal dynamics and co-occur-
rence patterns of honey bee pathogens revealed by high-throughput RT-qPCR analysis. Ecol Evol.
2019; 9: 10241–10252. https://doi.org/10.1002/ece3.5544 PMID: 31624548
58. Schmickl T, Crailsheim K. Inner nest homeostasis in a changing environment with special emphasis on
honey bee brood nursing and pollen supply. Apidologie. 2004; 35: 249–263. https://doi.org/10.1051/
apido:2004019
PLOS ONE Melezitose impacts honey bee health
PLOS ONE | https://doi.org/10.1371/journal.pone.0230871 April 10, 2020 19 / 19


