
Theory of Electrochemical Kinetics based on
Nonequilibrium Thermodynamics
Martin Z. Bazant∗
Departments of Chemical Engineering and Mathematics, Massachusetts Institute of Technology,
Cambridge, Massachusetts 02139, USA
E-mail: [email protected]
CONSPECTUS
Interest in electrochemistry is surging, driven by new applications in energy conversion, water
treatment, materials processing, and biotechnology. As geometries shrink to the nanoscale, the
rate-limiting step is often ion intercalation (i.e. reversible insertion) into a host solid for transport
or storage. For example, oxygen intercalates into a ceramic electrolytes in solid oxide fuel cells,
∗To whom correspondence should be addressed
1

and lithium intercalates into carbon or metal oxide nanoparticles in Li-ion batteries. The stan-
dard phenomenological model for electrode kinetics is the Butler-Volmer equation, which fits the
current-voltage relation in many situations and can be justified (in certain limits) by the Marcus
theory of charge transfer. Existing theories, however, provide little guidance as to the form of the
exchange-current prefactor to account for configurational entropy, elastic stress, phase transforma-
tions, and other non-idealities arising in ion intercalation.
These challenges are exemplified by the high-rate cathode material, LixFePO4 (LFP), which
has a strong tendency to phase separate into Li-rich and Li-poor phases believed to limit its per-
formance. Phase separation was originally thought to occur as an isotropic “shrinking core" in
each particle, but experiments later revealed striped phase boundaries along the active surface.
Meanwhile, dramatic rate enhancement was attained with LFP nanoparticles, but no theory could
predict the role of phase separation, far from equilibrium. In this Account, a general theory of
charge transfer is described, which answers this question and provides a modeling framework for
Faradaic reactions in ionic solids and concentrated solutions.
The theory is based on non-equilibrium thermodynamics. The Butler-Volmer and Marcus the-
ories are reformulated in terms of activities and applied to lithium insertion in Li-ion batteries,
electrocatalysis in solid oxide fuel cells, and charge transfer in ionic liquids. The Nernst potential
and activation overpotential are defined variationally, consistent with Cahn-Hilliard (or Landau-
Ginzburg) phase-field models. Unlike classical models, the reaction rate depends on concentra-
tion gradients, elastic strain, and surface tension, leading to many surprising conclusions for LFP
nanoparticles. At low currents, “intercalation waves" travel across the active surface, but, above a
critical current (close to the exchange current), phase separation is suppressed in favor of homoge-
neous intercalation. Similarly, in porous electrodes, stochastic phase-transformation fronts at low
currents are broadened and stabilized at high currents. These complex phenomena can only be
described by a unified theory of electrochemical kinetics, thermodynamics and transport.
2
Introduction
Motivation. Since the seminal work of J. A. V. Butler1 and M. Volmer,2 the equation that bears
their names,
I = I0
(e−αcneη/kBT − eαaneη/kBT
)(1)
has become the standard phenomenological description of electrode kinetics.3–5 (Rather than us-
ing molar quantities, we define activities per particle and scale potentials to the thermal voltage,
kBT/e = RT/F , where kB = Boltzmann’s constant, e = elementary charge, T = temperature.) The
Butler-Volmer (BV) equation relates the total current I due to the Faradaic reaction, O+ne−→ R,
which converts the oxidized state O to the reduced state R and consumes n electrons, to the ex-
change current I0 and overpotential η = ∆φ −∆φ eq, where ∆φ is the interfacial voltage whose
Nernst equilibrium value is ∆φ eq. For a simple single-step charge-transfer reaction, the anodic and
cathodic charge-transfer coefficients αa and αc should satisfy αa = 1−α and αc = α with a sym-
metry factor, 0 < α < 1, although the same form is often fitted to more complicated experimental
voltage dependence.
The microscopic theory of charge transfer,6 pioneered R. A. Marcus in 19567,8 and honored
by the Nobel Prize in Chemistry,9 provides partial justification for the BV equation and a means
to estimate its parameters.3 The key quantity controlling I0 and α is the reorganization energy of
the solvent upon charge transfer. The theory has been given a quantum mechanical basis by V.
G. Levich, R. R. Dogonadze, A. M. Kuznetsov, J. Ulstrup and many others.6 Marcus theory has
been widely applied to dilute solutions, where charge transfer occurs between isolated reactants,
but provides little guidance on how to describe correlations in concentrated solutions.
In popular Li-ion battery models,5,10–13 excluded volume effects are described by an extra
concentration factor,
I0(c) = k(cmax− c)αccαa (2)
where cmax is the maximum concentration. The Nernst potential ∆φ eq(c) is fitted to the battery
open circuit voltage, and the chemical diffusivity Dchem(c) of Li in the solid is adjusted to fit
3
discharge data. In a thermodynamically consistent theory, however, these properties are not inde-
pendent and should all derive from the lithium activity.
A more systematic approach could be based on non-equilibrium thermodynamics14,15 and
phase-field models.16 A number of groups have recently made important progress in this direc-
tion for electrochemical systems17–25 and electrokinetic phenomena,26–34 but without consistently
reformulating reaction kinetics. This Account summarizes my struggle to develop such a theory
over the past five years,26,35–43 combining charge-transfer theory6 with concepts from statistical
physics44,45 and non-equilibrium thermodynamics.14–16
Advances in Li-ion batteries increasingly rely on controlling electrochemistry at the nanoscale
.46–49 This trend is well illustrated by lithium iron phosphate, LixFePO4 (LFP), which provided
the motivation for my work. In the first LFP paper in 1997, Padhi et al.50 concluded that “the ma-
terial is very good for low-power applications" but “at higher current densities there is a reversible
decrease in capacity that... is associated with the movement of a two-phase interface" (between
Li-rich and Li-poor phases). Largely due to shrinking the particle size below 100nm, however, LFP
has become the most popular high-power cathode material,51,52 capable of 10 second discharge.53
Explaining this incredible reversal of fortune turned out to be a major scientific challenge.
We now understand that phase separation is strongly suppressed in LFP nanoparticles, to
some extent in equilibrium,39,41,54 but especially under applied current,40,41,55,56 since reaction
limitation,37 anisotropic lithium transport,57,58 elastic coherency strain,41,43,59,60 and surface en-
ergy40,61,62 are enhanced. At low currents, however, anisotropic nucleation and growth can also
occur in nanoparticles,37,40,41,63 leading to stochastic multi-particle intercalation.42,64–66 These
phenomena could not be described by traditional battery models,5,10 where the voltage plateau is
fitted empirically and the phase boundary is artificially placed, as a spherical “shrinking core".12,13
In order to develop a predictive model of intercalation in LFP nanoparticles,41 it was necessary to
develop a phase-field theory of electrochemical kinetics,26,35,40 which is the focus of this Account.
History of this Work. I still remember the day in 2006 when my postdoc, Gogi Singh,
brought me the paper of Chen et al. 67 revealing striped phase boundaries in LFP, looking nothing
4

like a shrinking core. The images suggested phase boundary motion perpendicular to the lithium
flux, which, I realized, could not be described by standard chemical kinetics, since the reaction rate
would need to depend on concentration gradients. Our collaborator, G. Ceder, suggested adapting
the CH model for bulk phase separation,20 but it took several years to achieve a consistent theory.
Our initial model predicted intercalation waves,36–38 but did not uphold the De Donder relation,44
as became clear from K. Sekimoto and D. Lacoste at ESPCI in Paris. It was there in 2007, while on
sabbatical leave, that I first succeeded at generalizing BV kinetics to concentrated solutions. I spent
the next year developing dynamical models of concentrated electrochemical systems,26 not only in
batteries and fuel cells, but also induced-charge electrokinetics.68–70 In spring 2009, I synthesized
the theory in lecture notes35,71 and published the generalized BV equation26 (Sec. 5.4.2).
The theory has enabled breakthroughs in modeling phase-separating battery electrodes. D.
Burch used a thermodynamically consistent “Cahn-Hilliard-Reaction" model to study intercala-
tion in nanoparticles39 (with α = 0), without connections to the battery voltage. His Ph.D. the-
sis66 included early simulations of multi-particle phase separation and “mosaic instability" .64,65
Simulations of galvanostatic discharge by P. Bai and D. A. Cogswell led to a theory of the suppres-
sion of phase separation in nanoparticles,40 first reported in 2010,72,73 which Cogswell extended
for coherency strain.41 T. R. Ferguson did the first simulations of phase separation and voltage
hysteresis in porous electrodes.42
This Account provides an overview of the theory and its key predictions. A thermodynamic
framework for reaction kinetics and diffusion is applied to Faradaic reactions, and the resulting
BV model given microscopic justification via a reformulation of Marcus theory. The theory is then
applied to Li-ion batteries, solid-oxide fuel cells, and ionic liquids. Finally, the theory is used to
relate electrode kinetics to thermodynamic variational principles and applied to phase-separating
battery materials.
5

Reaction Kinetics in Concentrated Solutions
Nonequilibrium thermodynamics. The theory begins with the diffusional chemical potential of
species i,
µi = kBT lnci +µexi = kBT lnai (3)
where ci is the concentration, ai is the absolute chemical activity, µexi = kBT lnγi is the excess
chemical potential in a concentrated solution, and γi is the activity coefficient (ai = γici). In lin-
ear irreversible thermodynamics (LIT),14–16 the flux of species i is proportional to its chemical
potential gradient,
Fi =−Mici∇µi =−Di
(∇ci + ci∇
µexi
kBT
)=−Dchem
i ∇ci (4)
where Di is the tracer diffusivity, Mi = Di/kBT is the mobility (using the Einstein relation), and
−∇µexi is the thermodynamic driving force beyond ideal diffusion (first term). The chemical dif-
fusivity, Dchem, differs from the tracer diffusivity by the thermodynamic factor,5
DchemiDi
= 1+ci
γi
∂γi
∂ci= 1+
∂ lnγi
∂ lnci. (5)
By including the mean electrostatic energy (zieφ below) in the electro-chemical potential, this ap-
proach has been widely used to describe concentrated solutions in batteries5,10,13,21–25 and double-
layer electrokinetic phenomena.26–34
As shown in Eq. (4) and Eq. (5), the total flux has two contributions: (i) free diffusion driven
by concentration gradients (Fick’s law), and (ii) migration induced by gradients in excess chemical
potential. In probability theory, the former is the fundamental Wiener process, while the latter is
a drift, described by Ito or Stratonovich differentials.45 In stochastic kinetics,6,45,74 the reaction
complex makes random transitions between local minima in an energy landscape, U(x), which is
independent of temperature and neglects many-body interactions. To account for thermal effects,
transition state theory for solids75,76 introduces harmonic contributions to the many-body poten-
6

tial energy, analogous to “structural relaxation" in Marcus theory3,9 (discussed below). What is
missing in this approach, however, is the effect of configurational entropy or other non-idealities
contained in µex(x), which may be obtained from finite-temperature molecular simulations.76
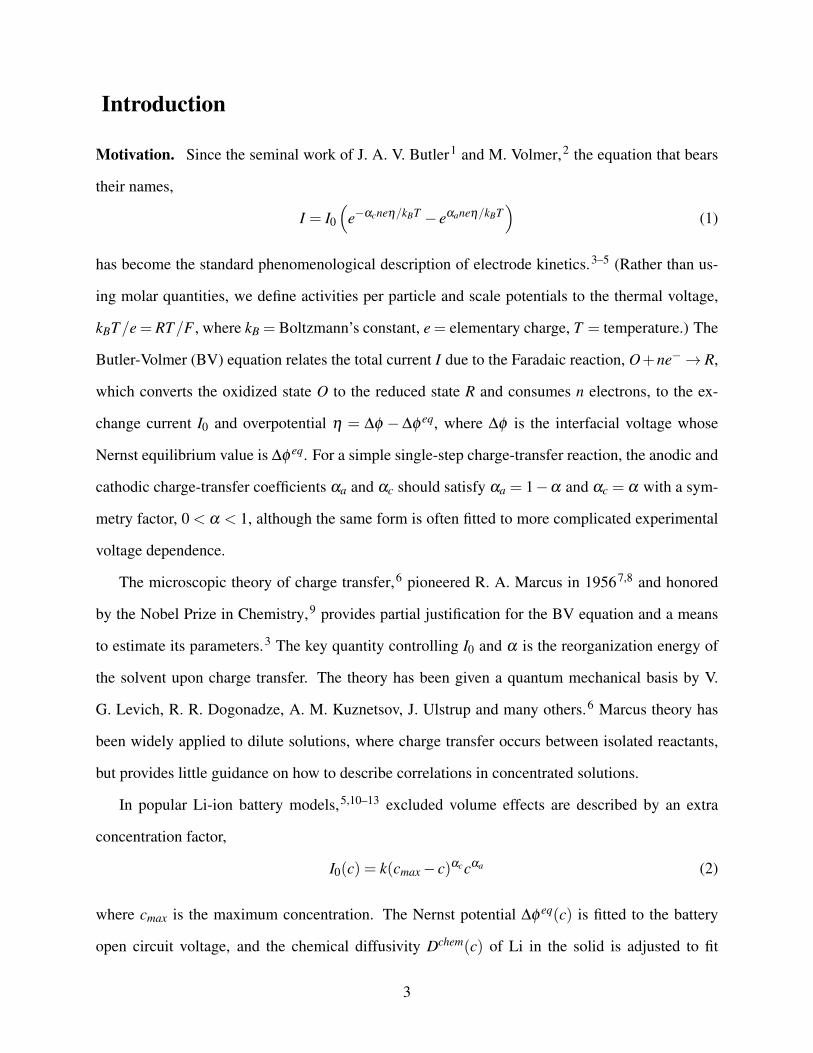
In a thermodynamically consistent formulation of reaction kinetics,35,44 therefore, the reaction
complex explores a landscape of excess chemical potential µex(x) between local minima µex1 and
µex2 with transitions over an activation barrier µex
‡ (Figure 1(a)). Assuming long-lived states with
rare transitions (µex‡ −µex
i kBT ), the net reaction rate is given by
R = R1→2−R2→1
= ν
[c1e−(µ
ex‡ −µex
1 )/kBT − c2e−(µex‡ −µex
2 )/kBT]
= ν
[e−(µ
ex‡ −µ1)/kBT − e−(µ
ex‡ −µ2)/kBT
](6)
=ν(a1−a2)
γ‡
which automatically satisfies the De Donder relation,44 µ1− µ2 = kBT ln(R1→2/R2→1). The fre-
quency prefactor ν depends on generalized force constants, ki =∂ 2µex
∂x2i
, or effective lengths `i =√2πkBT
ki, at the saddle point and in one minimum (e.g. state 1, with a suitable shift of µex
‡ ). Ex-
tending Kramers’ escape formula45,77 to N reaction coordinates x1, ...,xN , we find
ν =k‖∏
Ni=1 kmin
i
2πζ f ∏N−1j=1 k⊥j
=D f ∏
N−1i=1 L⊥i
L‖∏Ni=1 Lmin
i(7)
where kmini are curvatures at the minimum (normal modes), k⊥j are positive, transverse saddle cur-
vatures, and −k‖ is the negative saddle curvature parallel to the transition path. The rate increases
with kmini (due to faster vibrations and thus more frequent escape attempts) and k⊥ (due to less
time spent near the saddle), and decreases with k⊥j (due to fewer trajectories captured with kBT
of the saddle). The effect of k⊥ from stochastic kinetics45 is missing in classical transition state
theory,75,76 but it is often negligible in charge-transfer reactions,6,78 due to the Franck-Condon
principle that electron transfer occurs suddenly when vibrational states overlap (or at an even lower
7
(a) x1x2 x†
µex1
µex2
µex†
12
x
µex
(b)
† 2
1
(c)
†1 2
Figure 1: Reaction kinetics in concentrated solutions. (a) The reaction complex moves in a land-scape of excess chemical potential from state 1 to state 2 over a barrier (transition state). (b) Surfaceadsorption (or intercalation in a solid solution) from a liquid, where the transition state excludess > 1 particle volumes as in Eq. (13), e.g. to accommodate the shedding of the solvation shell.(c) Activated diffusion on a surface (or in a solid solution), where the transition state excludes twoparticle sites and thus Eq. (15) reduces to Eq. (16).
8
energy, below the saddle point, due to quantum tunneling). This concept is the basis for Marcus
theory below. In a liquid, the friction coefficient can be estimated by the Stokes-Einstein relation,
ζ f =kBTD f≈ 6πηa, where η is the shear viscosity and a is the molecular size.74
For the general reaction,
S1 = ∑i
siMi→∑j
s jM j = S2, (8)
the activities,
a1 = ∏i
asii and a2 = ∏
jas j
j , (9)
are equal in equilibrium, and the forward and backward reactions are in detailed balance (R = 0).
The equilibrium constant is thus the ratio of the reactant to product activity coefficients:
K =c2
c1=
∏ j cs jj
∏i csii=
∏i γsii
∏ j γs jj=
γ1
γ2= e(µ
ex1 −µex
2 )/kBT = e−∆Gex/kBT (10)
where ∆Gex is the excess free energy change per reaction. In order to describe reaction kinetics,
however, we also need a model for the transition state activity coefficient γ‡, in Figure 1).
The subtle difference between total and excess chemical potential is often overlooked in chem-
ical kinetics. Lai and Ciucci,23–25 who also recently applied non-equilibrium thermodynamics to
batteries, start with the same flux relation, Eq. (4), but postulate a Faradaic reaction rate based on
a barrier of total (not excess) chemical potential. The equilibrium condition (Nernst equation) is
the same, but the rate (exchange current) is different and does not consistently treat the transition
state. These concepts become more clear for adsorption phenomena without charge transfer, as we
now illustrate.
Surface or solid intercalation. Consider surface adsorption from a liquid, or, equivalently, in-
tercalation in the surface layer of a solid solution (Figure 1(b)). The standard approach in chemistry
is to write the reaction as M +Vs→Ms, where Vs is a vacant surface site, and assume first-order
kinetics,
R = k [KcM(1− c)− c] , (11)
9

where c is now the surface coverage (or solid filling fraction), K = eEa/kBT is the equilibrium con-
stant and Ea the adsorption energy. In detailed balance, R = 0, this implies a Langmuir isotherm,
ceq = KcM/(1+KcM).
In our approach, rather than assigning a chemical identity to the vacancy, we consider the
reaction M → Ms. In order to recover the Langmuir isotherm from the equilibrium condition,
µ1 = µ2, we write diffusional chemical potentials for species M in the liquid, µ1 = kBT ln(KcM)
(as a dilute solution), and on the surface,
µ2 = kBT lnc
1− c, or γ =
11− c
(12)
as a lattice gas, or ideal solid solution.16 We then consistently model µex‡ . For example, if the
transition state has energy E‡ relative to the adsorbed state and excludes a volume s ≥ 1 surface
sites (not necessarily an integer), e.g. while shedding a solvation shell, then
µex‡ = E‡− skBT ln(1− c), or γ‡ =
eE‡/kBT
(1− c)s . (13)
Plugging into Figure 1, we obtain the reaction rate,
R = k[KcM(1− c)s− c(1− c)s−1] , where k = νe−E‡/kBT , (14)
which differs from Eq. (11) if s 6= 1. In this simple case, for integer s, a similar form follows
from Flory-Huggins kinetics4 with a higher-order vacancy reaction, M+ sVs→Ms+(s−1)Vs, but
the general theory is needed for more complicated situations. For example, if adsorption occurs
between disordered liquid and solid states, then the excluded volume cannot be treated as a distinct
chemical species, but one could still use hard-sphere models for the excess chemical potentials in
the present theory, as illustrated below.
Surface or solid diffusion. On a surface or in a solid solution, diffusion occurs by thermally
activated hopping between adjacent sites76 (Figure 1(c)). The flux Fi = −R/As through a cell
10
area As follows from Figure 1 by linearizing a2−a1 ≈ ∆x ∂a∂x . Comparing with Eq. (4), the tracer
diffusivity is given by
Di =ν∆x2γ
γ‡, (15)
In an ideal solid solution (Eq. (12)), the transition state excludes two sites (s = 2 in Eq. (13)) before
and after the hop. The tracer diffusivity Eq. (15) then scales with the density of vacancies,
Di = D0i (1− c), where D0
i = ν∆x2e∆E‡/kBT (16)
is the tracer diffusivity in a dilute solution. Due to a remarkable cancellation, the chemical diffu-
sivity (Eq. (5)) is constant,
Dchemi =
Di
1− c= D0
i (17)
and equal to the dilute-limit tracer diffusivity of particles or vacancies. Nauman79 made thermo-
dynamic arguments to show that the (1− c) factor in Eq. (16) should appear in the Cahn-Hilliard
equation (discussed below), and here we see it follow from our reaction model Figure 1. This
factor should also appear in the modified Poisson-Nernst-Planck equations for a solid solution.31
Butler-Volmer Kinetics in Concentrated Solutions
For the general electrode reaction,
S1 = OzO +ne−→ RzR = S2 (18)
we write µ1 = µO+nµe and µ2 = µR, where charge conservation implies zO−n = zR. We decom-
pose the electro-chemical potential into chemical and electrostatic contributions,
µi = kBT lnai + zieφi = (kBT lnci + zieφi)+µexi (19)
11

where the term in parentheses describes an ion of charge zie in a mean potential φi in a dilute
solution, and µexi = kBT lnγi is the excess chemical potential. The electrostatic potential of the
electrode is φe, while that of the electrolytic solution is φ . The difference is the interfacial voltage,
∆φ = φe−φ .
(a)$ OzOs(s )
RzRs(s)
ne−
φφe electrode$$|$$solu/on$
OzOe(e)
RzRe(e)
(b)$ OzO
RzR
(c)$ OzO
RzR
ne−
ne−
Figure 2: Types of Faradaic reactions. (a) The most general reaction involving reduced and oxi-dized molecules, each split between the electrode and the electron-free electrolytic solution. (b)Redox reaction in solution. (c) Insertion or electrodeposition, where the reduced state lies insideor on the surface of the electrode, respectively.
The electric field E = −∇φ at point is unique, so the potential φi of species i depends its
position with respect to the interface. By definition, the electrons come from the electrode with
potential φe, but ions can exist in either position. In the most general Faradaic reaction (Fig-
ure 2(a)), the reduced and oxidized states can be split between the electrode and solution phases,
OzO = OzOe(e) +OzOs
(s) and RzR = RzRe(e) +RzRs
(s) , if the electrode is a mixed ion-electron conductor. The
12

solution species, OzOs(s) and RzRs
(s) , are at potential φ and electrode species, OzOe(e) and RzRe
(e), are at poten-
tial φe. Charge conservation implies zOe+ zOs−n = zRe+ zRs. The net charge nce transferred from
the solution to the electrode is given by
nc = zOs− zRs = zRe− zOe +n. (20)
In this Account, we focus on situations where the oxidized state exists only in the solution (zOe =
0). In the simplest case of a redox reaction in solution (Figure 2(b)), there are no ions in the
electrode and thus nc = n. In electrodeposition, the reduced state is a neutral species on the surface
(zR = 0), so nc = n = zO. For cation insertion (Fig. Figure 2(c)), the reduced state is an intercalated
ion, and the charge transferred across the interface is nc = zO.
In many cases, the interfacial charge transfer is equal to the number of electrons, nc = n, and
we can set φR = φO = φ without loss of generality, due to neutral reactants or products. Besides
electrodeposition, we shall consider lithium ion insertion in a neutral crystal (nc = n = 1, zR = 0)
and oxygen reduction in a solid electrolyte (nc = n = −zR = 2, zO = 0). For this broad class of
Faradaic reactions, the electrochemical potentials of the species in Eq. (18) are
µO = kBT lnaO + zOeφ (21)
µR = kBT lnaR + zReφ (22)
µe = kBT lnae− eφe (23)
where µe is the chemical potential of electrons, or Fermi level. The electron activity ae = γece
accounts for the concentration of free electrons ce (density of states), as well as shifts in the Fermi
level via γe, due to applied stress, phase transformations, donor or acceptor ions, etc. as illustrated
below for semiconducting electrodes.
In equilibrium (µ1 = µ2), the interfacial voltage, ∆φ = φe−φ , satisfies the Nernst equation
∆φeq =
kBTnce
lnaOan
eaR
(24)
13

where nc = n. Out of equilibrium, the current I = neAR (where A = electrode area) is related to
the local (activation, or surface) over-potential,
η = ∆φ −∆φeq (25)
Specific models of charge transfer correspond to different choices of µex‡ .
In order to generalize Butler-Volmer kinetics, we approximate the mean electrostatic energy of
the transition state as a linear combination of those of the initial and final states:
µex‡ = kBT lnγ‡ +αa(zOeφ −neφe)+αczReφ (26)
If, for consistency, the electric field is constant across the reaction coordinate x from xR to xO past
the transition state at xR < x‡ < xO, then the transfer coefficients, αa = 1−α and αc = α , are
related to the symmetry factor,4
α =x‡− xR
xO− xR= αc = 1−αa, (27)
which acts as a Brønsted coefficient.6
Substituting Eq. (24)-Eq. (27) into Figure 1, we obtain the BV equation Eq. (1) with
I0 =νneA(aOan
e)1−αaα
Rγ‡
=[νneA(cOcn
e)1−αcα
R][(γOγn
e )1−αγα
Rγ‡
](28)
The first factor is the classical formula,3–5 but this is only valid for dilute solutions (γO = γR = γ‡ =
γe = 1). The second factor modifies the exchange current for concentrated solutions. In summary,
the Faradaic current I is related to the interfacial voltage ∆φ and the various chemical activities aO,
aR, ae, and γ‡ by Eq. (1), Eq. (24), Eq. (25), and Eq. (28).
14

Marcus Theory for Concentrated Solutions
Just as we have reformulated the phenomenological Butler-Volmer model for concentrated solu-
tions, so it is also possible to adapt the microscopic theory of charge transfer. The basic idea
(Figure 3) is that the Faradaic reaction Eq. (18) occurs when the excess chemical potential of the
reduced state, deformed along the reaction coordinate by statistical fluctuations, equals that of the
oxidized state (plus n electrons in the electrode) at the same point. More precisely, charge transfer
occurs randomly at somewhat lower energies due to quantum tunneling.3,6
As a first approximation,3,6 we postulate harmonic restoring potentials for structural relaxation
(e.g. shedding of the solvation shell from a liquid, or extraction from a solid) along the reaction
coordinate x from the oxidized state at xO to the reduced state at xR:
µex1 (x) = kBT ln(γOγ
ne )+ zOeφ −neφe +
kO
2(x− xO)
2 (29)
µex2 (x) = kBT lnγR + zReφ +
kR
2(x− xR)
2 (30)
The Nernst equation Eq. (24) follows by equating the chemical potentials at the local minima,
µ1(xO) = kBT ln(cOcne)+µex
1 (xO) = kBT lncR +µex2 (xR) = µ2(xR) in equilibrium. The free energy
barrier is set by the intersection of the excess chemical potential curves for the initial and final
states,
µex‡ = µ
ex1 (x‡) = µ
ex2 (x‡), (31)
which is an implicit equation for the barrier position, x = x‡. Combining Eq. (25), Eq. (24), and
Eq. (31) we obtain
neη− kBT lncR
cOcne=
kO
2(x‡− xO)
2− kR
2(x‡− xR)
2 = µex2 (xR)−µ
ex1 (xO) = ∆Gex (32)
where ∆Gex is the excess free energy change per reaction. The overpotential is the total free energy
15

xOxR x†
µexO + nµe
µexR
µex†
O + ne−
R
x
µex
e−
e−
Figure 3: Above: The Faradaic reaction O+ne−→ R in concentrated electrolyte and/or electrodesolutions. The reactants fluctuate in a landscape of excess chemical potential µex, shown along afavored reaction coordinate x. Charge transfer occurs whenever the oxidized state O with n freeelections or the reduced state R reaches the transition state. Below: Illustration of these states forion reduction by intercalation into a solid-solution electrode from a liquid electrolyte.
16
change per charge transferred,
neη = ne∆φ − kBT lnaOan
eaR
= µ2(xO)−µ1(xR)≡ ∆G (33)
where
∆G = neη = ∆Gex + kBT lncR
cOcne
(34)
is the thermodynamic driving force for the reaction. Note that in classical Marcus theory,3,9
the overpotential is defined by neη = ∆Gex without the concentration factors required by non-
equilibrium thermodynamics. This is correct for charge-transfer reactions in bulk phases, e.g.
A−+B→ A+B−, because the initial and final concentrations are the same, and thus ∆G = ∆Gex =
∆G0 (standard free energy of reaction). For Faradaic reactions at interfaces, however, the concen-
trations of reactions and products are different, and Eq. (34) must be used. The missing “Nernst
concentration term" in Eq. (34) is also noted by Kuznetsov and Ulstrup (p. 219) in their quantum-
mechanical theory of electrochemical kinetics.6
Following Marcus, we solve Eq. (32) for x‡ and substitute into Eq. (31) in order to relate µex‡
to η . In the simplest case of symmetric relaxation, kO = kR = k, we find,
µex‡ = kBT ln(γOγ
ne )+ zOeφ −neφe +
λ
4
(1+
∆Gex
λ
)2
(35)
= kBT lnγR + zReφ +λ
4
(1− ∆Gex
λ
)2
(36)
where
λ =k2(xO− xR)
2 (37)
is the “reorganization energy". The barriers for the cathodic and anodic reactions are,
∆Gexc =
λ
4
(1+
∆Gex
λ
)2
(38)
∆Gexa =
λ
4
(1− ∆Gex
λ
)2
(39)
17
respectively. Substituting µex‡ into Figure 1, the current I = neAR is given by
I = I0e(neη)2/4kBT λ
(e−αneη/kBT − e(1−α)neη/kBT
)(40)
which has a stronger nonlinear dependence on overpotential than in the Butler-Volmer equation.
The exchange current,
I0 = neAe−λ/4kBT (cOcne)
1−αcαR , (41)
and symmetry factor,
α =12
(1− kBT
λ
)(42)
are both related to the reorganization energy λ . In the typical case, λ kBT (for thermally stable
solvation), the symmetric factor is α ≈ 12 , and the current Eq. (40) is well approximated by the
Butler-Volmer equation up to fairly large overpotentials, |η | kBTne
√λ
kBT . Comparing Eq. (41)
with Eq. (28), we can relate the reorganization energy to the activity coefficients defined above,
λ
4= kBT ln
γ‡
(γOγne )
1−αγαR= (1−α)∆Gex
c +α∆Gexa (43)
which is an average barrier for the cathodic and anodic reactions, weighted by the symmetry factor.
In a dilute solution, the reorganization energy λ0 can be estimated by the classical Marcus
approximation, λ0 = λi +λo, where
λi = ∑m
km
2(qO,m−qR,m)
2 (44)
is the “inner" or short-range contribution from structural relaxation (sum over normal modes) and
λo is the “outer", long-range contribution from dielectric relaxation of the solvent.3,9 In the Born
approximation, the latter is given by
λo =(ne)2
8π
(1a− 1
R
)(1
εop− 1
εs
)(45)
18

for a Faradaic reaction at a flat metal electrode, where εs is the (static) permittivity of the bulk
solvent, a is the radius of the solvation shell with (optical) permittivity εop, and R is twice the
separation of the ion from the electrode (charge-image distance). Since λo = (0.5−1.0)n2 eV
kBT for polar solvents at room temperature, the large barrier Eq. (34) implies that single-electron
(n = 1), symmetric (α ≈ 12 ) charge transfer is favored. Many quantum mechanical expressions for
λ0 are also available.6
In a concentrated solution, we can use various models below to estimate the thermodynamic
correction, γc‡ , due to entropic and enthalpic effects in the transition state. The exchange current
can then be modeled by Eq. (28) with
γ‡ = γc‡eλ0/4kBT . (46)
where α given by Eq. (42) with λ = λ0. For example in surface adsorption, if the transition state
excludes s sites, γc‡ = (1− c)−s, then Eq. (46) reduces to Eq. (13) with E‡ = λ0
4 , consistent with
Eq. (43). This approach provides a thermodynamically consistent way to model the combined
effects of solvation, structural relaxation, enthalpy and entropy on charge transfer kinetics in a
concentrated solution, ionic liquid or solid.
The compositional effects predicted by the general theory are crucial for deposition or inter-
calation reactions (Figure 4). Dilute solution approximations are widely used to model electrode-
position80 (Figure 4(a)), but our formulation of electrode kinetics enables the use of phase-field
models (below), which are convenient for simulating electrodeposition17,18,81–83 with dendritic
growth.84–87 With fixed interfaces, the general theory is also required for a thermodynamically
consistent treatment of ion intercalation in solid solutions.39–41
Ion Intercalation in Solid Solutions
Lithium insertion. The canonical example is reversible lithium insertion, Li++e− →Li(s), in
a solid host35,49 (Figure 4(b)). Although lithium ions often remain charged after insertion, they
19
(b)$
Li+e−
φφe
(a)$
Cu2+
(c)$ O02
(Li+M-)0
Cu0
e−
e−
electrode$|$$electrolyte$
e−
M
Cu
LSM YSZ
O0ads O0
ads
O−
O2−
e−
gas
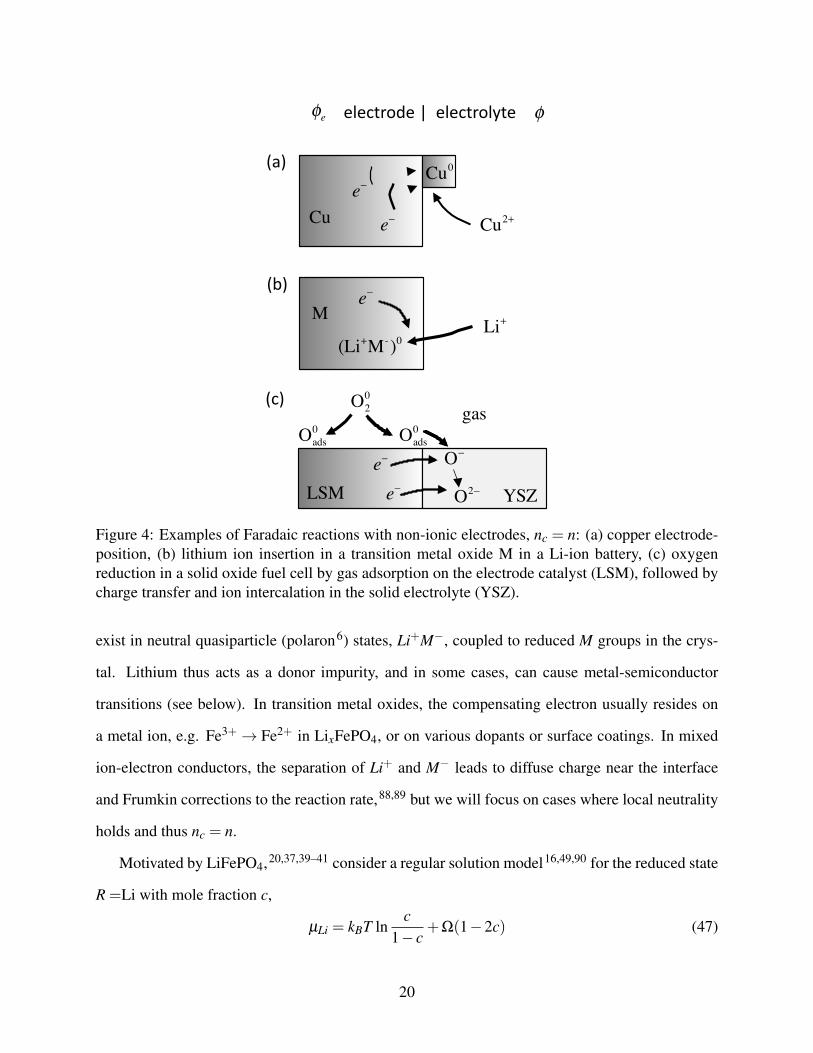
Figure 4: Examples of Faradaic reactions with non-ionic electrodes, nc = n: (a) copper electrode-position, (b) lithium ion insertion in a transition metal oxide M in a Li-ion battery, (c) oxygenreduction in a solid oxide fuel cell by gas adsorption on the electrode catalyst (LSM), followed bycharge transfer and ion intercalation in the solid electrolyte (YSZ).
exist in neutral quasiparticle (polaron6) states, Li+M−, coupled to reduced M groups in the crys-
tal. Lithium thus acts as a donor impurity, and in some cases, can cause metal-semiconductor
transitions (see below). In transition metal oxides, the compensating electron usually resides on
a metal ion, e.g. Fe3+→ Fe2+ in LixFePO4, or on various dopants or surface coatings. In mixed
ion-electron conductors, the separation of Li+ and M− leads to diffuse charge near the interface
and Frumkin corrections to the reaction rate,88,89 but we will focus on cases where local neutrality
holds and thus nc = n.
Motivated by LiFePO4,20,37,39–41 consider a regular solution model16,49,90 for the reduced state
R =Li with mole fraction c,
µLi = kBT lnc
1− c+Ω(1−2c) (47)
20

where the first term is the configurational entropy and the second the enthalpy of mixing (setting
µ = 0 at half filling as a reference). The Nernst potential (Eq. (24)) is
∆φ(c) = ∆φ0− µLi(c)
e+
kBTe
lnae(c) (48)
and, for insertion at the cathode, the open circuit voltage of the battery is VO(c) = ∆φ(c)−∆φanode.
Suppose the transition state excludes s sites (where s > 1 accounts for the Li+ solvation shell) and
has reorganization energy λ0, so that Eq. (46) implies E‡ = λ04 in Eq. (13). The exchange current
Eq. (28) then takes the form,
I0(c) = eA(a+ae(c))1−αcα(1− c)s−α exp(
4αΩ(1−2c)−λ0
4kBT
)(49)
where a+ is the Li+ activity in the electrolyte.
This example illustrates how our theory unifies charge-transfer reaction kinetics, equilibrium
thermodynamics, and ion transport in a single thermodynamic framework. In contrast, exist-
ing porous electrode theories for Li-ion batteries5,10,11,13 contain thermodynamic inconsistencies.
Doyle et al.10 assume the rate expression Eq. (2) for polymer insertion,91 which corresponds to
Eq. (49) with a+ = ae = 1, Ω = 0, and s = 1 (with αc = α and αa = 1−α also reversed). The
electrolyte activity a dilute solution, a+ = c+ has also been included,13 but all of these models are
inconsistent with the use of concentrated solution models(a+ 6= c+) to fit experimental data. An-
other common inconsistency is that the open circuit voltage, VO(c), is fitted independently, when
it should be related to the local activities of ions in solid solution Eq. (47) in both the Nernst equa-
tion, Eq. (48), and the exchange current density, Eq. (49). It is also inconsistent to model solid
diffusion by Fick’s law with a fitted nonlinear diffusivity, rather than using ionic activity gradients
in Eq. (4), consistent with VO(c) and I0(c).
Semiconducting insertion electrodes. The electron activity, ae(c), generally depends on
the local ion concentration. This effect is often negligible in mixed ion-electron conductors with
ae ≈ 1, but it is important in semiconducting insertion electrodes with poor intrinsic electron
21

conductivity. Important examples include amorphous silicon (a-Si), a high-energy-density an-
ode material,46,92,93 and tungsten bronze (LicWO3), an electrochromic material.94–96 Since Li
acts as an electron donor impurity, the density of free electrons increases with lithium filling as
ρe = ρ0e + cρs pd , where ρs is the density of intercalation sites, and pd is the probability that Li
donates a delocalized electron to the conduction band. Assuming a simple free electron model in
d dimensions, the electron activity is given by
ae(c) ∝ exp(
E f (c)kBT
), (50)
in terms of the Fermi energy,
E f (c) =h2
αd(ρ0e + cρs pd)
2/d
2m∗(51)
where m∗ is the effective mass of electrons in the conduction band and αd is a constant (α1 = π2,
α2 = 2π , and α3 = (3π2)2/3).
There are many interesting cases. For metals, we can set ae ≈ constant, due to the large density
of intrinsic electron states, ρ0e ρs. In the case of an ideal solid solution (Eq. (47) with Ω = 0)
in a three-dimensional semiconductor (ρ0e = 0,d = 3), we recover the model of Raistrick and
Huggins49,96 for the open circuit voltage of LicWO3 using Eq. (50) and Eq. (51) in the Nernst
equation Eq. (48). In contrast to prior Butler-Volmer models of coloration dynamics in tungsten
bronze,94,95 however, our theory shows how to consistently formulate insertion kinetics (Eq. (49))
and transport (Eq. (4)). The theory also predicts different lithium concentration dependence for
electrode kinetics in anisotropic low-dimensional electron conductors, such as graphene flakes (d =
2) and silicon or carbon nanotubes (d = 1), which are increasingly used in battery electrodes.46,93
In the preceding analysis, we have neglected diffuse charge (or space charge) in the solid, which
is valid only once the doping by ion insertion has moved the Fermi level well into the conduction
band (∆E kBT ). In a more general treatment of the depleted/insulator state, intercalated ions
and/or electron holes at potential φe also participate in the reaction (Figure 2(a)). However, this
22
requires also describing electrostatics and transport (via Poisson-Nernst-Planck equations) in the
electrode and electrolyte phases, as outlined below, and results in Frumkin corrections to Butler-
Volmer kinetics.88,89
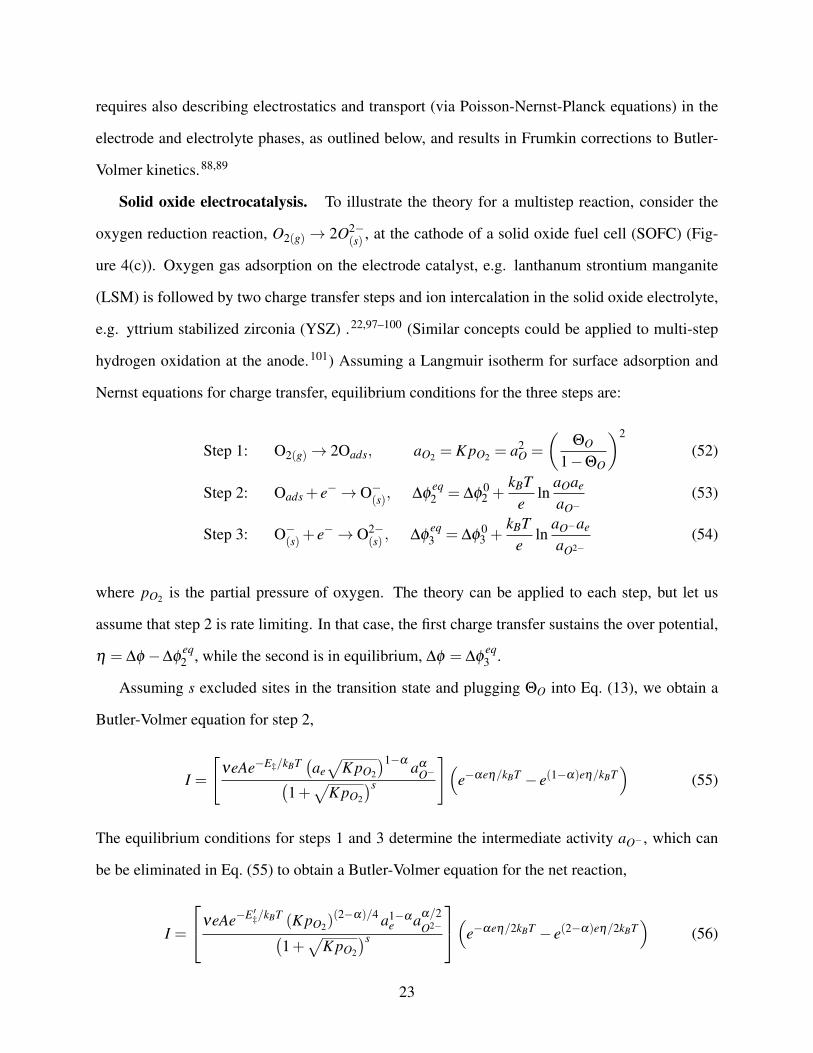
Solid oxide electrocatalysis. To illustrate the theory for a multistep reaction, consider the
oxygen reduction reaction, O2(g)→ 2O2−(s) , at the cathode of a solid oxide fuel cell (SOFC) (Fig-
ure 4(c)). Oxygen gas adsorption on the electrode catalyst, e.g. lanthanum strontium manganite
(LSM) is followed by two charge transfer steps and ion intercalation in the solid oxide electrolyte,
e.g. yttrium stabilized zirconia (YSZ) .22,97–100 (Similar concepts could be applied to multi-step
hydrogen oxidation at the anode.101) Assuming a Langmuir isotherm for surface adsorption and
Nernst equations for charge transfer, equilibrium conditions for the three steps are:
Step 1: O2(g)→ 2Oads, aO2 = K pO2 = a2O =
(ΘO
1−ΘO
)2
(52)
Step 2: Oads + e−→ O−(s), ∆φeq2 = ∆φ
02 +
kBTe
lnaOae
aO−(53)
Step 3: O−(s)+ e−→ O2−(s) , ∆φ
eq3 = ∆φ
03 +
kBTe
lnaO−ae
aO2−(54)
where pO2 is the partial pressure of oxygen. The theory can be applied to each step, but let us
assume that step 2 is rate limiting. In that case, the first charge transfer sustains the over potential,
η = ∆φ −∆φeq2 , while the second is in equilibrium, ∆φ = ∆φ
eq3 .
Assuming s excluded sites in the transition state and plugging ΘO into Eq. (13), we obtain a
Butler-Volmer equation for step 2,
I =
[νeAe−E‡/kBT (ae
√K pO2
)1−α aα
O−(1+√
K pO2
)s
](e−αeη/kBT − e(1−α)eη/kBT
)(55)
The equilibrium conditions for steps 1 and 3 determine the intermediate activity aO− , which can
be be eliminated in Eq. (55) to obtain a Butler-Volmer equation for the net reaction,
I =
νeAe−E ′‡/kBT (K pO2)(2−α)/4 a1−α
e aα/2O2−(
1+√
K pO2
)s
(e−αeη/2kBT − e(2−α)eη/2kBT)
(56)
23

where E ′‡ = E‡ +α
2 (∆φ 03 − ∆φ 0
2 ). The exchange current has the typical “volcano" dependence
of electrocatalysis: The rate increases with K pO2 at low pressure and small adsorption energy,
Ea = kBT lnK, as (K pO2)(2−α)/4, but then decreases at high pressure or high adsorption energy
due to surface saturation, as (K pO2)−s/2. For α = 1
2 and s = 1, the scaling exponents are 38 and
−12 , respectively. The cathodic transfer coefficient is αc = α/2, so, even if the rate limiting step is
symmetric (α = 12 ), the net reaction appears to be asymmetric (αc =
14 ) .4,5
Ionic liquids. As in ionic crystals, crowding effects are also important in solvent-free ionic
liquids. Important examples include molten salts in liquid metal batteries102 and aluminum smelt-
ing103 and room-temperature ionic liquids (RTIL) in chemical synthesis104 and capacitive energy
storage.105,106 In spite of liquid disorder, solid-solution models for the configurational entropy
have been applied to RTIL,30,34,107 in which case Faradaic reactions could be described by the
models above for ion intercalation in crystals. It is more natural to consider hard-sphere liquid
models,26,28,29,108,109 although such models lose accuracy in highly charged double layers.26,110
For identical hard spheres, the Carnahan-Starling equation of state111 (valid up to ≈ 55% vol-
ume fraction) corresponds to the excess chemical potential,
µexi
kBT= lnγi =
Φ(8−9Φ+3Φ2)
(1−Φ)3 (57)
which may be suitable for entropic effects in simple, high-temperature molten salts, such as NaCl.
For RTILs, which often have very different ion sizes, the extension for non-identical hard-sphere
mixtures112,113 yields the following chemical potential of species i in a mixture of N species with
diameters ai:
lnγi = −(
1+2ξ 3
2 a3i
Φ3 −3ξ 2
2 a2i
Φ2
)ln(1−Φ)+
3ξ2ai +3ξ1a2i ξ0 +a3
i1−Φ
+3ξ2a2
i(1−Φ)2
(ξ2
Φ+ξ1ai
)−ξ
32 a3
iΦ2−5Φ+2Φ2(1−Φ)3 (58)
where ξn = ∑Nj=1 Φ jan−3
j , Φ j is the volume fraction of species j, and Φ = ∑Nj=1 Φ j is the total
24

volume fraction of ions. If we assume that s times the volume of the active ion of species i is
excluded in the transition state,
γ‡ = γsi e4λ0/kBT , (59)
then the exchange current for the Faradaic reaction, Oi + e− → R j (converting species i to j) is
given by Eq. (28) with γi and γ j from Eq. (57). This approach may give insights into the relative
reactivity of ions of different sizes. Without a polar solvent, the reorganization energy λ0 is smaller
and can be comparable to kBT , so asymmetric (α 6= 12 ) and multiple electron transfer (n > 1) may
be possible, especially in molten salts at high temperature.
Phase-Field Theory of Electrode Kinetics
Bulk phase-field models. In a continuous, homogeneous, open system at constant pressure and
temperature, the diffusional chemical potential is the derivative of the free energy with respect
to composition. More generally, the it is the variational derivative of the free energy functional
F [c], which is the continuum analog of adding a particle and allowing the system to relax, e.g. by
removing a vacancy in a crystal. To describe the free energy of an inhomogeneous system, Van der
Waals114 added the “gradient energy" to the bulk integral over the volume V ,
F [c] =∫
V
[ρs f (c)+
12
∇c ·κ∇c]
dV (60)
where κ is the symmetric, positive definite, “gradient penalty tensor". For intercalation phenom-
ena, we define the (Helmholtz) free energy f and filling fraction c per crystal site, so we multiply
by the site density ρs to obtain the free energy per volume. The second integral is over the surface
S with surface tension γs depending on the normal orientation n. The chemical potential is given
by
µ =1ρs
δFδc
= g′(c)− ∇ ·κ∇cρs
(61)
which depends on the curvature of the concentration profile.
25

This formulation of non-equilibrium thermodynamics was introduced in materials science by
Cahn and Hilliard (CH) in 195890,115–117 and forms the basis for modern phase field models.16
(In physics, similar models were introduced by Landau for second-order phase transitions118 and
Ginzburg and Landau for superconductivity.119) The gradient energy can be justified as the first
term in the Taylor expansion of a nonlocal inhomogeneous free energy around the homogeneous
state. If f (c) has multiple minima representing distinct stable phases, then the gradient term coun-
teracts the tendency to phase separate and leads to a diffuse interface of width λ , whose concen-
tration profile solves the Beltrami equation, µ = constant. In that case, we can also relate κ to the
inter-phasial tension, γi.
Toward an electrochemical phase-field theory. Building on earlier models of phase sepa-
ration in ionic systems,120–122 there were several breakthroughs in 2004 that set the stage for my
theory of electrochemical kinetics. Garcia, Bishop and Carter19 formulated variational principles
for electromagnetically active systems, which unify the CH equation with Maxwell’s equations.
In the same year, Guyer, Boettinger, Warren and McFadden17,18 introduced phase-field models to
electrochemistry by representing a diffuse electrode/electrolyte interface with a continuous phase
field, ξ (x), varying between stable values 0 and 1. As in phase-field models of dendritic solidi-
fication,84–87 they used Landau’s quartic model, f (ξ ) ∝ ξ 2(1− ξ )2, to provide a double-welled
homogeneous free energy (c = ξ in Eq. (60)) to separate the electrolyte and electrode phases. They
described the kinetics of electrodeposition18 (converting ions in the electrolyte to solid metal) by
Allen-Cahn kinetics,123 linear in the thermodynamic driving force, I ∝ ∆µ , but did not make con-
nections with the Butler-Volmer equation or charge-transfer theory. Several groups have used this
approach to model dendritic growth.81–83
Also in 2004, Han, Van der Ven and Ceder20 first applied the CH equation to the diffusion of
intercalated lithium ions in LFP, albeit without modeling reaction kinetics. Following Cahn and
Hilliard 90 , they used the regular solution model (Eq. (47)) with homogeneous free energy,
f (c) = kBT [c lnc+(1− c) ln(1− c)]+Ωc(1− c) (62)
26

where the terms (from left to right) represent the entropy of particles, the entropy of holes, and
the enthalpy of particle-hole interactions. At high temperature, entropy dominates, and there is
only one minimum at c = 12 with maximal mixing. If Ω > 0, then particles attract each other (and
repel holes), and, below a critical temperature, T < Tc =Ω
2kB, there are two minima representing
stable high-density and low-density phases, separated by a miscibility gap, or voltage plateau.25,40
Balancing terms in Eq. (60), the phase boundary width scales as λi ≈√
κ/Ω, and the inter-phasial
tension as γi ≈√
κΩρs .16,39,90
These developments, followed by the observation of phase boundaries at LFP surfaces,67,124
led to the first phase-field theory of Faradaic reactions. The exponential (Tafel) dependence of the
current on the overpotential, defined in terms of ∆µ in Eq. (61), was first reported in 2007,36,37,125
but with a spurious pre-factor, noted by Burch.39,66 The complete theory, connecting the CH model
to the BV equation and the battery voltage, appeared in 200935,71 and later applied to LFP nanopar-
ticles.40,41 For lithium intercalation, the reduced state has zero charge (zR = 0), so the original CH
functional Eq. (60) with f (c) given by Eq. (47) was used to construct the electrochemical potential
Eq. (61) in the Butler-Volmer and Nernst equations.
Variational formulation of electrode kinetics. For electrochemical kinetics, we consider the
total Gibbs free energy G of an open system, where the electrochemical potential is related to the
cell voltage. For the general Faradaic reaction (Figure 2),
O+ne− = ∑i
siOzii +ne−→∑
js jR
z jj = R, (63)
we define all the chemical activities ak and diffusional electrochemical potentials µk variationally:
µO = kBT lnaO + zOeφO = ∑i
si
ρs
δGδci
(64)
µR = kBT lnaR + zReφR = ∑j
s j
ρs
δGδc j
(65)
µe = kBT lnae− eφe =1ρs
δGδce
(66)
27

The Nernst voltage ∆φ eq is defined variationally by setting µR = µO+nµe. According to Eq. (24),
Eq. (25) and Eq. (34), the activation overpotential
η = ∆φ −∆φeq = φe−φ − kBT
nceln
aneaO
aR=
µR− (µO +nµe)
ne=
µ2−µ1
ne(67)
is the change in total chemical potential of the Faradaic reaction per charge transferred (nc = n).
In this way, the diffusional electrochemical potentials µi =δG
ρsδcienter the Butler-Volmer (Eq. (1))
and Marcus (Eq. (40)) equations, as well as the exchange current Eq. (28).
The following free energy captures the essential physics of ionic materials:17,19,34,37,39–41,43
G =∫
V
[ρs(
f (~c)+ρeφ)+
12(∇~c ·κ∇~c−∇φ · εp∇φ +σ : ε)
]dV +
∮S
γs(n,~c,φ)dS (68)
where~c is the set of concentrations, εp the permittivity tensor, κ the gradient penalty tensor, σ the
stress tensor, ε the strain tensor, qs the surface charge density, and ρe = ∑i zieci the bulk charge
density (for ions and electrons, in the case of mixed conductors). The electrostatic potential acts as
a Lagrange multiplier controlling the total ion densities19,41 while enforcing Maxwell’s equations.
(See also the supporting material of Bazant et al. 34).
Mechanical deformation due to inserted ions can significantly affect charge-transfer kinetics.41
Assuming linear elasticity, the stress is given by Hooke’s law, σi j =Ci jklεkl , where C is the elastic
constant tensor. The lattice-preserving “coherency strain",
εi j =12
(∂ui
∂x j+
∂u j
∂xi
)−∑
mε
0i jmcm (69)
is the total strain due to compositional inhomogeneity (first term) relative to the stress-free inelastic
strain (second term). In a mean-field approximation (Vegard’s law), each molecule of species m
exerts an independent strain ε0m (lattice misfit between cm = 0,1).
In our theory, the Nernst voltage Eq. (24) and exchange current Eq. (28) depend on concentra-
28

Figure 5: Insertion kinetics in LFP nanoparticles. The low-energy phase boundary between FePO4and LiFePO4 propagates as an “intercalation wave"37,40,41,52,125 across the 010 facet, filling thecrystal layer by layer, where the reaction rate (Eq. (72)) is enhanced by concentration gradientsand elastic stress. [Reproduced from Bai, Cogswell, Bazant.40]
tion gradients and elastic stress via,
µi =δG
ρsδci=
(∂ f∂ci
+∇ ·κ∇ci−σ : ε0
iρs
)+ zieφ = kBT lnai + zieφ (70)
which leads new modes of ion intercalation (Figure 5). For ion insertion (Figure 3), we propose
the general model,
γ‡ = (1− ci)−s exp
[1
kBT
(λ0
4− σ : ε‡
ρs
)](71)
where ε‡ is the transition-state strain, s≥ 1 the number of excluded sites, and λ0 the reorganization
energy. For insertion in a regular solid solution, the exchange current is
I0 = I0(c)exp(
α(∇ ·κ∇c)+σ : (ε‡−αε0)
ρskBT
)(72)
where I0(c) is the limit of zero stress and uniform concentration Eq. (49) and ∆ε = ε‡−αε0, is the
“activation strain".126
Conservation laws. From the LIT flux Eq. (4), conservation of mass leads to the CH equation,
∂ci
∂ t+∇ ·Fi = Ri, (73)
29

where,
Fi =−Dici
kBT ρs∇
δGδci
(74)
In our formulation, the tracer diffusivity Di is also defined variationally via Eq. (15). In the case of
a solid solution, Eq. (16), this leads to the “modified CH equation".79 The homogeneous reaction
rate Ri, describing bulk charge transfer reactions (e.g. water self-ionization), is often neglected,
but could be described by our theory. The current density is also expressed variationally:
J = ∑i
zieFi (75)
and enters charge conservation,
∂ρe
∂ t+∇ ·J = ∑
izieRi = 0. (76)
Since elastic stress relaxes much faster than diffusion, mechanical equilibrium δGδ~u = 0 implies
∇ ·σ = 0.
Since the chemical potential involves two spatial derivatives (Eq. (61)), the CH equation is
fourth-order and requires two boundary conditions at each interface. One relates the normal flux
to the reaction rate
n ·Fi = Ri (77)
where Ri = 0 for an inactive species and Ri =J
siziefor an active species. The other is the “variational
boundary condition",
[n ·κ∇ci] =∂γs
∂ci(78)
(where [X] denotes the jump in X at an interface), which ensures continuity of the chemical poten-
tial39 and controls surface wetting and nucleation.40
Electrostatics. In most models of electrochemical systems, the potential φ is determined im-
plicitly by electroneutrality, ρe = 0, but here we allow for diffuse charge, which can alter reaction
30

rates (the “Frumkin correction" below) and contribute to capacitive charge storage. The mean
electrostatic potential φ in Eq. (68) is uniquely defined at each position in the microstructure. The
potentials φO, φR and φe refer to φ on appropriate sides of the interface where a Faradaic reaction
occurs (Figure 2).
The potential is determined variationally by δGδφ
= 0. Bulk variations lead to Poisson’s equation,
∇ ·D≡−∇ · (εp∇φ) = ρe (79)
and surface variations to the electrostatic boundary condition,
[n ·D]≡−[n · εp∇φ ] =∂γs
∂φ≡ qs (80)
where qs is the surface charge (per area), D= εp ·E is the Maxwell displacement field and E=−∇φ
is the electric field. For ionic liquids, higher-order terms, such as (∇2φ)2, can be added to the free
energy density to describe electrostatic correlations, and εp becomes a differential operator.34
Since the surface charge qs is not fixed at an electrode surface, another boundary condition is
needed for Poisson’s equation Eq. (79), which relates the charge to the interfacial voltage ∆φ = [φ ].
In electrochemistry, it is usually assumed that ∆φ is across the entire double layer, but as empha-
sized by Frumkin long ago,127 the diffuse part of the double layer outside the reaction plane must
be excluded. Mathematical models of the Frumkin correction have recently been developed for
solid electrolytes,128–130 liquid electrolytes88,130–132 and porous electrodes133–135 (See Biesheuvel
et al. 130 for a review.) Assuming that charge transfer occurs across a charge-free layer of thick-
ness hs and permittivity εs with constant electric field ∆φ/hs, which could represent a Stern layer
of electrode solvation88 or the radius of an ionic liquid molecule,34 the continuity of Maxwell
displacement implies
∆φ = λs n ·∇φ (81)
where λs = hsεp/εs is an effective thickness of the Stern layer. The role of diffuse charge is con-
31
trolled by dimensionless parameter, δs = λs/λD, where λD is the Debye screening length:88,130,132,134
In the Helmholtz limit (δs→ 0), the double-layer is compact (at the molecular scale), and standard
BV kinetics apply; in the Gouy-Chapman limit (δ → ∞) it is diffuse and acts like a semiconductor
diode, where forward (or reverse) bias corresponds to electrostatic condensation (or repulsion) of
the active ions.
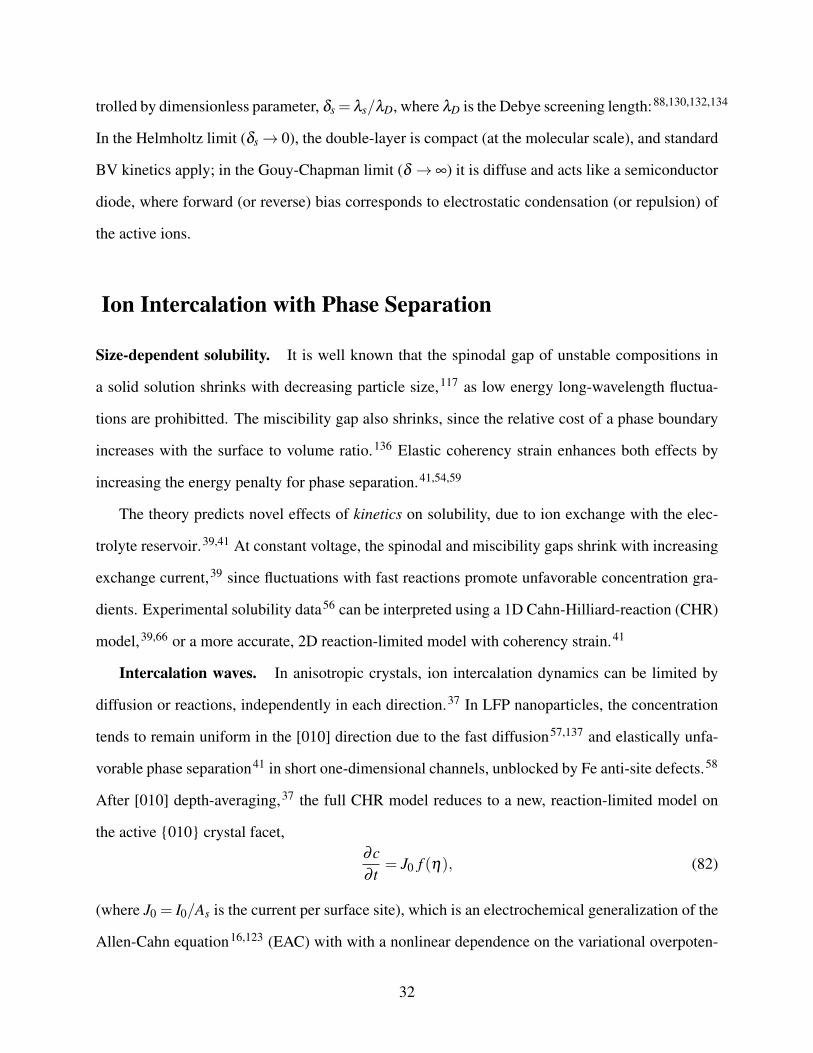
Ion Intercalation with Phase Separation
Size-dependent solubility. It is well known that the spinodal gap of unstable compositions in
a solid solution shrinks with decreasing particle size,117 as low energy long-wavelength fluctua-
tions are prohibitted. The miscibility gap also shrinks, since the relative cost of a phase boundary
increases with the surface to volume ratio.136 Elastic coherency strain enhances both effects by
increasing the energy penalty for phase separation.41,54,59
The theory predicts novel effects of kinetics on solubility, due to ion exchange with the elec-
trolyte reservoir.39,41 At constant voltage, the spinodal and miscibility gaps shrink with increasing
exchange current,39 since fluctuations with fast reactions promote unfavorable concentration gra-
dients. Experimental solubility data56 can be interpreted using a 1D Cahn-Hilliard-reaction (CHR)
model,39,66 or a more accurate, 2D reaction-limited model with coherency strain.41
Intercalation waves. In anisotropic crystals, ion intercalation dynamics can be limited by
diffusion or reactions, independently in each direction.37 In LFP nanoparticles, the concentration
tends to remain uniform in the [010] direction due to the fast diffusion57,137 and elastically unfa-
vorable phase separation41 in short one-dimensional channels, unblocked by Fe anti-site defects.58
After [010] depth-averaging,37 the full CHR model reduces to a new, reaction-limited model on
the active 010 crystal facet,∂c∂ t
= J0 f (η), (82)
(where J0 = I0/As is the current per surface site), which is an electrochemical generalization of the
Allen-Cahn equation16,123 (EAC) with with a nonlinear dependence on the variational overpoten-
32
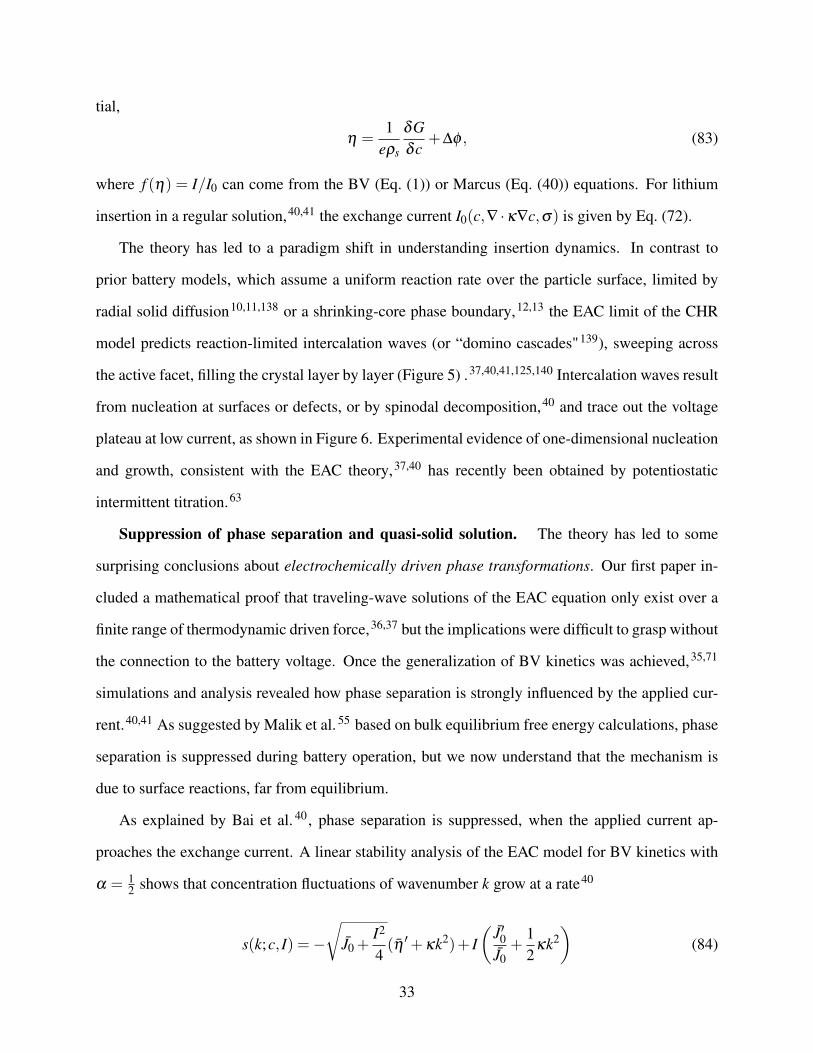
tial,
η =1
eρs
δGδc
+∆φ , (83)
where f (η) = I/I0 can come from the BV (Eq. (1)) or Marcus (Eq. (40)) equations. For lithium
insertion in a regular solution,40,41 the exchange current I0(c,∇ ·κ∇c,σ) is given by Eq. (72).
The theory has led to a paradigm shift in understanding insertion dynamics. In contrast to
prior battery models, which assume a uniform reaction rate over the particle surface, limited by
radial solid diffusion10,11,138 or a shrinking-core phase boundary,12,13 the EAC limit of the CHR
model predicts reaction-limited intercalation waves (or “domino cascades"139), sweeping across
the active facet, filling the crystal layer by layer (Figure 5) .37,40,41,125,140 Intercalation waves result
from nucleation at surfaces or defects, or by spinodal decomposition,40 and trace out the voltage
plateau at low current, as shown in Figure 6. Experimental evidence of one-dimensional nucleation
and growth, consistent with the EAC theory,37,40 has recently been obtained by potentiostatic
intermittent titration.63
Suppression of phase separation and quasi-solid solution. The theory has led to some
surprising conclusions about electrochemically driven phase transformations. Our first paper in-
cluded a mathematical proof that traveling-wave solutions of the EAC equation only exist over a
finite range of thermodynamic driven force,36,37 but the implications were difficult to grasp without
the connection to the battery voltage. Once the generalization of BV kinetics was achieved,35,71
simulations and analysis revealed how phase separation is strongly influenced by the applied cur-
rent.40,41 As suggested by Malik et al. 55 based on bulk equilibrium free energy calculations, phase
separation is suppressed during battery operation, but we now understand that the mechanism is
due to surface reactions, far from equilibrium.
As explained by Bai et al. 40 , phase separation is suppressed, when the applied current ap-
proaches the exchange current. A linear stability analysis of the EAC model for BV kinetics with
α = 12 shows that concentration fluctuations of wavenumber k grow at a rate40
s(k;c, I) =−√
J0 +I2
4(η ′+κk2)+ I
(J′0J0
+12
κk2)
(84)
33

Figure 6: Galvanostatic discharge into a single LFP cathode nanoparticle without coherency strain.Top: Linear stability (spinodal) diagram for the homogeneous state versus current I (scaled to theexchange current at X = 0.5) and mean Li filling X . (a) Battery voltage versus state of charge(X) at different currents I. (b) Evolution of the concentration profile at low current I = 0.01 withinsertion waves nucleated at the wetted [001] side facets. (c) Quasi-solid solution behavior closeto the critical current I = 0.5, showing homogeneous filling ahead of the waves. [Reproduced fromBai, Cogswell, Bazant40]
34
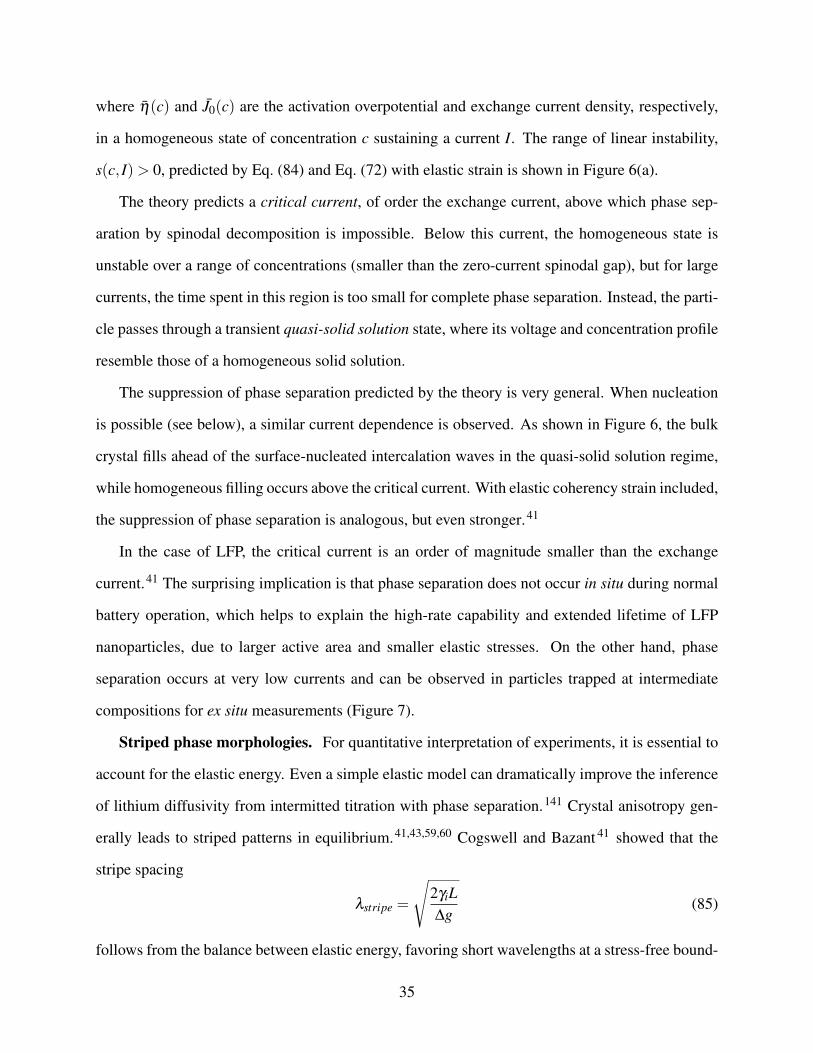
where η(c) and J0(c) are the activation overpotential and exchange current density, respectively,
in a homogeneous state of concentration c sustaining a current I. The range of linear instability,
s(c, I)> 0, predicted by Eq. (84) and Eq. (72) with elastic strain is shown in Figure 6(a).
The theory predicts a critical current, of order the exchange current, above which phase sep-
aration by spinodal decomposition is impossible. Below this current, the homogeneous state is
unstable over a range of concentrations (smaller than the zero-current spinodal gap), but for large
currents, the time spent in this region is too small for complete phase separation. Instead, the parti-
cle passes through a transient quasi-solid solution state, where its voltage and concentration profile
resemble those of a homogeneous solid solution.
The suppression of phase separation predicted by the theory is very general. When nucleation
is possible (see below), a similar current dependence is observed. As shown in Figure 6, the bulk
crystal fills ahead of the surface-nucleated intercalation waves in the quasi-solid solution regime,
while homogeneous filling occurs above the critical current. With elastic coherency strain included,
the suppression of phase separation is analogous, but even stronger.41
In the case of LFP, the critical current is an order of magnitude smaller than the exchange
current.41 The surprising implication is that phase separation does not occur in situ during normal
battery operation, which helps to explain the high-rate capability and extended lifetime of LFP
nanoparticles, due to larger active area and smaller elastic stresses. On the other hand, phase
separation occurs at very low currents and can be observed in particles trapped at intermediate
compositions for ex situ measurements (Figure 7).
Striped phase morphologies. For quantitative interpretation of experiments, it is essential to
account for the elastic energy. Even a simple elastic model can dramatically improve the inference
of lithium diffusivity from intermitted titration with phase separation.141 Crystal anisotropy gen-
erally leads to striped patterns in equilibrium.41,43,59,60 Cogswell and Bazant 41 showed that the
stripe spacing
λstripe =
√2γiL∆g
(85)
follows from the balance between elastic energy, favoring short wavelengths at a stress-free bound-
35
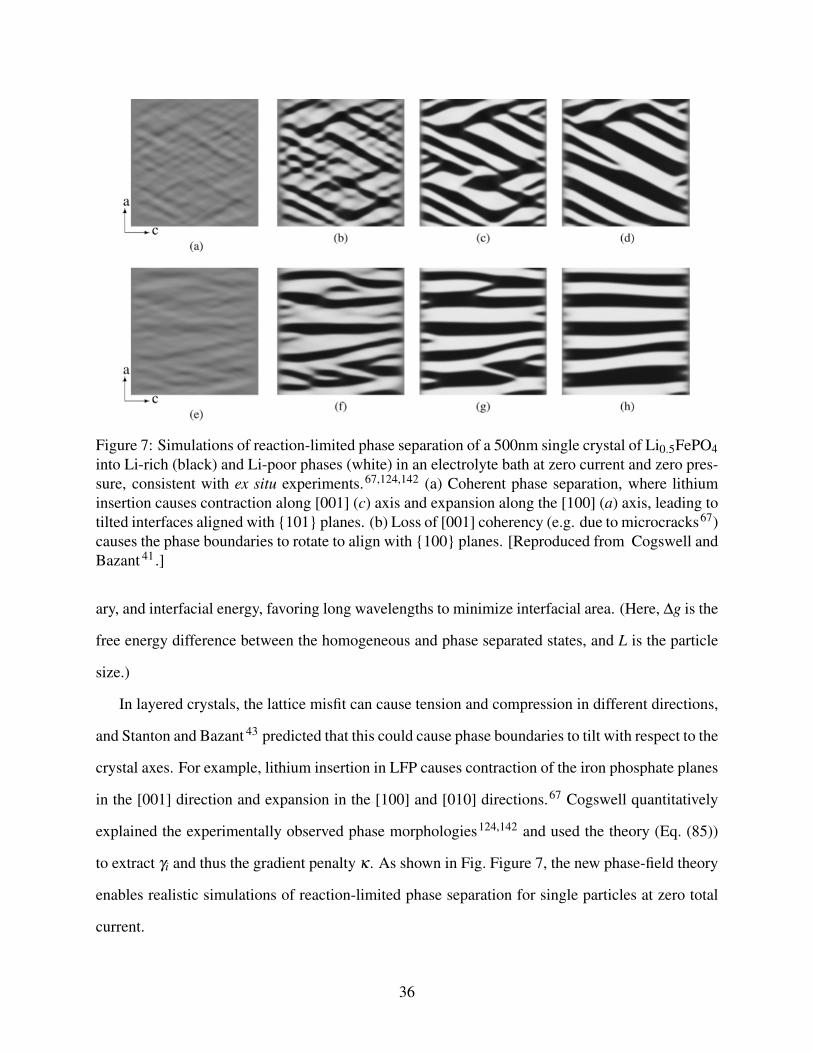
Figure 7: Simulations of reaction-limited phase separation of a 500nm single crystal of Li0.5FePO4into Li-rich (black) and Li-poor phases (white) in an electrolyte bath at zero current and zero pres-sure, consistent with ex situ experiments.67,124,142 (a) Coherent phase separation, where lithiuminsertion causes contraction along [001] (c) axis and expansion along the [100] (a) axis, leading totilted interfaces aligned with 101 planes. (b) Loss of [001] coherency (e.g. due to microcracks67)causes the phase boundaries to rotate to align with 100 planes. [Reproduced from Cogswell andBazant 41 .]
ary, and interfacial energy, favoring long wavelengths to minimize interfacial area. (Here, ∆g is the
free energy difference between the homogeneous and phase separated states, and L is the particle
size.)
In layered crystals, the lattice misfit can cause tension and compression in different directions,
and Stanton and Bazant 43 predicted that this could cause phase boundaries to tilt with respect to the
crystal axes. For example, lithium insertion in LFP causes contraction of the iron phosphate planes
in the [001] direction and expansion in the [100] and [010] directions.67 Cogswell quantitatively
explained the experimentally observed phase morphologies124,142 and used the theory (Eq. (85))
to extract γi and thus the gradient penalty κ . As shown in Fig. Figure 7, the new phase-field theory
enables realistic simulations of reaction-limited phase separation for single particles at zero total
current.
36

Surface wetting and nucleation. The theory also predicts how surface thermodynamics
affects reaction kinetics. We have already mentioned the Frumkin effect of electrostatic amplifica-
tion of the reaction rate, when active ions are attracted to the surface. Non-electrostatic attraction,
or wetting, of the solid surface by intercalated ions can also dramatically affect the intercalation
process. In Cahn’s theory,143 surface wetting is described by Eq. (78) with ∂γs∂c < 0. Using this
boundary condition for the EAC equation Eq. (82), the nucleation of intercalation waves in LFP
nanoparticles due to wetting of the 100 crystal facet can be simulated with coherency strain 41
(Figure 7) or without40 (Figure 6). By combining surface wetting with elastic strain in the theory,
the nucleation barrier in LFP (critical voltage past the equilibrium plateau to observe a sudden cur-
rent) can be predicted as a function of particle size, in excellent agreement with experiments. The
effect of surface wetting on intercalation kinetics may also be responsible for the surprising per-
formance boost from phosphate-glass thin films on active nanoparticles of LFP 53 and LixCoO2144
Mosaic Instability. The complex dynamics of ion intercalation in nanoparticles also affects
the macrosopic response of a composite electrode. Using the CHR model39 for a collection of
particles in a reservoir of constant chemical potential, Burch 66 discovered what we called the
mosaic instability, whereby particles filling uniformly at constant total current suddenly fill one-by-
one. The mechanism is simple: As the particles enter the miscibility gap, the first to phase separate
(due to random nucleation or spinodal decomposition) will suddenly lower its chemical potential
and sustain a much larger current until it becomes full, at which point the current is shared by the
others until the process repeats. Interestingly, in the CHR model, the smaller particles transform
first, because diffusion brings the core concentration to the spinodal more quickly. In contrast, for
reaction-limited particles, the larger ones are more likely to nucleate first.
Meanwhile, Dreyer et al. 64 described the mosaic instability and demonstrated it experimentally
in two clever ways. They connected it to the zero-current voltage gap between charge/discharge
cycles in LFP batteries, as well as the dynamics of an array of balloons connected to a single
pressure line. Their theory64,65 is similar to the “pseudo capacitor limit" of our models, where each
particle maintains uniform (but time dependent) concentration, without internal phase separation.
37

0 0.1 0.2 0.3 0.4 0.5 0.6 0.7 0.8 0.9 13.1
3.15
3.2
3.25
3.3
3.35
3.4
3.45
3.5
Filling Fraction
Volta
ge
C/50 DischargeC/50 Charge10C Discharge
0 0.1 0.2 0.3 0.4 0.5 0.6 0.7 0.8 0.9 10
0.5
1
x / L x
y / L
y
0 0.1 0.2 0.3 0.4 0.5 0.6 0.7 0.8 0.9 10
0.5
1
x / L x
y / L
y
0 0.2 0.4 0.6 0.8 10
0.5
1
x / L x
y / L
y
!0.5 0 0.5 10
0.5
1
x / L x
y / L
y
slow%C/50%charge%
slow%C/50%discharge%
fast%10C%discharge%
cs (x, y,t)
cs (x, y,t)
cs (x, y,t) ce(x, y, t)
(a)% (b)%
(c)%
(d)% (e)%
Figure 8: Finite-volume simulations of macroscopic phase separation in a porous LFP cathode.42
(a) Voltage versus state of charge for slow charge/discharge and fast discharge. (b)-(d) Profiles ofmean Li concentration in the solid at the red points in (a), showing narrow reaction fronts withmosaic instabilities, associated with voltage fluctuations. (e) Electrolyte Li concentration for fastdischarge (d), showing diffusion limitation. [T. R. Ferguson]
Porous electrodes. The theory has recently been extended to porous electrodes undergoing
phase transformations42 using classical porous electrode models to describe the electrolyte.145
Diffusion in the electrolyte provides a spatiotemporal bias for the mosaic instability, so that narrow
fronts of stochastic particle phase transformations propagate away from the separator (discharge) or
current collector (charge) at low current (Figure 8). The width of the reaction front separating low-
density and high-density phases increases with current until the entire electrode becomes active,
which is a macroscopic analog of the suppression of phase separation in nanoparticles.
The new theory can robustly predict experimental data for phase-separating porous electrodes
for the first time without artificially fitting voltage plateaus or enforcing phase boundaries. Us-
ing the EAC regular-solution model for LFP40,41 in a porous electrode,42 the model can predict
tiny voltage oscillations (< kBT/e =25mV) and the limiting “voltage gap" at very low currents
observed in experiments,64 which give way to a smoothly decaying voltage at high current53 (Fig-
ure 8). Nucleation is also crucial to consider at the porous electrode scale63 and can be naturally
included in theory. Using a two-component regular solution model for graphite intercalation,35
38

the theory is also able to fit experimental data for diffusion-limited intercalation of long graphite
anodes146 with multiple reaction fronts of different colors corresponding to different stages of
lithiation.
Conclusion
This Account describes steps to unify chemical kinetics with thermodynamics, electrostatics, and
transport in electrochemical systems. The theory has shed light on rate processes in advanced Li-
ion batteries with phase-separating nanoparticles. Other applications to energy conversion, such as
electrocatalysis in solid oxide fuel cells and charge transfer in ionic liquids, may require incorpo-
rating diffuse charge34,89 and heat transfer147 in the general framework.
Acknowledgement
This work was supported by the National Science Foundation under Contracts DMS-0842504 and
DMS-0948071 and by a seed grant from the MIT Energy Initiative.
References
1. Butler, J. A. V. Studies in heterogeneous equilibria. Part II. The kinetic interpretation of the
Nernst theory of electromotive force. Trans. Faraday Society 1924, 19, 729–733.
2. Erdey-Gruz, T.; Volmer, M. Zur theorie der wasserstoffüberspannung. Z. Phys. Chem. 1930,
150 (A), 203–213.
3. Bard, A. J.; Faulkner, L. R. Electrochemical Methods; J. Wiley & Sons, Inc.: New York, NY,
2001.
4. Bockris, J. O.; Reddy, A. K. N. Modern Electrochemistry; Plenum: New York, 1970.
39
5. Newman, J. Electrochemical Systems, 2nd ed.; Prentice-Hall, Inc.: Englewood Cliffs, NJ,
1991.
6. Kuznetsov, A. M.; Ulstrup, J. Electron Transfer in Chemistry and Biology: An Introduction
to the Theory; Wiley, 1999.
7. Marcus, R. A. On the theory of oxidation-reduction reactions Involving electron transfer. I.
J. Chem .Phys. 1956, 24, 966–978.
8. Marcus, R. A. . Chemical and electrochemical electron-transfer theory. Ann. Rev. Phys.
Chem. 1964, 15, 155–196.
9. Marcus, R. A. Electron transfer reactions in chemistry. Theory and experiment. Rev. Mod.
Phys. 1993, 65, 599–610.
10. Doyle, M.; Fuller, T. F.; Newman, J. Modeling of Galvanostatic Charge and Discharge of the
Lithium/Polymer/Insertion Cell. Journal of the Electrochemical Society 1993, 140, 1526–
1533.
11. Fuller, T.; Doyle, M.; Newman, J. Simulation and optimization of the dual lithium ion inser-
tion cell. Journal of the Electrochemical Society 1994, 141, 1–10.
12. Srinivasan, V.; Newman, J. Discharge Model for the Lithium Iron-Phosphate Electrode. Jour-
nal of the Electrochemical Society 2004, 151, A1517–A1529.
13. Dargaville, S.; Farrell, T. Predicting Active Material Utilization in LiFePO4 Electrodes Using
a Multiscale Mathematical Model. Journal of the Electrochemical Society 2010, 157, A830–
A840.
14. Groot, S. R. D.; Mazur, P. Non-equilibrium Thermodynamics; Interscience Publishers, Inc.:
New York, NY, 1962.
15. Prigogine, I.; Defay, R. Chemical Thermodynamics; John Wiley and Sons, 1954.
40

16. Balluffi, R. W.; Allen, S. M.; Carter, W. C. Kinetics of materials; Wiley, 2005.
17. Guyer, J. E.; Boettinger, W. J.; Warren, J. A.; McFadden, G. B. Phase field modeling of
electrochemistry I: Equilibrium. Phys. Rev. E 2004, 69, 021603.
18. Guyer, J. E.; Boettinger, W. J.; Warren, J. A.; McFadden, G. B. Phase field modeling of
electrochemistry II: Kinetics. Phys. Rev. E 2004, 69, 021604.
19. Garcia, R. E.; Bishop, C. M.; Carter, W. C. Thermodynamically Consistent Variational Prin-
ciples with Applications to Electrically and Magnetically Active Systems. Acta Mater. 2004,
52, 11–21.
20. Han, B.; der Ven, A. V.; Morgan, D.; Ceder, G. Electrochemical modeling of intercalation
processes with phase field models. Electrochimica Acta 2004, 49, 4691–4699.
21. Jamnik, J.; Maier, J. Generalised equivalent circuits for mass and charge transport : chemical
capacitance and its implications. Phys. Chem. Chem. Phys. 2001, 3, 1668–1678.
22. Lai, W.; Haile, S. M. Impedance Spectroscopy as a Tool for Chemical and Electrochemical
Analysis of Mixed Conductors: A Case Study of Ceria. J. Amer. Cer. Soc. 2005, 88, 2979–
2997.
23. Lai, W.; Ciucci, F. Thermodynamics and kinetics of phase transformation in intercalation
battery electrodes Ð phenomenological modeling. Electrochim. Acta 2010, 56, 531–542.
24. Lai, W.; Ciucci, F. Mathematical modeling of porous battery electrodes - Revisit of New-
man’s model. Electrochimica Acta 2011, 56, 4369–4377.
25. Lai, W. Electrochemical modeling of single particle intercalation battery materials with dif-
ferent thermodynamics. Journal of Power Sources 2011, 196, 6534Ð6553.
26. Bazant, M. Z.; Kilic, M. S.; Storey, B.; Ajdari, A. Towards an understanding of nonlinear
electrokinetics at large voltages in concentrated solutions. Advances in Colloid and Interface
Science 2009, 152, 48–88.
41

27. Bazant, M. Z.; Kilic, M. S.; Storey, B. D.; Ajdari, A. Nonlinear electrokinetics at large volt-
ages. New Journal of Physics 2009, 11, 075016.
28. Biesheuvel, P. M.; Lyklema, J. Sedimentation–diffusion equilibrium of binary mixtures of
charged colloids including volume effects. J. Phys. Condens. Matter 2005, 17, 6337.
29. Biesheuvel, P. M.; van Soestbergen, M. Counterion volume effects in mixed electrical double
layers. Journal of Colloid and Interface Science 2007, 316, 490–499.
30. Kilic, M. S.; Bazant, M. Z.; Ajdari, A. Steric effects in the dynamics of electrolytes at large
applied voltages: I Double-layer charging. Phys. Rev. E 2007, 75, 021502.
31. Kilic, M. S.; Bazant, M. Z.; Ajdari, A. Steric effects on the dynamics of electrolytes at large
applied voltages: II Modified Nernst-Planck equations. Phys. Rev. E 2007, 75, 021503.
32. Storey, B. D.; Edwards, L. R.; Kilic, M. S.; Bazant, M. Z. Steric effects on ac electro-osmosis
in dilute electrolytes. Phys. Rev. E 2008, 77, 036317.
33. Olesen, L. H.; Bazant, M. Z.; Bruus, H. Strongly nonlinear dynamics of electrolytes in large
ac voltages. Phys. Rev. E 2010, 82, 011501.
34. Bazant, M. Z.; Storey, B. D.; Kornyshev, A. A. Double layer in ionic liquids: Overscreening
versus crowding. Phys. Rev. Lett. 2011, 106, 046102.
35. Bazant, M. Z. 10.626 Electrochemical Energy Systems; Massachusetts Institute of Technol-
ogy: MIT OpenCourseWare, http://ocw.mit.edu, License: Creative Commons BY-NC-SA,
2011.
36. Singh, G. K.; Bazant, M. Z.; Ceder, G. arXiv:0707.1858v1 [cond-mat.mtrl-sci].
37. Singh, G.; Burch, D.; Bazant, M. Z. Intercalation dynamics in rechargeable battery materials:
General theory and phase-transformation waves in LiFePO4. Electrochimica Acta 2008, 53,
7599–7613.
42

38. Burch, D.; Singh, G.; Ceder, G.; Bazant, M. Z. Phase-transformation wave dynamics
LiFePO4. Solid State Phenomena 2008, 139, 95–100.
39. Burch, D.; Bazant, M. Z. Size-dependent spinodal and miscibility gaps for intercalation in
nanoparticles. Nano Letters 2009, 9, 3795–3800.
40. Bai, P.; Cogswell, D.; Bazant, M. Z. Suppression of Phase Separation in LiFePO4 Nanopar-
ticles During Battery Discharge. Nano Letters 2011, 11, 4890–4896.
41. Cogswell, D. A.; Bazant, M. Z. Coherency strain and the kinetics of phase separation in
LiFePO4 nanoparticles. ACS Nano 2012, 6, 2215–2225.
42. Ferguson, T. R.; Bazant, M. Z. Non-equilibrium thermodynamics of porous electrodes. 2012,
submitted, arXiv:1204.2934v1 [physics.chem-ph].
43. Stanton, L. G.; Bazant, M. Z. Phase separation with anisotropic coherency strain. submitted,
arXiv:1202.1626v1 [cond-mat.mtrl-sci] 2011,
44. Sekimoto, K. Stochastic Energetics; Springer, 2010.
45. Kampen, N. G. V. Stochastic Processes in Physics and Chemistry; North-Holland, 2007;
Third edition.
46. Aricò, A. S.; Bruce, P.; Scrosati, B.; Tarascon, J.-M.; van Schalkwijk, W. Nanostructured
materials for advanced energy conversion and storage devices. Nature Materials 2005, 4,
366–377.
47. Whittingham, M. S. Lithium Batteries and Cathode Materials. Chem. Rev. 2004, 104, 4271–
4301.
48. Dunn, B.; Kamath, H.; Tarascon, J.-M. Electrical Energy Storage for the Grid: A Battery of
Choices. Science 2011, 334, 928–935.
49. Huggins, R. A. Advanced Batteries: Materials Science Aspects; Springer, 2009.
43

50. Padhi, A.; Nanjundaswamy, K.; Goodenough, J. Phospho-olivines as Positive-Electrode Ma-
terials for Rechargeable Lithium Batteries. Journal of the Electrochemical Society 1997, 144,
1188–1194.
51. Tarascon, J.; Armand, M. Issues and challenges facing rechargeable lithium batteries. Nature
2001, 414, 359–367.
52. Tang, M.; Carter, W. C.; Chiang, Y.-M. Electrochemically Driven Phase Transitions in Inser-
tion Electrodes for Lithium-Ion Batteries: Examples in Lithium Metal Phosphate Olivines.
Annual Review of Materials Research 2010, 40, 501–529.
53. Kang, B.; Ceder, G. Battery materials for ultrafast charging and discharging. Nature 2009,
458, 190–193.
54. Meethong, N.; Huang, H.-Y. S.; Carter, W. C.; Chiang, Y.-M. Size-Dependent Lithium Mis-
cibility Gap in Nanoscale Li1−xFePO4. Electrochem. Solid-State Lett. 2007, 10, A134–A138.
55. Malik, R.; Zhou, F.; Ceder, G. Kinetics of non-equilibrium lithium incorporation in LiFePO4.
Nature Materials 2011, 10, 587–590.
56. Wagemaker, M.; Singh, D. P.; Borghols, W. J.; Lafont, U.; Haverkate, L.; Peterson, V. K.;
Mulder, F. M. Dynamic Solubility Limits in Nanosized Olivine LiFePO4. J. Am. Chem. Soc.
2011, 133, 10222Ð10228.
57. Morgan, D.; der Ven, A. V.; Ceder, G. Li Conductivity in LixMPO4 (M=Mn,Fe,Co,Ni)
Olivine Materials. Electrochemical and Solid State Letters 2004, 7, A30–A32.
58. Malik, R.; Burch, D.; Bazant, M.; Ceder, G. Particle size dependence of the ionic diffusivity.
Nano Letters 2010, 10, 4123–4127.
59. Meethong, N.; Huang, H. Y. S.; Speakman, S. A.; Carter, W. C.; Chiang, Y. M. Strain Accom-
modation during Phase Transformations in Olivine-Based Cathodes as a Materials Selection
Criterion for High-Power Rechargeable Batteries. Adv. Funct. Mater. 2007, 17, 1115Ð1123.
44
60. der Ven, A. V.; Garikipati, K.; Kim, S.; Wagemaker, M. The Role of Coherency Strains on
Phase Stability in LixFePO4: Needle Crystallites Minimize Coherency Strain and Overpo-
tential. J. Electrochem. Soc. 2009, 156, A949ÐA957.
61. der Ven, A. V.; Wagemaker, M. Effect of surface energies and nano-particle size distribu-
tion on open circuit voltage of Li-electrodes. Electrochemistry Communications 2009, 11,
881Ð884.
62. Wagemaker, M.; Mulder, F. M.; der Ven, A. V. The Role of Surface and Interface En-
ergy on Phase Stability of Nanosized Insertion Compounds. Advanced Materials 2009, 21,
2703Ð2709.
63. Oyama, G.; Yamada, Y.; ichi Natsui, R.; ichi Nishimura, S.; Yamada, A. Kinetics of Nucle-
ation and Growth in Two-Phase Electrochemical Reaction of LixFePO4. J. Phys. Chem. C
2012,
64. Dreyer, W.; Jamnik, J.; Guhlke, C.; Huth, R.; Moskon, J.; Gaberscek, M. The thermodynamic
origin of hysteresis in insertion batteries. Nat. Mater. 2010, 9, 448–453.
65. Dreyer, D.; Guhlke, C.; Huth, R. The behavior of a many-particle electrode in a lithium-ion
battery. Physica D 2011, 240, 1008–1019.
66. Burch, D. Intercalation Dynamics in Lithium-Ion Batteries; Ph.D. Thesis in Mathematics,
Massachusetts Institute of Technology, 2009.
67. Chen, G.; Song, X.; Richardson, T. Electron Microscopy Study of the LiFePO4 to FePO4
Phase Transition. Electrochemical and Solid State Letters 2006, 9, A295–A298.
68. Bazant, M. Z.; Squires, T. M. Induced-charge electrokinetic phenomena. Current Opinion in
Colloid and Interface Science 2010, 15, 203–213.
69. Bazant, M. Z.; Squires, T. M. Induced-charge electro-kinetic phenomena: Theory and mi-
crofluidic applications. Phys. Rev. Lett. 2004, 92, 066101.
45

70. Squires, T. M.; Bazant, M. Z. Induced-charge electro-osmosis. J. Fluid Mech. 2004, 509,
217–252.
71. Bazant, M. Z. Mathematical Modeling of Electrochemical Energy Systems; Massachusetts
Institute of Technology, 2009; lecture notes for subject 10.95.
72. Bai, P.; Cogswell, D. A.; Bazant, M. Z. International Meeting on Lithium-Ion Batteries,
Montreal, Canada, July, 2010.
73. Bazant, M. Z. Meeting of the Electrochemical Society, Las Vegas, NV, October, 2010.
74. Brownian Motion and Nonequilibrium Statistical Mechanics. Science 1986, 233, 330–334.
75. Vineyard, G. H. Frequency factors and isotope effects in solid state rate processes. J. Phys.
Chem. Solids 1957, 3, 121–127.
76. Kaxiras, E. Atomic and Electronic Structure of Solids; Cambridge University Press, 2003.
77. Kramers, H. A. Brownian motion in a field of force and the diffusion model of chemical
reactions. Physica 1940, 7, 284Ð304.
78. Zusman, L. D. Outer-sphere electron transfer in polar solvents. Chem. Phys. 1980, 49, 295–
304.
79. Nauman, E. B.; Heb, D. Q. Nonlinear diffusion and phase separation. Chemical Engineering
Science 2001, 56, 1999Ð2018.
80. Rosso, M. Electrodeposition from a binary electrolyte: new developments and applications.
Electrochimica Acta 2007, 53, 250Ð256.
81. Assadi, H. Phase-field modelling of electro-deoxidation in molten salt. Modelling and Simu-
lation in Materials Science and Engineering 2006, 14, 963Ð974.
82. Shibuta, Y.; Okajima, Y.; Suzuki, T. A phase-field simulation of bridge formation process in
a nanometer-scale switch. Scripta Materialia 2006, 55, 1095Ð1098.
46

83. Pongsaksawad, W.; Powell, A. C.; Dussault, D. Phase-Field modeling of Transport-
Limited electrolysis in solid and liquid states. Journal of The Electrochemical Society 2007,
F122ÐF133.
84. Karma, A. Phase-field model of eutectic growth. Physical Review E 1994, 49, 2245Ð2250.
85. Boettinger, W.; Warren, J. The phase-field method: Simulation of alloy dendritic solidifica-
tion during recalescence. Metallurgical and Materials Transactions A 1996, 27, 657Ð669.
86. Boettinger, W.; Coriell, S.; Greer, A.; Karma, A.; Kurz, W.; Rappaz, M.; Trivedi, R. Solidi-
fication microstructures: Recent developments, future directions. Acta Materialia 2000, 48,
43Ð70.
87. Boettinger, W.; Warren, J.; Beckermann, C.; Karma, A. Phase-field simulation of solidifica-
tion. Annual Review of Materials Research 2002, 32, 163Ð194.
88. Bazant, M. Z.; Chu, K. T.; Bayly, B. J. Current-voltage relations for electrochemical thin
films. SIAM J. Appl. Math. 2005, 65, 1463–1484.
89. Biesheuvel, P. M.; van Soestbergen, M.; Bazant, M. Z. Imposed currents in galvanic cells.
Electrochimica Acta 2009, 54, 4857–4871.
90. Cahn, J. W.; Hilliard, J. W. Free energy of a non-uniform system: I. Interfacial energy. J.
Chem Phys. 1958, 28, 258–267.
91. Sequeira, C.; Hooper, A. The study of lithium electrode reversibility against
(PEO)xLiF3CSO3 polymeric electrolytes. Solid State Ionics 1983, 9Ð10, 1131Ð1138.
92. Bourderau, S.; Brousse, T.; Schleich, D. Amorphous silicon as a possible anode material for
Li-ion batteries. Journal of Power Sources 1999, 81Ð82, 233Ð236.
93. Park, M.-H.; Kim, M. G.; Joo, J.; Kim, K.; Kim, J.; Ahn, S.; Cui, Y.; Cho, J. Silicon Nanotube
Battery Anodes. Nano Lett. 2009, 9, 3844Ð3847.
47

94. Mohapatra, S. K. Electrochromism in LixWO3. J. Electrochem. Soc. 1975, 125, 284–288.
95. Crandall, R. S.; Faughnan, B. W. Dynamics of coloration of amorphous electrochromic films
of W03 at low voltages. Applied Physics Letters 1976, 28, 95–97.
96. Raistrick, I. D.; Mark, A. J.; Huggins, R. A. Thermodynamics and kinetics of the electro-
chemical insertion of lithium into tungsten bronzes. Solid State Ionics 1981, 5, 351–354.
97. OÕHayre, R.; Cha, S.; Colella, W.; Prinz, F. B. Fuel Cell Fundamentals, second edition ed.;
Wiley, 2009.
98. Chueh, W. C.; Lai, W.; Haile, S. M. Solid State Ionics 2008, 179, 1036Ð1041.
99. Goodwin, D. G.; Zhu, H.; Colclasure, A. M.; Kee, R. J. Modeling Electrochemical Oxidation
of Hydrogen on NiÐYSZ Pattern Anodes. J. Electrochem. Soc. 2009, 156, B1004–B1021.
100. Ciucci, F.; Chueh, W. C.; Goodwin, D. G.; Haile, S. M. Surface reaction and transport in
mixed conductors with electrochemically-active surfaces: a 2-D numerical study of ceria.
Phys. Chem. Chem. Phys. 2011, 13, 2121Ð2135.
101. Ioselevich, A. S.; Kornyshev, A. A. Phenomenological Theory of Solid Oxide Fuel Cell An-
ode. Fuel Cells 1, 40–65.
102. Bradwell, D. J.; Kim, H.; Sirk, A. H. C.; Sadoway, D. R. Magnesium?Antimony Liquid Metal
Battery for Stationary Energy Storage. J. Am. Chem. Soc. 2012, 134, 1895?1897.
103. Grjotheim, K.; Krohn, C.; Malinovsky, M.; Matiasovsky, K.; Thonstad, J. Aluminum Elec-
trolysis. The Chemistry of the Hall-Heroult Process; Aluminium- Verlag GmbH, Dusseldorf,
Germany, 1977; Vol. 350.
104. Welton, T. Room-Temperature Ionic Liquids. Solvents for Synthesis and Catalysis.
Chem.Rev. 1999, 99, 2071–2084.
48

105. Conway, B. E. Electrochemical supercapacitors: scientific fundamentals and technological
applications; Springer, 1999.
106. Simon, P.; Gogotsi, Y. Materials for electrochemical capacitors. Nature Materials 2008, 7,
845–854.
107. Kornyshev, A. A. Double-layer in ionic liquids: Paradigm change? J. Phys. Chem. B 2007,
111, 5545–5557.
108. Lue, L.; Zoeller, N.; Blankschtein, D. Incorporation of Nonelectrostatic Interactions in the
Poisson Boltzmann Equation. Langmuir 1999, 15, 3726–3730.
109. di Caprio, D.; Borkowska, Z.; Stafiej, J. Simple extension of the Gouy-Chapman theory
including hard sphere effects: Diffuse layer contribution to the differential capacitance curves
for teh electrode|electrolyte interface. J. Electroanal. Chem. 2003, 540, 17–23.
110. Levin, Y. Electrostatic correlations: from plasma to biology. Rep. Prog. Phys. 2002, 65,
1577–1632.
111. Carnahan, N. F.; Starling, K. E. Equation of State for Nonattracting Rigid Spheres. J. Chem.
Phys. 1969, 51, 635–636.
112. Boublik, T. Hard sphere equation of state. J. Chem. Phys. 1970, 53, 471–472.
113. Mansoori, G. A.; Carnahan, N. F.; Starling, K. E.; Leland, T. W. Equilibrium Thermodynamic
Properties of the Mixture of Hard Spheres. J. Chem. Phys. 1971, 54, 1523–1525.
114. van der Waals, J. D. The thermodynamic theory of capillarity under the hypothesis of a
continuous variation of density. Verhandel. Konink. Akad. Weten. Amsterdam (Sect. 1) 1893,
1, 8, (Translation by J. S. Rowlinson, J. Stat. Phys. 1979, 20, 197-244).
115. Cahn, J. Free Energy of a Nonuniform System. II. Thermodynamic basis. Journal of Chemi-
cal Physics 1959, 30, 1121–1124.
49

116. Cahn, J.; Hilliard, J. Free Energy of a Nonuniform System. III. Nucleation in a two-
component incompressible fluid. Journal of Chemical Physics 1959, 31, 688–699.
117. Cahn, J. On spinodal decomposition. Acta Metallurgica 1961, 9, 795–801.
118. Landau, L.; Lifshitz, E. Statistical Physics; Butterworth-Heinemann, 1980.
119. de Gennes, P. G. Superconductivity of Metals and Alloys; Perseus Books, 2nd Ed., 1995.
120. Gupta, K. M. PhD thesis, Department of Materials Science and Engineering, Massachusetts
Institute of Technology.
121. Chen, L. Q.; Khachaturyan, A. G. Dynamics of simultaneous ordering and phase separation
and effect of long-range coulomb interactions. Phys. Rev. Lett. 1993, 70, 1477Ð80.
122. Bishop, C. M.; Garcia, R. E.; Carter, W. C. Effect of charge separation on the stability of large
wavelength fluctuations during spinodal decomposition. Acta Materialia 2003, 51, 1517–
1524.
123. Allen, S.; Cahn, J. Microscopic theory for antiphase boundary motion and its application to
antiphase domain coarsening. Acta Metallurgica 1979, 27, 1085Ð1095.
124. Laffont, L.; Delacourt, C.; Gibot, P.; Wu, M. Y.; Kooyman, P.; Masquelier, C.; Tarascon, J. M.
Study of the LiFePO4/FePO4 Two-Phase System by High-Resolution Electron Energy Loss
Spectroscopy. Chem. Mater. 2006, 18, 5520–5529.
125. Burch, D. N.; Bazant, M. Z. Design principle for improved three-dimensional ac electro-
osmotic pumps. Phys. Rev. E 2008, 77, 055303(R).
126. Aziz, M. J.; Sabin, P. C.; Lu, G. Q. The activation strain tensor: Nonhydrostatic stress effects
on crystal growth kinetics. Phys. Rev. B 41, 9812–9816.
127. Frumkin, A. Wasserstoffüberspannung und Struktur der Doppelschict. Z. Phys. Chem. 1933,
164A, 121–133.
50

128. Itskovich, E. M.; Kornyshev, A. A.; Vorotyntsev, M. A. Electric Current across the Metal-
Solid Electrolyte Interface. I. Direct Current, Current-Voltage Characteristic. phys. stat. sol.
(a) 1977, 39, 229–238.
129. Kornyshev, A. A.; Schmickler, W.; Vorotyntsev, M. A. Nonlocal electrostatic approach to the
problem of a double layer at a metal-electrolyte interface. Phys. Rev. B 1982, 25, 5244–5256.
130. Biesheuvel, M.; Franco, A. A.; Bazant, M. Z. Diffuse-charge effects in fuel-cell membranes.
Journal of the Electrochemical Society 2009, 156, B225–B233.
131. Bonnefont, A.; Argoul, F.; Bazant, M. Analysis of diffuse-layer effects on time-dependent
interfacial kinetics. J. Electroanal. Chem. 2001, 500, 52–61.
132. Chu, K. T.; Bazant, M. Z. Electrochemical thin films at and above the classical limiting
current. SIAM J. Appl. Math. 2005, 65, 1485–1505.
133. Biesheuvel, P.; Bazant, M. Nonlinear dynamics of capacitive charging and desalination by
porous electrodes. Physical Review E 2010, 81.
134. Biesheuvel, P.; Fu, Y.; Bazant, M. Diffuse charge and Faradaic reactions in porous electrodes.
Physical Review E 2011, 83.
135. Biesheuvel, P.; Fu, Y.; Bazant, M. Electrochemistry and capacitive charging of porous
electrodes in asymmetric multicomponent electrolytes. Russian Journal of Electrochemistry
2012,
136. Nauman, E. B.; Balsara, N. P. Phase Equilibria and the Landau-Ginzburg Functional. Fluid
Phase Equilib. 1989, 45, 229Ð250.
137. Islam, M. S.; Driscoll, D. J.; Fisher, C. A. J.; Slater, P. R. Atomic-scale investigation of
defects, dopants, and lithium transport in the LiFePO4 olivine-type battery material. Chem.
Mater. 2005, 17, 5085Ð5092.
51
138. Doyle, M.; Gozdz, A. S.; Schmuts, C. N.; Tarascon, J.-M.; Newman, J. Comparison of mod-
eling predictions with experimental data from plastic lithium ion cells. Journal of the Elec-
trochemical Society 1996, 143.
139. Delmas, C.; Maccario, M.; Croguennec, L.; Cras, F. L.; Weill, F. Lithium deintercalation of
LiFePO4 nanoparticles via a domino-cascade model. Nature Materials 2008, 7, 665–671.
140. Tang, M.; Belak, J. F.; Dorr, M. R. Anisotropic phase boundary morphology in nanoscale
olivine electrode particles. The Journal of Physical Chemistry C 2011, 115, 4922–4926.
141. Zhu, Y.; Wang, C. Galvanostatic intermittent titration technique for phase-transformation
electrodes. Journal of Physical Chemistry C 2010, 114, 2830–2841.
142. Ramana, C. V.; Mauger, A.; Gendron, F.; Julien, C. M.; Zaghib, K. Study of the Li-
Insertion/Extraction Process in LiFePO4/ FePO4. J. Power Sources 2009, 187, 555Ð564.
143. Cahn, J. W. Critical point wetting. J. Chem. Phys. 1977, 66, 3667–3672.
144. Sun, K.; Dillon, S. J. A mechanism for the improved rate capability of cathodes by lithium
phosphate surficial films. Electrochemistry Communications 2011, 13, 200–202.
145. Newman, J.; Thomas-Alyea, K. Electrochemical Systems, 3rd ed.; Wiley-Interscience, 2004.
146. Harris, S. J.; Timmons, A.; Baker, D. R.; Monroe, C. Direct in situ measurements of Li trans-
port in Li-ion battery negative electrodes. Chemical Physics Letters 2010, 485, 265Ð274.
147. Ramadesigan, V.; Northrop, P. W. C.; De, S.; Santhanagopalan, S.; Braatz, R. D.; Subrama-
nian, V. R. Modeling and Simulation of Lithium-Ion Batteries from a Systems Engineering
Perspective. Journal of The Electrochemical Society 2012, 159, R31–R45.
52


