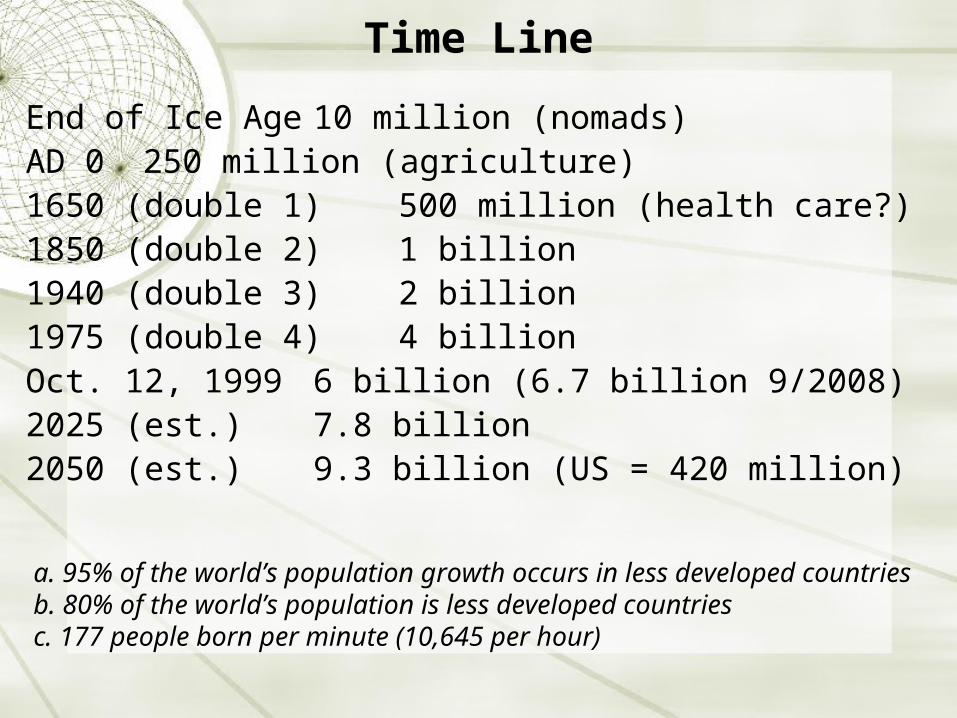
Time Line
End of Ice Age 10 million (nomads)AD 0 250 million (agriculture)1650 (double 1) 500 million (health care?)1850 (double 2) 1 billion1940 (double 3) 2 billion1975 (double 4) 4 billionOct. 12, 1999 6 billion (6.7 billion 9/2008)2025 (est.) 7.8 billion2050 (est.) 9.3 billion (US = 420 million)
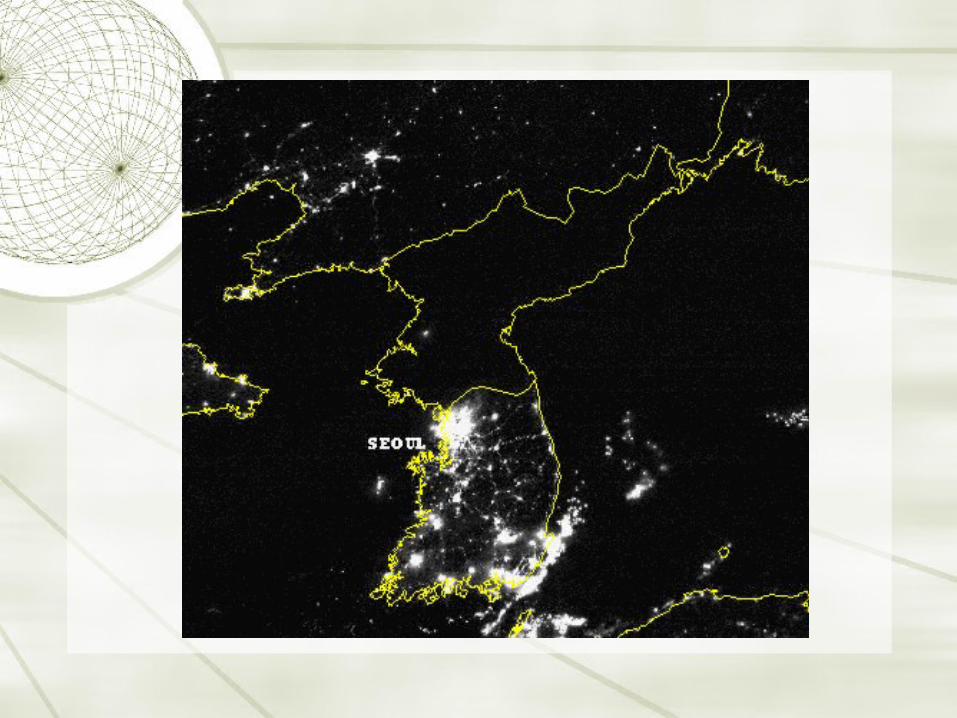
a. 95% of the world’s population growth occurs in less developed countriesb. 80% of the world’s population is less developed countriesc. 177 people born per minute (10,645 per hour)
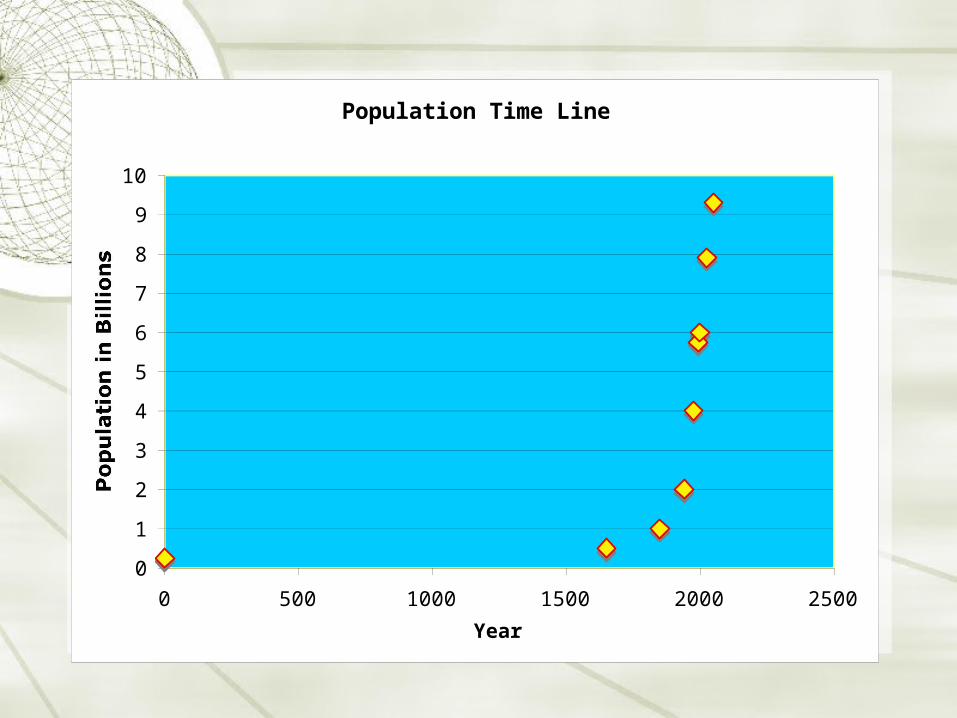
Population Time Line
0
1
2
3
4
5
6
7
8
9
10
0 500 1000 1500 2000 2500
Year
Population in Billions
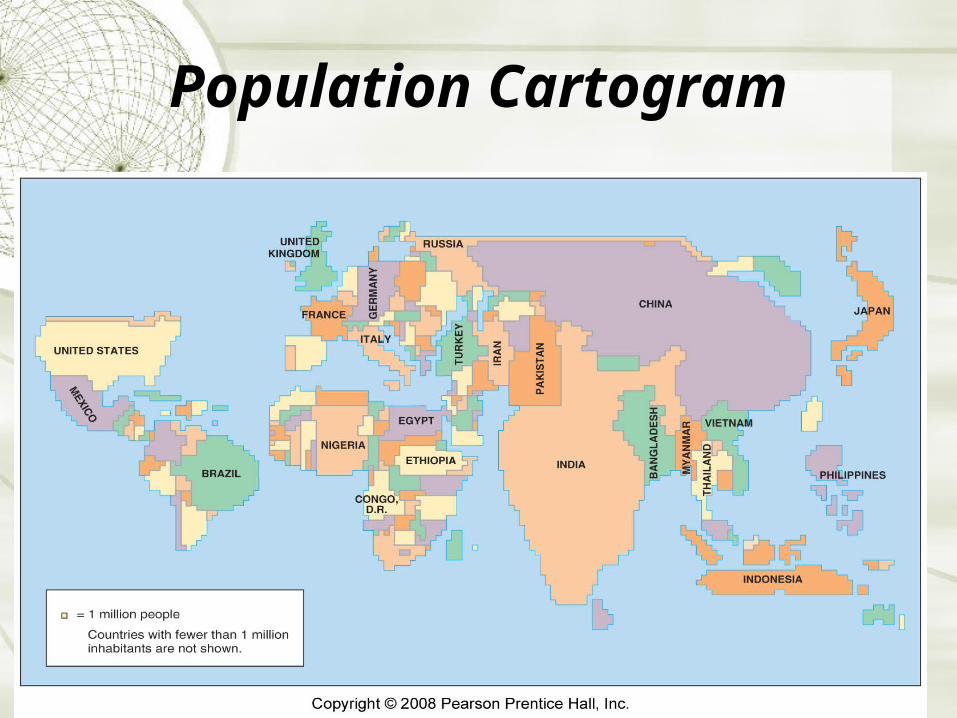
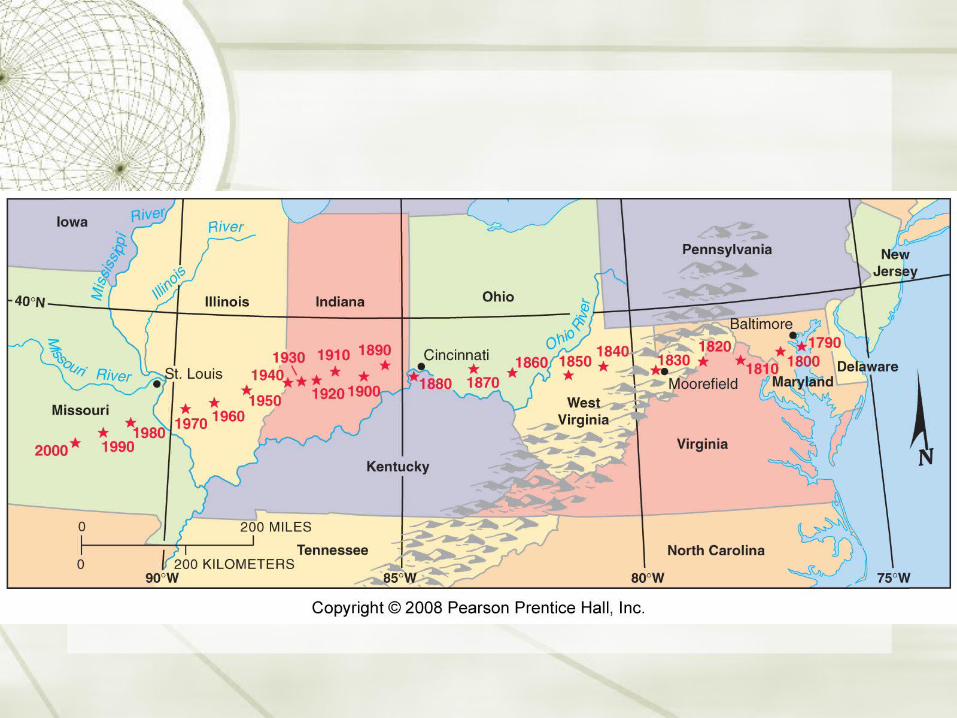
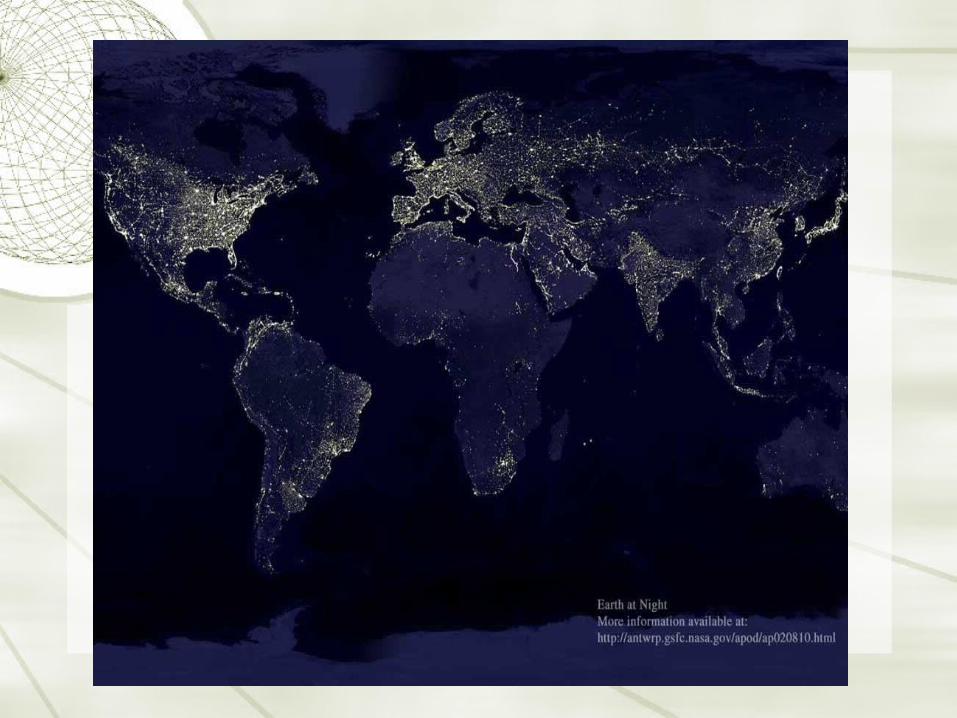
Population Cartogram
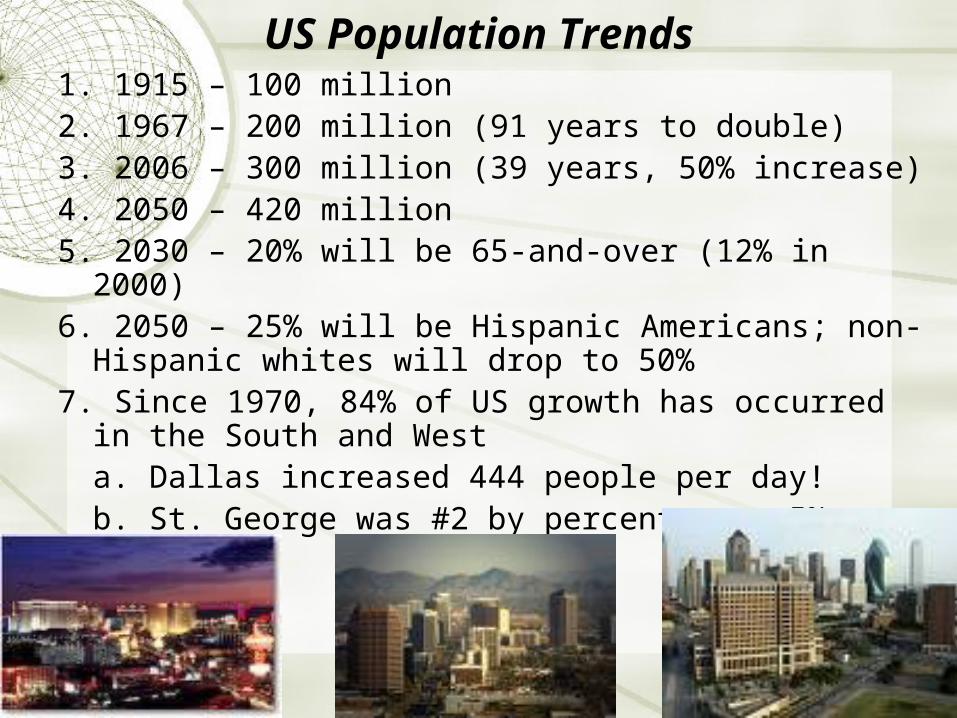
US Population Trends1. 1915 – 100 million2. 1967 – 200 million (91 years to double)3. 2006 – 300 million (39 years, 50% increase)4. 2050 – 420 million5. 2030 – 20% will be 65-and-over (12% in 2000)6. 2050 – 25% will be Hispanic Americans; non-Hispanic whites
will drop to 50%7. Since 1970, 84% of US growth has occurred in the South and
Westa. Dallas increased 444 people per day!b. St. George was #2 by percentage – 5%
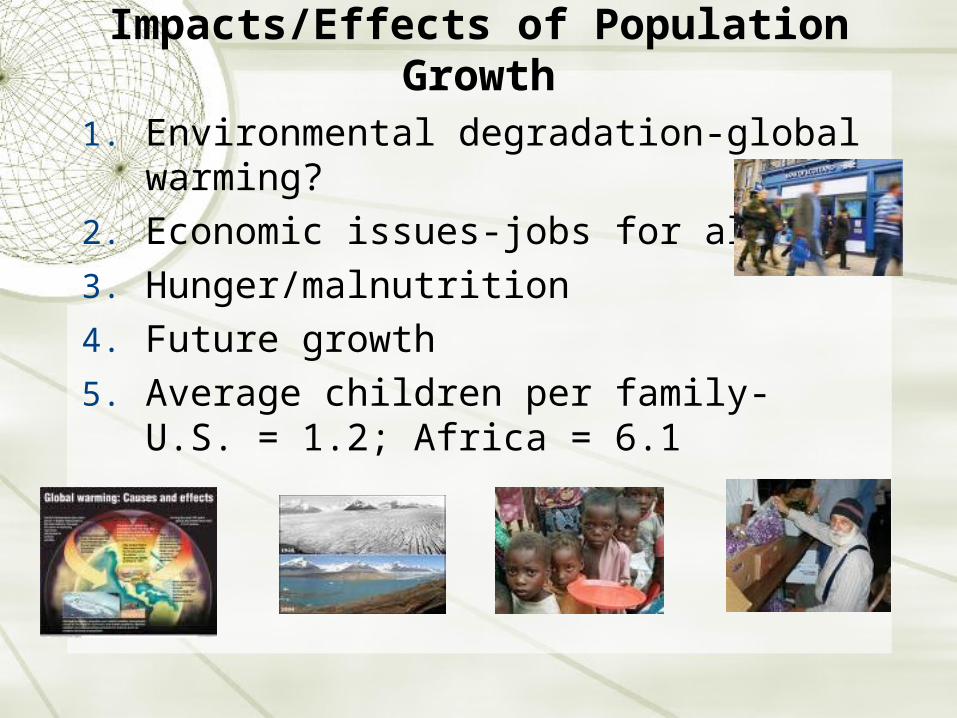
Impacts/Effects of Population Growth
1. Environmental degradation-global warming?
2. Economic issues-jobs for all?
3. Hunger/malnutrition
4. Future growth
5. Average children per family- U.S. = 1.2; Africa = 6.1
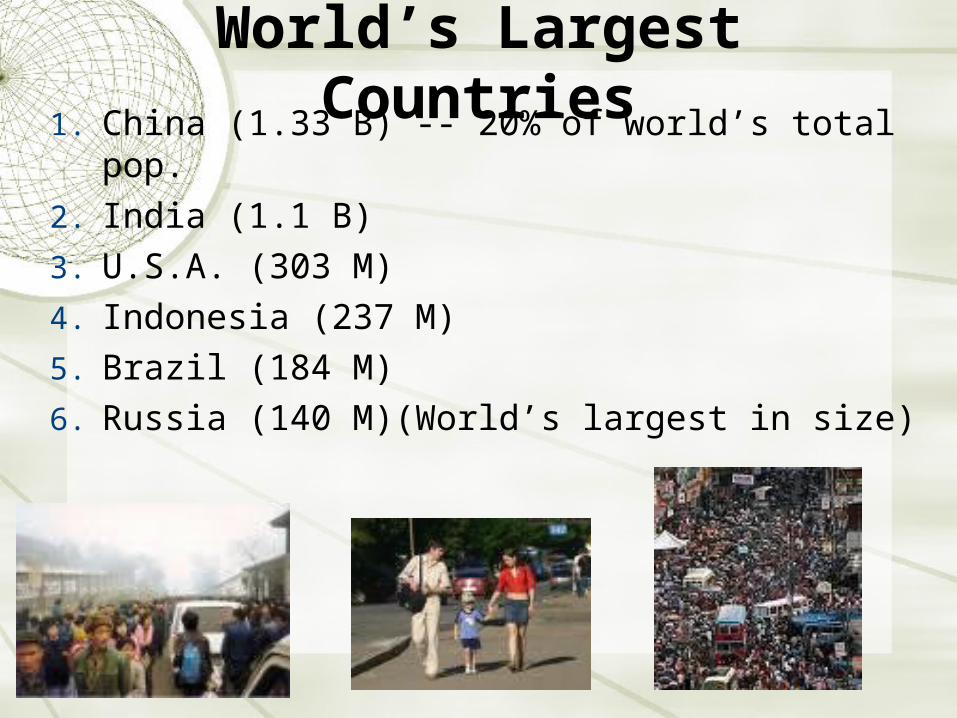
World’s Largest Countries1. China (1.33 B) -- 20% of world’s total pop.
2. India (1.1 B)
3. U.S.A. (303 M)
4. Indonesia (237 M)
5. Brazil (184 M)
6. Russia (140 M)(World’s largest in size)
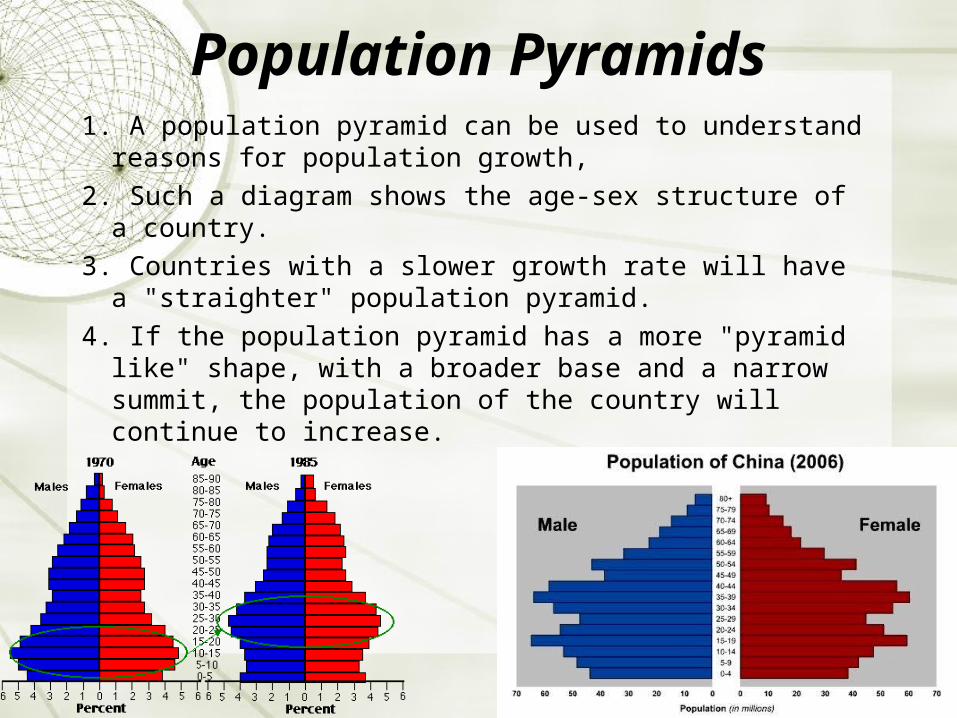
Population Pyramids1. A population pyramid can be used to understand reasons
for population growth,
2. Such a diagram shows the age-sex structure of a country.
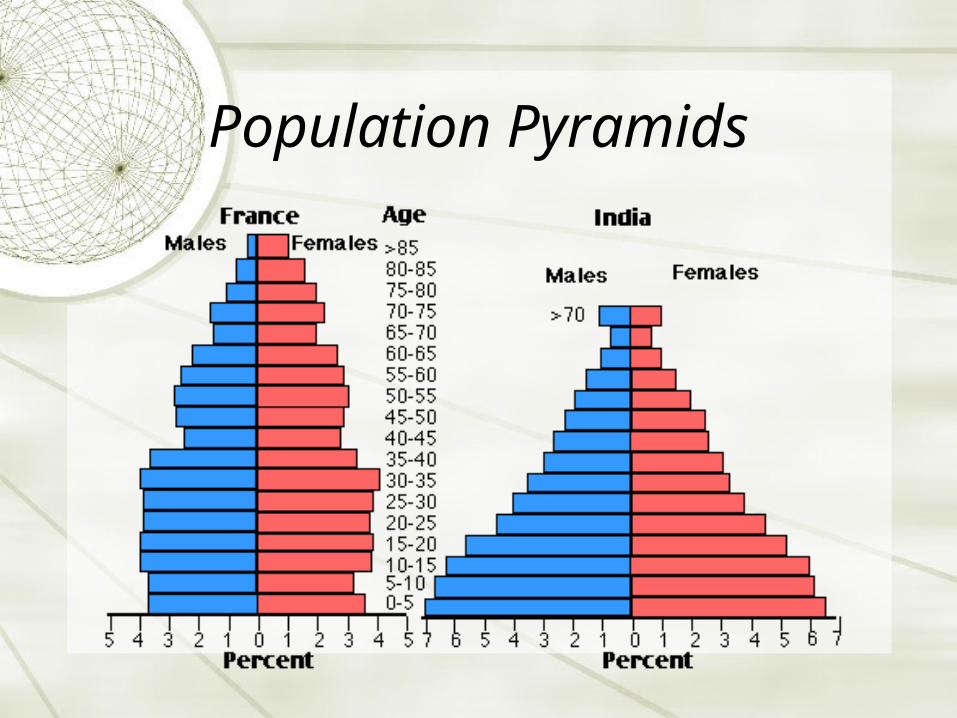
3. Countries with a slower growth rate will have a "straighter" population pyramid.
4. If the population pyramid has a more "pyramid like" shape, with a broader base and a narrow summit, the population of the country will continue to increase.
Population Pyramids
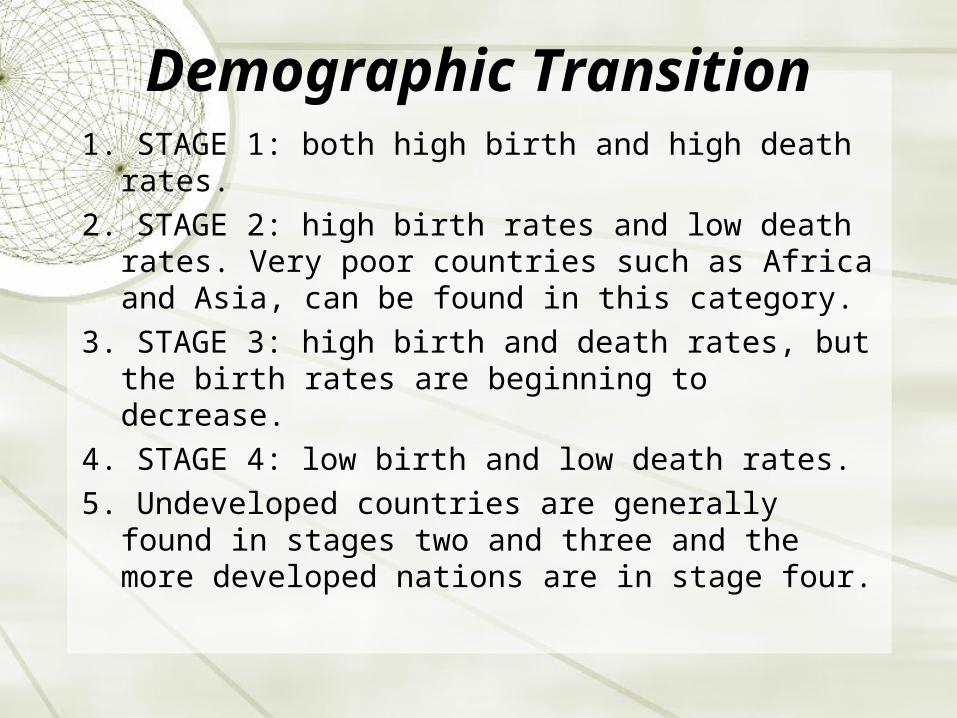
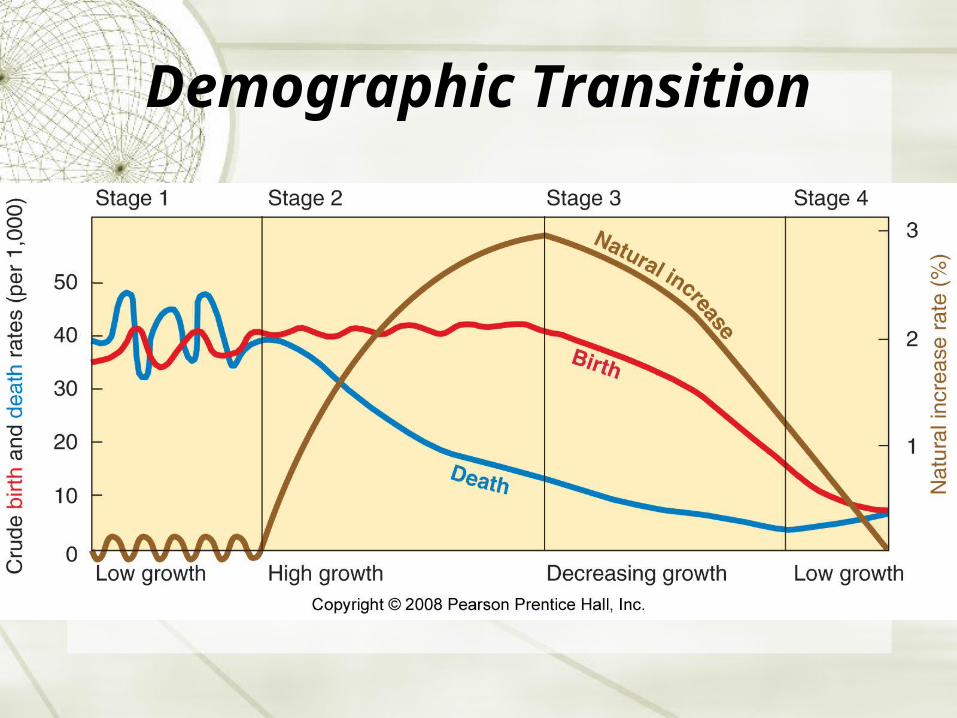
Demographic Transition1. STAGE 1: both high birth and high death rates.
2. STAGE 2: high birth rates and low death rates. Very poor countries such as Africa and Asia, can be found in this category.
3. STAGE 3: high birth and death rates, but the birth rates are beginning to decrease.
4. STAGE 4: low birth and low death rates.
5. Undeveloped countries are generally found in stages two and three and the more developed nations are in stage four.
Demographic Transition
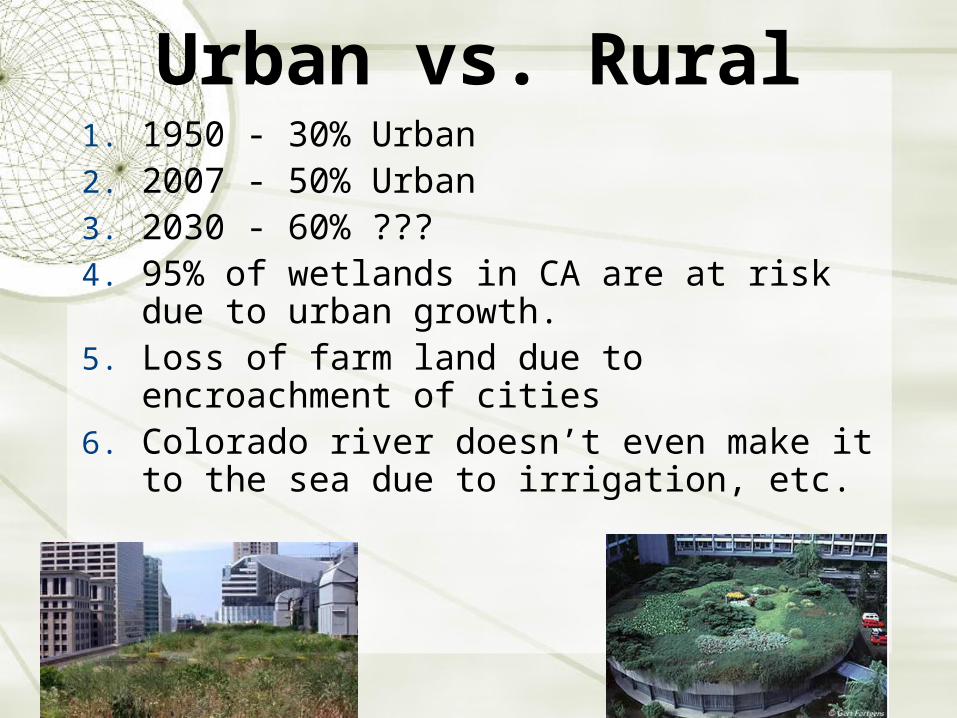
Urban vs. Rural1. 1950 - 30% Urban2. 2007 - 50% Urban3. 2030 - 60% ???4. 95% of wetlands in CA are at risk due to urban
growth.5. Loss of farm land due to encroachment of cities6. Colorado river doesn’t even make it to the sea
due to irrigation, etc.
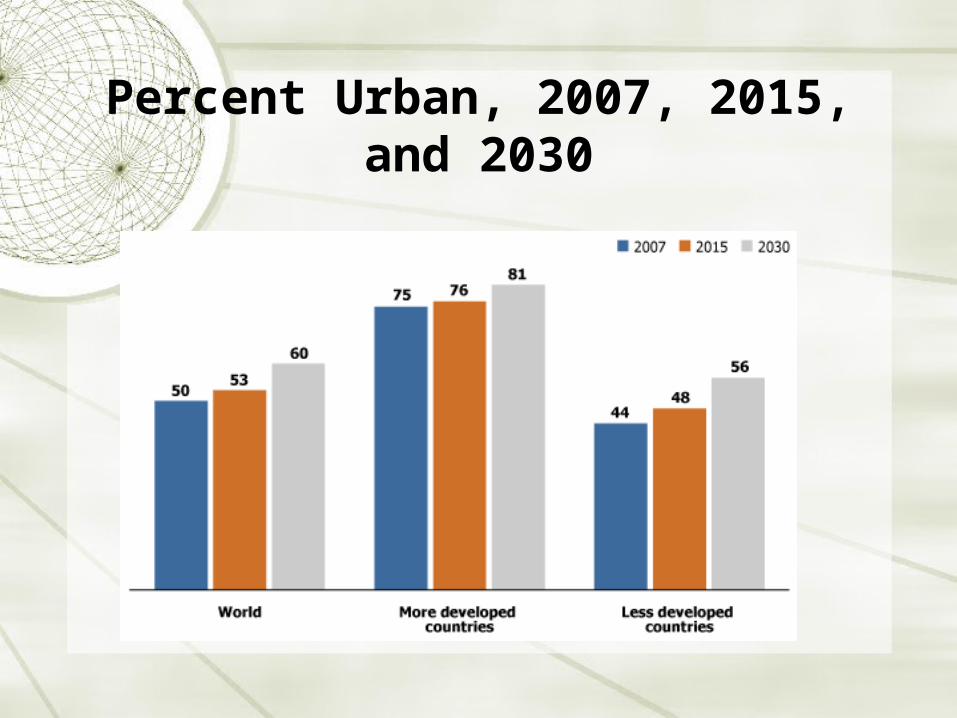
Percent Urban, 2007, 2015, and 2030
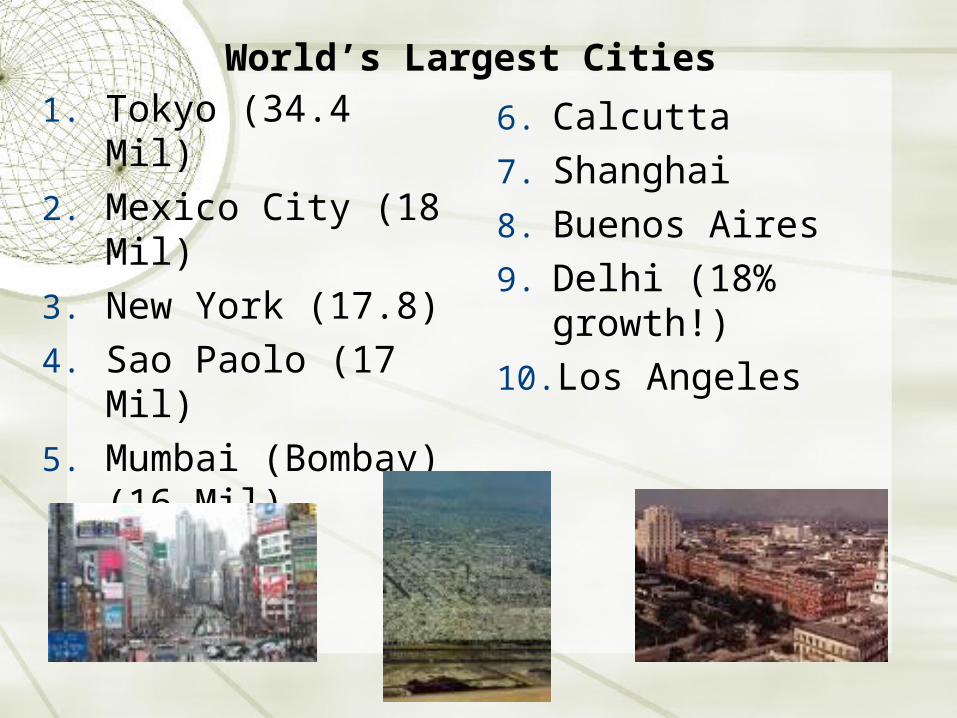
World’s Largest Cities1. Tokyo (34.4 Mil)
2. Mexico City (18 Mil)
3. New York (17.8)
4. Sao Paolo (17 Mil)
5. Mumbai (Bombay) (16 Mil)
6. Calcutta
7. Shanghai
8. Buenos Aires
9. Delhi (18% growth!)
10. Los Angeles
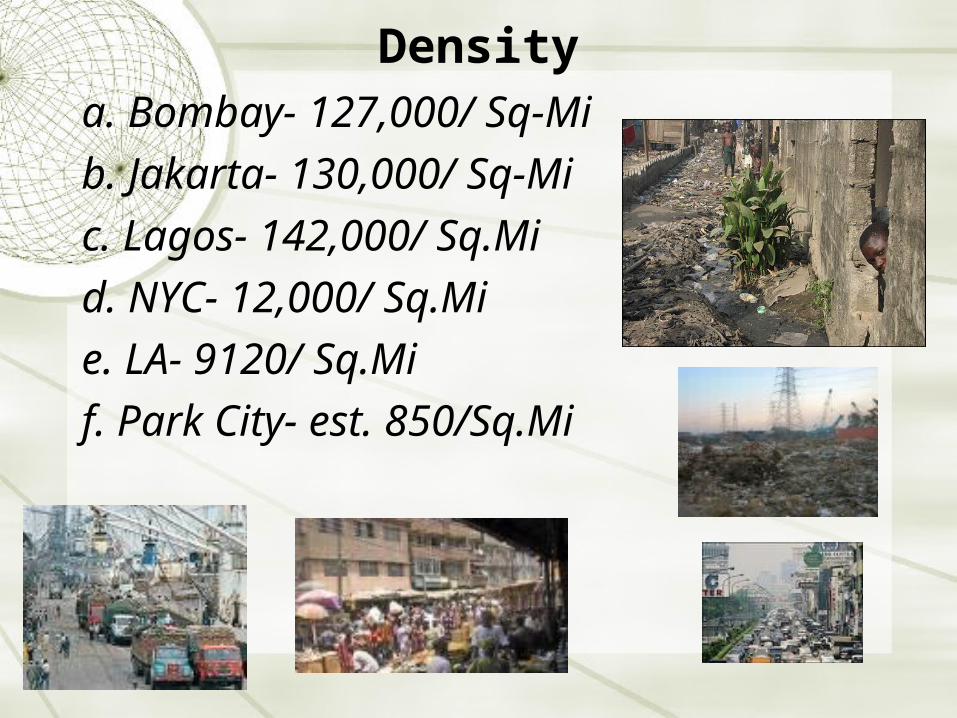
Densitya. Bombay- 127,000/ Sq-Mi
b. Jakarta- 130,000/ Sq-Mi
c. Lagos- 142,000/ Sq.Mi
d. NYC- 12,000/ Sq.Mi
e. LA- 9120/ Sq.Mi
f. Park City- est. 850/Sq.Mi
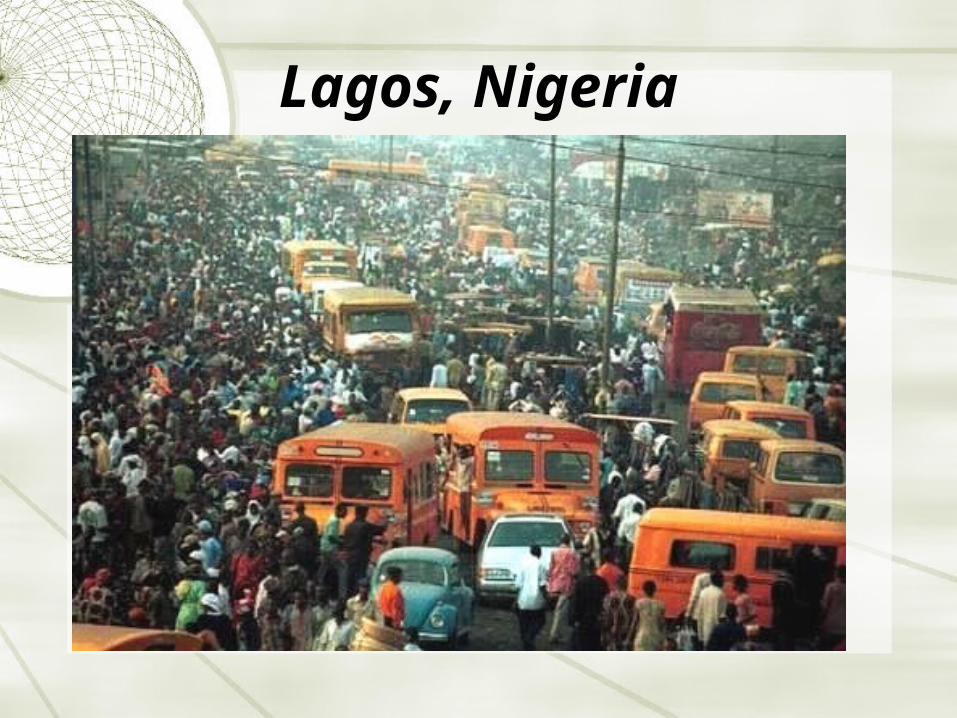
Lagos, Nigeria
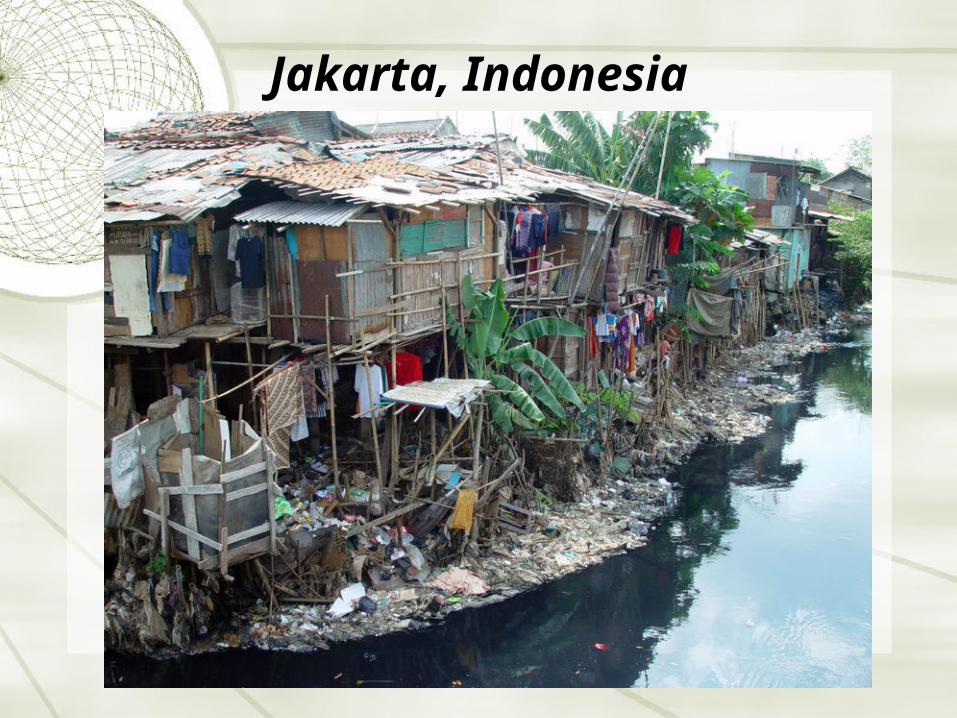
Jakarta, Indonesia
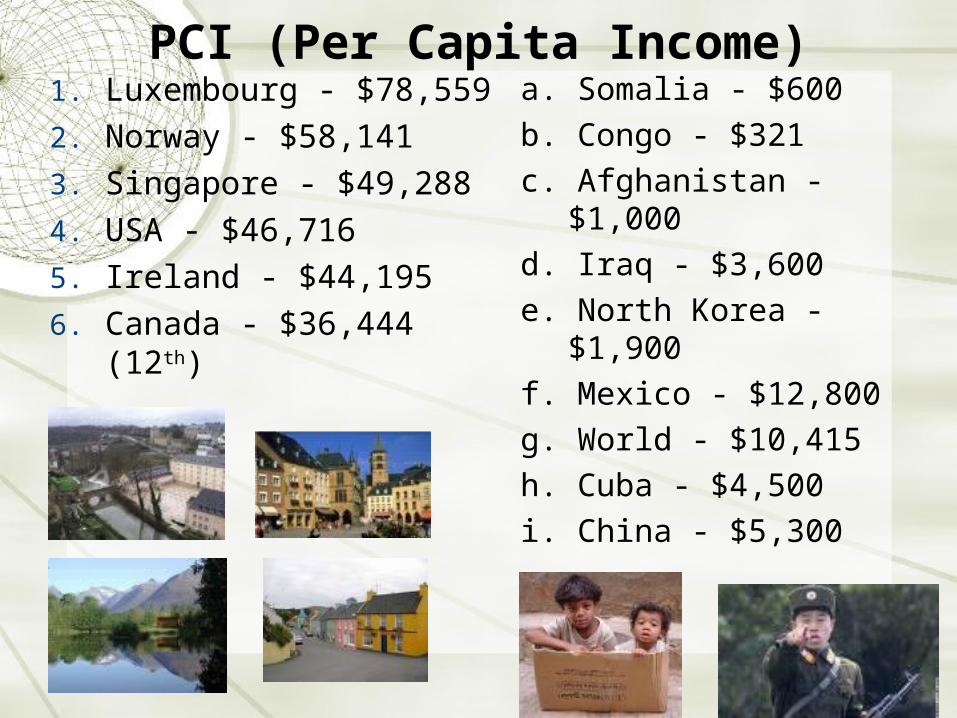
PCI (Per Capita Income)1. Luxembourg - $78,559
2. Norway - $58,141
3. Singapore - $49,288
4. USA - $46,716
5. Ireland - $44,195
6. Canada - $36,444 (12th)
a. Somalia - $600
b. Congo - $321
c. Afghanistan - $1,000
d. Iraq - $3,600
e. North Korea - $1,900
f. Mexico - $12,800
g. World - $10,415
h. Cuba - $4,500
i. China - $5,300
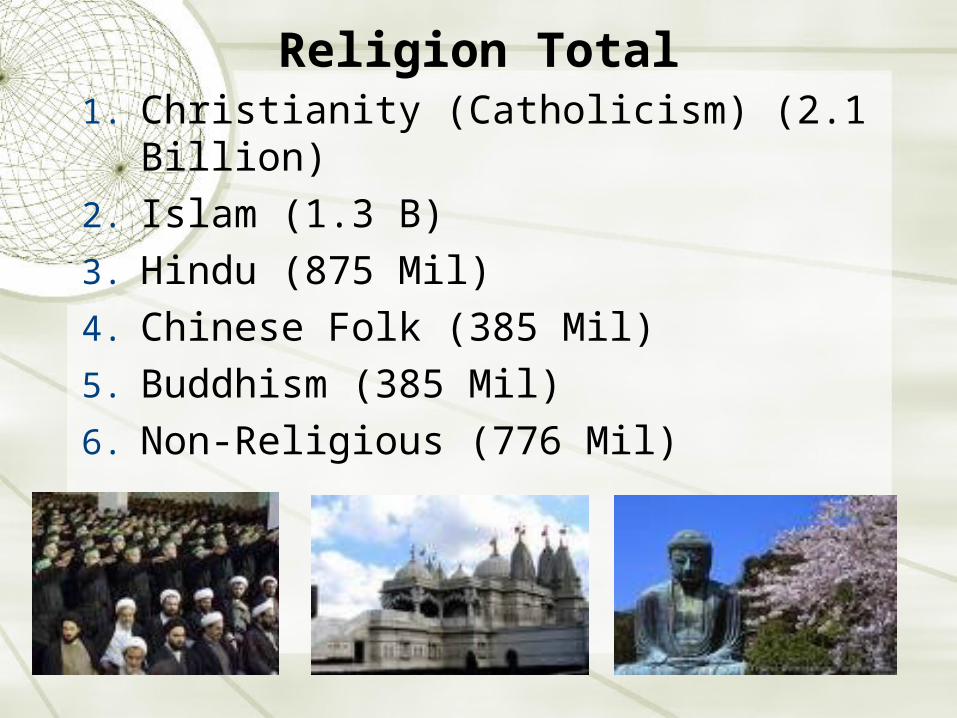
Religion Total1. Christianity (Catholicism) (2.1 Billion)
2. Islam (1.3 B)
3. Hindu (875 Mil)
4. Chinese Folk (385 Mil)
5. Buddhism (385 Mil)
6. Non-Religious (776 Mil)
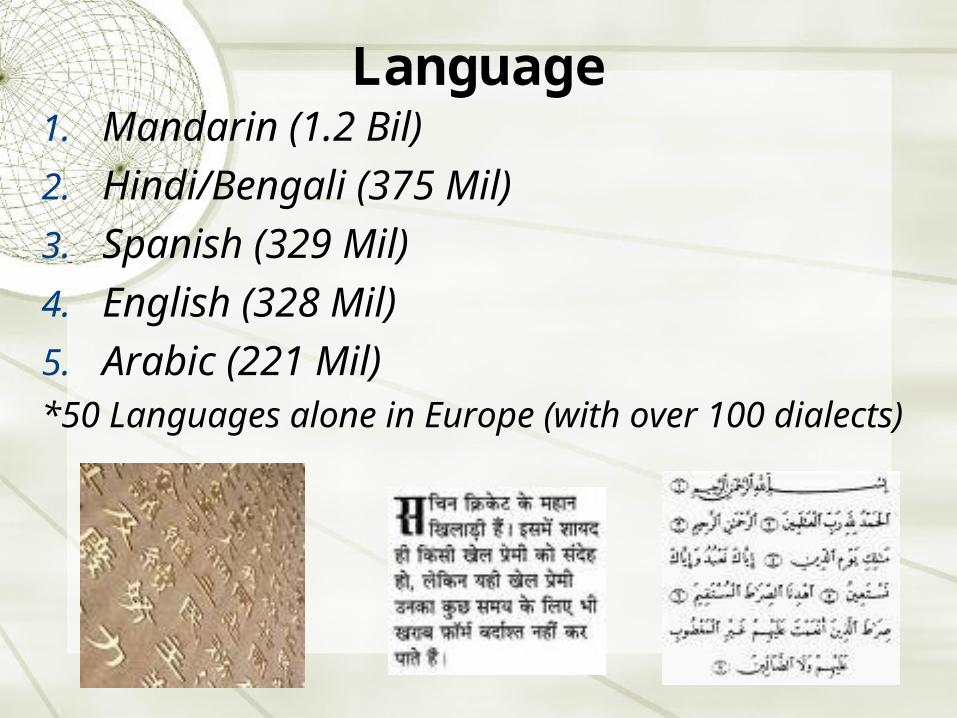
Language1. Mandarin (1.2 Bil)
2. Hindi/Bengali (375 Mil)
3. Spanish (329 Mil)
4. English (328 Mil)
5. Arabic (221 Mil)*50 Languages alone in Europe (with over 100 dialects)


