Title: Hazy messaging: Framing on Chinese social media during air pollution crises Authors and affiliations: Chris Cairns (Cornell University) & Elizabeth Plantan (Cornell University) Abstract: Environmental activists in China have heralded the advent of social media as a turning point in the environmental movement, praising microblogs like Sina Weibo for their ability to broadcast individual, localized complaints to a nationwide audience. However, what are the key frames that are originating on social media and who is responsible for spreading these messages? Do spikes in Weibo activity during environmental crises match with real-world surges in pollution or do they occur when key posts from environmental leaders go viral? To what extent do Chinese government censors permit these frames to spread? Are they more likely to allow environmental leaders’ messages to spread, or do they prefer to use Weibo to solicit “input from the masses”? Using recent Weibo data, we identify crisis moments in 2012 that acted as exogenous shocks for the formation of activist frames intended to shape public opinion on air pollution. The paper combines time-series statistics with narrative detail about the actors creating such frames within the Chinese environmental community. This allows us to draw conclusions not only about the role of environmental activists in raising netizen awareness during crises, but also Chinese leaders’ strategy in managing this information.
Paper prepared for the Midwest Political Science Association Annual Meeting, Chicago, IL, April 16-19, 2015
Cairns and Plantan 2
Introduction
The case of air pollution in China
Air pollution has become one of the most visible (quite literally) environmental problems
in China over the last decade. From the off the charts “Airpocalypse” in 2013 to the March 2015
documentary “Under the Dome,” discussion of air pollution in China has dominated the media,
both foreign and domestic. Besides obvious environmental concerns, high levels of air pollution
have been connected to human health issues. In 2005, an estimated $112 billion was lost in
economic productivity due to the health impacts of air pollution, including medical expenses,
wage loss, and leisure loss (Matus et al. 2011). Given the enormous environmental, human health,
and economic costs, the Chinese government has tried to make air pollution a priority, including
adding air emissions targets (sulfur dioxide reductions) to cadre performance incentives at the
local level (Zhou et al. 2013).
Air pollution has been a problem in China for quite some time, but the issue became a
political flashpoint in 2012. Although daily Air Quality Index (AQI) data has been available in
many Chinese cities since the early 2000s, there was a more recent controversy over including
measurements of PM2.5 (particulate matter of 2.5 micrometers in diameter or less) in this data,
making it more fine-grained than the official data that only included the larger PM10 (Chan and
Yao 2008). The U.S. Embassy in Beijing has been recording and reporting its hourly PM2.5
readings since 2008, and this practice slowly spread to U.S. Embassies and Consulates across
China.1 The Chinese government asked the U.S. Embassy to stop reporting the data, but the
United States continued to release its information on Twitter. These reports – and accompanying
1 See www.stateair.net for up-to-date readings and archival data for Beijing, Chengdu, Guangzhou, Shanghai, and Shenyang.
Cairns and Plantan 3
commentary – also spread on Sina Weibo (the Chinese version of Twitter) creating more public
awareness of China’s air pollution problems.
In early January 2012, in response to mounting public pressure, the Chinese government
announced that it would be releasing more detailed air quality data in Beijing using the PM2.5
standard by the end of January (Barboza 2012). Unfortunately for the government, air pollution
surged on January 10, 2012, going “beyond index” according to U.S. embassy PM2.5 data, but
air quality was still “good” on the official scale that only measured PM10 (AFP 2012). To make
matters worse, the Chinese government’s release of PM2.5 readings at the end of January
coincided with the Chinese Lunar New Year celebrations, when fireworks caused a spike in air
pollution (Bodeen 2012). Although the Chinese government was releasing data on PM2.5, these
measurements were suspiciously lower than the U.S. Embassy readings, which cast doubt over
whether official air quality measurements could be trusted. Throughout the spring, these sorts of
incidents continued to be covered in the foreign press and discussed online, but they culminated
in an official statement in June 2012. On World Environment Day (June 5), Wu Xiaoqing, the
Vice Minister of Environmental Protection, demanded that the U.S. Embassy stop releasing its
air pollution data (Ford 2012). He argued that it was unfair to judge China’s air pollution using
American standards, since China was at a different level of development. This comment set off a
firestorm on Weibo, as netizens both mocked the Vice Minister’s statement and generated much
debate about the Chinese government’s responsibility to solve the problem of air pollution.
From the January 2012 spike in air pollution to the June 2012 official statement, the
events of 2012 highlight a key feature of state-society relations in China. Through its reform and
opening policies over the past several decades, China has opened its NGO sector and allowed for
some civil society development to help identify problems and improve governance. However, the
Cairns and Plantan 4
Chinese government, like many other authoritarian systems, also wants to carefully control and
manage its growing civil society. Along with this central tension between state control and
improving governance through social pressure, the rise of the Internet and social media has
presented both new opportunities and new challenges for state and societal forces alike. Spaces
like Weibo allow the general Chinese public to air grievances, such as complaints about
environmental degradation. Through this sharing of information, the central government can use
NGOs and social pressure from public opinion to improve environmental governance; however,
in pursuing this strategy, the government also risks allowing critics to use social media to
mobilize, and to spread issue frames that may damage leaders’ reputation.
Using the case of air pollution in 2012, this paper aims to better understand the
interaction of state and society through new media by asking four broad questions. What are the
key frames related to this issue that prevailed on social media in 2012, and who was responsible
for spreading these messages? Did spikes in Weibo activity corresponding to incidents that year
match with real-world surges in pollution or did they occur in response to viral posts from key
environmental leaders? To what extent did Chinese government censors permit these frames to
spread? Were they more likely to allow environmental leaders’ messages to spread, or did they
prefer to use Weibo to solicit “input from the masses”? We gain leverage on these questions by
using a unique dataset consisting of posts from some of Sina Weibo’s most influential users. This
dataset gives insight into the key air pollution-related issue frames that proliferated on social
media at the time, how messages from NGOs and other “policy entrepreneurs” (Mertha 2009)
might have affected this spread of information, and also to what degree the government chose to
censor (or not) this spread of information.
Cairns and Plantan 5
By focusing on this particular case, we contribute to the literature on civil society,
authoritarian regimes (and the problem of authoritarian control), environmental politics, and
science and technology studies. The relevant literature pertaining to each of these sub-disciplines
is discussed in detail in the next section. After that, we develop expectations and hypotheses for
the answers to our key research questions enumerated above. Then, we explain our methods and
data in detail before moving on to the analysis of our case and evaluation of our hypotheses in
light of the data. The conclusion of the paper reiterates our findings for key frames, messengers,
and government censorship and enumerates the plans for our future research as we continue to
analyze and build our unique dataset.
Background
From environmental crisis to environmental consciousness
Environmental degradation in China has no doubt existed as long as humans have lived
on the Asian continent. However, the speed and scale of environmental degradation increased
dramatically at the beginning of the communist era. Following in the tradition of the Soviet
model, Chinese policies under Mao Zedong reflected the dominant ideology that humans “could
change nature and force it to serve them” (Bao 2010, p. 329). This ideology spurred huge Mao-
era industrial projects and massive campaigns that left devastating effects on the natural
environment (Shapiro 2001). Even in the post-Mao era, economic priorities in China continue to
cause widespread environmental degradation. Elizabeth Economy (2004) notes that Chinese
economic reform “is leaving as large a footprint on the natural environment as did centuries of
imperial, republican, and early Communist rule” (p. 64). From land to water to air, the Chinese
environment has been exploited and degraded while the Chinese government subordinated
environmental protection to goals for rapid economic development.
Cairns and Plantan 6
Despite the fact that the Chinese environment had endured centuries of degradation and
exploitation, civil society concern for the environment did not emerge until after economic
reform and opening. The increase in Chinese environmental NGOs over the past two decades can
be attributed to “the interaction between an increasing environmental crisis and the practice of
reforms and the open door policy” (Bao 2009, p. 7). More specifically, the emergence of
environmental organizations in China can be connected to the 1992 Rio Declaration on
Environment and Development, which allowed for the growth of environmental NGOs across
China as a way to meet national Agenda 21 goals for environmental protection (Xie 2011; Bao
2009). Many scholars have chronicled the rise of Chinese ENGOs during this period, from the
establishment of Friends of Nature and Global Village Beijing in 1993 to Green Earth Volunteers
in 1997 (Ho 2001; Xie 2011). These flagship NGOs learned mostly from the Western experience
and modeled their organizations on counterparts abroad. Chinese ENGOs responded to
environmental degradation both out of civic duty and the fact that the government was not
responding; meanwhile, the government responded to these ENGOs with a mix of policies “from
stringent control to tolerance and encouragement” (Ho 2001, p. 901). The government’s dual
strategy for managing environmental organizations echoes broader trends in the state-society
relationship.
State responses to a growing civil society and new technology
Assuming a link between civic associations and democracy (Putnam 1993), the
expectation is for an authoritarian regime to always choose to repress civil society to avoid its
own demise. However, the relationship between the Chinese government and its domestic civil
society is more complicated than a simple story of blanket repression. Some civil society groups
can be useful, including those that provide crucial social service provision and those groups that
Cairns and Plantan 7
align with state goals (Dickson 2011). Even with some allowance for civil society autonomy, the
state still carefully oversees the growing sector. This phenomenon – where a fairly autonomous
civil society exists concurrently with the rise of sophisticated state control – has been described
as “consultative authoritarianism” (Teets 2013). Input from civil society could result in better
governance as the state learns about and responds to key issues of public concern. Therefore, as
long as China continues its sophisticated measures of control, civil society will actually reinforce
and improve the current Chinese regime.
This background on the relationship of civil society and the state helps to explain why
expectations of the Internet as “liberation technology” (Diamond 2010) in China might be
premature. Since the introduction of the Internet into China in 1994, some have argued that the
technology has the potential to be a catalyst for social and political transformation in China
(Shirk 2010; Yang 2009; Qiang 2011). However, most China scholars have a measured view of
what the Internet means for Chinese society, being careful to note that the Internet is a tool, but
not a cause of political change (MacKinnon 2008; 2012). Similarly, others have noted that the
Internet is a “platform for state-society interactions” rather than a force for democratic change
(Noesselt 2014, p. 451). This is far from the idea that the Internet and new social media will
necessarily lead to rapid social and political change, as in the oft-cited examples of the Color
Revolutions and the Arab Spring. Instead, there are more nuanced views of how the Internet will
affect state-society relations in China much more in line with Teets’ (2013) “consultative
authoritarianism” or Jiang’s (2010) “authoritarian deliberation.” These alternative views of the
role of the Internet in China include the idea of online platforms as a “safety valve” for public
opinion (Hassid 2012), as an information gathering tool for the regime (Noesselt 2014), or as a
platform for that state’s own “strategic censorship” that allows corruption and other mis-
Cairns and Plantan 8
governance to be punished without overtly revealing the regime’s overall weakness (Lorentzen
2014).
While these explanations may be relevant for understanding state-society online
interactions generally, they are of limited use for understanding how the Chinese government
manages mobilization on social media during incidents like the 2012 U.S. Embassy controversy.
Rather, to explain what happened in this and similar “breaking incidents”, where discontent over
issues like pollution suddenly erupts into netizen consciousness, it is useful to take a more
abstract theoretical look at the relationship between authoritarian regime durability and media
freedom (for example, see Egorov, Guriev and Sonin 2009; Gehlbach and Sonin 2014; He and
Warren 2011). Much of this work focuses on autocrats’ problem with ascertaining their level of
popular support, since citizens and bureaucrats often withhold information out of fear. To
address this, savvy autocrats have established quasi-democratic institutions (Gandhi and
Przeworski 2007) that may serve as feedback mechanisms about popular discontent (Stockmann
2013; Lorentzen 2014).
The emergence of the Internet since the 1990s has injected a new technology into the
equation. However, while much descriptive work (Yang 2009; Zheng 2007; MacKinnon 2008;
Morozov 2011) has thoroughly illustrated the high degree of control successful autocrats
exercise over the Internet, it has not adequately addressed the nuanced control such regimes
exercise with respect to different online platforms and social groups. Additionally such work, in
our view, has focused too exclusively on the state’s rationale for using the Internet to gather
citizen opinions, neglecting other possible incentives that might affect its decision to allow or
suppress social mobilization online. While many reasons – fear of collective action, desire to
preserve reputation, or an ignorant public – exist for why the state censors, the non-censorship
Cairns and Plantan 9
(e.g. tolerance for civil society speech) that we occasionally observe is puzzling. One leading
explanation is that relaxing censorship increases media’s credibility with audiences, increasing
their “trust” in the central government (Stockmann 2013). While this explanation is well-
elaborated, it has thus far been applied only to explain the level of traditional (print) media
censorship, and has not been adapted to the unique context of social media.
Therefore, in addition to understanding which civil society actors used Weibo in 2012 to
speak out on air pollution and what frames they promoted, a second goal of this paper is to
develop and test theoretical expectations regarding what incentives the Chinese state had to not
censor social media at key points during the year, a phenomenon that we observe repeatedly in
our data despite the presence at times of topics theorized to bring about censorship (Ng 2014;
Zhu et al. 2012; Bamman, O’Connor and Smith 2011). Such variation, then, serves as a window
into how the government seeks to manage this emergent combination of ENGOs and
environmentally concerned netizens, vis-à-vis its own goals of survival and legitimation. In the
next section, we further develop our theoretical expectations in this area.
Research questions, theory, & hypotheses
Understanding the background of China’s environmental consciousness, the growth of
NGOs in China, and the state’s strategic response to civil society and management of social
media helps to give context to the research questions and theoretical expectations of this paper.
These, then, can be grouped into three main areas of focus: key frames and messengers, real-
world connections, and government censorship. We take each in turn below.
Key frames and messengers
First, what were the key frames that originated on social media in 2012 and who was
responsible for spreading these messages? Using air pollution as our case suggests multiple
Cairns and Plantan 10
possible issue frames. One of the most intriguing ones is the juxtaposition of air pollution as an
issue of environmental protection, versus a threat to human health. Over the last few years,
Chinese citizens have become more and more concerned with the issue of air pollution.
According to a recent public opinion report, 31% of respondents considered air pollution as
among the biggest problems in China in 2008, while in 2013 47% considered it a big problem
(Pew Research Center 2013). This 16-point increase in concern about air pollution could be
attributed to growing public understanding of its impact on human health. Reporting on smog as
a threat to human health has steadily increased over the last few years, often reporting on high-
profile scientific studies linking air pollution to increased rates of lung cancer (World Cancer
Report 2014) and low birth weight (Dadvand et al. 2013). Furthermore, studies of the effects of
framing have shown that interest in and willingness to take action on climate change increases
when it is framed as an issue that impacts human health – instead of being framed as simply an
environmental issue (Maibach et al. 2010; Cardwell and Elliott 2013). Based on this, although
we consider both the environmental and human health frames of air pollution in our analysis, we
expect that the health frame will occur with more frequency than purely environmental frames in
discussions of this topic on Sina Weibo.
In addition to focusing on the environment versus health frames, this project also
considers a range of frames that fall under two broad categories: oppositional frames or state
frames. Oppositional frames are those that contain some element of government criticism –
including direct claims of government blame or responsibility and indirect comparisons of
China’s domestic situation to (better) standards abroad. State frames are those that are
perpetuated by the regime, mostly through official news channels or government propaganda.
Our expectation for when we will see state frames versus oppositional frames can be articulated

Cairns and Plantan 11
as “punctuated partial equilibria” (Mertha 2008; Baumgartner and Jones 1993). We expect that
the state will control the message and information surrounding air pollution most of the time, but
that this will be punctuated by brief moments of the opposition breaking through (which the state
reactively allows from time to time). Oppositional frames on air pollution can break through at
two distinct times: 1) during an external shock (such as severe pollution or a natural disaster),
and 2) when elite action opens the political opportunity structure and invokes a response from
civil society. The first situation is self-explanatory: at times of extreme pollution, we would
expect oppositional frames to surge. The second scenario describes a chain reaction. When a
member of the Chinese political elite takes action – often an embarrassing public statement or
position --this action is generally covered in the press, spreads on Weibo, and gives users the
opportunity to comment. This prime opening in the political opportunity structure gives
oppositional frames to chance to emerge and spread in response to and critique of elite action.2
Thus, within our dataset, we will look for surges in oppositional frames at these two key times.
Now that we know the key frames and expectations for when they will arise, we can
address who is responsible for spreading them. From studies on environmentalism in China, we
know that “highly resourced individuals” play a significant role in taking the lead on
environmental issues (Xie 2011, p. 220). These are people with access to networks, elites, and
information. Besides these influential individuals, Chinese ENGOs have an increasing presence
in China and regularly use the media “to expand their influence and to win support from the
public” (Bao 2009, p. 8). In addition to domestic Chinese ENGOs, there are several branches of
international ENGOs that operate in China, and scholars have shown that localized international
organizations (those with local offices) are more likely to be connected to the broader Chinese
2 While not central to our theoretical account here, such critique on the Chinese Internet often takes the form of humor, mockery or other subversive speech. Such speech, of course, has a long tradition of analysis in political science (see Scott 1985, 1990; Yang 2009; Herold and Marolt 2011; Cairns and Carlson 2014b)
Cairns and Plantan 12
environmental community (Xie 2011). This leads to three potential categories of non-state actors
for the purposes of this paper: domestic Chinese environmental NGO leaders, public intellectuals,
and branches of international environmental NGOs. These categories include both domestic and
international NGO influence and unaffiliated “highly resourced” Chinese celebrities or public
intellectuals who enjoy a broad following on platforms like Sina Weibo. In a future iteration of
this study, we will consider how these actors (specifically Pan Shiyi, Ma Jun, and Greenpeace
Beijing) frame the issue of air pollution, their relationship to the wider conversation on Sina
Weibo, and when the government chooses to censor (or not) posts from these actors.
Real-world connections
Our second research question goes beyond the issue of frames and messengers to
consider the relationship of commentary on Weibo with real-world conditions. Do spikes
in Weibo activity during environmental crises match with real-world surges in pollution or do
they occur when key posts from environmental leaders go viral? Under normal political
conditions, we expect that air pollution drives commentary on Weibo, particularly when air
pollution is worse than usual. This is because air pollution is a visible problem that ordinary
users on Weibo can easily see and experience the severity of the issue. It is not unexpected that
users will comment on issues that touch on their everyday experience. However, during other
times of relatively low air pollution, it is possible that the issue will be given greater attention.
For example, conversations about air pollution may increase during high-profile commentary or
a political scandal involving the issue of air pollution. Therefore, given a political shock, we
expect that users on Weibo will be more responsive to human-caused controversy than the actual
pollution conditions outdoors might suggest.
Government censorship
Cairns and Plantan 13
Finally, this paper considers several questions pertaining to the critical issue of
government censorship in China. To what extent did Chinese government censors allow air
pollution-related discussion to spread a) during 2012 overall and b) in response to shifting
external events throughout the year? Which specific frames were allowed and which suppressed?
Which non-state actors had the greatest latitude in not being censored? These questions are
answered in turn with a discussion of a broader theory of Internet censorship in China more
generally.
Over the course of the year, we expect that censorship during 2012 would be relatively
low, for multiple overlapping reasons. First, air pollution is an issue that as of 2012 had not
generated any significant street protests or other visible collective actions in China, in contrast to
more site-specific issues such as water pollution or the construction of chemical plants.
Additionally, the government does not view discussion of air pollution as inherently hostile to
the Communist Party’s legitimacy or continued rule – rather, certain bureaucratic groups, such as
the Ministry of Environmental Protection, may see an opportunity to increase trust among online
citizens by allowing discussion and then being seen to meet the public’s demands in this area.
Indeed, our theoretical claim is that that Chinese leaders selectively relaxed control over air
pollution discussion led by Weibo’s so-called “Big V” – high-profile bloggers – at key moments
throughout the year in order to increase the government’s perceived credibility to address the
issue in the eyes of China’s ascendant urban middle class. Weibo users are unrepresentative of
Chinese society and even Internet users, being much better educated than average; according to
recent survey data, they are also among the least trusting of the central government, and place
increasing priority on a healthy environment. Thus, the government cannot use traditional media
propaganda as effectively with this group. The bloggers we consider, however, did enjoy
Cairns and Plantan 14
widespread credibility with such an educated demographic. By occasionally allowing such Big V
to speak even during politically sensitive moments, and on sensitive topics, we argue that this
glaring absence of censorship was itself intended to signal to Weibo users that Beijing took their
concerns seriously.3
We also have specific censorship expectations for January versus June, for specific issue
frames, and for different authors that vary according to the potential of each to a) benefit the
government according to the mechanism above, b) make the government look bad, or c) further
collective action. We expect censorship to be low in January as the issue had not been politicized,
high in June around World Environment Day due to the government’s potential embarrassment
factor, but low later in June as the risk of acute embarrassment (in response to the Vice
Minister’s comments) ebbs but Chinese leaders see greater potential in appearing accountable to
the public.
Regarding specific frames, we expect opposition frames to be censored at higher rates
than state frames, particularly when these frames carry a risk of mobilizing society. When the
risk is lessened, however, and provided such opposition frames do not directly challenge state
legitimacy, they may be briefly allowed, a phenomenon that future versions of this paper will
investigate more deeply. Finally, we expect ENGOs and environmental campaigners to be
censored less, in general than other Big V. However, even censorship within Big V like Pan
Shiyi is likely to vary widely, depending on the overall level of political sensitivity at the time a
comment is made, and into which category (oppositional or loyal to the state) a given Big V’s
comment falls, with oppositional-framed tweets likely to be censored at a higher rate than loyal
tweets.
3 The full logic of this argument is beyond the present article’s scope, but is the core of one of the author’s dissertation work.
Cairns and Plantan 15
Methods
To test these hypotheses and expectations, we relied on a trailblazing dataset collected by
researchers at the University of Hong Kong that consisted of over 38,000 Weibo Big V (Fu, Chan
and Chau 2013), which the researchers defined as all users with a Verified user account status
and more than 10,000 followers as of January 2012.4 To our knowledge it is the most
comprehensive dataset of Weibo posts currently available and the methodology used to collect it
is described in detail in Fu, Chan and Chau (2013). Each row in the dataset consisted of one
social media post (including reposted or “retweeted” content) plus associated meta-data. The
data files did not include multimedia such as images or videos. We relied only on the post text,
and counted embedded reposts as part of the text.
As a first pass to only analyze data relevant to air pollution, we filtered out all posts that
contained one or more of the following keywords: “air pollution” (空气污染 or 大气污染), “air
quality” (空气质量 or 大气质量), “smog” (雾霾), “haze” (灰霾 or 灰雾), and “PM 2.5”.5 This
left 71,088 posts for all of 2012. The authors went through several stages of pre-coding exercises
to determine the key categories before moving on the full coded sample.6 Next, we assembled a
team of three coders, including the two co-authors and a third undergraduate, native Mandarin-
speaking assistant. We drew a fresh random sample of 500 posts for analysis, taken from all of
2012, and worked independently to assign them into categories.7 We then met to reconcile
divergent scores according to strict rules. Through this process, we were able to agree on a
consensus score for 473/500, or 94.6% of posts. As a backup procedure if consensus could not be
4 As part of the verification process, Sina confirms the identity of verified user applicants to be sure that they are the high profile individual applicants that they claim to be. 5 As a robustness check, a future version of this paper will search key dates during 2012 when discussion about pollution was known to spike, and holistically read for posts relevant to air pollution but not containing one of the above keywords, to ensure that keyword sampling does not induce a selection issue. 6 For a full description of this process, please see Appendix A. 7 Appendix A reports inter-coder reliability scores for this exercise.

Cairns and Plantan 16
reached but a majority was present, we broke impasses by voting in 16/500 or 3.2% of cases.
Finally, in a handful of cases (11/500, or 2.2%) there were two coders who gave divergent scores,
and a third who had given one or the other score (or picked a completely different category), but
after discussion was “on the fence” between the other two positions; we resolved this by flipping
a coin.8 This process resulted in a set of 500 random posts from Weibo, coded according to the
categories described below.
Category descriptions Table 1: Sentiment Categories
1. Domestic vis-à-vis foreign 4. News (or news plus comment) 2. Government blame/responsibility 5. AQI Monitoring 3. Environment vs. Health 6. Valence (positive, negative, or neutral)
For reference, Table 1 summarizes our sentiment categories, which we describe here in
greater detail. First, we wished to code whether a post contained the notion of Chinese
comparing the air quality situation in their own country to other countries or to the international
community: we termed this category domestic vis-à-vis foreign. Recent work by one of the
authors (Cairns and Carlson 2014a) has highlighted the prevalence of nationalist discourse on
Weibo and the pervasiveness of China’s and Chinese citizens’ view of themselves vis-à-vis the
situation in other countries, including as regards environment and quality of life. Such a
discourse, moreover, from top leaders’ view is invariably among the most sensitive and difficult
to manage of all political themes, invoking as it does questions of the state’s own legitimating
narrative. While codings of domestic vis-à-vis foreign encompassed both pro- and anti-state
commentary, we found that a large majority of such comments viewed the health and quality of
8 In a handful of cases, coders gave three different scores. We followed the same procedure as above, except with simultaneous persuasion attempts in three directions. Without exception, such discussion reduced the options on the table to two codings (no cases occurred where no coder agreed to switch positions after discussion). We then followed regular rules to resolve the two-way impasse.
Cairns and Plantan 17
life crisis in a negative light, and some of these posts could be read as reflecting poorly on
Beijing’s inability to deal with the problem.
A second and related category, then, was whether posts assigned any responsibility (or
even blame) to the Chinese government either for having allowed air pollution to worsen, or for
not doing enough to clean it up. We labeled this category simply government
responsibility/blame. To what extent Weibo users and the Big V were likely to hold the
government responsible for the problem of pollution is central to our project.
Next, we wished to determine whether air pollution-related comments frame the issue as
one of protecting the environment (for the environment’s sake) or as an issue of human health.
As mentioned in the theory section, given air pollution’s dire consequences for human health,
such as an increased risk of lung cancer, we expected to find more of the latter, which would
allow us to measure the extent of genuine netizen fear about pollution’s health consequences.
That said, we did not want to neglect the possibility that comments addressing air pollution for
its own sake – as integral to a clean and balanced environment and as a traditional environmental
NGO issue frame – might also co-exist on Weibo.
Fourth, we coded posts based on whether they consisted primarily of news, or news plus
comment (e.g. an embedded news story or news link, plus original netizen commentary). This
was easy to do and we achieved very high inter-coder agreement. We found that 268/500 or
53.6% posts contained news or news and comment. We counted mere reports (from newspapers,
monitoring centers, or government agencies) of daily pollution statistics in various cities as
“news”, but also coded these under a separate category, AQI monitoring. The remainder of news
contained a large amount of mostly official papers reporting on various local government efforts
Cairns and Plantan 18
to start publishing PM 2.5 data, as well as to implement various air quality standards. However,
other news also more directly addressed PM 2.5 and its health consequences.
Our final category, which we termed post valence, consisted of our general appraisal of
the “positive,” “negative,” or “neutral” tone of each post – we assigned this score in addition to
coding our other categories. The significance that valence took on depended on what other
codings we simultaneously applied to a given post. For example, if a post was coded government
responsibility/blame, and negative, this dual marking allowed us to signify posts that tended to
be critical of the Chinese government.
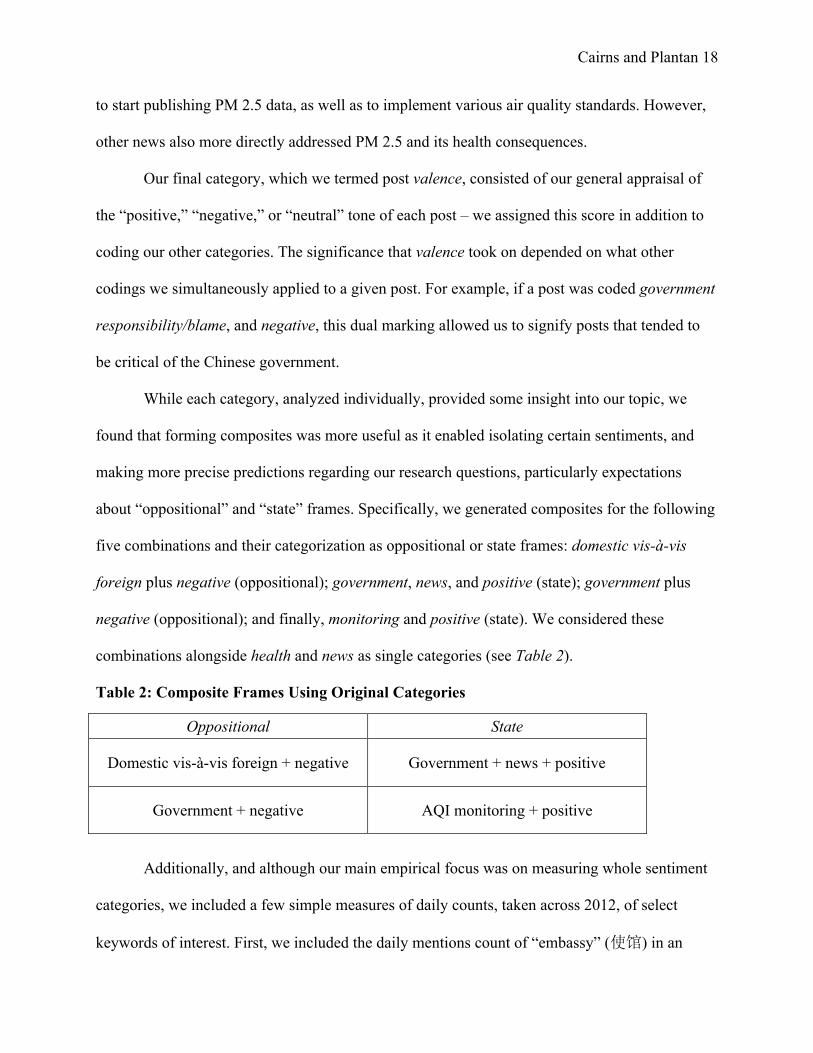
While each category, analyzed individually, provided some insight into our topic, we
found that forming composites was more useful as it enabled isolating certain sentiments, and
making more precise predictions regarding our research questions, particularly expectations
about “oppositional” and “state” frames. Specifically, we generated composites for the following
five combinations and their categorization as oppositional or state frames: domestic vis-à-vis
foreign plus negative (oppositional); government, news, and positive (state); government plus
negative (oppositional); and finally, monitoring and positive (state). We considered these
combinations alongside health and news as single categories (see Table 2).
Table 2: Composite Frames Using Original Categories
Oppositional State
Domestic vis-à-vis foreign + negative Government + news + positive
Government + negative AQI monitoring + positive
Additionally, and although our main empirical focus was on measuring whole sentiment
categories, we included a few simple measures of daily counts, taken across 2012, of select
keywords of interest. First, we included the daily mentions count of “embassy” (使馆) in an

Cairns and Plantan 19
attempt to capture yearlong discussion of the US embassy controversy. Second, we measured the
daily count of “PM 2.5” mentions, as a key scientific term that educated the general public about
air pollution’s threat to human health.
Our end goal for the sentiment categories and category combinations was to generate
yearlong time series of shifting category proportions, as a percentage of topic-relevant posts; this
allowed us to corroborate what categories dominated discussion at particular times with the
censorship rate on those days, and to test our theory at different levels of variation. However,
since drawing and coding a post sample from each of the year’s 364 days was infeasible given
available time and resources,9 we used a computer assisted text analysis (CATA) algorithm
called ReadMe (Hopkins and King 2010) to estimate the proportions.10 We present time series
graphs based on these proportion estimates along with our select keyword count graphs in the
next section.
Analysis of Overall Trends in 2012
To begin exploring our specific hypotheses, we first graph general trends throughout
2012 to show natural and human-made factors behind the ebb and flow of Weibo attention to air
pollution. Figure 1 below reveals the total daily counts of posts that contained one or more of our
selected keywords:11
9 The Hong Kong University dataset began collection on January 2 and ended on December 30 in order to collect exactly 52 even weeks, or 364 days of data (since 2012 was a leap year). 10 In brief, ReadMe functions by using the category information from a human-coded ‘training’ sample (in our case the 2012 whole-year sample), and the ‘features’ (word occurrences) from that sample to estimate about how many posts in an uncoded sample belong in each category, given these new posts’ word occurrence patterns. The algorithm requires optimizing across two parameters, although Hopkins and King (2010) find that it typically yields a root mean squared error within 2-3% of the true proportion. Cross-validating ReadMe results by drawing additional hand-coded samples for select days is necessary to test robustness, and we will do so in a future iteration. 11 To ease readability, we take the natural logarithm of all post counts (except for the Beijing air quality data, which is displayed normally, and the post censorship rate, displayed as a proportion).

Cairns and Plantan 20
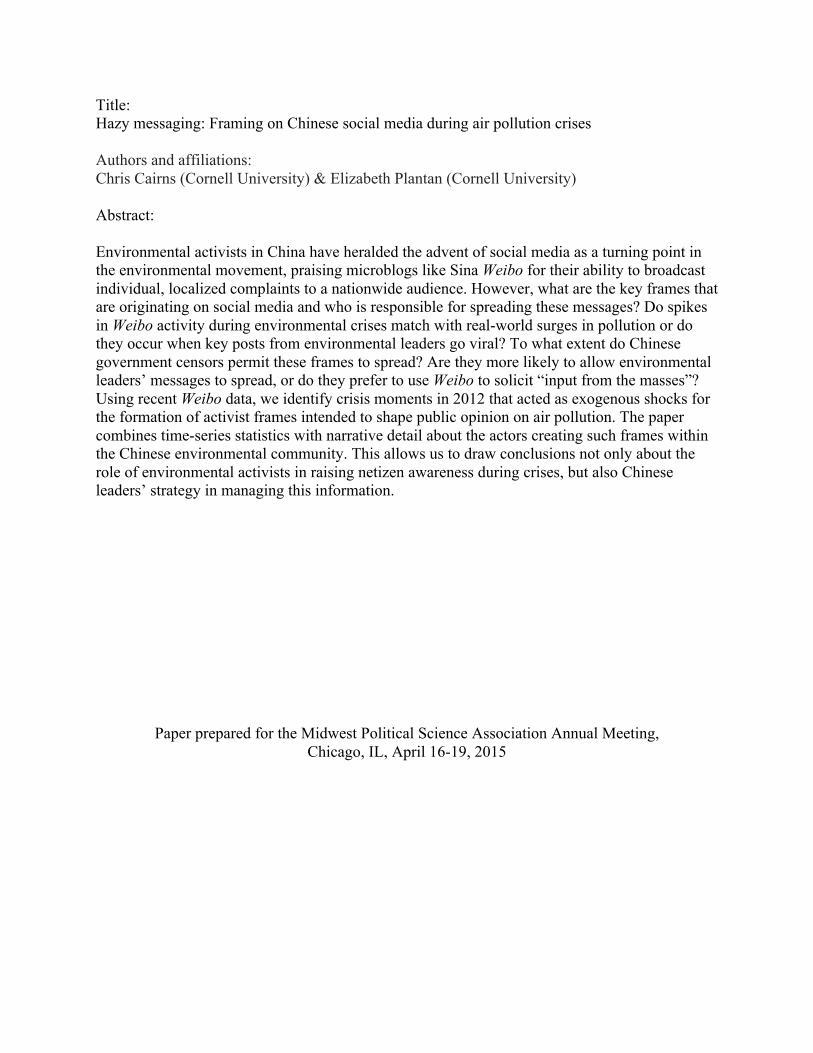
Figure 1: Daily Post Counts
At first glance, five major “spikes” or post surges are immediately evident. The first two
correspond to pollution surges in January (a sixth, small spike occurs in March). Below, Figure 2
displays daily volatility in the 2012 Beijing Air Quality Index (AQI) measured by the US
Embassy:
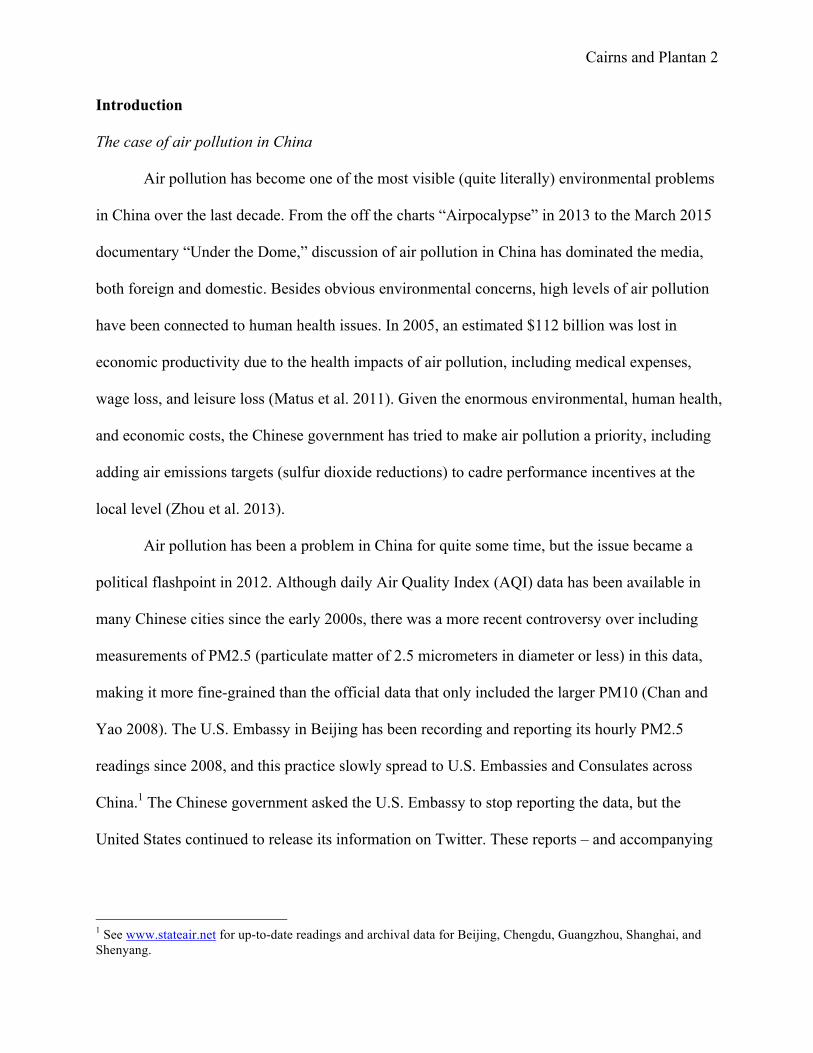
Figure 2: Beijing Daily Air Quality Index (AQI) Averages
Cairns and Plantan 21
From Figure 2, it is clear that pollution spikes considerably at the beginning of the year
in January 2012. This is not uncommon, as air pollution generally surges near the beginning and
the end of the calendar year, during the winter season. For the rest of the year, pollution ebbs and
flows, but it does not reach the same severe level that it did in January 2012. If we combine this
graph on AQI data with a graph of relevant posts, we can consider our hypothesis about real-
world drivers of air pollution discussions. Do spikes in air pollution cause matching spikes in
Weibo commentary on the topic? We can compare the actual AQI data in Figure 2 with
information about relevant posts about air pollution during the year (Figure 1).
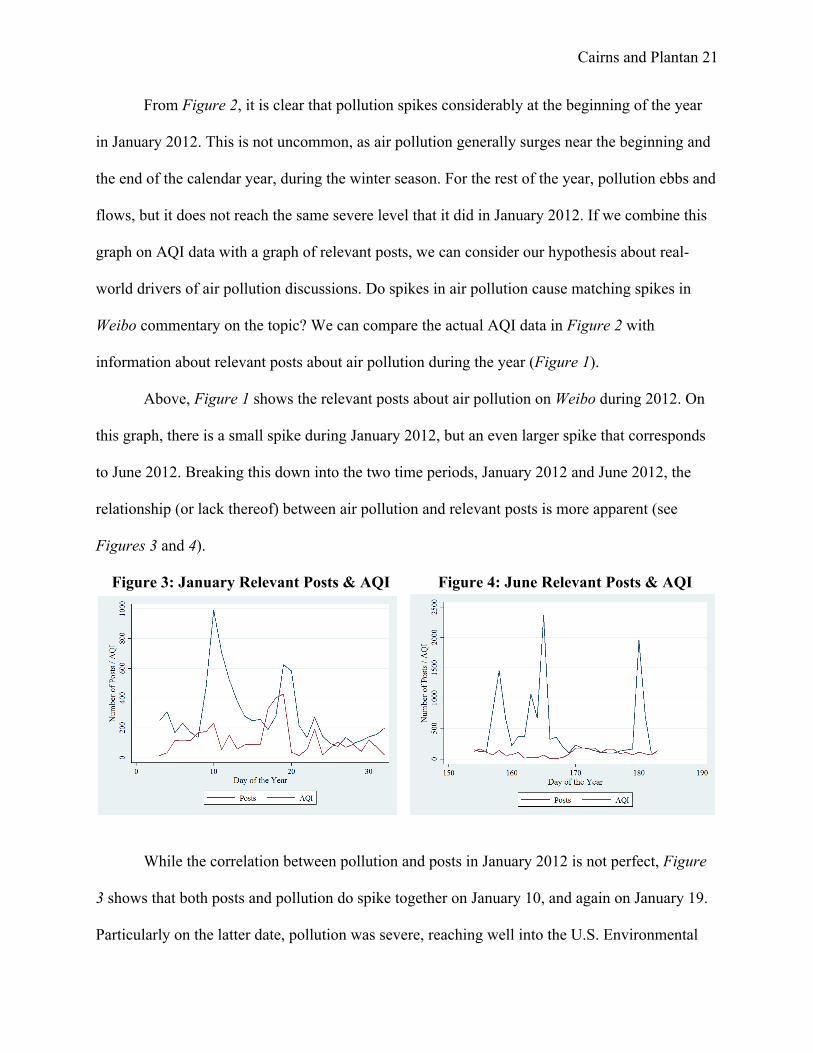
Above, Figure 1 shows the relevant posts about air pollution on Weibo during 2012. On
this graph, there is a small spike during January 2012, but an even larger spike that corresponds
to June 2012. Breaking this down into the two time periods, January 2012 and June 2012, the
relationship (or lack thereof) between air pollution and relevant posts is more apparent (see
Figures 3 and 4).
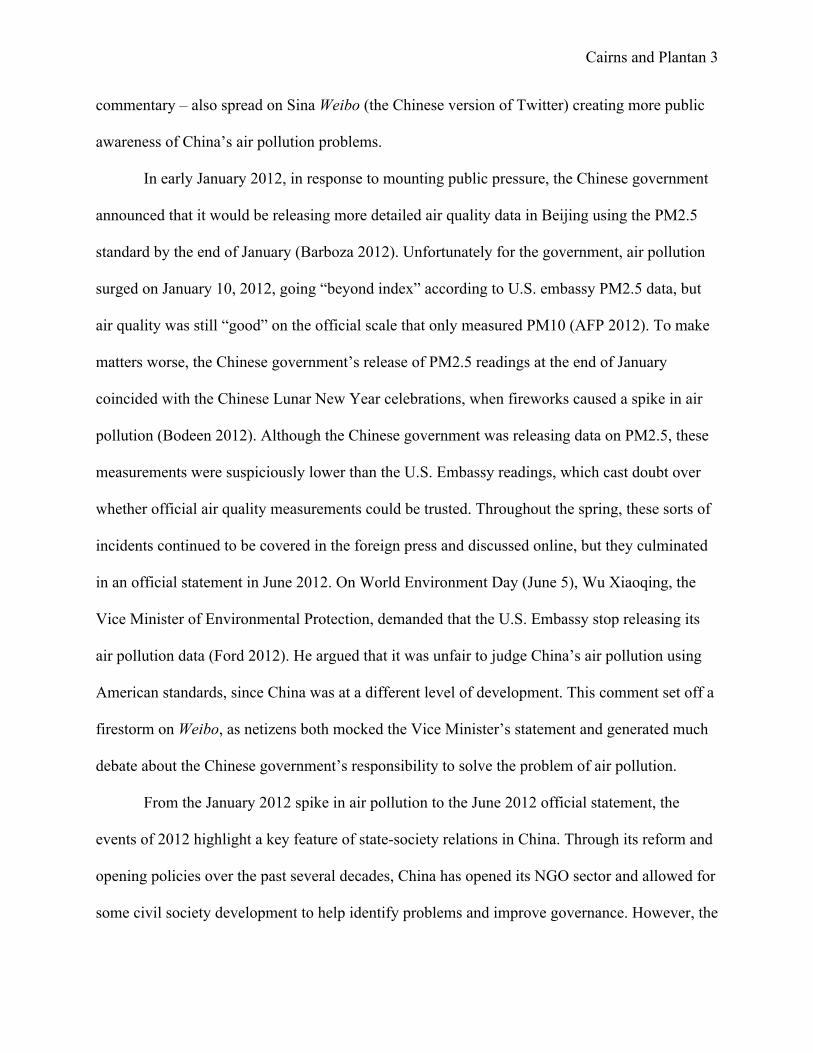
Figure 3: January Relevant Posts & AQI Figure 4: June Relevant Posts & AQI
While the correlation between pollution and posts in January 2012 is not perfect, Figure
3 shows that both posts and pollution do spike together on January 10, and again on January 19.
Particularly on the latter date, pollution was severe, reaching well into the U.S. Environmental

Cairns and Plantan 22
Protection Agency’s definition of “Hazardous.”12 Pollution was lower, on average, in June –
usually a relatively good time of the year for Beijing air quality. In contrast, Weibo post counts
spiked three times that month, all in response to human-caused events that will be discussed in
detail in the next section.
Using our coded categories and scores from ReadMe, we can further support the
argument that air pollution is related to posts in January, but not to posts in June. From the above
graphs and suggested relationships, we would expect our key coded variables on social media
posts to vary considerably between January and June. Table 3 reports the results of a simple
binary regression with key variables of interest and our exogenous shock (air pollution).
Table 3: Binary Regressions with Key Variables and AQI data
January 2012 AQI data
June 2012 AQI data
Government +
negative -0.364** (0.124)
-0.272 (0.329)
Government + news + positive
-1.049** (0.273)
0.101 (0.493)
US embassy
mentions 0.139
(0.233) -0.444 (0.324)
Government
censorship rate 0.073
(0.112) 0.003
(0.078)
N (N=days) 31 30 Standard errors in parentheses. † =p<0.10; *= p<0.05; **= p<0.01
For January, air pollution values strongly predict both a decrease in negative posts about the
government and a decrease in positive news articles about the government. However, there is no
significant relationship between AQI and mentions of the US Embassy or the true rate of
censorship. This suggests that the conversation on Sina Weibo in January was mostly driven by a
response to air quality conditions outside. Users may have flooded social media with information
12 Readings over 300 are “Hazardous.” Over 500 is “Beyond Index.”

Cairns and Plantan 23
on air quality during those times, with little response from the government in terms of positive
propaganda and very little critique of the government’s handling of the situation (given that the
government had not yet stepped up to address the issue). For June, however, air quality does not
reliably predict any of the key types of posts.
To better understand what is driving social media posts in January versus in June, it is
helpful to unpack this discrepancy by looking at key dates. Four key dates, one in January and
three in June, illustrate the overall trends and tone of posts on Weibo after an some sort of shock,
either exogenous (pollution itself) or due to government actions, as per our earlier hypothesis.
For June, there are three main human-caused shocks. The first was the Vice Minster’s World
Environment Day announcement, the second centered around Pan Shiyi’s tweet, and the third
was a retweet of a comment Han Han made on television, which Pan’s wife (and SOHO China
CEO) Zhang Xin posted and which Wang Lifen, a former CCTV host and Weibo “Big V,” re-
commented. These four mini-case studies – the January 2012 pollution spike, World
Environment Day, Pan Shiyi’s tweet, and the Han Han tweet – will be discussed in more detail in
the next section. First, however, we consider both trends in our main sentiment categories, and
the general year-long censorship trend. Figure 5 gives these trends and Figure 6 gives the
censorship rate:13
13 We calculate the censorship rate because the log count of censored posts is not very informative – normally, more posts equals more posts censored (deleted). The rate in Table Three is calculated directly from the WeiboScope data. For reasons explained in the Appendix, this calculation considerably underestimates the true rate. A future version of this paper will attempt to calculate the true rate. However, other work (Cairns and Carlson, 2014a, Appendix B) has shown that the true rate is a monotonic transformation of this ‘raw’ rate, so we can usefully use the latter to analyze broad trends (and sudden shifts) over time.
Cairns and Plantan 24
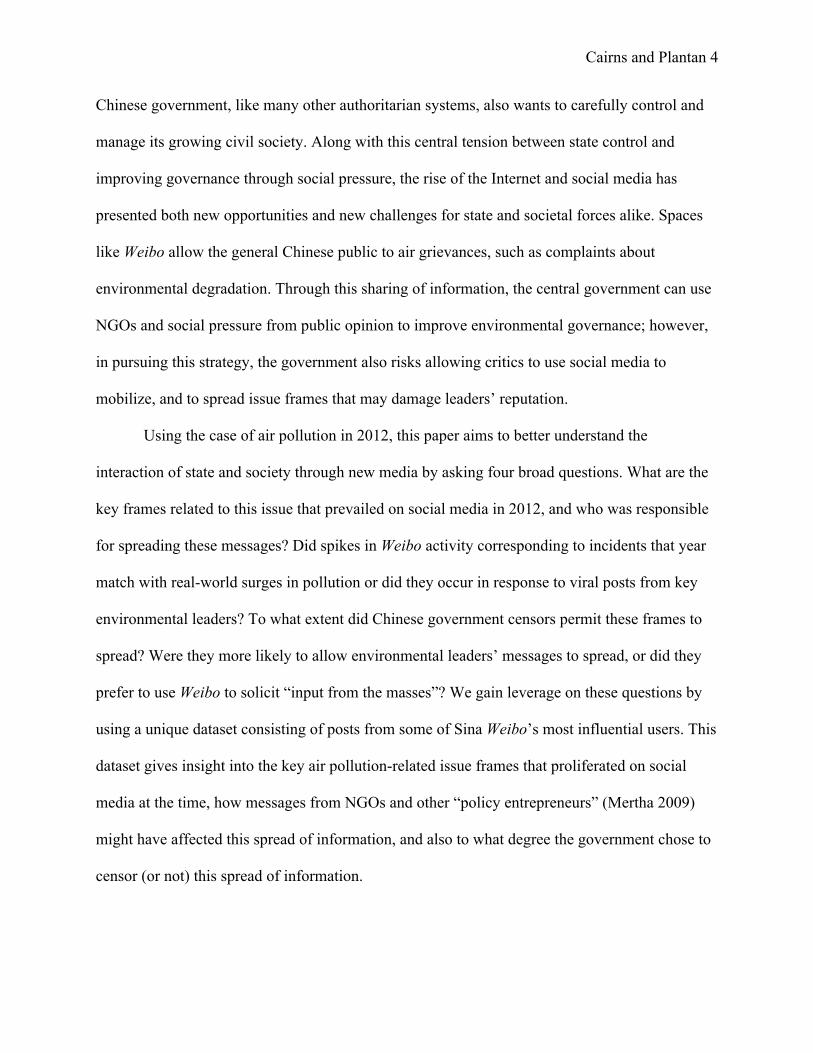
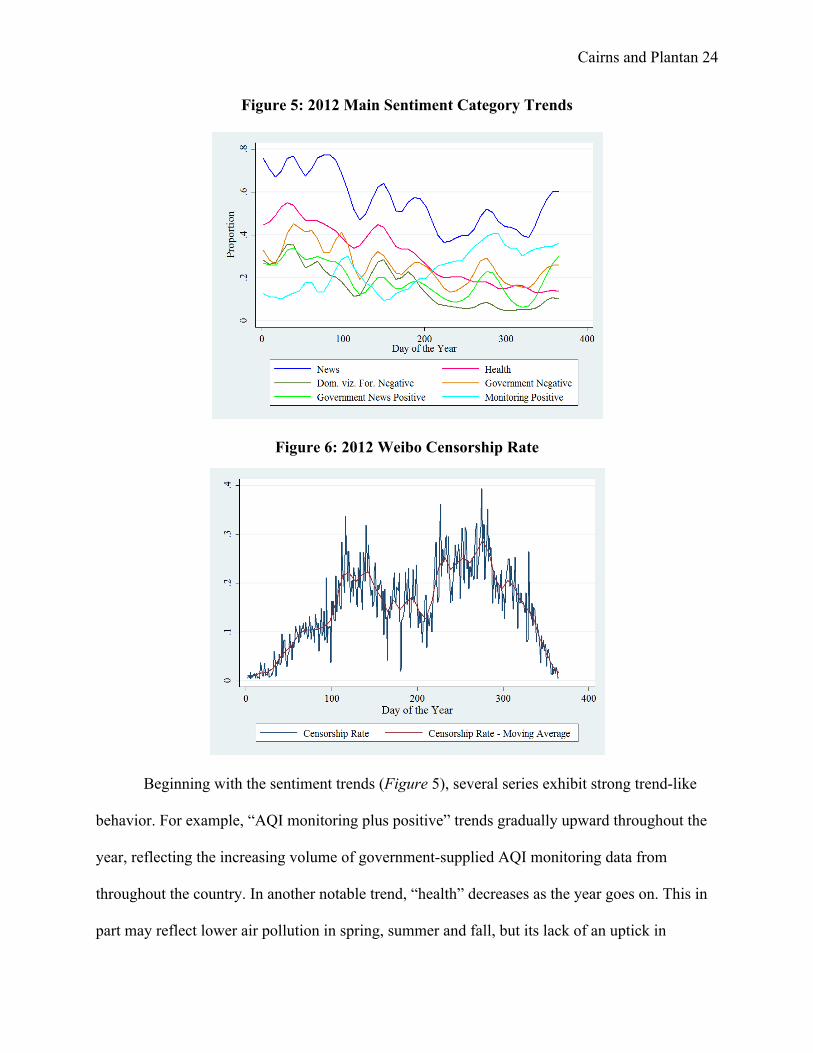
Figure 5: 2012 Main Sentiment Category Trends
Figure 6: 2012 Weibo Censorship Rate
Beginning with the sentiment trends (Figure 5), several series exhibit strong trend-like
behavior. For example, “AQI monitoring plus positive” trends gradually upward throughout the
year, reflecting the increasing volume of government-supplied AQI monitoring data from
throughout the country. In another notable trend, “health” decreases as the year goes on. This in
part may reflect lower air pollution in spring, summer and fall, but its lack of an uptick in
Cairns and Plantan 25
December suggests that pro-state sentiments may be taking over, displacing more negative (and
oppositional) discussions about pollution as health threat.14
Overall, censorship in 2012 (Figure 6) exhibited a U-shaped pattern – relatively low in
January and December, increasing in spring, and decreasing in late fall. Major exceptions to this
were the sudden drops in June, which are of major theoretical interest as they may indicate
intentional and strategically timed reductions in censorship by the state. In general, the U-shaped
trend is consistent with the notion that the Chinese government is more permissive of online
discussion when actual pollution is bad, and when post surges (which we later show) are
responding to real-world conditions, than when Weibo users react to human-caused incidents or
scandals. Through four case studies in the next section, we consider both natural, and human-
caused spikes and what evidence they provide to test our censorship hypotheses.
Analysis of key dates in 2012
Key Date 1: January 19 (Worst pollution)
On January 19, 2012, the air quality index in Beijing climbed over 400 – into the range
that the U.S. Environmental Protection Agency (used by the U.S. Embassy in Beijing for their
AQI readings) would deem extremely hazardous to human health. Although not the highest value
of AQI that Beijing has ever witnessed (during the “Airpocalypse” in 2013, pollution surpassed
the index’s limit of 500), this was the highest value for all of 2012 and drew attention to the issue
of pollution. To further unpack the kinds of comments that appear on social media during such
air pollution crises, we can look at data on that day’s relevant posts (see Figure 7).
14 While we coded both “Health” and “Environment” during the coding exercise, mentions of “Environment” in our 500 coded posts were too few for ReadMe to generate a reliable proportion for the whole year. In future versions of the paper, we will hand-code more “Environment” posts to feed ReadMe so that it can estimate the year-long trend. But, for now, knowing that the “Health” frame dominated the “Environment” frame is in line with our earlier hypotheses.
Cairns and Plantan 26
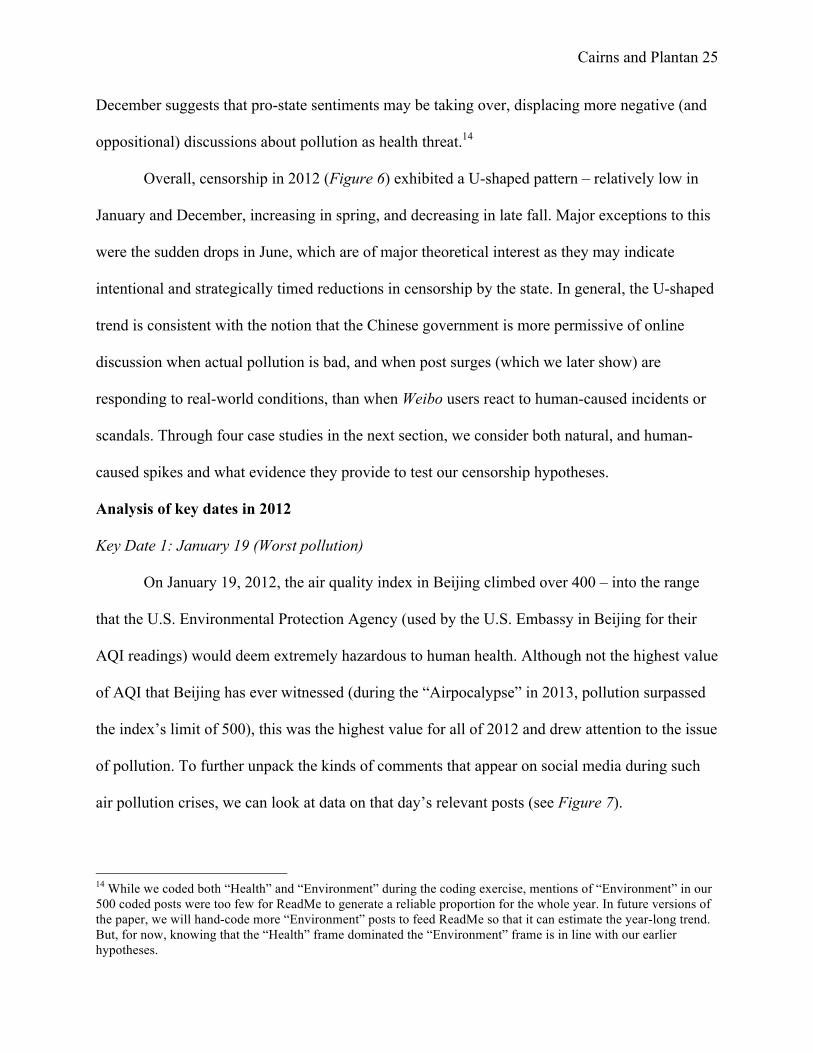
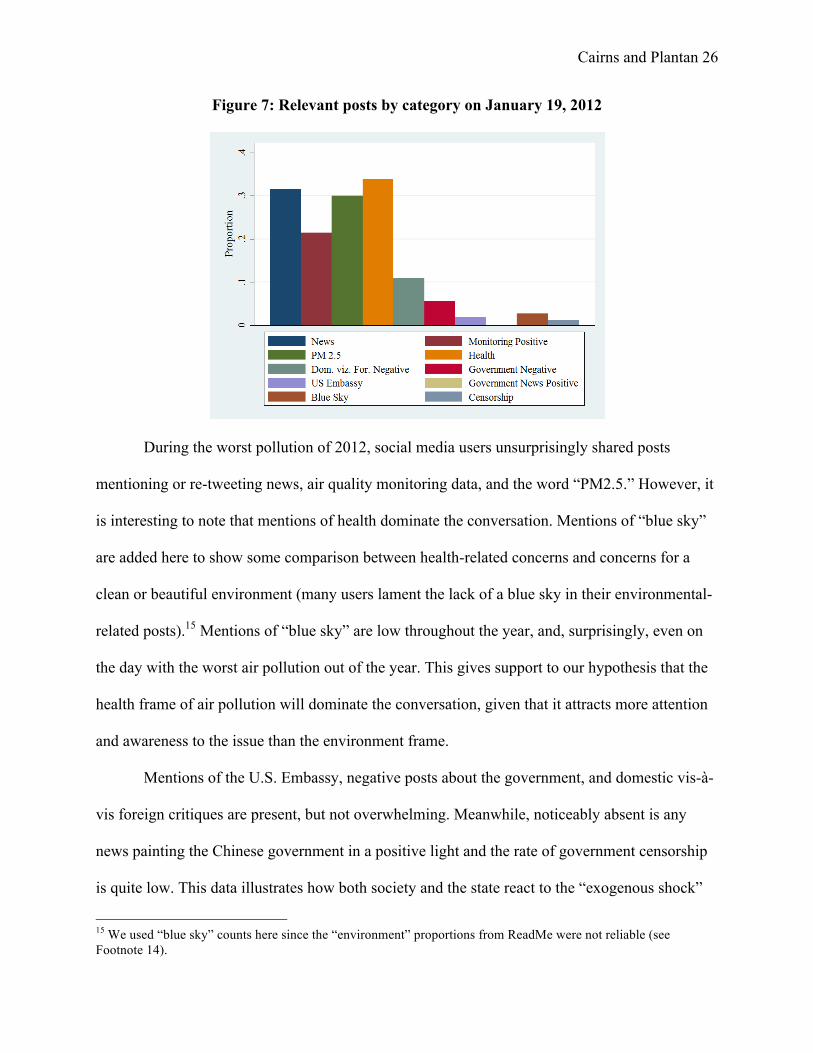
Figure 7: Relevant posts by category on January 19, 2012
During the worst pollution of 2012, social media users unsurprisingly shared posts
mentioning or re-tweeting news, air quality monitoring data, and the word “PM2.5.” However, it
is interesting to note that mentions of health dominate the conversation. Mentions of “blue sky”
are added here to show some comparison between health-related concerns and concerns for a
clean or beautiful environment (many users lament the lack of a blue sky in their environmental-
related posts).15 Mentions of “blue sky” are low throughout the year, and, surprisingly, even on
the day with the worst air pollution out of the year. This gives support to our hypothesis that the
health frame of air pollution will dominate the conversation, given that it attracts more attention
and awareness to the issue than the environment frame.
Mentions of the U.S. Embassy, negative posts about the government, and domestic vis-à-
vis foreign critiques are present, but not overwhelming. Meanwhile, noticeably absent is any
news painting the Chinese government in a positive light and the rate of government censorship
is quite low. This data illustrates how both society and the state react to the “exogenous shock”
15 We used “blue sky” counts here since the “environment” proportions from ReadMe were not reliable (see Footnote 14).
Cairns and Plantan 27
of severe air pollution. The public shares information and connects the pollution outside with
concerns about health. Meanwhile, unable to hide a natural phenomenon, the government
remains quiet and relatively inactive in terms of censorship. This fits with our earlier hypotheses
that spikes in air pollution will drive comments on Weibo (in absence of a political scandal), and
that government censors will allow these conversations to continue as long as they do not
become politicized or have a the potential for mobilization.
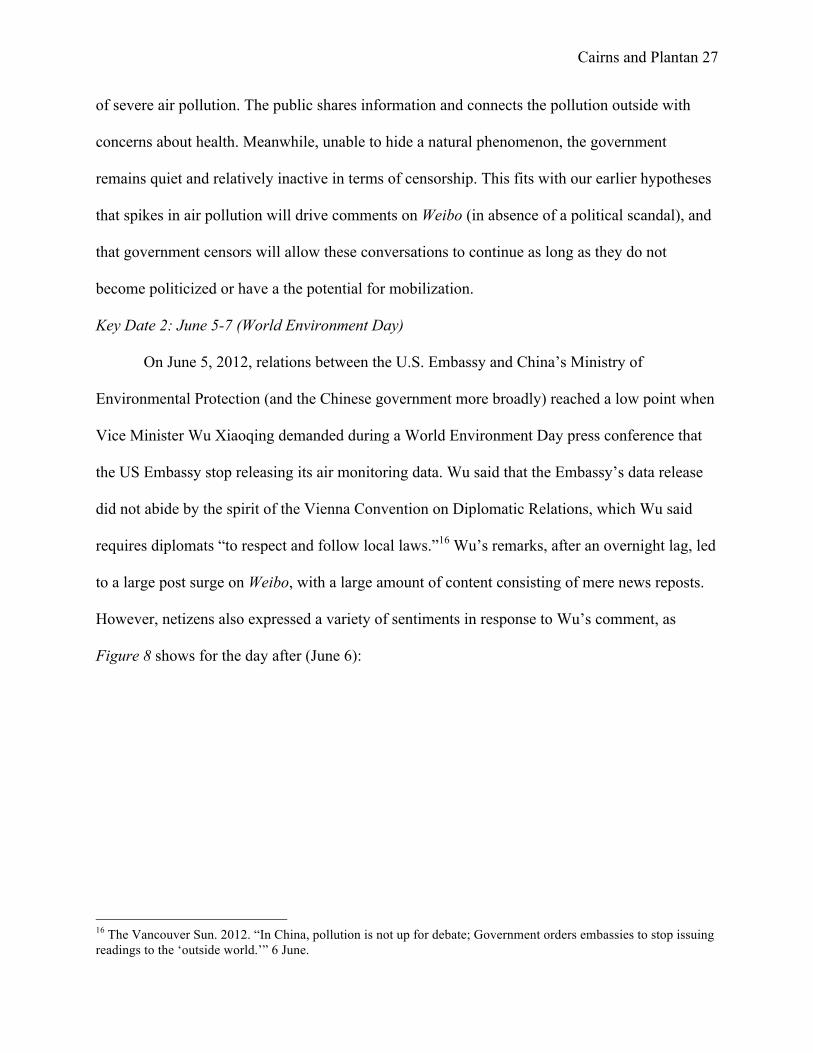
Key Date 2: June 5-7 (World Environment Day)
On June 5, 2012, relations between the U.S. Embassy and China’s Ministry of
Environmental Protection (and the Chinese government more broadly) reached a low point when
Vice Minister Wu Xiaoqing demanded during a World Environment Day press conference that
the US Embassy stop releasing its air monitoring data. Wu said that the Embassy’s data release
did not abide by the spirit of the Vienna Convention on Diplomatic Relations, which Wu said
requires diplomats “to respect and follow local laws.”16 Wu’s remarks, after an overnight lag, led
to a large post surge on Weibo, with a large amount of content consisting of mere news reposts.
However, netizens also expressed a variety of sentiments in response to Wu’s comment, as
Figure 8 shows for the day after (June 6):
16 The Vancouver Sun. 2012. “In China, pollution is not up for debate; Government orders embassies to stop issuing readings to the ‘outside world.’” 6 June.
Cairns and Plantan 28
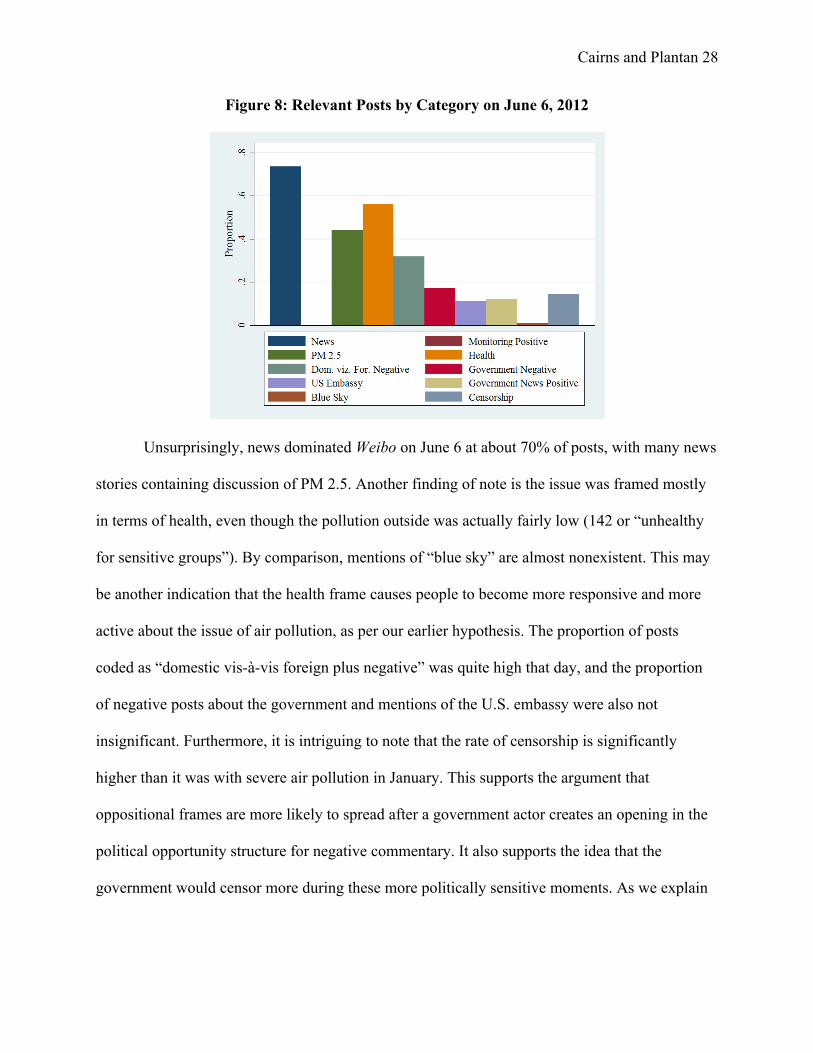
Figure 8: Relevant Posts by Category on June 6, 2012
Unsurprisingly, news dominated Weibo on June 6 at about 70% of posts, with many news
stories containing discussion of PM 2.5. Another finding of note is the issue was framed mostly
in terms of health, even though the pollution outside was actually fairly low (142 or “unhealthy
for sensitive groups”). By comparison, mentions of “blue sky” are almost nonexistent. This may
be another indication that the health frame causes people to become more responsive and more
active about the issue of air pollution, as per our earlier hypothesis. The proportion of posts
coded as “domestic vis-à-vis foreign plus negative” was quite high that day, and the proportion
of negative posts about the government and mentions of the U.S. embassy were also not
insignificant. Furthermore, it is intriguing to note that the rate of censorship is significantly
higher than it was with severe air pollution in January. This supports the argument that
oppositional frames are more likely to spread after a government actor creates an opening in the
political opportunity structure for negative commentary. It also supports the idea that the
government would censor more during these more politically sensitive moments. As we explain
Cairns and Plantan 29
in the next two sections, these trends for negative commentary and censorship are magnified in
the responses to the two events later in June.
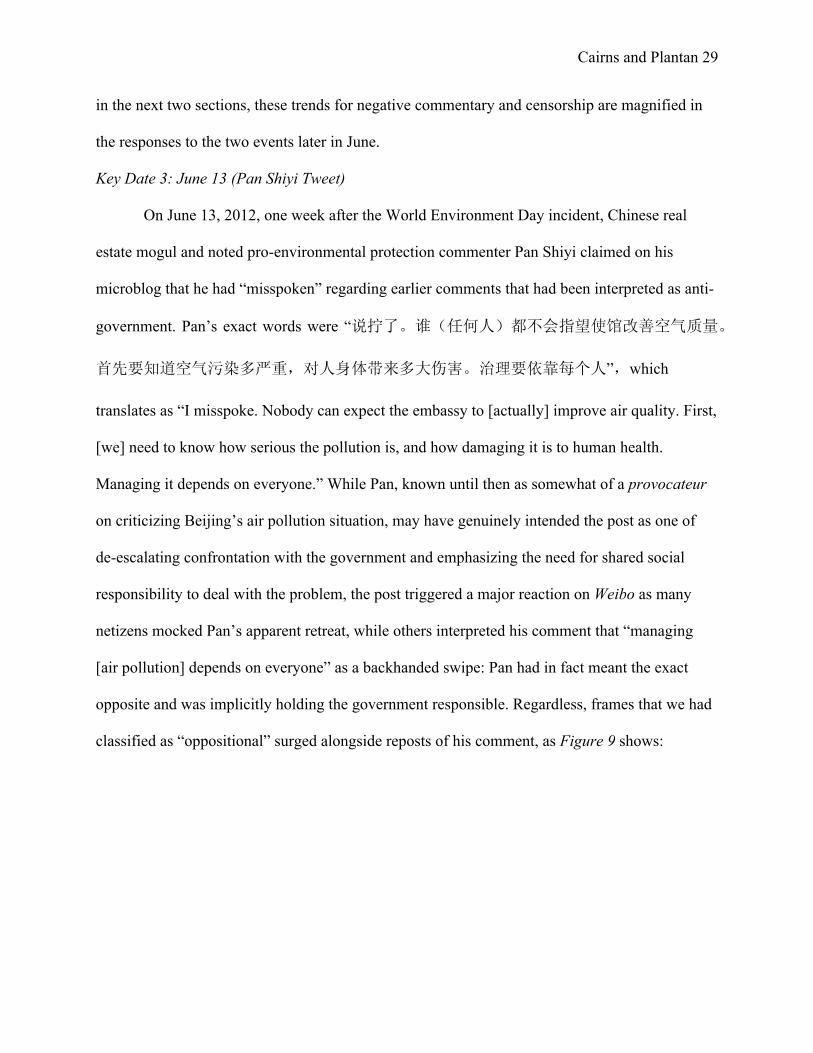
Key Date 3: June 13 (Pan Shiyi Tweet)
On June 13, 2012, one week after the World Environment Day incident, Chinese real
estate mogul and noted pro-environmental protection commenter Pan Shiyi claimed on his
microblog that he had “misspoken” regarding earlier comments that had been interpreted as anti-
government. Pan’s exact words were “说拧了。谁(任何人)都不会指望使馆改善空气质量。
首先要知道空气污染多严重,对人身体带来多大伤害。治理要依靠每个人”,which
translates as “I misspoke. Nobody can expect the embassy to [actually] improve air quality. First,
[we] need to know how serious the pollution is, and how damaging it is to human health.
Managing it depends on everyone.” While Pan, known until then as somewhat of a provocateur
on criticizing Beijing’s air pollution situation, may have genuinely intended the post as one of
de-escalating confrontation with the government and emphasizing the need for shared social
responsibility to deal with the problem, the post triggered a major reaction on Weibo as many
netizens mocked Pan’s apparent retreat, while others interpreted his comment that “managing
[air pollution] depends on everyone” as a backhanded swipe: Pan had in fact meant the exact
opposite and was implicitly holding the government responsible. Regardless, frames that we had
classified as “oppositional” surged alongside reposts of his comment, as Figure 9 shows:
Cairns and Plantan 30
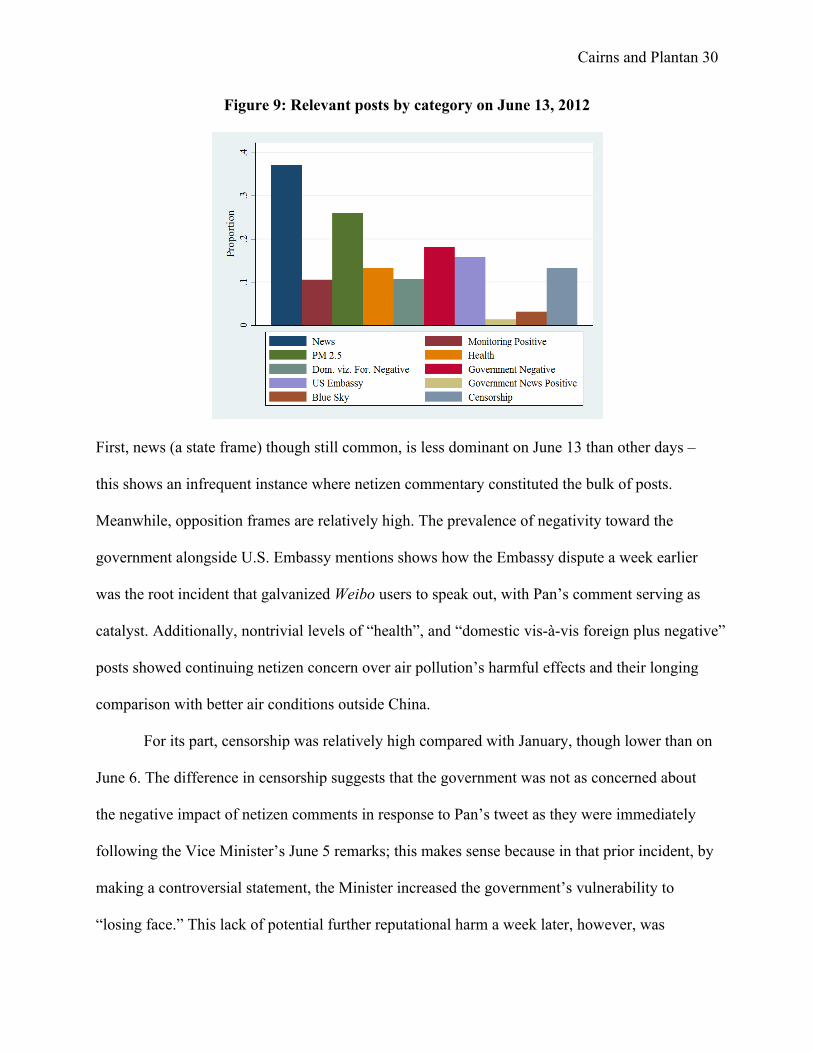
Figure 9: Relevant posts by category on June 13, 2012
First, news (a state frame) though still common, is less dominant on June 13 than other days –
this shows an infrequent instance where netizen commentary constituted the bulk of posts.
Meanwhile, opposition frames are relatively high. The prevalence of negativity toward the
government alongside U.S. Embassy mentions shows how the Embassy dispute a week earlier
was the root incident that galvanized Weibo users to speak out, with Pan’s comment serving as
catalyst. Additionally, nontrivial levels of “health”, and “domestic vis-à-vis foreign plus negative”
posts showed continuing netizen concern over air pollution’s harmful effects and their longing
comparison with better air conditions outside China.
For its part, censorship was relatively high compared with January, though lower than on
June 6. The difference in censorship suggests that the government was not as concerned about
the negative impact of netizen comments in response to Pan’s tweet as they were immediately
following the Vice Minister’s June 5 remarks; this makes sense because in that prior incident, by
making a controversial statement, the Minister increased the government’s vulnerability to
“losing face.” This lack of potential further reputational harm a week later, however, was

Cairns and Plantan 31
countered by what may have been authorities’ concern over potential collective action spurred by
the tweet, since Pan was such a famous and polarizing figure,17 leading them to delete many re-
posts of the original tweet.18
Key Date 4: June 28 (Han Han Tweet)
Our last incident, occurring three weeks after the initial June post surge, focuses on a
single tweet that while not directly related to the government or any tangible breaking incident,
nevertheless captivated Weibo attention to the problem of air pollution. On June 28, Wang Lifen,
a former China Central Television (CCTV) host and one of Weibo’s “Top 100 Big V” in 2012,19
re-tweeted a post by Zhang Xin (CEO of SOHO China and Pan Shiyi’s wife). Zhang’s original
tweet read “韩寒和我们一样也渴望空气干净”, or “just like us, Han Han also yearns to breathe
clean air.” Han Han, of course, is a noted author, intellectual, racecar driver and all-around
celebrity in China known for his non-conformity and willingness to speak out on politics. As
Pan’s wife and a noted Weibo commentor, Zhang’s reference to Han Han immediately captured
Wang’s attention: Wang was connected to Han Han in that she had hosted him on CCTV’s
Dialogue years before, when Han Han was a relatively unknown teenage sensation. The tweet
also references Huang Silu, a virtuoso pianist and talented student also invited to appear on the
same Dialogue episode. During the show, Wang contrasted Han Han to Huang, casting Han Han
as a “rebel” and pursuing a non-traditional path to success and fame by staying in China while
Huang, like many talented students in China’s “post-80s generation”, desired and pursued
17 According to our dataset, Pan’s original tweet was eventually deleted, but not until June 19, six days after it was originally posted. This suggests, given that we know the Chinese censorship regime is capable of removing unwanted post threads within minutes (Zhu et al 2012), that deleting it was not a high priority for censors, and raises the possibility that it was allowed to circulate for a defined time. 18 A future version of this paper will more closely analyze which reposts (plus netizens’ own comments) were deleted, which not, and when. 19 Source: http://data.weibo.com/summary/2012year/influence
Cairns and Plantan 32
overseas study. In the show, Huang had compared overseas life favorably with conditions within
China, while Han Han refused to express this rather conventional aspiration.
By saying that Han Han “also wished to breathe clean air,” Zhang Xin was emphasizing
that all Chinese desire clean air and a healthy environment without having to leave the country, a
sentiment that even a “rebel” like Han Han would agree with. Wang’s comment in her repost of
Zhang further supports this interpretation, talking about how she “envies” foreign students
studying overseas who are able to breathe low PM 2.5 air.20 Since many Weibo users were
intimately familiar with Han Han (as some were with Dialogue) and also with Wang Lifen and
Zhang Xin, Zhang’s retweet of Wang’s post attracted enormous attention and led to a massive
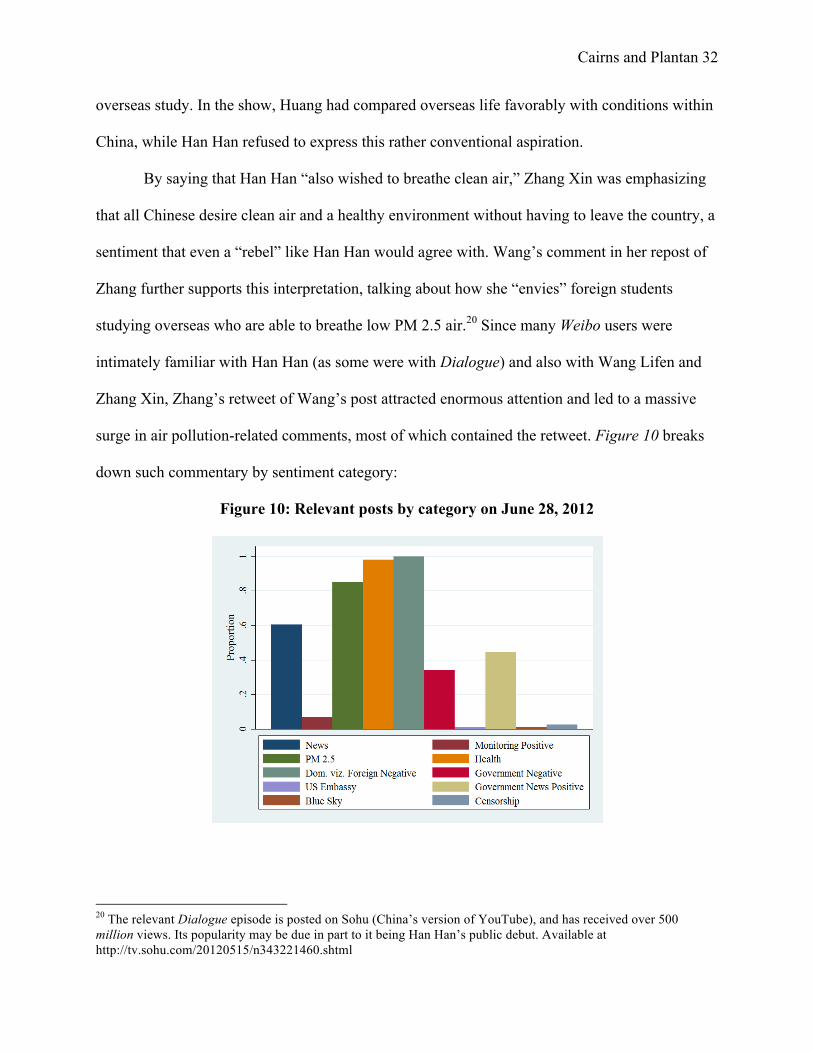
surge in air pollution-related comments, most of which contained the retweet. Figure 10 breaks
down such commentary by sentiment category:
Figure 10: Relevant posts by category on June 28, 2012
20 The relevant Dialogue episode is posted on Sohu (China’s version of YouTube), and has received over 500 million views. Its popularity may be due in part to it being Han Han’s public debut. Available at http://tv.sohu.com/20120515/n343221460.shtml
Cairns and Plantan 33
News is relatively high, possibly due to some unrelated occurrence.21 However, “health”
and “domestic vis-à-vis foreign plus negative” are higher, with nearly 100% of posts containing
these sentiments.22 The combination of these two categories reveals that Zhang’s and Wang’s
comments struck a chord with netizens, with unfavorable comparison’s of China’s domestic
pollution vis-à-vis better foreign air unfolding in tandem with negativity toward the Chinese
government.
Additionally, and possibly spurred by the events of a few weeks earlier, government,
news and positive is relatively high, indicating that municipal and provincial governments were
busy pushing out positive propaganda on recent achievements to release air monitoring data, and
other positive pollution-related initiatives. Also notable is the fact that despite high negativity
toward the government, censorship is very low – by far the lowest of our three June cases. Taken
together, these two observations suggest that the government had moved from its initial stance of
suppressing negative commentary on pollution, to deliberately tolerating negative speech while
attempting to boost positive propaganda, a strategy associated with “public opinion guidance”
(yulun daoxiang, 舆论导向) rather than outright suppression of opposing views. The reason for
this may be that by late June, leaders were responding to the depth of public anger over pollution,
and the embarrassment of the US Embassy data by acknowledging public concerns.
Concluding remarks
Our analysis of the overall yearly trends, monthly cases, and the four key date mini-cases
all give context to the conversations on Sina Weibo about air pollution during 2012. From this
fine-grained analysis, we can support our many of our earlier hypotheses and arguments. First,
21 Future iterations will investigate this further. Currently, we have surveyed major international news coverage of events (we also intend to do so for Chinese newspapers) and are unaware of any major “breaking event” that might have triggered a surge in news reposts. 22 The number may be slightly inflated due to ReadMe classification error, an issue we will address in future versions.
Cairns and Plantan 34
the frame of air pollution as a threat to human health is much more widespread than as an
environmental protection issue. This frame is highest at the beginning of the year during the
highest levels of air pollution in January, and then it tapers off steadily throughout the year. It
also spikes at key moments, such as the June 6 World Environment Day statement and the Han
Han tweet on June 28. Meanwhile, mentions of the environment remain low throughout the year
(so low that we were unable to generate ReadMe proportions for all of the days in our dataset).23
This supports our hypothesis that the “health” frame dominates the “environment” frame for the
discussion of air pollution in China. Furthermore, our expectations for “oppositional” and “state”
frames are also supported by our data. “Oppositional” frames are able to break through at key
points during the year where there is either an “exogenous shock” of high pollution or
government action that opens the political opportunity structure to invoke negative commentary.
We see this during our key dates in June. The comparative rate of censorship in January 2012
versus June 2012 also supports our argument about government censorship. Censorship is low in
January, although air pollution is severe, because the issue has not yet been politicized. After the
events in June, however, rates of censorship increase as the government tries to control the
message and ensure social stability.
The final part of our paper, to identify and examine those who are responsible for
spreading these frames and messages on Sina Weibo, will be included in a future iteration of our
paper. As discussed in our hypotheses, we expect that three types of individuals are likely to
influence the conversation about environmental issues in China: environmental activists,
international environmental NGOs, and public intellectuals. For the next version of this paper,
we have chosen Ma Jun (a well-known Chinese environmentalist), Greenpeace Beijing (the local
office of the international environmental NGO), and Pan Shiyi (Chairman of SOHO China with a 23 See Footnote 14 for an explanation of this issue.
Cairns and Plantan 35
large following on Weibo). We will take a sample of 500 topic-relevant posts from these three
individuals in 2012 and code them according to the same categories that we used to code the 500
post random sample from all users in our dataset. Then, we can compare the frames that these
individuals chose to use to the overall conversation about air pollution. In addition, we may be
able to do a network analysis of viral posts from these uses to get an idea of how, when, and
where their messages spread. We can also gather information on when and how much these
individuals were censored by the government. This part of the project will allow us to identify
the influence of these key individuals in the overall conversation on Weibo about air pollution
and their relationship with government censors.
When completed, there are several potential contributions of this paper and implications
of its findings for future research on China and other similar authoritarian regimes. In terms of its
contributions to scholarly debates, this paper has three key contributions. First, the study
contributes to literature in comparative environmental politics on ENGOs as a bridge between
state and society to improve environmental governance. Second, this case gives insight into the
key frames that allow information to spread on social media and the potential impact of this
media in authoritarian regimes. Finally, the paper speaks to the broader topic of adaptive
authoritarianism and the logic of authoritarian control through its focus on censorship.
Censorship is an important indicator of state intentions regarding the permissible boundaries and
forms of citizen participation in governance or the limits of civil society. As such, this paper
ultimately provides insight into the types of citizen participation and civil society growth that are
permitted – and perhaps even useful – under authoritarian control in an era of increasing access
to information.
Cairns and Plantan 36
Bibliography
Associated Foreign Press (AFP). 2012. “‘Off the scale’ smog grounds China flights.” 10 January. Bamman, D., B. O’Connor and N. Smith. 2012. “Censorship and deletion practices in Chinese social media.” First Monday, 17: 3–5. Bao, Maohong. 2009. “Environmental NGOs in Transforming China.” Nature and Culture 4(1): 1-16. _____. 2010. “The Evolution of Environmental Problems and Environmental Policy in China: The Interaction of Internal and External Forces.” In Environmental Histories of the Cold War. J.R. McNeill and Corinna R. Unger, eds. Washington, D.C.: German Historical Institute and New York, NY: Cambridge University Press. pp. 323-340. Barboza, David. 2012. “Chinese to Release More Data on Air Pollution in Beijing.” The New York Times. 6 January. Baumgartner, Frank R. and Bryan D. Jones. 1993. Agendas and Instability in American Politics. Chicago, IL: University of Chicago Press. Bodeen, Christiopher. 2012. “Beijing air pollution soars with fireworks smoke.” Associated Press. 29 January. Cairns, Christopher and Allen Carlson. 2014a. “Real World Islands in a Social Media Sea: Nationalism and Censorship on Weibo during the 2012 Diaoyu/Senkaku Crisis.” Presented at the 2014 American Political Science Association Annual Meeting, Washington, D.C. Cairns, Christopher and Allen Carlson. 2014b. “Let a Thousand Dissertations Bloom!”: Humor and Sarcasm in Chinese Social Media during the 2012 Sino-Japanese Diaoyudao/Senkaku Dispute. Unpublished paper. Cardwell, F.S. and S.J.Elliott. 2013. “Making the links: do we connect climate change with health? A qualitative case study from Canada.” BMC Public Heath 13(208). Chan, Chak K. and Xiaohong Yao. 2008. “Air pollution in mega cities in China.” Atmospheric Environment, 42(1): 1-42. Dadvand, Payam, Jennifer Parker, Michelle L. Bell, Matteo Bonzini, Mchael Brauer, Lyndsey A. Darrow, Ulrike Gehring, Svetlana Glinianaia, Nelson Gouveia, Eun-hee Ha, Jong Han Leem, Edith H. van den Hooven, Bin Jalaludin, Bill M. Jesdale, Johanna Lepeule, Rachel Morello-Frosch, Geoffrey G. Morgan, Angela Cecillia Pesatori, Frank H. Pierik, Tanja Pless-Mulloli, David Q. Rich, Sheela Sathyanarayana, Juhee Seo, Remy Slama, Matthew Strickland, Lillian Tamburic, David Wartenberg, Mark H. Niewwenhuijsen, and Tracey J. Woodruff. 2013. “Maternal Exposure to Particulate Air Pollution and Term Birth Weight: A Multi-Country Evaluation of Effect and Heterogeneity.” Environmental Health Perspectives 121(3): 367-373. Diamond, Larry. 2010. “Liberation Technology.” Journal of Democracy 21(3): 69-83. Dickson, Bruce. 2011. “Sustaining Party Rule in China: Coercion, Cooptation and their Consequences.” In Nathan Brown, ed., The Dynamics of Democratization. Baltimore,
MD: Johns Hopkins University Press. Economy, Elizabeth C. 2004. The River Runs Black: The Environmental Challenge to China’s Future. Ithaca, NY: Cornell University Press. Egorov, Georgy, Sergei Guriev and Konstantin Sonon. 2009. “Why Resource-poor Dictators
Cairns and Plantan 37
Allow Freer Media: A Theory and Evidence from Panel Data.” American Political Science Review, 103(4): 645-688. Ford, Peter. 2012. “China to US embassy: Stop telling people how bad the air is in Beijing.” The Christian Science Monitor. 5 June. Fu, King-wa, C.H. Chan, and Michael Chau. 2013. “Assessing Censorship on Microblogs in China: Discriminatory Keyword Analysis and Impact Evaluation of the 'Real Name Registration' Policy.” IEEE Internet Computing, 17(3): 42-50. Gandhi, Jennifer and Adam Przeworski. 2007. “Authoritarian Institutions and the Survival of Autocrats.” Comparative Political Studies, 40(11): 1279-1301. Gehlbach, Scott and Konstantin Sonin. 2014. “Government Control of the Media.” Unpublished paper. Hassid, Jonathan. 2012. “Safety Valve or Pressure Cooker? Blogs in Chinese Political Life.” Journal of Communication, 62: 212-230. Herold, David and Peter Marolt (eds.). 2011. Online Society in China: Creating, Celebrating, and Instrumentalising the Online Carnival. New York: Routledge. Hopkins, Daniel J. and Gary King. 2010. “A method of automated nonparametric content analysis for social science.” American Journal of Political Science, 54 (1), 229-47. Ho, Peter. 2001. “Greening Without Conflict? Environmentalism, NGOs and Civil Society in China.” Development and Change 32(5): 893-921. Jiang, Min. 2010. “Authoritarian Deliberation on Chinese Internet.” Electronic Journal of Communication, 20 (3&4). King, Gary, Jennifer Pan, and Margaret E. Roberts. 2013. “How Censorship in China Allows Government Criticism but Silences Collective Expression.” American Political Science Review 107(2): 326-343.
Lorentzen, Peter. 2014. “China’s Strategic Censorship.” American Journal of Political Science, 58(2): 402–414.
MacKinnon, Rebecca. 2008. “Flatter world and thicker walls? Blogs, censorship, and civic discourse in China.” Public Choice, 134: 31-46. ______. 2012. Consent of the Networked: The worldwide struggle for Internet freedom. Basic Books. Maibach, Edward W., Matthew Nisbet, Paula Baldwin, Karen Akerlof, and Guoqing Diao. 2010. “Reframing climate change as a public health issue: an exploratory study of public relations.” BMC Public Health 10(299). Matus, Kira, Kyung-Min Nam, Noelle E. Selin, Lok N. Lamsal, John M. Reilly, and Sergey Paltsev. 2011. “Heath Damages from Air Pollution in China.” MIT Joint Program on the Science and Policy of Global Change 196. Mertha, Andrew. 2008. China’s Water Warriors: Citizen Action and Policy Change. Ithaca, NY: Cornell University Press. ______. 2009. “Fragmented authoritarianism 2.0: political pluralization in the Chinese policy process.” The China Quarterly 200: 995-1012. Morozov, Evgeny. 2011. The Net Delusion: The Dark Side of Internet Freedom. PublicAffairs. Ng, Jason. 2014. “Tracing the Path of a Censored Weibo Post and Compiling Keywords that Trigger Automatic Review.” The Citizen Lab, Toronto. Noesselt, Nele. 2014. “Microblogs and the Adaptation of the Chinese Party-State’s Governance Strategy.” Governance: An International Journal of Policy, Administration, and Institutions, 27(3): 449-468.

Cairns and Plantan 38
Pew Research Center. 2013. “Environmental Concerns on the Rise in China.” Survey Report. 19 September. Putnam, Robert. 1993. Making Democracy Work. Princeton, NJ: Princeton University Press. Qiang, Xiao. 2011. “The Battle for the Chinese Internet.” Journal of Democracy, 22(2): 47- 61. Scott, James C. 1985. Weapons of the Weak: Everyday Forms of Peasant Resistance. New Haven, CT: Yale University Press. ______. 1990. Domination and the Arts of Resistance: Hidden Transcripts. New Haven, CT: Yale University Press. Shapiro, Judith. 2001. Mao’s War Against Nature: Politics and the Environment in Revolutionary China. Cambridge, UK: Cambridge University Press. Shirk, Susan (ed.). 2010. Changing Media, Changing China. Oxford, UK: Oxford University Press. Stockmann, Daniela. 2013. Media Commercialization and Authoritarian Rule in China. Cambridge, UK: Cambridge University Press. Teets, Jessica. 2013. “Let Many Civil Societies Bloom: The Rise of Consultative Authoritarianism in China.” The China Quarterly, 213: 19-38. World Cancer Report 2014. World Health Organization International Agency for Research on Cancer. http://www.iarc.fr/en/publications/books/wcr/ Xiao, Qiang. 2011. “The Rise of Online Public Opinion and Its Political Impact,” in Shirk, Susan (ed.): Changing Media, Changing China. Oxford, UK: Oxford University Press. Xie, Lei. 2011. “China’s Environmental Activism in the Age of Globalization.” Asian Politics & Policy, 3(2): 207-224. Yang, Guobin. 2009. The Power of the Internet in China: Citizen Activism Online. New York, NY: Columbia University Press. Zheng, Nongnian. 2007. Technological Empowerment: The Internet, State, and Society in China. Stanford University Press. Zhu, Tao et al. 2013. “The velocity of censorship: high-fidelity detection of microblog post deletions.” eprint arXiv:1303.0597. http://arxiv.org/abs/1303.0597. Accessed 3/23/14. Zhou, Xuegang, Hong Lian, Leonard Ortolano, and Yinyu Ye. 2013. “A Behavioral Model of ‘Muddling Through’ in the Chinese Bureaucracy: The Case of Environmental Protection.” The China Journal, 70: 120-147.

Cairns and Plantan 39
Appendix A Description of coding process: Once we had narrowed down our dataset to the 71,088 relevant posts on air pollution for all of 2012, the authors went through several stages of pre-coding exercises to determine the key categories before moving on the full coded sample. Our next step, undertaken by both co-authors, was to draw a random sample of 100 posts which each author independently read through, thinking holistically about how to divide up poster comments into distinct sentiment categories. Our concept-building for this project was therefore grounded in the data, rather than attempting to impose prior theoretical notions about air pollution Internet discourse in China onto the data. After independent reading and annotating, we met for a lengthy discussion about possible categories, and debated their existence and prevalence in the data. Next, we assembled a team of three coders, including the two co-authors and a third undergraduate, native Mandarin-speaking assistant. Having agreed on a set of candidate categories, we then drew a second random sample of 50 posts and separately attempted to classify them according to our draft category scheme. We then met again and informally attempted to reconcile disparate scores, and to refine our coding scheme. During a series of additional meetings over several weeks, we agreed on a final collection of what we judged to be replicable and salient categories, and then weighed these by their theoretical potential to illuminate our research questions. The final set of categories we chose are detailed in the methods section of the paper. We drew a fresh random sample of 500 posts for analysis, taken from all of 2012, and worked independently to assign them into categories. We then met to reconcile divergent scores according to strict rules. To militate against potential undue influence during discussion due to differences in age, gender and race, interruptions were banned and only one coder spoke at a time, with our undergraduate assistant always speaking first. When scores diverged, each coder briefly stated reasons why she/he had assigned a particular coding. After all had spoken, if a majority existed (with two coders favoring one score and the third dissenting), the dissenter was first allowed to justify her/his divergent score and persuade others to switch. Then, if switching did not occur, the majority coders took turns explaining their point of view and encouraging the dissenter to switch scores – all made effort throughout to maintain a spirit of respect and cordiality. Our inter-coder reliability scores for the full set of 500 randomly selected posts is included below in Appendix Table 1. Most of the scores here are all considered to be good according to standards established in the discipline. The average pairwise agreement for domestic vis-à-vis foreign, government blame, news, and AQI monitoring data are all well above 80%. The Fleiss’ Kappa and Krippendorff’s alpha scores for these categories are all above 0.70, which indicates substantial agreement. Environment vs. health has a slightly lower score for average pairwise agreement at 79.8%. Its Fleiss’ Kappa and Krippendorff’s alpha scores are lower as well. This may be due to the fact that as we went through the coding exercise, we agreed in our consensus meetings about how to further refine these categories. The consensus score reported in the paper thus much higher. We

Cairns and Plantan 40
also noted that there were few environment posts, which is something that we will have to address in the future iterations of this paper. As for valence, our average pairwise agreement was 68.3% and the Fleiss’ Kappa and Krippendorff’s alpha were lower as well. This is unsurprising with such a complex category like valence. The authors’ native language is English, and although both know Mandarin Chinese quite well, this category was influenced greatly by having a native Mandarin speaker as our third coder. There were some posts where sarcasm, commonly used emoticons (and their meanings), or references to other cultural phenomena evaded the authors, but were caught be the third native-speaking Mandarin coder. These were discussed on a case-by-case basis during the consensus-building meetings and agreed upon by all three coders as per our system for agreement. Appendix Table 1: Inter-coder Reliability Scores
Domestic vis-à-vis foreign
Government blame
Environment vs. Health News AQI
data Valence (+,-,0)
Average pairwise
agreement 96% 88.8% 79.8% 86.9%
94.9%
68.3%
Fleiss’ kappa
0.869
0.709 0.553 0.758
0.861
0.519
Krippendorff’s alpha
0.869
0.710
0.554 0.759
0.861
0.520


