
Tracking the history of Alberta oil sands contaminants using lake sediment cores
Alexandre Salat
This thesis is submitted to the Faculty of Graduate and Postdoctoral Studies in partial fulfillment
of the requirements for
Master of Science
In
Biology
Specializing in Chemical and Environmental Toxicology
Department of Biology
Faculty of Science
University of Ottawa
Supervisor:
Dr. Jules Blais (University of Ottawa)
Thesis Advisory Committee:
Dr. Vance Trudeau (University of Ottawa)
Dr. Jesse Vermaire (Carleton University)
Dr. Jason O’Brien (National Wildlife Research Center)
University of Ottawa
Ottawa, Canada
© Alexandre Salat, Ottawa, Canada, 2019

ii
Abstract
Petroleum hydrocarbons are emitted into the environment via natural and anthropogenic
activities. Once emitted, these hydrocarbons can be transported globally, persisting and
accumulating in aquatic ecosystems. In the Alberta oil sands region (AOSR), mining activities
have significantly altered and polluted the surrounding aquatic and terrestrial environments with
heavy metals and various petroleum hydrocarbons including polycyclic aromatic hydrocarbons
(PACs). Though PACs have been tracked through time using dated lake sediment cores,
separating natural and anthropogenic PACs can be difficult. In the Peace Athabasca Delta (PAD)
this task is especially difficult as this region has been receiving annual inputs of naturally eroded
bitumen throughout history. Petroleum biomarkers are unique petrogenic compounds (i.e.
derived from petroleum) which may provide a secondary proxy to track mining impacts.
This thesis investigated the impacts of mining activities on the AOSR and the PAD using
two different proxies, PAC and petroleum biomarkers. These two regions were compared to
reference lakes to the south and northwest of the Athabasca oil sands formation, in order to
provide a natural signal, with minimal oil sands mining contamination. Historically deposited
PACs and petroleum biomarkers were analysed in radiometrically dated lake sediment cores
from the AOSR and the PAD, Alberta. Sediment profiles in the AOSR (Saline Lake) showed
increases in PAC fluxes for both alkylated and parent compounds coeval with mining activities.
Alkylated PAC fluxes in reference lakes (Mariana Lake and BM11) increased at the height of oil
sands development (1990s). PAD lakes showed no statistical increase in PAC flux through time
due to high levels of naturally eroded bitumen entering the system. Parent PAC diagnostic ratios,
however, showed clear shifts from pyrogenic (primarily wood burning) in pre-development
sediments to petrogenically derived PACs in modern sediments, in both AOSR and PAD lakes,

iii
coeval with oil sands development. Petroleum biomarker diagnostic ratios in Saline Lake and
PAD lakes remained stable through time, indicating a clear current and historical petroleum
signal originating from the AOSR. Reference lakes (Mariana Lake and BM11) showed the
greatest change in petroleum biomarkers. Historically, these lakes had signatures uncommon of
petroleum sources, however, in recent years petroleum inputs from mining development were
revealed by these petroleum biomarkers. This study compared the historical trends of several
petroleum hydrocarbons in lake sediment to the historical emissions of these petroleum
hydrocarbons from oil sands mining operations. Notably, we show the potential for petroleum
biomarkers to trace petroleum hydrocarbon contamination in the environment.

iv
Acknowledgements
None of this would have been possible with my supervisor Dr. Jules M. Blais – thank you
Jules for providing me with this opportunity, along with the support and tools needed to
complete my Masters. Your curiosity and enthusiasm for science helped fuel my desire to push
through the ups and downs of this journey.
Thank you to all the Blais lab members. You all played an important role in helping me
along, whether is was in the lab, statistical analysis, R-coding and or revisions, the support this
lab provided was beyond helpful.
Thank you to the National Wildlife Research Center and Lukas Mundy for your help
organizing and supporting my field work activities in Fort McMurray.
Thank you to all the amazing friends I have made here in Ottawa. The beers and the
laughs we shared helped me through the ups and downs of our degrees. Thank you to Emma
Cooke for her support throughout this degree.
Most importantly, I would like to thank my family. Thank you to my sister Ségolène,
having your support here in Ottawa, along with your spirited fun-loving nature; you made many
moments exciting and memorable. Lastly, to my parents Eudes and Patricia – your constant and
unwavering support in everything I do has made all of this work possible. You are the best
parents a person could ask for. Thank you.
v
Table of Contents
Abstract ........................................................................................................................................... ii
Acknowledgements ........................................................................................................................ iv
Table of Contents ............................................................................................................................ v
List of Abbreviations .................................................................................................................... vii
List of Tables ............................................................................................................................... viii
Chapter 1 .................................................................................................................................. viii
Chapter 2 .................................................................................................................................. viii
List of Figures .............................................................................................................................. viii
Chapter 2 .................................................................................................................................. viii
Preface............................................................................................................................................. x
Statement of contributions ............................................................................................................. xi
Chapter 1. General Introduction ..................................................................................................... 1
1.1 The Peace-Athabasca Delta, Alberta, Canada .................................................................. 1
1.2 Alberta Oil Sands, Alberta, Canada ................................................................................. 2
1.2.1 The process of oil sands recovery and processing .................................................... 4
1.3 Chemical Fingerprinting .................................................................................................. 5
1.3.1 Polycyclic Aromatic Compounds ................................................................................... 5
1.3.2 Sources and Environmental Fate of PACs in Aquatic Ecosystems ................................ 6
1.3.3 Petroleum Biomarkers in the Alberta Oil Sands ............................................................ 7
1.3.4 Using Sediment Cores to Track Historical Changes ...................................................... 8
1.4 Thesis Objectives and Hypothesis.................................................................................... 9
Chapter 2. Tracking the history of Alberta oil sands contaminants using lake sediment cores ... 12
Abstract ......................................................................................................................................... 13
1.0 Introduction ............................................................................................................................. 14
2.0 Methods................................................................................................................................... 18
2.1 Study Sites and Sample Collection .................................................................................. 18
2.2 Laboratory analysis – Dating sediment cores .................................................................. 20
2.3 PAC and Biomarker analysis ........................................................................................... 20
2.4 Statistical Analyses .......................................................................................................... 21
3.0 Results and Discussion ........................................................................................................... 22
3.1 PAC depositional history comparisons through time ...................................................... 22

vi
3.2 Changes in PACs through time ....................................................................................... 24
3.3 Petroleum Biomarker Changes in Lake Sediments ......................................................... 27
3.4 Multivariate analysis of lake sediment cores ................................................................... 31
4.0 Conclusions ............................................................................................................................. 32
Supplementary Information .......................................................................................................... 37
Chapter 3. Conclusion ................................................................................................................... 47
3.1 Study Outcomes ...................................................................................................................... 47
3.2 Future Directions .................................................................................................................... 48
Reference List ............................................................................................................................... 51
vii
List of Abbreviations
AOS – Alberta Oil Sands
AOSR – Alberta Oil Sands Region
b/d – Barrels per day
BghiP - Benzo(ghi)perylene
CAPP – Canadian Association of Petroleum Producers
CEQGs – Canadian Environmental Quality Guidelines
CRS – Constant Rate of Supply
DCM - Dichloromethane
ECCC – Environment and Climate Change Canada
EROD - Ethoxy resorufin-O-deethylase
Fla – Fluoranthene
GAM - Gammacerane
GC-MS – Gas Chromatography coupled with Mass Spectrometry
HMW – High Molecular Weight
HPLC – High-Performance Liquid Chromatography
IcdP - Indeno(1,2,3-cd)pyrene
JOSM – Joint Canada-Alberta Implementation Plan for Oil Sands Monitoring
LMW – Low Molecular Weight
PAC – Polycyclic Aromatic Compound
PAD – Peace Athabasca Delta
PAH – Polycyclic Aromatic Hydrocarbon
PCA – Principle Component Analysis
PCR – Polymerase Chain Reaction
Py – Pyrene
TMP - Trimethlypentane
TOC – Total Organic Carbon
UNESCO – United Nations Educational, Scientific and Cultural Organization

viii
List of Tables
Chapter 1
Table 1 Petroleum biomarker used for oil forensics
Chapter 2
Table 1 Result of Mann-Kendall trend test (p = p-value, τ = rank correlation coefficient) of the
PAC flux in each lake for sum parent and alkylated PAC flux, and PAC diagnostic ratios (Fla/Py
= Fla/(Fla+Py) and (IcdP/BghiP = IcdP/(IcdP+BghiP)). Bold font denotes statistical significance,
α = 0.05
Table 2 Result of Mann-Kendall trend test (p = p-value, τ = rank correlation coefficient) of the
petroleum biomarker diagnostic ratios in each lake. Bold font denotes statistical significance, α =
0.05
Table S3 Targeted PAC analytes
Table S4 Down core petroleum biomarker diagnostic ratios for BM11
Table S5 Down core petroleum biomarker diagnostic ratios for Mariana Lake
Table S6 Down core petroleum biomarker diagnostic ratios for Saline Lake
Table S7 Down core petroleum biomarker diagnostic ratios for PAD 30
Table S8 Down core petroleum biomarker diagnostic ratios for PAD 31
List of Figures
Chapter 2
Figure 1 Map of study region, identifying sampling locations in the Athabasca oil sands region:
Saline Lake (57°04’41.81” N, 111°31’20.43” W), BM11 (57°41’35.97” N, 111°54’26.08” W),
and Mariana Lake (55°57’02.35” N, 112°01’34.97” W), and sampling location in the Peace
Athabasca Delta: PAD 30 (58°30’N, 111°31’W) and PAD 31 (58°29’N, 111°30’W). Oil sands
leases currently being utilizes by mining companies are shown in grey (2015)
Figure 2 Line plot of PAC flux (ng cm-2 y-1) versus depth (cm) for each lake down core. Depth is
shown on the left y-axis and the corresponding date (year) is shown on the right y-axis. Solid
lines represent parent PACs and the dashed line represents alkylated PACs
Figure 3 Plots showing PAC composition of lake sediment cores from the five study sites in
relation to the PAC diagnostic ratios Fluoranthene/Pyrene, (F/(FLA+Py)) and Indeno(1,2,3-
cd)pyrene(IcdP) / Benzo(g,h,i)perylene(BghiP), (IcdP/(IcdP + BghiP)). Data points are
connected to show the sequence of sediment deposition. (B) indicates the bottom of each core
(time before industrial development) and (T) indicated the top of the core (most recent sediment,
deposited during industrial development). Red lines indicate separations from petrogenic and
pyrogenic space

ix
Figure 4 Ordination plot of principle components for each lake down core for parent PACs, data
from lake sediment cores. Each biplot shows sample scores and parent PACs as explanatory
variables. Arrows indicate the contribution of the 5 most important explanatory variables (red
arrows have highest contribution and green arrows have the lowest contribution). An arrow
shows directional change from bottom to top of the core with dates marking the oldest and
newest interval in the sediment core
Figure 5 Ordination plot of principle components for each lake down core for alkylated PACs,
data from lake sediment cores. Each biplot shows sample scores and alkylated PACs as
explanatory variables. An arrow shows directional change from bottom to top of the core with
dates marking the oldest and newest interval in the sediment core.
Figure S6 A) Scatter plots of percent organic carbon versus percent nitrogen, and B) percent
carbon versus percent sulfur, for down core lake sediments from BM11 (circles), Mariana
(triangles), PAD 30 (squares), PAD 31 (cross), Saline (box)
Figure S7 Ordination plot of principle components for each lake down core for parent PACs,
data from lake sediment cores. Each biplot shows sample scores and parent PACs as explanatory
variables. Arrows indicate the contribution of the 5 most important explanatory variables (red
arrows have highest contribution and green arrows have the lowest contribution). An arrow
shows directional change from bottom to top of the core with dates marking the oldest and
newest interval in the sediment core
Figure S8 Ordination plot of principle components for each lake down core for alkylated PACs,
data from lake sediment cores. Each biplot shows sample scores and alkylated PACs as
explanatory variables. An arrow shows directional change from bottom to top of the core with
dates marking the oldest and newest interval in the sediment core
Figure S9 Ordination plot of principle components for each lake down core for biomarkers, data
from lake sediment cores. Each biplot shows sample scores and biomarkers as explanatory
variables. An arrow shows directional change from bottom to top of the core with dates marking
the oldest and newest interval in the sediment core

x
Preface
This thesis is written as a manuscript in accordance to the guidelines provided by the
University of Ottawa’s Faculty of Graduate and Postdoctoral Studies. Chapter 1 is an
introduction to this thesis and provides the necessary background for the manuscript to follow, as
well as the primary objective, hypothesis, and predictions of this thesis. Chapter 2 includes a
brief introduction, methods, results, and discussion, and is formatted in accordance to Elsevier’s
guidelines for authors provided by the journal of Environmental Pollution. Chapter 3 summarizes
the manuscript and provides concluding remarks and future directions for this research.
xi
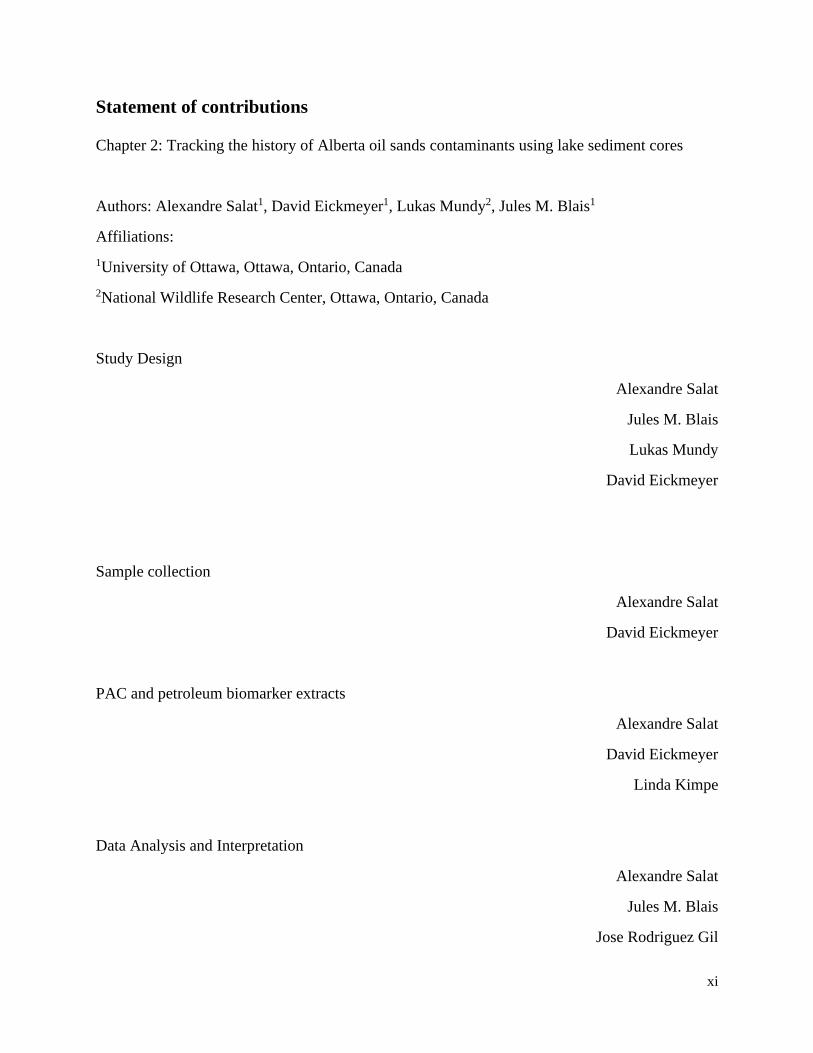
Statement of contributions
Chapter 2: Tracking the history of Alberta oil sands contaminants using lake sediment cores
Authors: Alexandre Salat1, David Eickmeyer1, Lukas Mundy2, Jules M. Blais1
Affiliations:
1University of Ottawa, Ottawa, Ontario, Canada
2National Wildlife Research Center, Ottawa, Ontario, Canada
Study Design
Alexandre Salat
Jules M. Blais
Lukas Mundy
David Eickmeyer
Sample collection
Alexandre Salat
David Eickmeyer
PAC and petroleum biomarker extracts
Alexandre Salat
David Eickmeyer
Linda Kimpe
Data Analysis and Interpretation
Alexandre Salat
Jules M. Blais
Jose Rodriguez Gil

xii
Manuscript Preparation
Alexandre Salat
Peer Reviewers
Jules M. Blais
David Eickmeyer
Lukas Mundy

1
Chapter 1. General Introduction 1
1.1 The Peace-Athabasca Delta, Alberta, Canada 2
3
The Peace Athabasca Delta (PAD) is the World’s largest inland freshwater boreal delta, 4
located in northeastern Alberta, spanning over 6000 km2 of rivers, channels, lakes, ponds, 5
wetlands, grasslands and boreal forest. The PAD is one of Canada’s 15 UNESCO World 6
Heritage Sites, providing an important ecological service to the surrounding area (Hall et al., 7
2012; Timoney, 2013a; Timoney and Lee, 2009). Protected in 1922 with the creation of Wood 8
Buffalo National Park, the PAD is a major nesting and staging site for numerous species of 9
waterfowl and acts as a connection area for all four North American migratory flyways. In 10
addition to being home to various bird, mammal, and fish species, the PAD provides sustenance 11
and spiritual well-being to the Mikisew Cree, Athabasca Chipewyan First Nations, and Metis 12
peoples who reside in Fort Chipewyan (Timoney, 2013b; Wolfe et al., 2012). Due to its cultural, 13
ecological, and historical value, the PAD was selected as a Ramsar Wetland of International 14
Importance in 1982 (Wolfe et al., 2012). 15
The deposition of sediments carried by rivers can result in the formation of river deltas 16
like the PAD (Timoney, 2013a). Two major rivers gave rise to the PAD; the Peace River and the 17
Athabasca River. The Athabasca River originates in the Columbia Icefields of the Alberta 18
Rockies. The Peace River originates at the fork of the Finlay and Parsnip Rivers in northern 19
British Columbia. Deltas are highly complex environments, existing at the interface of terrestrial 20
and aquatic transitional zones, resulting in changes through land, water, and air. This makes 21
these regions sensitive to climate change and changes in river management. Consequently, the 22
PAD is subject to multiple stressors such as climate change, upstream industrial development, 23
agriculture, forestry, mining, and resource extraction (Wolfe et al., 2012). 24

2
1.2 Alberta Oil Sands, Alberta, Canada 25
26
Worldwide, Canada is the fourth largest petroleum producer, generating 5.27 million 27
barrels of crude oil per day (b/d) as of 2018 (U.S. Energy Information Administration, 2018). 28
The Alberta oil sands is the third largest crude oil reserve in the World, containing approximately 29
170 billion barrels of proven oil (CAPP, 2018; Government of Alberta, 2017). In the late 1960s, 30
commercial production began, using conventional open pit mining techniques to extract oil sands 31
(Conly et al., 2002). Oil sands are a natural mixture of silica sand (85%), water (5%), and 32
bitumen (10%). Bitumen, a heavy and complex hydrocarbon, is solid at room temperature, and 33
contains high levels of nitrogen, sulfur, and heavy metals. This hydrocarbon mixture is too heavy 34
to flow naturally, unless heated or diluted. Canada’s oil sands are broken into three distinct 35
regions: the Athabasca, Cold Lake, and Peace River oil sands, covering 142,200 km2 of boreal 36
forest in northern Alberta. The surface minable area (SMA), found within the Athabasca oil 37
sands region (AOSR) accounts for only 3% of the total oil sands area (4800 km2) but contains 38
20% of potential oil. Currently only 895 km2 of the SMA has been disturbed, with 98% of the 39
SMA under lease. In 2018, Alberta produced approximately 2.65 million b/d of crude bitumen, 40
with production expected to rise to 4.2 million barrels per day by 2035 (CAPP, 2018; 41
Government of Alberta, 2017). As of 2017, Alberta had 50 in-situ projects, 200 primary and 42
enhanced recovery projects, 12 bitumen processing plants, and nine approved oil sands mining 43
operations (Government of Alberta, 2017). Evidently, with global oil demands rising (CAPP, 44
2018), oil sands operations will continue to extract unconventional oil. Congruently, there are 45
numerous environmental problems associated with mining operations that will continue to 46
negatively impact the surrounding environment, ecosystems, and peoples who live off the land. 47
These problems include the disruption and destruction of terrestrial and aquatic habitats, the 48

3
accumulation of waste in large tailings ponds, and the release of chemicals and greenhouse gases 49
to the atmosphere (JOSM, 2016). 50
Several studies have investigated the effects of industrial activities on the distribution of 51
harmful contaminants, such as PACs and heavy metals, into the atmosphere and the surrounding 52
region (Kelly et al., 2010, 2009; Thienpont et al., 2017). Kurek et al. (2013) examined sediments 53
in lakes near oil sands development centers and found alkylated PACs increased significantly at 54
the onset of mining. In recent sediments, PAC concentrations increased 2.5-23 times more than 55
in the pre-mining (pre-1960) sediments (Kurek et al., 2013). Kelly et al. (2009) examined 56
loadings of airborne particulates on snowpack. Snowpack within 50 km from upgrading facilities 57
received 11400 T of particulates including, 391 kg of PACs, which is equivalent to 600 T of 58
bitumen (Kelly et al., 2009). Kelly et al. (2010), also examined heavy metal deposition in the 59
Athabasca River and associated tributaries. Canadian Water Quality Guidelines for the 60
Protection of Aquatic Life (CEQGs) were exceeded for metals including cadmium, copper, lead, 61
mercury, nickel, silver, and zinc in melted snow and/or water (Kelly et al., 2010). 62
Furthermore, mining by-products from extraction and upgrading of bitumen, including; 63
tailings ponds (Galarneau et al., 2014), pet-coke piles (Crump et al., 2017), mining pits and 64
heavy truck traffic. These are all sources of PACs and heavy metals in the AOSR (Wang et al., 65
2016). Indigenous communities have also raised concerns regarding community health. Rates of 66
cancers (Douben, 2003), diabetes, and heart problems have all increased since the onset of 67
mining activities, and have been linked to oil sands mining operations (Timoney and Lee, 2009). 68
69
70

4
1.2.1 The process of oil sands recovery and processing 71
72
Oil sands mining consists of three basic steps; extraction, upgrading, and refining, taking 73
raw oil sands and forming usable petroleum products. 1) Extraction; this process is preceded by 74
the removal of overburden from the surface of the oil sands, exposing the petroleum source. 75
Heavy mining shovels then remove the oil sands from the earth, shovel loads weigh 76
approximately 90 tonnes and contain 7-13% bitumen by weight (Shah et al., 2010). Oil sands are 77
then transported to crushers in preparation for extraction. Following crushing, hot water is added 78
to the oil sands creating a slurry (50% solids, 40% water, and 8% bitumen). The slurry is then 79
transported via pipelines to the main extraction facility. The slurry is pumped through a Primary 80
Separation Vessel, where bitumen attaches to air bubbles, floating to the top of the slurry and is 81
subsequently recovered in froth storage tanks (60% bitumen, 30% water, and 10% fine solids). 82
The remaining water, silica-sand and debris are pumped to tailings ponds for storage and water 83
recovery. Bitumen froth is mixed with diluent or solvent to reduce mixture viscosity for 84
separation via gravity separation units for the final removal of solids and water (98-99.8% 85
bitumen, and up to 2% water + solids) (Giove and Sciarrabba, 2019a). 2) Upgrading; this is the 86
process by which bitumen is transformed into light oil, by fractionation and chemical treatment, 87
removing almost all traces of sulfur, nitrogen, and heavy metals. Approximately 40% of 88
Alberta’s bitumen is upgraded into light (sweet) synthetic crude oil before being sold to 89
refineries. First, diluent is recovered from the bitumen and returned to the bitumen production 90
facility. Next the hydrogen to carbon (H:C) ratio is improved through carbon injection (coking) 91
or hydrogen addition (hydroconversion). Heavy (lower value) bitumen is then converted into 92
lighter hydrocarbons using two different methods; fractionation and/or cracking (Berkowitzt and 93
Speightt, 1975). Impurities, such as sulfur and nitrogen, are then removed from the crude oil, a 94

5
process known as hydrotreating. Finally, the crude oil is blended together with different liquid 95
fractions that were created during upgrading to produce the desired crude oil, typically known as 96
Synthetic Crude Oil. Currently there are four open pit mining upgrading facilities in Alberta; 97
Suncor, Syncrude, CNRL Horizon and Shell Scotford Upgrader (Giove and Sciarrabba, 2019b). 98
Refining is the final process of turning crude oil into a final product for consumer and industrial 99
use. These products include, gasoline, kerosene, jet fuel, diesel, oil lubricants, asphalts and other 100
consumer products (Berkowitzt and Speightt, 1975). Two types of refineries exist, which allows 101
for the refining of different crude oils. Simple refineries can only process light crude oils with 102
low sulfur content (sweet), whereas, complex refineries can process heavier crude oils with 103
higher sulfur contents (sour) (Giove and Sciarrabba, 2019c). 104
1.3 Chemical Fingerprinting 105
106
1.3.1 Polycyclic Aromatic Compounds 107
108
PACs are a group of organic compounds, found ubiquitously in freshwater and marine 109
sediments. Parent PACs are comprised of two or more unsubstituted aromatic rings fused 110
together. Alkylated PACs have various levels of alkyl substitutions added to the main fused ring 111
structure (Douben, 2003; Neff et al., 2005). PACs can include other elements into their fused 112
ring structure, such as organosulfur compounds. These sulfur-containing compounds constitute 113
an expanded list of PAC compounds such as the dibenzothiophenes (DBTs) and 114
benzonaphthothiophenes (BNTs). PACs are produced through the incomplete combustion of 115
organic matter resulting in the formation of thousands of different PAC species. Notably, only 6-116
16 PACs (Fig.1) are determined to be priority pollutants owing to a lack of understanding of the 117
chemical properties of the other PACs (Keith, 2015; Ukaogo and Igwe, 2015). 118

6
The structural differences between parent and their alkylated homologues results in very 119
different chemical and physical properties. These differences can influence exposure pathways, 120
transportation, and environmental fate of the different PACs. For instance, heavily alkylated 121
compounds are generally more toxic than their unsubstituted parent PACs (Lin et al., 2015). 122
Whereas, high molecular weight (HMW) parent PACs tend to have higher carcinogenicity 123
(Manzetti, 2013). The complexity of these compounds has led to a lack of understanding and 124
monitoring of PACs in the environment. The majority of research has focused on the 16 parent 125
polycyclic aromatic hydrocarbons (PAHs) designated by the United States Environmental 126
Protection Agency (US EPA) (Keith, 2015) as priority pollutants, with little research placed on 127
alkylated PACs (Radke et al., 1990). 128
1.3.2 Sources and Environmental Fate of PACs in Aquatic Ecosystems 129
130
PACs are predominantly hydrophobic, of low solubility in water, and semi-volatile. 131
PACs readily adsorb to particulate matter and other oily substances, facilitating transportation of 132
these compounds into water, soil, and air. Transportation of PACs occurs primarily in the solid 133
phase (79-93%), therefore, sedimentation and accumulation of PACs in riverbeds and lake 134
sediments is the primary path for PAC accumulation in the environment (Manzetti, 2013). PACs 135
are primarily produced from pyrogenic and petrogenic sources (Abdel-Shafy and Mansour, 2016; 136
Neff et al., 2005; Ukaogo and Igwe, 2015). Pyrogenic PACs are produced through high 137
temperature combustion, generating HMW PACs with a greater abundance of unsubstituted 138
parent compounds. Conversely, petrogenic PACs are formed at lower temperatures during 139
diagenesis and petroleum formation. They are typically of low molecular weight (LMW) and 140
consist of more alkylated compounds (Abdel-Shafy and Mansour, 2016; Thienpont et al., 2017; 141
Timoney and Lee, 2011). Therefore, alkylated PACs are directly connected to production and 142

7
refining of bitumen and crude oils. Within crude oils, parent PACs constitute 1-3% of total 143
PACs; alkylated PACs comprise more than 90% (Bence et al., 1996). Clear connections between 144
petrogenic PACs have been characterized in the AOSR, due to the dominance of alkylated PACs 145
(Kelly et al., 2009). Alkylated PACs are released through mining extraction processes and 146
upgrading processes, natural erosion, and leaching from bitumen outcrops (Conly et al., 2002; 147
Evans et al., 2016). Recently, studies have provided evidence that open pit mining may be 148
contributing significantly to the contamination of aquatic ecosystems (Kelly et al., 2009; Kurek 149
et al., 2013). 150
Research in the PAD has focused primarily on characterising PACs from petrogenic 151
sources and linking them to river discharge. Jautzy et al. (2015) used compound specific isotopic 152
signatures (δ2H and δ13C) in lake sediments from PAD lakes to determine the presence of 153
petroleum coke, a particulate dust emitted by oil sands processing. The spatial differences in δ2H 154
and δ13C showed evidence of long-range transport (~150 km) of anthropogenically derived PACs 155
to the PAD (Jautzy et al., 2015a). Alexander and Chambers (2016), reported that heavy metals 156
(arsenic, selenium and vanadium) that were present in bitumen upstream, were also found in 157
sediments downstream. Interestingly, heavy metal concentrations downstream were found to be 158
higher as a result of mining operations in recently deposited sediments (Alexander and 159
Chambers, 2016). The complex nature of the PAD has made it difficult to determine if the PAC 160
signature in the PAD has increased as a result of mining practices in the AOSR or whether the 161
PAC signal been the result of centuries of bitumen erosion into the PAD. 162
1.3.3 Petroleum Biomarkers in the Alberta Oil Sands 163
164
Petroleum biomarkers play a key role in identifying the source of petroleum products; 165
this is known as chemical fingerprinting (Wang et al., 2007). Petroleum biomarkers can be 166

8
emitted with other petroleum products such as PACs and n-alkanes, allowing for source 167
identification of rocks and oils. Petroleum biomarkers consist of hopanes, steranes, and terpanes, 168
and are derived from previously living organisms (Table 1). Highly resistant to degradation, 169
petroleum biomarkers are excellent tools for evaluating oil biodegradation, genesis, and the 170
maturation of petroleum products (Brooks et al., 1988; Wang et al., 2013; Yang et al., 2011). 171
Hopanes, steranes, and terpanes are formed and preserved exclusively in petroleum reservoirs 172
and are distinct from their biological precursors (Zumberge, 1987). Historically, petroleum 173
biomarkers have been used by geochemists in characterization of oil in terms of (1) oil-oil and 174
oil-source rock correlation, (2) types of precursor organic material present in source rocks, (3) 175
ranking of oils thermal maturity, (4) evaluation of in-reservoir degradation, (5) determination of 176
depositional environment, and (6) providing information on petroleum source rock age (Wang et 177
al., 2007). Therefore, petroleum biomarkers offer accuracy and precision for petrogenic source 178
identification, compared to PACs and alkanes, which have multiple environmental sources. 179
Within the AOSR and the PAD, petroleum biomarkers can be useful tools to understand the 180
movement of petroleum-based pollution. 181
1.3.4 Using Sediment Cores to Track Historical Changes 182
183
Lake sediment cores provide a natural archive of environmental conditions, both spatially 184
and temporally (Korosi et al., 2016). Routinely, sediment cores are used to infer historic 185
depositional trends in environmental contaminants, including metals and persistent organic 186
pollutants. Lake sediment cores may also preserve the fossil remains of aquatic biota, including 187
daphnia and diatoms, which are routinely used as model organisms in ecotoxicology (Korosi et 188
al., 2017). Advancements in paleolimnology have allowed for the recovery of high-resolution 189
sediment cores that can be sectioned and dated, providing a reconstruction of past ecosystems. 190

9
Analysis of these cores can help overcome a lack of long-term monitoring data in regions that 191
have undergone anthropogenic change, particularly the AOSR. Recently, a large body of 192
research has demonstrated the effectiveness of using lake sediment cores to reconstruct the 193
depositional environment of lakes within the AOSR (Jautzy et al., 2013; Korosi et al., 2016; 194
Manzano et al., 2017; Thienpont et al., 2017). An analysis of dated lake sediment cores from the 195
AOSR, may provide a better understanding of contaminants released by surface mining 196
activities. 197
1.4 Thesis Objectives and Hypothesis 198
199
AOSR and the PAD are two highly dynamic regions in northern Alberta, affected by oil 200
sands mining operations. Oil rich sediments are transported via air currents, and eroded bitumen 201
is dispersed through the watershed via the Athabasca River. Studies performed in the AOSR and 202
the PAD have advanced the understanding of the impacts mining operations have on the 203
environment (Hall et al., 2012; Kelly et al., 2010, 2009; Kurek et al., 2013; Thienpont et al., 204
2017; Timoney and Lee, 2009). 205
PACs are of concern in the AOSR due to their relative abundance in the region and their 206
toxic and pervasive properties. PAC contamination in the AOSR provides strong evidence of oil 207
sands emissions to the region. However, given that PACs may also be produced by fuel burning, 208
forest fires, volcanic activity, and other natural phenomena, these PAC sources must also be 209
considered. 210
Petroleum biomarkers such as terpanes, hopanes and steranes, may hold the key to these 211
questions because they are source specific compounds originating from petroleum. These 212
petroleum biomarkers have been used as indicators of source rock origin in oil spills (Wang et 213

10
al., 2007). The use of these highly specific compounds could help further pinpoint sources of 214
PACs in the AOSR and develop the evidence for the regional impacts of oil sands mining 215
operations. 216
The primary aim of this thesis is to evaluate the chemical signatures of PACs and 217
petroleum biomarkers in the AOSR and the PAD. By comparing selected lakes from the AOSR 218
and PAD, a proper contrast of the chemical fingerprint of PACs and petroleum biomarkers can 219
be assessed as indicators of change. In order to guide this assessment of chemical fingerprinting, 220
an analysis in lake sediment cores of parent and alkylated PACs, as well as petroleum 221
biomarkers was completed. Environmentally relevant bituminous PACs were analysed in all 222
lakes. Petroleum biomarkers (terpanes, hopanes, and steranes) were analysed in sediment cores 223
for the first time in the PAD and the AOSR, to determine their use as potential indicators of 224
petrogenic sources in these complex regions. 225
The following chapter of this thesis provides an in-depth analysis of PACs and petroleum 226
biomarkers in lake sediment profiles of the AOSR and the PAD. Here I investigated the utility of 227
petroleum biomarkers as a tool to accurately identify the input and origin of bituminous 228
compounds in the PAD and AOSR lakes. 229
I hypothesize that mining activities in the AOSR have altered aquatic systems in the 230
region and in the PAD. I predict that: (1) petrogenic PAC loadings in lakes in the AOSR and the 231
PAD have increased in lake sediments coeval with oil sands mining operations; and (2) 232
petroleum biomarkers composition has changed in lake sediments coeval with oil sands mining, 233
in the AOSR and the PAD. 234
235

11
Table 1: Petroleum biomarker used for oil forensics 236
Name Code Target ion
Terpanes
C21 terpane C21 T 191
C22 terpane C22 T 191
C23 terpane C23 T 191
C24 terpane C24 T 191
Hopanes
C27 18A-hopane II (Ts) Ts 191
C27 17A-hopane (Tm) Tm 191
C29 αβ hopane C29 αβ H 191
C30 αβ hopane C30 αβ H 191
C31 (S) hopane C31 (S) H 191
C31 (R) hopane C31 (R) H 191
C32 (S) hopane C32 (S) H 191
C32 (R) hopane C32 (R) H 191
C33 (S) hopane C33 (S) H 191
C33 (R) hopane C33 (R) H 191
C34 (S) hopane C34 (S) H 191
C34 (R) hopane C34 (R) H 191
C35 (S) hopane C35 (S) H 191
C35 (R) hopane C35 (R) H 191
Gammacerane GAM 191
Steranes
C27 αββ sterane C27 αββ S 218
C28 αββ sterane C28 αββ S 218
C29 αββ sterane C29 αββ S 218
237
238
239
240
241
242
243
244
245
246
247
12
Chapter 2. Tracking the history of Alberta oil sands contaminants using lake 248
sediment cores 249
Alexandre Salat1, David Eickmeyer1, Lukas J. Mundy2, Jules M. Blais1 250
1University of Ottawa, Ottawa, Ontario, Canada 251
2 Ecotoxicology and Wildlife Health Division, Environment and Climate Change Canada, 252
National Wildlife Research Centre, Carleton University, Ottawa, ON, Canada 253
254
255
256
257
258
259
260
261
262
263
264
265
266

13
Abstract 267
Historically deposited polycyclic aromatic compounds (PACs) and petroleum biomarkers 268
were examined in radiometrically dated lake sediment cores from the Athabasca oil sands region 269
(AOSR) and the Peace Athabasca Delta (PAD) in Alberta, Canada to track impacts from oil 270
sands mining operations in the region. Since the onset of mining development, various chemical 271
contaminants including PACs have increased in aquatic ecosystems. Sediment PAC records from 272
lakes in the AOSR showed higher petrogenic contributions coinciding with regional oil sands 273
development, compared to historically high levels found in the PAD. Parent PAC diagnostic 274
ratios showed clear shifts from pyrogenic (primarily wood burning) in pre-development 275
sediments to petrogenically derived PACs in modern sediments, for both AOSR and PAD lakes, 276
coeval with oil sands development. Changes in alkylated PAC fluxes were seen in Saline Lake at 277
the onset of oil sands development (1970s) and Mariana Lake and BM11 during heightened oil 278
sands development (1990s), along with parent PAC fluxes changing in Saline Lake (1970s) and 279
BM11 (1990s). PAD lakes showed no statistical change in PAC fluxes through sediment 280
profiles. Petroleum biomarker diagnostic ratios were stable in sediment profiles for Saline Lake, 281
PAD 30 and PAD 31, indicating a historical petroleum source from the AOSR. Mariana Lake 282
showed the greatest change in biomarkers followed by BM11, these reference lakes had 283
signatures uncommon of petroleum sources, however, in recent years petroleum inputs from 284
mining development has shifted these petroleum biomarker ratios. This study compared 285
historical patterns of petroleum hydrocarbons in lake sediment to historical emissions of these 286
chemicals from oil sands mining operations. In particular, we show the potential for petroleum 287
biomarkers to track petroleum hydrocarbon contamination in the environment. 288
289

14
1.0 Introduction 290
Globally Canada is the fourth largest petroleum producer, generating 5.27 million barrels 291
per day (b/d) as of 2018 (U.S. Energy Information Administration, 2018). The Alberta oil sands 292
are the third largest crude oil reserve in the world, with three distinct regions: Athabasca, Cold 293
Lake, and Peace River. Combined, these regions occupy an area of 142,000 km2 across northern 294
Alberta (Canadian Association of Petroleum Producers) (CAPP, 2018), slightly larger in size 295
than England. An estimated 170 billion barrels of oil are recoverable by current extraction 296
methods: open pit mining (1.14 million b/d) and in-situ extraction (1.51 million b/d) (CAPP, 297
2018). The Athabasca Oil Sands Region (AOSR) contains the only bitumen deposits that are <75 298
m below the Earth’s surface, covering an area of 4,800 km2 (Government of Alberta, 2017). In 299
the late 1960s, commercial production began using conventional open pit mining techniques 300
(Conly et al., 2002). With increasing global energy demands, it is projected that oil sands 301
production will increase by 150% by 2025 (CAPP, 2018), from the currently produced 2.5 302
million b/d (Government of Alberta, 2017). 303
Oil sands surface mining and upgrading in the AOSR is an environmentally contentious 304
issue, resulting in significant landscape disturbances, habitat loss, and water quantity/quality 305
issues (Galarneau et al., 2014; Kelly et al., 2010). In recent years, the rapid expansion of surface 306
mining has raised concerns about the potential release of contaminants into the environment 307
(Korosi et al., 2016; Yang et al., 2014). Several studies have shown elevated concentrations of 308
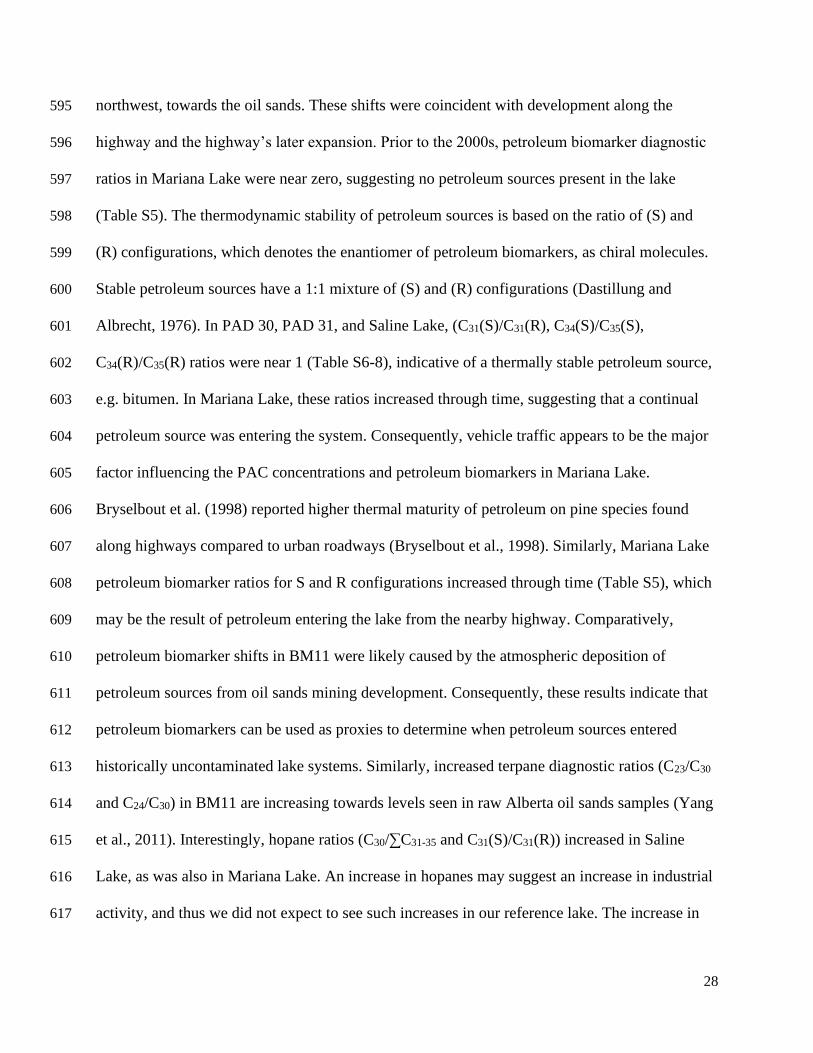
polycyclic aromatic compounds (PACs) and heavy metals within 50-80 km of upgrading 309
operations in snow pack, water, (Kelly et al., 2010, 2009) and lake sediments, 2.5-23 times 310
higher than pre-mining (1960) sediments (Kurek et al., 2013). 311

15
Oil sands upgraders, pet-coke piles, tailings ponds (Galarneau et al., 2014), mine pits, and 312
truck traffic are all sources of PACs in the AOSR (Wang et al., 2016). Studies conducted in the 313
AOSR have shown that exposure to PACs can cause morphological deformities in amphibians 314
and fish, as well as EROD (Ethoxy resorufin-O-deethylase) induction, and increased mortality 315
(Colavecchia et al., 2004; Rankouhi et al., 2005; Timoney and Lee, 2009). Recently, Mundy et 316
al. (2019) demonstrated high EROD and Cyp1a4 mRNA induction in avian hepatocytes in 317
wetlands near mining operations (≤10 km). Human health issues have also been raised by local 318
Indigenous communities in the region. They are concerned about putative effects, such as 319
increased rates of cancer (Douben, 2003), diabetes, and heart problems, which have been linked 320
to areas influenced by oil sands mining (Irvine et al., 2014; Timoney and Lee, 2009). 321
PACs are produced by the incomplete combustion of organic material, forming 322
compounds with two or more fused aromatic rings. These compounds are separated into two 323
groups: pyrogenic and petrogenic PACs (Neff et al., 2005; Zhang et al., 2015). Pyrogenic PACs 324
are produced through the high temperature combustion of organic material, creating 325
unsubstituted parent compounds (Timoney and Lee, 2011). Petrogenic PACs are formed over 326
geologic timescales under geothermal temperature and pressure conditions, creating 327
predominantly alkylated versions of parent compounds (Douben, 2003; Thienpont et al., 2017; 328
Timoney and Lee, 2011). Once released into the environment, atmospheric transport allows for 329
global dispersion (Abdel-Shafy and Mansour, 2016). In water, PACs tend to adsorb and partition 330
into sediments due to their hydrophobic nature (Abdel-Shafy and Mansour, 2016; Thienpont et 331
al., 2017; Ukaogo and Igwe, 2015). As a result, PAC concentrations in lake sediments within the 332
AOSR have increased coeval with bitumen extraction in the region (Evans et al., 2016; Kurek et 333
al., 2013). Bitumen, and its associated PACs, are transported downstream into the Peace 334
16
Athabasca Delta (PAD), raising questions about the potential impact of the AOSR on 335
downstream populations and communities (Timoney and Lee, 2009). 336
The PAD is one of the world’s largest inland river deltas, a hydrologically dynamic 337
environment containing many interconnected lakes and channels, all fed by the Athabasca and 338
Peace River watersheds (Jautzy et al., 2015b). Although the PAD is >200 km downstream of the 339
surface mining development zone, it receives PACs from mining operations via atmospheric 340
transport (Jautzy et al., 2015a; Kelly et al., 2009). In addition, the Athabasca River has 341
transported PACs into the PAD for hundreds of years, as clearly shown by the erosion of 342
bitumen from upstream river banks (Hall et al., 2012; Jautzy et al., 2015b). There is some 343
evidence of increased PAC concentrations in pre-industrial PAD sediments (Hall et al., 2012). 344
As a result, PAC concentrations can be highly variable through time (Evans et al., 2016) and 345
consequently there is still public concern regarding the potential downstream cumulative 346
environmental effects of the oil sands industry on this region and its communities (Hall et al., 347
2012). Recently, Hebert (2019) reported elevated mercury levels in the eggs of aquatic birds in 348
the PAD, during years of high flow. High mercury levels have been equated to anthropogenic 349
activities within the AOSR: land disturbances, atmospheric releases, and dust from roads and 350
tailings ponds (Hebert, 2019). Alexander and Chambers (2016), concluded that heavy metal 351
concentrations associated with bitumen, were higher downstream of mining operations in post-352
development sediments (Alexander and Chambers, 2016). Fortunately, different organic proxies, 353
such as petroleum biomarkers, may provide key information on the impact of industrial activities 354
and natural bitumen seeps on regions such as the PAD. 355
Petroleum biomarkers have been frequently used to investigate ancient sediments and 356
petroleum sources (Wang et al., 2013; Yang et al., 2011). Three groups of petroleum biomarkers 357

17
(hopanes, terpanes, and steranes), are formed and preserved exclusively in petroleum reservoirs, 358
making them useful for oil forensics (Zumberge, 1987). Recently, these petroleum biomarkers 359
have been used for source identification, differentiation of oils, and monitoring of oil weathering 360
(Wang et al., 2013). Petroleum biomarkers are derived from formerly living organisms and are 361
found in crude oils, rocks, and sediments; there is little to no structural change through time 362
compared to most aromatic compounds (Wang et al., 2016, 2006b). Petroleum biomarkers are 363
highly abundant in oils, thermodynamically stable, and have high source specificity (Wang et al., 364
2016). In fact, petroleum biomarkers from a 25-year-old oil spill in Lesser Slave Lake, Alberta, 365
were not significantly degraded in surface (0-4 cm) and sub-surface (30-40 cm) sediments, when 366
compared to heavily weathered PACs (Wang et al., 1998). Consequently, petroleum biomarkers 367
in the bitumen-rich environment of the AOSR may provide an important tool to accurately 368
identify the source of PACs, as natural or anthropogenic in the environment. 369
Lake sediment cores provide a natural archive of environmental conditions, both 370
temporally and spatially (Korosi et al., 2016). They can be analysed to help overcome a lack of 371
long-term monitoring data in any region that has undergone anthropogenic change. In the AOSR, 372
lake sediment cores can be a tool to track these changes, as a result of mining activities. A large 373
body of scientific studies have demonstrated the effectiveness of using lake sediment cores to 374
reconstruct depositional histories of contaminants in lakes within the AOSR (Jautzy et al., 2013; 375
Manzano et al., 2017; Thienpont et al., 2017). A chronological analysis of deposition in dated 376
lake sediment cores may provide a better understanding of the sources and contaminants released 377
by surface mining activities within the AOSR (Korosi et al., 2016). 378
The objective of this study is to determine if mining operations in Alberta’s oil sands 379
have altered the PAC and petroleum biomarker composition of lake sediments collected from the 380

18
AOSR and the PAD. Increases in future mining operations result in more barrels of oil mined per 381
day, and the amount being upgraded. As a result, it is expected that future oil extraction will 382
increase regional contaminant inputs. The combined use of both petroleum biomarkers and PACs 383
should provide a more complete understanding of the source and extent of contamination to lakes 384
in these regions over the past century. We examined two lakes in the PAD, one heavily impacted 385
site in the AOSR, and two relatively unimpacted sites (hereafter referred to as reference sites) in 386
the AOSR. I hypothesize that (1) petrogenic PACs in the AOSR and the PAD increased in lake 387
sediments coeval with oil sands production and (2) the petroleum biomarkers composition in the 388
AOSR and the PAD changed in lake sediments coeval with increased oil sands production 389
emissions. 390
2.0 Methods 391
2.1 Study Sites and Sample Collection 392
393
This study was conducted in the Municipality of Wood Buffalo near Fort McMurray, 394
Alberta and in the PAD. Both PAD 30 and PAD 31 are located downstream of the Athabasca 395
River and receive flood waters on an annual basis. BM11, located in the south eastern section of 396
the Birch Mountains, is a remote lake, 43 km north of the nearest mining upgrader. Saline Lake 397
is directly adjacent to the Athabasca River and is less than 5 km from the nearest mining 398
upgrader. Mariana Lake is approximately 100 km southwest of the city of Fort McMurray. 399
Mariana Lake and BM11 were selected as reference sites due to their distance from oil sands 400
upgraders. 401

19
402
Fig.1. Map of study region, identifying sampling locations in the Athabasca oil sands region: 403
Saline Lake (57°04’41.81” N, 111°31’20.43” W), BM11 (57°41’35.97” N, 111°54’26.08” W), 404
and Mariana Lake (55°57’02.35” N, 112°01’34.97” W), and sampling location in the Peace 405
Athabasca Delta: PAD 30 (58°30’N, 111°31’W) and PAD 31 (58°29’N, 111°30’W). Oil sands 406
leases currently being utilized by mining companies are shown in grey (2015). 407
408
Lake sediment cores were collected from PAD 30 in September 2016, and PAD 31 in 409
September 2010, and lake sediment cores from BM11, Mariana Lake, and Saline Lake were 410

20
collected in June 2017. Sediment cores from the AOSR were collected using a gravity corer and 411
sectioned at 0.5 cm intervals using a vertical extruder, whereas sediment cores from the PAD 412
were sectioned at 1 cm intervals. Sediments from PAD 30 and PAD 31 were kept in Whirl-Pak® 413
bags at 4°C at the University of Waterloo, Ontario, Canada. Sediments from the AOSR were 414
kept in Whirl-Pak® bags at -20°C at the University of Ottawa, Ontario, Canada. 415
2.2 Laboratory analysis – Dating sediment cores 416
417
Each lake sediment core was 210Pb dated using an Ortec High Purity Germanium Gamma 418
Spectrometer (Advanced Measurement Technology Ink, Oak Ridge, TN, USA) at the University 419
of Ottawa. Chronologies based on excess 210Pb activities were constructed with the constant rate 420
of supply (CRS) model using ScienTissiMe (Barry’s Bay, ON, Canada). Efficiency corrections 421
were made using Certified Reference Material (312 and 385) from the International Atomic 422
Energy Association (Vienna, Austria). 423
2.3 PAC and Biomarker analysis 424
425
The target analytes were the 16 US EPA priority PAHs, benzonaphthothiophene and 426
dibenzothiophene and their respective alkylated forms (Table S3). Sediments (20-30 g wet 427
weight (wwt.)), containing a minimum of 0.5 g total organic carbon (TOC), were weighed. 428
Water was first removed from the sediments through centrifuging and the subsequent addition of 429
Diatomaceous earth (Thermo Scientific). Samples were then spiked with a Deuterated mixture: 430
Naphthalene (D8, 99.5%), Acenaphthene (D10, 99%), Phenanthrene (D10, 98%), 431
Benz[a]Anthracene (D12, 98%), Perylene (D12, 98%) and N-Tetracosane (D50,98%), 432
(Cambridge Isotope Laboratories Inc. Tewksbury, MA, USA). PACs were extracted using an 433
accelerated solvent extractor (ASE-200, Dionex Corporation, Sunnyvale, CA, USA), using 50:50 434

21
acetone:hexane based on US EPA method 3540C modified for accelerated solvent extraction. 435
Solvent and water were separated using liquid-liquid extraction and then rinsed three times using 436
5 mL of hexane. Samples were evaporated down to 2 mL under a gentle stream of nitrogen 437
(TurboVap, Biotage, Charlotte, NC, USA) and centrifuged to remove any remaining particles 438
and water. Samples were subsequently evaporated down to 1 mL under a gentle stream of 439
nitrogen. Samples were then fractionated using silica gel (Grade 644) (6g) column 440
chromatography (Fisher S7441). To separate the F1 (petroleum biomarkers) and F2 (PACs) 441
fractions: we used 22 mL hexane and 35 mL 50:50 dichloromethane (DCM):hexane, 442
respectively. 443
The F1 fraction was evaporated down to 1 mL in 2,2,4-Trimethylpentane (TMP). 444
Samples were evaporated into 1 mL TMP and spiked with internal standard, p-Terphenyl (D14, 445
98) 10ul and then quantified using gas chromatography coupled with mass spectrometry. 446
Standards included hopanes and steranes (NIST 2266) in TMP (Sigma-Aldrich, Oakville, ON, 447
Canada), as well as C8-C40 Alkanes Calibration Standard (Bellefonte, PA, USA). F2 samples 448
were evaporated down to 1 mL for sulphur and pigment removal using preparative liquid 449
chromatography (GPC clean-up via modified US EPA method 3640a on Envirogel™ GPC 450
columns (Waters), automated with Agilent 1200 series preparative HPLC system). Samples were 451
evaporated into 1 mL TMP and spiked with internal standard, p-Terphenyl (D14, 98) 10ul, for 452
quantification using Gas Chromatography coupled with Mass Spectrometry (GC-MS). All 453
solvents were high grade Optima® from Fisher Chemicals, except TMP. 454
2.4 Statistical Analyses 455
456
Diagnostic ratios of PACs were calculated because they have proven useful for 457
distinguishing pyrogenic versus petrogenic PACs in the environment (De La Torre-Roche et al., 458

22
2009; Yunker et al., 2002). The ratios calculated included: 1) Fluoranthene (Fla) / pyrene (Py) 459
ratio = Fla/(Fla+Py) and 2) Indeno(1,2,3-cd)pyrene (IcdP) / Benzo(g,h,i)perylene (BghiP) ratio = 460
IcdP/(IcdP+BghiP). 461
Statistical analyses were performed using R statistical computing environment (v3.5.2). 462
To explore the variations between both regions and between lakes downcore profiles, we 463
conducted a principle component analysis (PCA) on the relative abundance of PACs. The PCA 464
biplots were conducted using ‘prcomp’ function in the ‘vegan’ package. Using the “Kendall” 465
package, we conducted Mann-Kendall trend tests on PAC fluxes, PAC diagnostic ratios, and 466
petroleum biomarker diagnostic ratios. This was done in order to compare temporal trends 467
between our study lakes. 468
3.0 Results and Discussion 469
3.1 PAC depositional history comparisons through time 470
471
Alkylated and parent PAC fluxes in the AOSR increased in surface sediments, with 472
consistently greater fluxes in alkylated PACs than in parent PACs (Fig.2). In Saline Lake, 473
alkylated PACs increased in the late 1970s, coinciding with the onset of mining activities in the 474
AOSR (CAPP, 2018) (Fig.2C). Historically, alkylated PAC fluxes in Saline Lake were greater 475
than in reference lakes. This suggests that impacted lakes had historically elevated PAC fluxes, 476
which may be the result of erosion of bitumen into surrounding waterbodies (Hall et al., 2012; 477
Jautzy et al., 2015a, 2015b). Interestingly, alkylated PACs in Mariana Lake and BM11 increased 478
in recent sediments (>1990s), indicating that these recent increases in alkylated PACs were not 479
confined exclusively to lakes directly affected by oil sands development. At Mariana Lake, a 480
convenience store and gas station were constructed in 1970 (Cormier, 2008). This may have 481

23
resulted in increased petroleum emissions adjacent to the lake, in addition to vehicle traffic 482
associated with the nearby highway. Runoff from motorways is one of the most important 483
sources of anthropogenic hydrocarbons to sediments (Stout and Wang, 2016), which has possibly 484
impacted Mariana Lake. The recent rise (2.5cm, 2002) in alkylated PACs in BM11 could be 485
explained by the deposition of petrogenic PACs, such as naphthalenes, phenanthrenes, 486
dibenzothiophenes, and chrysenes, as a result of regional atmospheric transport from mining 487
activities. Page et al. (1999) concluded that sediment associated PACs may remain unchanged 488
for years, providing clues as to the type of anthropogenic activities in a region, based on the 489
types of PACs present. 490
PAC fluxes in PAD lakes were greater than those in the AOSR (Fig.2). This may be 491
caused by the continual input of naturally eroded bitumen into the Athabasca River (Hall et al., 492
2012) as well as annual downstream PAC transport into the Delta from mining activities. PAD 493
31 had a history of flooding, with recorded flooding events pre-1940s and post-1982. The 494
decrease in PACs in 1996 (8.5 cm) and 1947 (17.5 cm) (Fig.2B) are indicative of flooding 495
events. Hall et al. (2012) compared sediment PACs from these flood prone years (pre-1940s and 496
post-1982) to a known flood event in 2007 and found similar PAC compositions thus confirming 497
the historical flooding events that we see in PAD 31 (Fig.2B). While there are no documented 498
flooding events in PAD 30, the decreased parent and alkylated PAC fluxes in 1964 (12cm) 499
suggest a flooding event occurred. Alkylated PAC fluxes in PAD 30 then increased in 1975 500
(10cm), coinciding with increased oil sands development in the AOSR (Kelly et al., 2009). 501
Notably, the PAC flux in PAD 31 increased later (1996) than PAD 30 (1969), despite PAD 30 502
and PAD 31 being hydrogeologically connected. 503
504

24
3.2 Changes in PACs through time 505
506
We used diagnostic ratio cross-plots to investigate PAC trends in lake sediment cores. 507
Fluoranthene and pyrene (Fla/[Fla+Py]) were plotted along the y-axis denoting pyrogenic and 508
petrogenic sources (Fig.3). Values lower than 0.4 denoted petrogenic sources and values greater 509
than 0.5 denoted pyrogenic sources (De La Torre-Roche et al., 2009). Plotted along the x-axis 510
are Indeno(1,2,3-cd)perylene and benzo(ghi)pyrene (IcdP/[IcdP+BghiP]). Values less than 0.2 511
denote petrogenic sources and values above 0.5 denote pyrogenic sources. Values between 0.2-512
0.5 denote petroleum combustion (Yunker et al., 2002). 513
Parent PAC diagnostic ratio cross-plots for PAD 30 indicated that diagnostic ratios for 514
Fla/(Fla+Py) shifted from pyrogenic signatures to petroleum combustion signatures in recent 515
sediments (10.5cm, 1975), though IcdP/(IcdP+BghiP) ratios remained relatively unchanged 516
(Fig.3A). Similarly, PAC diagnostic ratios in PAD 31 were similar to those of PAD 30 (Fig.3B). 517
A recent study by Evans et al. (2016), demonstrated that the PAD and the western section of 518
Lake Athabasca were dominated by petrogenic sources as evidenced by low Fla/(Fla+Py) ratios 519
(<0.4). Notably, IcdP/(IcdP+BghiP) did not indicate petrogenic sources and was dominated by a 520
petroleum combustion signature (Evans et al., 2016). Similar trends were observed in the lakes 521
we sampled: low molecular weight (LMW) (2-3 ringed) PACs (as evident by the decrease in 522
Fla/[Fla+Py]) and petroleum combustion signatures in high molecular weight (HMW) (4-6 523
ringed) PACs indicated that petrogenic sources dominated within the PAD after the onset of 524
mining activity (1970s). Therefore, the results presented herein, and elsewhere (Evans et al., 525
2016) demonstrate that petrogenic sources appear to be driving the PAC profiles within PAD 526
lakes. 527
25
In Saline Lake, PAC fluxes provided a record of oil sands mining operations, as 528
evidenced by a shift from pyrogenic to petrogenic sources in the late 1970s, marking the onset of 529
bitumen mining in the region (CAPP, 2018) (Fig.3C). Visually, parent and alkylated PACs 530
increased coeval with PAC fluxes in modern sediments (BM11, Mariana Lake, PAD 30, PAD 531
31, and Saline Lake) (Fig.2). PAC diagnostic ratios in BM11 shifted towards petrogenic sources 532
for both diagnostic ratios, suggesting inputs from mining activities in modern sediments (5.5cm, 533
1971) (Fig.3D). In Mariana Lake, Fla/Py ratios decreased in 1972, possibly due to the 534
construction of a gas station and convenience store, which opened in 1970 (Cormier, 2008) 535
approximately 80 m for the lake (Fig.2E). In 2008, the stores closed to construct an additional 536
lane on nearby highway 63. Interestingly, alkylated PAC fluxes increased in 2013, further 537
shifting the PAC composition towards more petrogenic sources (Fig.3E). It follows that 538
decreased values of Fla/(Fla+Py) and IcdP/(IcdP+BghI) in modern sediments have been shown 539
to indicate a greater source of petrogenic PACs (Jautzy et al., 2013; Kurek et al., 2013; 540
Thienpont et al., 2017). 541
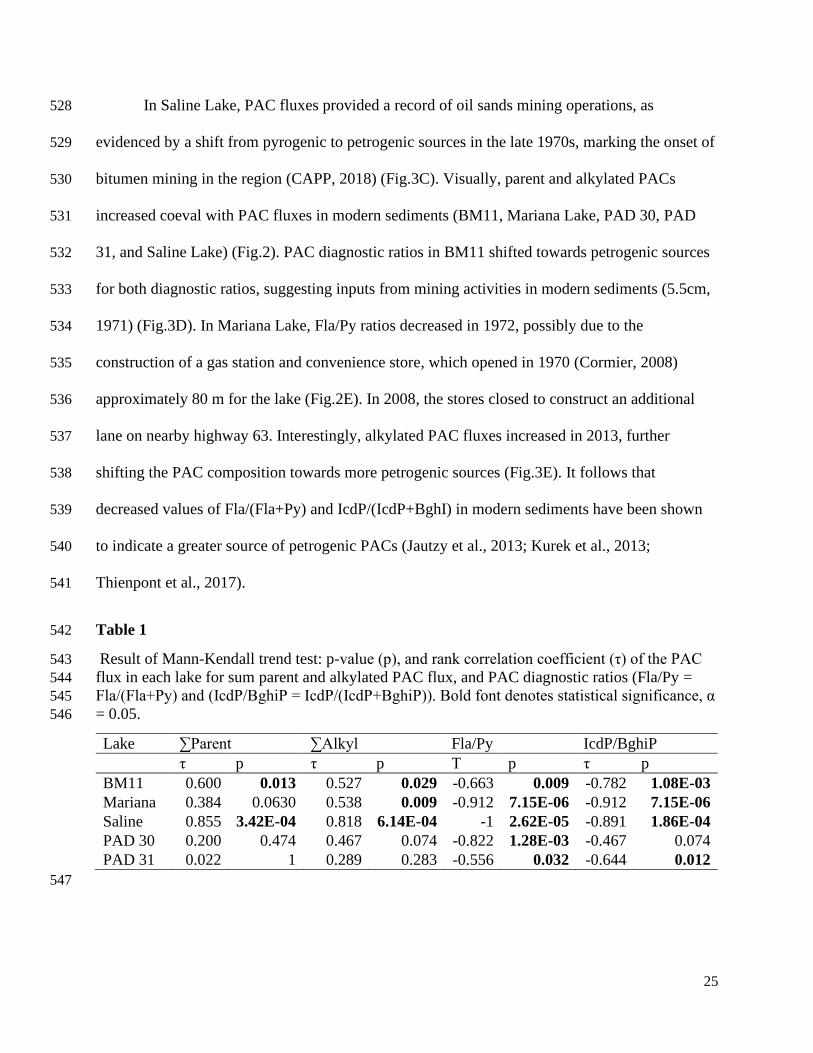
Table 1 542
Result of Mann-Kendall trend test: p-value (p), and rank correlation coefficient (τ) of the PAC 543
flux in each lake for sum parent and alkylated PAC flux, and PAC diagnostic ratios (Fla/Py = 544
Fla/(Fla+Py) and (IcdP/BghiP = IcdP/(IcdP+BghiP)). Bold font denotes statistical significance, α 545
= 0.05. 546
Lake ∑Parent ∑Alkyl Fla/Py IcdP/BghiP τ p τ p Τ p τ p
BM11 0.600 0.013 0.527 0.029 -0.663 0.009 -0.782 1.08E-03
Mariana 0.384 0.0630 0.538 0.009 -0.912 7.15E-06 -0.912 7.15E-06
Saline 0.855 3.42E-04 0.818 6.14E-04 -1 2.62E-05 -0.891 1.86E-04
PAD 30 0.200 0.474 0.467 0.074 -0.822 1.28E-03 -0.467 0.074
PAD 31 0.022 1 0.289 0.283 -0.556 0.032 -0.644 0.012
547

26
We used the Mann-Kendall test to determine whether sources and composition of PACs 548
deposited into these lakes has changed significantly over time. Diagnostic ratios with negative τ 549
values, suggest a shift from pyrogenic to petrogenic PAC sources (Ravindra et al., 2008; 550
Thienpont et al., 2017). In both our AOSR and PAD lakes, diagnostic ratios had statistically 551
negative τ values (p<0.05) thus supporting a shift from pyrogenic and petrogenic PAC sources, 552
except for PAD 30 (IcdP/BghiP) (Table 1). Shifts from pyrogenic to petrogenic sources occur in 553
Saline Lake, PAD 30, and PAD 31, coincide with the onset of mining activities (1970s) for both 554
ratios. Interestingly, the reference sites Mariana Lake and BM11 diagnostic ratios shift later (mid 555
1990s, IcdP/BghiP and 2013 and 1982 for Fla/Py, respectively) and less drastically than 556
impacted sites. In Saline Lake and BM11, ∑parent and ∑alkylated PACs had statistically 557
positive τ values (Table 1), indicating an increase in PAC flux towards the top of the sediment 558
core. In Saline Lake, the increase in near surface PACs can be attributed to mining, due to 559
increased levels of benzonaphthothiophenes, dibenzothiophenes and chrysenes, PACs commonly 560
associated with oil sands mining (Fig.2C). In BM11, deposition of these same compounds, 561
transported via prevailing winds (Environment and Climate Change Canada) (ECCC, 2019) 562
across the oil sands has resulted in near surface PAC flux increases in recent years (2000s). In 563
Mariana Lake, the τ value is significantly positive and thus suggests an increase in the deposition 564
of ∑alkylated PACs; this may be the result of vehicle traffic on highway 63 (Fig.2E). Korosi et 565
al. (2016), reported on the impact of vehicle traffic on winter roads to PAC concentrations in 566
subarctic Canadian lakes. While they reported higher levels of alkylated PACs in water and 567
sediment samples from lakes adjacent to roads, (relative to reference lakes), they could not 568
conclusively link vehicle traffic to increased PAC values (Korosi et al., 2016). Thus, while our 569
results suggest a possible link between vehicle traffic and increased PAC deposition, further 570

27
analysis of heavy metals in sediment profiles may provide additional proxies to determine 571
whether this relationship is significant. 572
3.3 Petroleum Biomarker Changes in Lake Sediments 573
574
To investigate downcore changes in petroleum biomarkers in lake sediments, we 575
examined petroleum biomarker diagnostic ratios (Table 2). All lakes showed statistical changes 576
in petroleum biomarker diagnostic ratios (Table 2). Diagnostic ratios with marked (1) p-values 577
are statistically significant. However, the effective size for these analyses is low (10-12 intervals 578
per lake), therefore p-values slightly above 0.05 are not considered significant. Visual inspection 579
of raw data supports this determination (Table S4-8). Small changes in petroleum biomarkers do 580
not equate to shifts in source as values can vary through replicates (Yang et al., 2011). 581
The use of petroleum biomarker diagnostic ratios more properly reflects the differences 582
of the target biomarker distribution between samples, reducing concentration effect size. These 583
ratios have been used as defensible indices for identification, correlation, and differentiation of 584
spilled oils (Peters and Moldowan, 1993; Wang et al., 2006a). Matching ratios may indicate a 585
correlation between a suspected source and a sample (Wang et al., 2007). To this effect, 586
comparing diagnostic ratios may help identify similar petroleum sources in sediment profiles. 587
Petroleum biomarker diagnostic ratios in Saline Lake, PAD 30, and PAD 31 did not track the 588
history of mining activity as evidenced by the PAC diagnostic ratios throughout the cores. 589
Interestingly, petroleum biomarkers in Mariana Lake did track recent (early 2000s) 590
anthropogenic activity: biomarker ratios (C23/C30, C24/C30, C30/∑C31-35, C31(S)/C31(R), and 591
∑Steranes/∑Terpanes) showed the greatest fluctuation in values through time (Table 2). While 592
these ratios increase, we cannot attribute these shifts to oil sands mining operations. Mariana 593
Lake is situated outside the oil sands mining zone, and the prevailing winds move to the 594
28
northwest, towards the oil sands. These shifts were coincident with development along the 595
highway and the highway’s later expansion. Prior to the 2000s, petroleum biomarker diagnostic 596
ratios in Mariana Lake were near zero, suggesting no petroleum sources present in the lake 597
(Table S5). The thermodynamic stability of petroleum sources is based on the ratio of (S) and 598
(R) configurations, which denotes the enantiomer of petroleum biomarkers, as chiral molecules. 599
Stable petroleum sources have a 1:1 mixture of (S) and (R) configurations (Dastillung and 600
Albrecht, 1976). In PAD 30, PAD 31, and Saline Lake, (C31(S)/C31(R), C34(S)/C35(S), 601
C34(R)/C35(R) ratios were near 1 (Table S6-8), indicative of a thermally stable petroleum source, 602
e.g. bitumen. In Mariana Lake, these ratios increased through time, suggesting that a continual 603
petroleum source was entering the system. Consequently, vehicle traffic appears to be the major 604
factor influencing the PAC concentrations and petroleum biomarkers in Mariana Lake. 605
Bryselbout et al. (1998) reported higher thermal maturity of petroleum on pine species found 606
along highways compared to urban roadways (Bryselbout et al., 1998). Similarly, Mariana Lake 607
petroleum biomarker ratios for S and R configurations increased through time (Table S5), which 608
may be the result of petroleum entering the lake from the nearby highway. Comparatively, 609
petroleum biomarker shifts in BM11 were likely caused by the atmospheric deposition of 610
petroleum sources from oil sands mining development. Consequently, these results indicate that 611
petroleum biomarkers can be used as proxies to determine when petroleum sources entered 612
historically uncontaminated lake systems. Similarly, increased terpane diagnostic ratios (C23/C30 613
and C24/C30) in BM11 are increasing towards levels seen in raw Alberta oil sands samples (Yang 614
et al., 2011). Interestingly, hopane ratios (C30/∑C31-35 and C31(S)/C31(R)) increased in Saline 615
Lake, as was also in Mariana Lake. An increase in hopanes may suggest an increase in industrial 616
activity, and thus we did not expect to see such increases in our reference lake. The increase in 617

29
hopane diagnostic ratios in Saline Lake may be the result of vehicle exhaust from mining 618
activities near Saline Lake and traffic along highway 63, near Mariana Lake. Notably, PAD 31 619
petroleum biomarkers have remained stable through the sediment profile (Table 2), coeval with 620
bitumen erosion into the PAD. Interestingly, PAD 30 terpane diagnostic ratios have shifted 621
through the sediment profile. 622
Overall, Saline Lake, PAD 30, and PAD 31 had the same levels of petroleum biomarkers 623
across all diagnostic ratios (Table S6-8). These results indicated exposure to a common 624
petroleum source: bitumen. In contrast, BM11 had different concentrations of diagnostic ratios, 625
which suggested that this lake received minimal loadings of petroleum biomarkers. Biomarkers 626
in Mariana Lake increased towards the beginning of the 21st century suggesting a greater source 627
input of petroleum biomarkers in modern sediment628

30
Table 2
Result of Mann-Kendall trend test (p = p-value, τ = rank correlation coefficient) of the petroleum biomarker diagnostic ratios in each
lake. Bold font denotes statistical significance, α = 0.05.
Diagnostic Ratios BM11 Mariana Saline PAD 30 PAD 31
τ p τ p τ p τ p τ p
C23/C24 -0.24 0.35 0.23 0.30 0.48 0.051 0.67 0.01 -0.21 0.47
C23/C30 0.58 0.02 0.84 9.16E-05 -0.04 0.94 0.64 0.01 0.30 0.28
C24/C30 0.61 0.01 0.77 4.29E-04 -0.40 0.12 0.52 0.05 0.33 0.23
C29/C30 -0.28 0.27 -0.33 0.14 -0.77 1.62E-03 0.09 0.79 0.27 0.32
Ts/Tm 0.59 0.031,2 -0.03 0.94 -0.49 0.051 0.22 0.46 0.14 0.65
C30/∑C31-35 0.33 0.22 0.84 1.52E-04 0.56 0.03 0.49 0.06 0.45 0.09
C31(S)/C31(R) 0.54 0.03 0.89 4.71E-05 0.61 0.01 -0.04 0.93 0.54 0.04
C34(S)/C35(S) NA NA NA NA 0.20 0.44 -0.09 0.79 0.30 0.28
C34(R)/C35(R) NA NA NA NA 0.20 0.44 0.03 1.00 -0.11 0.72
C27abb/C29abb NA NA 0.43 0.051 0.48 0.051 -0.02 1.00 -0.51 0.051
∑Steranes/∑Terpanes 0.15 0.58 0.60 0.01 -0.10 0.75 -0.50 0.06 -0.36 0.20
1 Not biologically significant 2 Only 2 values were obtained for this diagnostic ratio, therefore not significant

31
3.4 Multivariate analysis of lake sediment cores
PCAs were conducted on the stratigraphic profiles of parent PACs, alkylated PACs, and
petroleum biomarkers to visualize changes in the relative abundance of PACs and petroleum
biomarkers through time. The resulting figures (Fig.4-5, Fig. S7-S9) show the PCAs for each
lake with the five variables contributing most to the total variance as arrows.
Parent and alkylated naphthalene and benzonaphthothiophene were the primary
contributors to the variance in the PCAs (Fig. 4-5). These two compounds were major
contributors to the variance in all lakes with their directionality shifting towards modern
sediments. The loadings at the top of the cores were larger than those at the bottom (Fig.2),
driving the change in the PCAs (Fig 4-5). Naphthalene explained much of the PCA variance and
its presence may be attributed to forest fires. Vila-Escale et al. (2007), reported high levels of
naphthalene after a forest fire in Spain, with PAC values taking 15-22 months to return to
background levels (Vila-Escale et al., 2007). Annual forest fires, particularly the fire of 2015
which damaged parts of Fort McMurray may be the cause of high naphthalene values in modern
sediments. Bitumen extraction and upgrading in the AOSR would explain the presence of
benzonaphthothiophene, a common petrogenic PAC (Kelly et al., 2009). Other important
petrogenic PACs, including dibenzothiophene and chrysene, have been shown to play an
important role in explaining the variance, generally mirroring the directionality of
benzonaphthothiophene. These compounds are known petrogenic PACs (Kelly et al., 2009;
Wang et al., 2014), further supporting our rationale that petrogenic PAC input in these lake
systems is caused by mining operations in the AOSR.

32
4.0 Conclusions
In the AOSR and the PAD, there is evidence of increased PACs as the result of
anthropogenic activity in modern sediments. Among all sites considered in this study, the
industrial impact is most evident in lakes closer to the surface mining and upgrading activities in
the AOSR. Clear shifts from pre-industrial pyrogenic emissions to petrogenic PACs have been
detected in sediment profiles corresponding to the mid-1970s. Interestingly, petroleum
biomarkers in the PAD and AOSR did not track a change to petrogenic sources in sediment
profiles, as was predicted. We attribute this lack of shift in petroleum biomarkers to the natural
composition of the area, the very composition that makes it suitable for mining activity. In
reference lakes, PAC concentrations show increases in alkylated PACs, along with diagnostic
ratio shifts towards petrogenic sources. These increases suggest that anthropogenic activities
related to mining may be impacting our reference lakes in recent sediments. Petroleum
biomarker diagnostic ratios show similar results, increasing in modern sediments, suggesting a
petroleum signal in reference lakes (>1990s) that was not present prior to oil sands mining.
Notably, our reference lakes were not pristine through the sediment profile, yet they provide a
strong comparison to contaminated lakes in the AOSR and the PAD. Reference lakes have PAC
fluxes up to three orders of magnitude lower than lakes in the AOSR and the PAD, providing a
significant difference in impact. Consequently, we propose the use of petroleum biomarkers in
lake sediment profiles in areas outside of naturally occurring, petroleum-rich, rock formations.
The shift in the biomarker composition in response to recent anthropogenic activity was
detectable in our reference environments because of the naturally low historical levels of
petroleum biomarkers. It is critical to continue to provide context on the environmental impacts

33
of oil sands mining and processing at a local and regional level, given the projected growth in the
region.
Fig.2. Line plot of PAC flux (ng cm-2 y-1) versus depth (cm) for each lake down core. Depth is
shown on the left y-axis and the corresponding date (year) is shown on the right y-axis. Solid
lines represent parent PACs and the dashed line represents alkylated PACs. Red line indicates
the beginning of oil sands production (1967).

34
Fig.3. Plots showing PAC composition of lake sediment cores from the five study sites in
relation to the PAC diagnostic ratios Fluoranthene/Pyrene, (F/(FLA+Py)) and Indeno(1,2,3-
cd)pyrene(IcdP) / Benzo(g,h,i)perylene(BghiP), (IcdP/(IcdP + BghiP)). Data points are
connected to show the sequence of sediment deposition. (B) indicates the bottom of each core
(time before industrial development) and (T) indicated the top of the core (most recent sediment,
deposited during industrial development). Red lines indicate separations from petrogenic and
pyrogenic space.
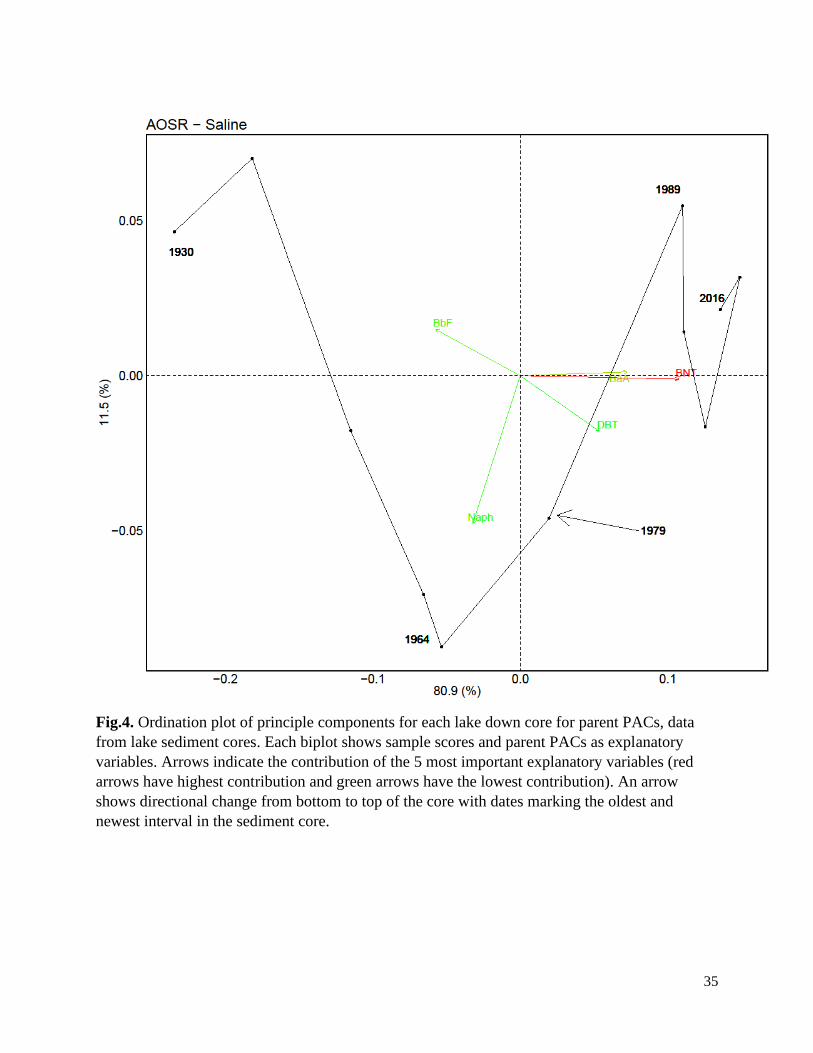
35
Fig.4. Ordination plot of principle components for each lake down core for parent PACs, data
from lake sediment cores. Each biplot shows sample scores and parent PACs as explanatory
variables. Arrows indicate the contribution of the 5 most important explanatory variables (red
arrows have highest contribution and green arrows have the lowest contribution). An arrow
shows directional change from bottom to top of the core with dates marking the oldest and
newest interval in the sediment core.

36
Fig.5. Ordination plot of principle components for each lake down core for alkylated PACs, data
from lake sediment cores. Each biplot shows sample scores and alkylated PACs as explanatory
variables. Arrows indicate the contribution of the 5 most important explanatory variables (red
arrows have highest contribution and green arrows have the lowest contribution). An arrow
shows directional change from bottom to top of the core with dates marking the oldest and
newest interval in the sediment core.

37
Supplementary Information
Table S3: Targeted PAC analytes
Polycyclic Aromatic Compounds Abbreviation
16 US EPA Priority PAHs
Naphthalene Naph
Acenaphthylene Acl
Acenaphthene Ace
Fluorene Fl
Phenanthrene Phen
Anthracene An
Fluoranthene Fla
Pyrene Py
Benz(a)anthracene BaA
Chrysene and triphenylene Chy
Benzo(b)fluoranthene BbF
Benzo(k)fluoranthene BbK
Benzo(a)pyrene BaP
Indeno(1,2,3-cd)pyrene IcdP
Dibenz(a,h)anthracene DA
Benzo(ghi)perylene BghiP
Additional PACs
Dibenzothiophene DBT
Benzonaphthothiophene BNT

38
Table S4: Down core petroleum biomarker diagnostic ratios for BM11
Diagnostic Ratios Sediment core depth intervals (cm) Diagnostic Ratios
0.5-
1
1.5-
2
2.5-
3
3.5-
4
4.5-
5
5.5-
6
6.5-
7
7.5-
8
8.5-
9
9.5-10 10.5-11
C23/C24 1.24 1.28 1.64 2.13 1.82 1.17 2.26 0.00 2.36 3.30 1.20
C23/C30 0.12 0.07 0.08 0.08 0.06 0.03 0.08 0.06 0.06 0.05 0.05
C24/C30 0.10 0.06 0.05 0.04 0.03 0.03 0.04 0.00 0.02 0.02 0.04
C29/C30 0.70 0.82 0.82 0.75 0.81 0.80 0.82 0.80 0.74 0.84 0.93
Ts/Tm 0.31 0.16 0.00 0.00 0.00 0.00 0.00 0.00 0.00 0.00 0.00
C30/∑C31-35 0.11 0.10 0.10 0.08 0.09 0.09 0.09 0.09 0.10 0.09 0.09
C31(S)/C31(R) 0.07 0.07 0.05 0.91 0.06 0.06 0.05 0.06 0.06 0.05 0.00
C34(S)/C35(S) 0.00 0.00 0.00 0.00 0.00 0.00 0.00 0.00 0.00 0.00 0.00
C34(R)/C35(R) 0.00 0.00 0.00 0.00 0.00 0.00 0.00 0.00 0.00 0.00 0.00
C27abb/C29abb 0.00 0.00 0.00 0.00 0.00 0.00 0.00 0.00 0.00 0.00 0.00
∑Steranes/∑Terpanes 0.04 0.10 0.11 0.10 0.08 0.09 0.06 0.12 0.02 0.09 0.08

39
Table S5: Down core petroleum biomarker diagnostic ratios for Mariana Lake
Diagnostic Ratios Sediment core depth intervals (cm)
0.5-
1
1.5-
2
2.5-
3
3.5-
4
4.5-
5.5
5.5-
6
8.5-
9.5
10.5-11 12.5-13 14.5-15 16.5-17 18.5-19 19-20
C23/C24 1.46 1.31 2.05 1.10 1.45 1.11 1.84 1.20 1.63 1.35 1.52 0.00 0.74
C23/C30 0.24 0.26 0.27 0.19 0.18 0.17 0.21 0.14 0.11 0.07 0.07 0.06 0.05
C24/C30 0.17 0.20 0.13 0.17 0.12 0.15 0.12 0.12 0.07 0.05 0.05 0.00 0.07
C29/C30 1.29 1.22 1.11 1.29 1.43 1.46 1.69 1.29 1.37 1.38 1.30 1.44 1.34
Ts/Tm 0.00 0.00 0.00 0.00 0.30 0.34 0.35 0.37 0.00 0.00 0.00 0.00 0.00
C30/∑C31-35 0.14 0.13 0.14 0.14 0.13 0.13 0.11 0.12 0.11 0.09 0.08 0.07 0.08
C31(S)/C31(R) 0.24 0.24 0.21 0.30 0.21 0.21 0.20 0.16 0.15 0.13 0.11 0.11 0.10
C34(S)/C35(S) 0.00 0.00 0.00 0.00 0.00 0.00 0.00 0.00 0.00 0.00 0.00 0.00 0.00
C34(R)/C35(R) 0.00 0.00 0.00 0.00 0.00 0.00 0.00 0.00 0.00 0.00 0.00 0.00 0.00
C27abb/C29abb 1.02 1.86 0.97 1.59 1.02 0.97 1.06 1.20 1.37 0.00 0.00 0.00 0.00
∑Steranes/∑Terpanes 0.87 0.40 0.44 0.53 0.49 0.42 0.54 0.49 0.33 0.10 0.07 0.09 0.07

40
Table S6: Down core petroleum biomarker diagnostic ratios for Saline Lake
Diagnostic Ratios Sediment core depth intervals (cm)
0.5-1 1.5-2 2.5-3 3.5-4 4.5-5 5.5-6 6.5-7 7-
7.5
7.5-8 8.5-9 9.5-10
C23/C24 1.88 1.76 1.86 1.81 1.78 1.82 1.79 1.77 1.68 1.79 1.69
C23/C30 0.47 0.45 0.46 0.47 0.46 0.43 0.42 0.45 0.44 0.48 0.56
C24/C30 0.25 0.25 0.25 0.26 0.26 0.24 0.23 0.25 0.26 0.27 0.33
C29/C30 0.80 0.78 0.80 0.83 0.83 0.81 0.81 0.84 0.84 0.87 0.98
Ts/Tm 0.32 0.32 0.33 0.35 0.33 0.35 0.37 0.35 0.36 0.35 0.34
C30/∑C31-35 0.49 0.48 0.49 0.50 0.48 0.47 0.46 0.49 0.44 0.44 0.46
C31(S)/C31(R) 1.21 1.21 1.19 1.16 1.14 1.12 1.06 1.24 1.08 1.12 1.02
C34(S)/C35(S) 1.07 1.01 0.89 0.98 1.00 0.99 0.91 0.96 1.06 1.02 0.81
C34(R)/C35(R) 1.35 1.59 1.26 1.19 1.05 1.53 1.58 1.43 1.44 1.07 1.11
C27abb/C29abb 1.28 1.06 1.14 1.34 1.09 1.03 0.99 1.30 0.95 1.06 0.85
∑Steranes/∑Terpanes 0.13 0.13 0.14 0.14 0.14 0.16 0.15 0.15 0.12 0.14 0.13

41
Table S7: Down core petroleum biomarker diagnostic ratios for PAD 30
Diagnostic Ratios Sediment core depth intervals (cm)
0-1 4-5 6-7 8-9 10-11 12-13 15-16 20-21 28-29 38-39
C23/C24 1.76 1.78 1.71 1.71 1.45 1.11 1.32 1.39 1.42 1.07
C23/C30 0.59 0.52 0.45 0.40 0.32 0.22 0.27 0.30 0.39 0.23
C24/C30 0.33 0.29 0.26 0.23 0.22 0.20 0.20 0.22 0.28 0.21
C29/C30 0.95 0.99 0.91 0.86 0.92 0.95 0.88 0.89 0.95 0.93
Ts/Tm 0.36 0.35 0.35 1.17 0.41 0.38 0.35 0.29 0.37 0.35
C30/∑C31-35 0.52 0.47 0.44 0.39 0.42 0.30 0.37 0.36 0.42 0.41
C31(S)/C31(R) 0.97 1.00 1.00 0.99 0.78 0.58 0.66 0.90 1.06 1.02
C34(S)/C35(S) 1.01 1.02 1.08 0.91 0.00 0.00 0.00 1.07 1.10 1.04
C34(R)/C35(R) 1.13 1.01 1.29 0.00 0.00 0.00 0.00 1.33 1.72 0.00
C27abb/C29abb 1.04 1.03 0.99 2.17 3.89 2.52 2.03 1.48 1.01 1.55
∑Steranes/∑Terpanes 0.11 0.15 0.18 0.18 0.31 0.14 0.18 0.22 0.18 0.26

42
Table S8: Down core petroleum biomarker diagnostic ratios for PAD 31
Diagnostic Ratios Sediment core depth intervals (cm)
0-1 4-5 8-9 10-11 12-13 16-17 17-18 18-19 22-23 26-27
C23/C24 1.63 1.67 1.53 1.74 1.63 1.70 1.68 1.59 1.76 1.67
C23/C30 0.48 0.46 0.36 0.52 0.46 0.41 0.37 0.37 0.45 0.44
C24/C30 0.29 0.28 0.24 0.30 0.28 0.24 0.22 0.24 0.26 0.26
C29/C30 0.92 0.93 0.87 0.94 0.91 0.99 0.84 0.82 0.90 0.90
Ts/Tm 0.34 0.34 0.37 0.32 0.34 0.29 0.32 0.29 0.33 0.39
C30/∑C31-35 0.47 0.48 0.46 0.48 0.45 0.29 0.36 0.34 0.39 0.42
C31(S)/C31(R) 1.05 0.92 1.01 0.95 0.88 0.75 0.75 0.66 0.80 0.89
C34(S)/C35(S) 0.91 1.11 0.98 0.98 1.25 0.60 0.69 0.63 0.91 0.88
C34(R)/C35(R) 1.22 1.32 1.16 1.36 1.29 0.00 1.53 0.00 1.22 1.78
C27abb/C29abb 0.84 0.76 0.77 0.88 0.94 1.28 1.41 1.39 1.12 0.91
∑Steranes/∑Terpanes 0.14 0.14 0.17 0.15 0.16 0.18 0.19 0.17 0.14 0.17

43
Figure S6: A) Scatter plots of percent organic carbon versus percent nitrogen, and B) percent
carbon versus percent sulfur, for down core lake sediments from BM11 (circles), Mariana
(triangles), PAD 30 (squares), PAD 31 (cross), Saline (box).

44
Figure S7: Ordination plot of principle components for each lake down core for parent PACs,
data from lake sediment cores. Each biplot shows sample scores and parent PACs as explanatory
variables. Arrows indicate the contribution of the 5 most important explanatory variables (red
arrows have highest contribution and green arrows have the lowest contribution). An arrow
shows directional change from bottom to top of the core with dates marking the oldest and
newest interval in the sediment core.

45
Figure S8: Ordination plot of principle components for each lake down core for alkylated PACs,
data from lake sediment cores. Each biplot shows sample scores and alkylated PACs as
explanatory variables. An arrow shows directional change from bottom to top of the core with
dates marking the oldest and newest interval in the sediment core.

46
Figure S9: Ordination plot of principle components for each lake down core for biomarkers, data
from lake sediment cores. Each biplot shows sample scores and biomarkers as explanatory
variables. An arrow shows directional change from bottom to top of the core with dates marking
the oldest and newest interval in the sediment core.

47
Chapter 3. Conclusion
To my knowledge, the results presented in this thesis are the first to analyse petroleum
biomarkers in sediment profiles across the AOSR and the PAD. The aim of this thesis was to
evaluate PACs and petroleum biomarkers as proxies for mining activities to better understand
their impacts on a temporal and spatial scale. This was achieved by
(1) Measuring the concentration and distribution of PACs and petroleum biomarkers in
sediment profiles in addition to characterizing their petrogenic or pyrogenic origins
(Chapter 2).
I have taken the preliminary steps in using petroleum biomarkers in sediment profiles as
proxies of mining activities and have added to the current knowledge of down core PAC
profiles in the AOSR and the PAD.
3.1 Study Outcomes
Chapter 2 provides an in-depth analysis of PACs and petroleum biomarkers (hopanes,
steranes and terpanes) in sediment profiles of selected lakes in three regions: The Peace
Athabasca Delta and the oil sands region and reference lakes outside of the AOSR. Although
many studies have examined the PACs in sediment profiles in the AOSR and the PAD, this
thesis is the first to our knowledge to evaluate the use of petroleum biomarkers in sediment
profiles, to track mining activities (extraction and upgrading) in northern Alberta. The results of
this study confirmed the initial prediction that PACs would increase in modern sediments (post
1970s) as a result of oil sands mining and upgrading, in the AOSR and the PAD. Higher
concentrations of alkylated PACs associated with bitumen sources (benzonaphthothiophenes,
dibenzothiophenes and chrysenes) were elevated in the AOSR and PAD when compared to
48
reference lakes. PACs in reference lakes did show increases in PACs in modern sediments
(>1990s) as a result of atmospheric deposition of petrogenic PACs (BM11) and vehicle
emissions (Mariana Lake). Lakes within the PAD showed evidence of the hydrogeologic
connection between the AOSR and the PAD, based on loading of bituminous PACs, which are
present in PAD 30 and PAD 31. Further evidence of shifts from pyrogenic sources to petrogenic
sources are shown in PAC diagnostic ratios. All lakes showed shifts in modern sediments
towards petrogenic sources as seen by decreases in Fla/Py and IcdP/BghiP ratios. Petroleum
biomarkers have shown their importance in identifying changes in sources from pyrogenic to
petrogenic. However, these results were only seen in Mariana Lake and BM11, where clear
increases of petroleum biomarkers may be connected to vehicle traffic in the region and
atmospheric deposition respectively. The use of petroleum biomarkers in regions with historical
oil signatures, such as the AOSR and PAD, cannot provide further information regarding
industrial activities, as these biomarkers are historically present due to these bitumen rich source
rocks. In areas without petroleum sources, petroleum biomarkers may be able to provide
information on the addition of petroleum sources into a system. Further examination of
petroleum biomarkers in historically clean areas, which have later been exposed to
anthropogenic activities, could provide a better understanding of the impacts of petroleum
sources and their movement through the environment.
3.2 Future Directions
Through this study, we have determined that mining operations in the AOSR have
resulted in increased PACs within the region and downstream in the PAD. The use of petroleum
biomarkers, as indicators of petroleum source inputs, have proven to be promising proxies of
anthropogenic change. Petroleum biomarkers have clearly tracked petroleum source increases in

49
reference lakes and provided evidence for when petroleum entered a lake system. However, in
areas historically rich with petroleum, such as the AOSR and the PAD, shifts are not apparent, as
sediments are already rich with these biomarkers. Using petroleum biomarkers in historically
untouched environments, with respect to petroleum sources, such as the Arctic, would provide
important information on petroleum source additions. With increased commercial shipping
through the more frequently opened Arctic Ocean (Canadian Shipping Act, 2001), anthropogenic
impacts will be of greater interest to governments and environmental regulators. This diverse
landscape is extremely fragile and will continue to change with increased inputs of
anthropogenic source contamination, including petroleum (Casper, 2009). The addition of oil
sources such as crude oils, diesel, and gasoline, will have significant impacts on the environment.
If these oil compounds can be tracked within the Arctic, researchers, may have a better
understanding of when this contamination arrived and from what sources.
Furthermore, the shifts and trends of PACs in sediment profiles provide valuable
information on mining influences on a temporal and spatial scale. However, PACs are of concern
because of their toxic, mutagenic and carcinogenic properties (Douben, 2003; Evans et al.,
2016). Determining if PAC have increased as a result of mining activities, creating hazards to
humans and wildlife should be examined more closely. Toxicity testing of PAC extracts from
sediment profiles would provide strong evidence for changes in toxicity through time. These
analyses would provide evidence of mining impacts through time relating to both humans and
wildlife.
Previously, studies have focused on surface grab or individual PAC exposure studies
(Gauthier et al., 2004; Goswami et al., 2016; Medunić et al., 2016), providing a vast amount of
information on the toxicity of specific PACs. However, PACs interact in complex mixtures,
50
making toxicity testing difficult as each mixture has a unique signal (White, 2002). In the AOSR
and PAD, PACs have been present for millions of years, therefore, a petrogenic signal has
always been present in these environments (Hall et al., 2012). Downcore toxicity testing of
sediments could provide valuable information on the impact of mining activities in the AOSR
and the PAD. Tracking the toxicity of PACs and heavy metals emitted from oil sands mining
operations into lake sediments through high throughput PCR arrays would yield information on
the history of toxicity in the region. Determining how shifts in PACs have affected this baseline
of toxicity would be highly important for local communities and local biologists.

51
Reference List
Abdel-Shafy, H.I., Mansour, M.S.M., 2016. A review on polycyclic aromatic hydrocarbons:
Source, environmental impact, effect on human health and remediation. Egypt. J. Pet. 25,
107–123. https://doi.org/10.1016/j.ejpe.2015.03.011
Alexander, A.C., Chambers, P.A., 2016. Assessment of seven Canadian rivers in relation to
stages in oil sands industrial development , 1972 – 2010. Environ. Rev. 494, 484–494.
Bence, A.E., Kvenvolden, K.., Kennicutt, M.., 1996. Organic geochemistry applied to
environmental assessments of Prince William Sound, Alaska, after the Exxon Valdez oil
spill - a review. Org. Geochem. 24, 7–42.
Berkowitzt, N., Speightt, J.G., 1975. The oil sands of Alberta* 54, 138–149.
Brooks, P.W., Fowler, M.G., MacQueen, R.W., 1988. Biomarker Geochemistry of Cretaceous
Oil Sands, Heavy Oils and Paleozoic Carbonate Trend Bitumens, Western Canada Basin.
Fourth Unitar/UNDP Conf. Heavy Crude Tar Sands 12, 1–18. https://doi.org/Paper 134
Bryselbout, C., Henner, P., Lichtfouse, E., 1998. Fossil fuel biomarkers in plant waxes as
pollution parameters. Sci. Total Environ. 222, 201–204. https://doi.org/10.1016/S0048-
9697(98)00297-6
Canadian Shipping Act, 2001. NORDREG 1980-2015 Shipping Summary.
CAPP, C.A. of P.P., 2018. Canada’s Oil Sands.
Casper, K.N., 2009. Oil and Gas Development in the Arctic : Softening of Ice Demands
Hardening of International Law. Nat. Resour. J. 49, 825–882.
Colavecchia, M. V., Backus, S.M., Hodson, P. V., Parrott, J.L., 2004. Toxicity of oil sands to
early life stages of fathead minnows (Pimephales promelas). Environ. Toxicol. Chem. 23,
1709–1718. https://doi.org/10.1897/03-412
Conly, F.M., Crosley, R.W., Headley, J. V, 2002. Characterizing sediment sources and natural
hydrocarbon inputs in the lower Athabasca River , Canada. Jounral Environ. Eng. Sci. 199,
187–199. https://doi.org/10.1139/S02-013
Cormier, R., 2008. End of the road for Hwy. 63 oasis. Edmont. J. 1.
Crump, D., Williams, K.L., Chiu, S., Zhang, Y., Martin, J.W., 2017. Athabasca Oil Sands
Petcoke Extract Elicits Biochemical and Transcriptomic E ff ects in Avian Hepatocytes.
https://doi.org/10.1021/acs.est.7b00767
Dastillung, M., Albrecht, P., 1976. Molecular test for oil pollution in surface sediments. Mar.
Pollut. Bull. 7, 13–15. https://doi.org/10.1016/0025-326X(76)90282-4
De La Torre-Roche, R.J., Lee, W.Y., Campos-Díaz, S.I., 2009. Soil-borne polycyclic aromatic
hydrocarbons in El Paso, Texas: Analysis of a potential problem in the United
States/Mexico border region. J. Hazard. Mater. 163, 946–958.
https://doi.org/10.1016/j.jhazmat.2008.07.089
Douben, P.E.T., 2003. PAHs : An Ecotoxicological Perspective. John Wiley & Sons, Ltd.

52
Environment and Climate Change Canada, 2019. Fort McMurray Historical Wind Direction
[WWW Document]. URL https://fortmcmurray.weatherstats.ca/metrics/wind_direction.html
Evans, M., Davies, M., Janzen, K., Muir, D., Hazewinkel, R., Kirk, J., de Boer, D., 2016. PAH
distributions in sediments in the oil sands monitoring area and western Lake Athabasca:
Concentration, composition and diagnostic ratios. Environ. Pollut. 213, 671–687.
https://doi.org/10.1016/j.envpol.2016.03.014
Galarneau, E., Hollebone, B.P., Yang, Z., Schuster, J., 2014. Preliminary measurement-based
estimates of PAH emissions from oil sands tailings ponds. Atmos. Environ. 97, 332–335.
https://doi.org/10.1016/j.atmosenv.2014.08.038
Gauthier, L., Tardy, E., Mouchet, F., Marty, J., 2004. Biomonitoring of the genotoxic potential
(micronucleus assay) and detoxifying activity (EROD induction) in the River Dadou
(France), using the amphibian Xenopus laevis. Sci. Total Environ. 323, 47–61.
https://doi.org/10.1016/j.scitotenv.2003.10.014
Giove, A.M., Sciarrabba, T., 2019a. Mining for bitumen [WWW Document]. Oil Sands Mag.
URL https://www.oilsandsmagazine.com/technical/mining
Giove, A.M., Sciarrabba, T., 2019b. From diluted bitumen to synthetic crude: upgrading
explained [WWW Document]. Oil Sands Mag. URL
https://www.oilsandsmagazine.com/technical/bitumen-upgrading
Giove, A.M., Sciarrabba, T., 2019c. Oil sands 101: process overview [WWW Document]. Oil
Sands Mag. URL https://www.oilsandsmagazine.com/technical/oilsands-101
Goswami, P., Ohura, T., Yoshioka, M., Akiba, M., Guruge, K.S., Yamanaka, N., Munuswamy,
N., 2016. Spatio-temporal distribution, source, and genotoxic potential of polycyclic
aromatic hydrocarbons in estuarine and riverine sediments from southern India. Ecotoxicol.
Environ. Saf. 130, 113–123. https://doi.org/10.1016/j.ecoenv.2016.04.016
Government of Alberta, 2017. Oil Sands Fact Sheet.
Hall, R.I., Wolfe, B.B., Wiklund, J.A., Edwards, T.W.D., Farwell, A.J., Dixon, D.G., 2012. Has
Alberta Oil Sands Development Altered Delivery of Polycyclic Aromatic Compounds to the
Peace-Athabasca Delta? PLoS One 7. https://doi.org/10.1371/journal.pone.0046089
Hebert, C.E., 2019. The river runs through it : The Athabasca River delivers mercury to aquatic
birds breeding far downstream. PLoS One 14, 1–19.
Irvine, G.M., Blais, J.M., Doyle, J.R., Kimpe, L.E., White, P.A., 2014. Cancer risk to First
Nations’ people from exposure to polycyclic aromatic hydrocarbons near in-situ bitumen
extraction in Cold Lake, Alberta. Environ. Heal. A Glob. Access Sci. Source 13, 1–15.
https://doi.org/10.1186/1476-069X-13-7
Jautzy, J., Ahad, J.M.E., Gobeil, C., Savard, M.M., 2013. Century-Long Source Apportionment
of PAHs in Athabasca Oil Sands Region Lakes Using Diagnostic Ratios and Compound-
Speci fi c Carbon Isotope Signatures. Environ. Sci. Technol. 47, 6155–6163.
https://doi.org/10.1021/es400642e
Jautzy, J.J., Ahad, J.M.E., Gobeil, C., Smirnoff, A., Barst, B.D., Savard, M.M., 2015a. Isotopic

53
Evidence for Oil Sands Petroleum Coke in the Peace-Athabasca Delta. Environ. Sci.
Technol. 49, 12062–12070. https://doi.org/10.1021/acs.est.5b03232
Jautzy, J.J., Ahad, J.M.E., Hall, R.I., Wiklund, J.A., Wolfe, B.B., Gobeil, C., Savard, M.M.,
2015b. Source Apportionment of Background PAHs in the Peace-Athabasca Delta (Alberta,
Canada) Using Molecular Level Radiocarbon Analysis. Environ. Sci. Technol. 49, 9056–
9063. https://doi.org/10.1021/acs.est.5b01490
JOSM, 2016. 2014-2015 Technical Results Summary.
Keith, L.H., 2015. The Source of U.S EPA’s Sixteen PAH Priority Pollutants. Polycycl. Aromat.
Compd. 35, 147–160. https://doi.org/10.1108/eb025354
Kelly, E.N., Schindler, D.W., Hodson, P. V., Short, J.W., Radmanovich, R., Nielsen, C.C., 2010.
Oil sands development contributes elements toxic at low concentrations to the Athabasca
River and its tributaries. Proc. Natl. Acad. Sci. 107, 16178–16183.
https://doi.org/10.1073/pnas.1008754107
Kelly, E.N., Short, J.W., Schindler, D.W., Hodson, P. V., Ma, M., Kwan, A.K., Fortin, B.L.,
2009. Oil sands development contributes polycyclic aromatic compounds to the Athabasca
River and its tributaries. Proc. Natl. Acad. Sci. 106, 22346–22351.
https://doi.org/10.1073/pnas.0912050106
Korosi, Jennifer B., Cooke, C.A., Eickmeyer, D.C., Kimpe, L.E., Blais, J.M., 2016. In-situ
bitumen extraction associated with increased petrogenic polycyclic aromatic compounds in
lake sediments from the Cold Lake heavy oil fields (Alberta, Canada). Environ. Pollut. 218,
915–922. https://doi.org/10.1016/j.envpol.2016.08.032
Korosi, Jennifer B, Eickmeyer, D.C., Thienpont, J.R., Palmer, M.J., Kimpe, L.E., Blais, J.M.,
2016. Assessing the contribution of combustion-derived contaminants to a remote subarctic
environment from traf fi c on the Tibbitt to Contwoyto winter road ( Northwest Territories ,
Canada ). Sci. Total Environ. 553, 96–106. https://doi.org/10.1016/j.scitotenv.2016.02.054
Korosi, J.B., Thienpont, J.R., Smol, J.P., Blais, J.M., 2017. Paleo-ecotoxicology: What Can Lake
Sediments Tell Us about Ecosystem Responses to Environmental Pollutants? Environ. Sci.
Technol. 51, 9446–9457. https://doi.org/10.1021/acs.est.7b02375
Kurek, J., Kirk, J.L., Muir, D.C.G., Wang, X., Evans, M.S., Smol, J.P., 2013. Legacy of a half
century of Athabasca oil sands development recorded by lake ecosystems. Proc. Natl. Acad.
Sci. 110, 1761–1766. https://doi.org/10.1073/pnas.1217675110
Lin, H., Morandi, G.D., Brown, R.S., Snieckus, V., Rantanen, T., Jørgensen, K.B., Hodson, P. V,
2015. Quantitative structure – activity relationships for chronic toxicity of alkyl-chrysenes
and alkyl-benz [a] anthracenes to Japanese medaka embryos (Oryzias latipes). Aquat.
Toxicol. 159, 109–118. https://doi.org/10.1016/j.aquatox.2014.11.027
Manzano, C.A., Marvin, C., Muir, D., Harner, T., Martin, J., 2017. Heterocyclic Aromatics in
Petroleum Coke, Snow, Lake Sediments, and Air Samples from the Athabasca Oil Sands
Region. Environ. Sci. Technol. 51, 5445–5453. https://doi.org/10.1021/acs.est.7b01345
Manzetti, S., 2013. Polycyclic Aromatic Hydrocarbons in the Environment : Environmental Fate
and Transformation. Polycycl. Aromat. Compd. 33, 311–330.
54
https://doi.org/10.1080/10406638.2013.781042
Medunić, G., Srček, V.G., Kopjar, N., Bituh, T., Ahel, M., Mikac, I., Fiket, Ž., Mihalić, I.B.,
2016. Toxic airborne S, PAH, and trace element legacy of the superhigh-organic-sulphur
Raša coal combustion: Cytotoxicity and genotoxicity assessment of soil and ash. Sci. Total
Environ. 566–567, 306–319. https://doi.org/10.1016/j.scitotenv.2016.05.096
Neff, J.M., Stout, S.A., Gunster, D.G., 2005. Ecological risk assessment of polycyclic aromatic
hydrocarbons in sediments: identifying sources and ecological hazard. Integr. Environ.
Assess. Manag. 1, 22–33. https://doi.org/10.1897/IEAM_2004a-016.1
Page, D.S., Boehm, P.D., Douglas, G.S., Bence, A.E., Burns, W.A., Mankiewicz, P.J., 1999.
Pyrogenic polycyclic aromatic hydrocarbons in sediments record past human activity: A
case study in Prince William Sound, Alaska. Mar. Pollut. Bull. 38, 247–260.
https://doi.org/10.1016/S0025-326X(98)00142-8
Peters, K.., Moldowan, J.., 1993. The biomarker guide: Interpreting molecular fossils in
petroleum and ancient sediments. U.S Department of Energy.
Radke, M., Garrigues, P., Willsch, H., 1990. Methylated dicyclic and tricyclic aromatic
hydrocarbons in crude oils from the Handil field , Indonesia. Org. Geochem. 15, 17–34.
Rankouhi, T.R., Koomen, B., Sanderson, J.T., Bosveld, A.T.C., Seinen, W., van den Berg, M.,
2005. Induction of Ethoxy-Resorufin-O-Deethylase Activity By Halogenated Aromatic
Hydrocarbons and Polycyclic Aromatic Hydrocarbons in Primary Hepatocytes of the Green
Frog (Rana Esculenta). Environ. Toxicol. Chem. 24, 1428. https://doi.org/10.1897/04-
367r.1
Ravindra, K., Wauters, E., Grieken, R. Van, 2008. Variation in particulate PAHs levels and their
relation with the transboundary movement of the air masses. Sci. Total Environ. 6, 100–
110. https://doi.org/10.1016/j.scitotenv.2008.02.018
Shah, A., Leeke, G.A., Rigby, S., Greaves, M., 2010. A review of novel techniques for heavy oil
and bitumen extraction and upgrading and upgrading. Energy Environ. Sci. 3, 700–714.
https://doi.org/10.1039/b918960b
Stout, S.A., Wang, Z., 2016. Chemical Fingerprinting Methods and Factors Affecting Petroleum
Fingerprints in the Environment, Second Edi. ed, Standard Handbook Oil Spill
Environmental Forensics: Fingerprinting and Source Identification: Second Edition.
Elsevier Inc. https://doi.org/10.1016/B978-0-12-809659-8.00003-6
Thienpont, J.R., Desjardins, C.M., Kimpe, L.E., Korosi, J.B., Kokelj, S. V., Palmer, M.J., Muir,
D.C.G., Kirk, J.L., Smol, J.P., Blais, J.M., 2017. Comparative histories of polycyclic
aromatic compound accumulation in lake sediments near petroleum operations in western
Canada. Environ. Pollut. 231, 13–21. https://doi.org/10.1016/j.envpol.2017.07.064
Timoney, K.P., 2013a. The Delta’s Physical Environment and Landforms, in: The Peace-
Athabasca Delta: Portrait of a Dynamic Ecosystem. University of Alberta Press., Edmonton,
pp. 15–56.
Timoney, K.P., 2013b. Natural History: Fauna and Wildlife, in: The Peace-Athabasca Delta:
Portrait of a Dynamic Ecosystem. University of Alberta Press., Edmonton, pp. 119–149.

55
Timoney, K.P., Lee, P., 2011. Polycyclic Aromatic Hydrocarbons Increase in Athabasca River
Delta Sediment: Temporal Trends and Environmental Correlates - Environmental Science
& Technology (ACS Publications). Environ. Sci. Technol. 45, 4278–4284.
Timoney, K.P., Lee, P., 2009. Does the Alberta Tar Sands Industry Pollute ? The Scientific
Evidence. Open Conserv. Biol. J. 3, 65–81.
U.S. Energy Information Administration, 2018. Petroleum Producers and Consumers [WWW
Document]. URL https://www.eia.gov/tools/faqs/faq.php?id=709&t=6
Ukaogo, P.., Igwe, J.., 2015. Environmental Effects of Polycyclic Aromatic Hydrocarbons. J.
Nat. Sci. Res. 5, 117–132.
Vila-Escale, M., Vegas-Vilarrubia, T., Prat, N., 2007. Release of polycyclic aromatic compounds
into a Mediterranean creek ( Catalonia , NE Spain ) after a forest fire. Water Res. 41, 2171–
2179. https://doi.org/10.1016/j.watres.2006.07.029
Wang, Z., Fingas, M., Blenkinsopp, S., Sergy, G., Landriault, M., Sigouin, L., Lambert, P., 1998.
Study of the 25-year-old Nipisi oil spill: Persistence of oil residues and comparisons
between surface and subsurface sediments. Environ. Sci. Technol. 32, 2222–2232.
https://doi.org/10.1021/es971070h
Wang, Z., Fingas, M.F., Sigouin, L., Owens, E.H., 2013. Fate and Persistence of Long-Term
Spilled Metula Oil in the Marine Salt Marsh Environment: Degradation of Petroleum
Biomarkers . Int. Oil Spill Conf. Proc. 2001, 115–125. https://doi.org/10.7901/2169-3358-
2001-1-115
Wang, Z., Stout, S.A., Fingas, M., 2006a. Forensic fingerprinting of biomarkers for oil spill
characterization and source identification. Environ. Forensics 7, 105–146.
https://doi.org/10.1080/15275920600667104
Wang, Z., Yang, C., Fingas, M., Hollebone, B., Hyuk Yim, U., Ryoung Oh, J., 2007. 3 -
Petroleum biomarker fingerprinting for oil spill characterization and source identification,
Oil Spill Environmental Forensics. Elsevier Inc. https://doi.org/10.1016/b978-012369523-
9.50007-0
Wang, Z., Yang, C., Fingas, M., Hollebone, B., Yim, U.H., Oh, J.R., 2006b. Petroleum
Biomarker Fingerprinting for Oil Spill Characterization and Source Identification, in: Oil
Spill Enviromental Forsensics.
Wang, Z., Yang, C., Parrott, J.L., Frank, R.A., Yang, Z., Brown, C.E., Hollebone, B.P.,
Landriault, M., Fieldhouse, B., Liu, Y., Zhang, G., Hewitt, L.M., 2014. Forensic source
differentiation of petrogenic, pyrogenic, and biogenic hydrocarbons in Canadian oil sands
environmental samples. J. Hazard. Mater. 271, 166–177.
https://doi.org/10.1016/j.jhazmat.2014.02.021
Wang, Z., Yang, C., Yang, Z., Brown, C.E., Hollebone, B.P., Stout, S.A., 2016. 4 - Petroleum
biomarker fingerprinting for oil spill characterization and source identification, Second Edi.
ed, Standard Handbook Oil Spill Environmental Forensics. Elsevier Inc.
https://doi.org/10.1016/B978-0-12-803832-1/00004-0
White, P.A., 2002. The genotoxicity of priority polycyclic aromatic hydrocarbons in complex

56
mixtures. Mutat. Res. - Genet. Toxicol. Environ. Mutagen. 515, 85–98.
https://doi.org/10.1016/S1383-5718(02)00017-7
Wolfe, B.B., Hall, R.I., Edwards, T.W.D., Johnston, J.W., 2012. Developing temporal
hydroecological perspectives to inform stewardship of a northern floodplain landscape
subject to multiple stressors : paleolimnological investigations of the Peace – Athabasca
Delta. Environ. Rev. 20, 191–210. https://doi.org/10.1139/a2012-008
Yang, C., Hollebone, B., Brown, C.E., Yang, Z., Fieldhouse, B., Landriault, M., Wang, Z., 2011.
Chemical Fingerprints of Alberta Oil Sands and Related Petroleum Products. Environ.
Forensics 12, 173–188. https://doi.org/10.1080/15275922.2011.574312
Yang, C., Zhang, G., Wang, Z., Yang, Z., Hollebone, B., Landriault, M., Shah, K., Brown, C.E.,
2014. Development of a methodology for accurate quantitation of alkylated polycyclic
aromatic hydrocarbons in petroleum and oil contaminated environmental samples. Anal.
Methods 6, 7760–7771. https://doi.org/10.1039/c4ay01393j
Yunker, M.B., Macdonald, R.W., Vingarzan, R., Mitchell, H., Goyette, D., Sylvestre, S., 2002.
PAHs in the Fraser River basin : a critical appraisal of PAH ratios as indicators of PAH
source and composition. Org. Geochem. 33, 489–515.
Zhang, L., Cheng, I., Muir, D., Charland, J.P., 2015. Scavenging ratios of polycyclic aromatic
compounds in rain and snow in the Athabasca oil sands region. Atmos. Chem. Phys. 15,
1421–1434. https://doi.org/10.5194/acp-15-1421-2015
Zumberge, J.E., 1987. Prediction of source rock characteristics based on terpane biomarkers in
crude oils : A multivariate statistical approach. Geochim. Cosmochim. Acta 51, 1625–1637.


