TrafficenforcementinSanDiego,CaliforniaAnanalysisofSDPDvehiclestopsin2014and2015
JoshuaChanin,MeganWelsh,DanaNurge,andStuartHenrySanDiegoStateUniversityNovember2016

i
TABLEOFCONTENTSEXECUTIVESUMMARY..................................................................................................................iiACKNOWLEDGEMENTS...............................................................................................................viiLISTOFTABLES...........................................................................................................................viiiLISTOFFIGURES...........................................................................................................................xiCHAPTERS
1.Introduction.................................................................................................................12.PolicinginSanDiego....................................................................................................33.DescriptionoftheData.............................................................................................144.TheDecisiontoInitiateaTrafficStop........................................................................265.EvaluatingPost-StopOutcomes................................................................................486.SummaryandRecommendations.............................................................................68
APPENDICES
1.DetaileddataonSDPDstaffingandcrimeinSanDiego............................................932.TheSanDiegoPoliceDepartmentVehicleStopDataCard.......................................953.SDPDOfficerSurvey..................................................................................................964.Limitingtheveilofdarknessanalysistostopsinvolvingmovingviolations............1045.Limitingtheveilofdarknessanalysistostopsinvolvingmaledrivers....................1086.Division-leveltrafficstoppatterns,byyear.............................................................1127.Usinglogisticregressiontomodelpost-stopoutcomes..........................................1188.Describingmatchedandunmatcheddrivers...........................................................1219.Modelingdriverhitratesafterdroppingmissingcontrabandcases.......................12710.Modelingdriverhitratesafterdroppingmissingcontrabandcases.....................12811.SDPDofficertraining.............................................................................................129

ii
EXECUTIVESUMMARYThis Report presents the results of an independent analysis of records generated following259,569trafficstopsinitiatedbySanDiegoPoliceDepartment(SDPD)officersbetweenJanuary1,2014andDecember31,2015.ThisreviewfocusedontheextenttowhichthesedatarevealDepartment- and division-level racial/ethnic disparities in (1) the decision to initiate a trafficstop; (2) thedecision to issueacitation; (3) thedecision toconducta field interview; (4) thedecisionto initiateasearch;(5)thediscoveryofcontraband;and(6)thedecisiontomakeanarrest.Ourfindingscanbesummarizedasfollows:
• Citywide,disparitiesbetweenBlackandWhitedriverswereevidentinvehiclestopdatafrom2014,butnot2015orthecombined2014/2015dataset,whilenosuchdisparitieswerefoundbetweenWhitesandeitherHispanicorAsian/PacificIslander(API)driversin2014or2015;
• Datafromboth2014and2015revealeddistinctanddivergentstoppatternsbydriverrace/ethnicityinpolicedivisionslocatedaboveandbelowInterstate8;
• Citywideandacross2014and2015,BlackandHispanicdriversweremore likely thanWhitedrivers tobesearchedfollowinga trafficstop,anddespite facinghighersearchrates,werelesslikelytobefoundwithcontraband;
• Black,Hispanic,andAPIdriversweresubjecttofieldinterviewsatgreaterratesthanWhitedrivers;
• Nomeaningfuldifferenceexistedintherateatwhichdriversfromeachracial/ethnicgroupwerearrested;
• BlackdriverswerelesslikelytoreceiveacitationthanWhitedriversstoppedundersimilarcircumstances,whilematchedHispanic,White,andAPIdriverswerecitedatsimilarrates;
• Records of traffic stops conducted in 2014 and 2015 were often incomplete, raisingquestionsastowhetherdatageneratedbytheSDPD’strafficstopdatacardsystemareareliablemeasureofactualtrafficstopsconducted;and
• CityresidentswhoparticipatedinourfocusgroupsandSDPDofficerswhoparticipatedin an electronic survey and follow-up interviews recognized a tension between theDepartmentandminoritycommunitymembers.
The remainder of this executive summary provides an overview of the data and analyticmethodsusedtoexaminetrafficstopsandpost-stopoutcomes,amoredetailedreviewofourfindings,andabriefdescriptionofourrecommendationstotheSDPDtoaddresstheidentifiedracial/ethnicdisparities.

iii
TrafficstopsToexaminetheeffectthatdriverrace/ethnicityhasonthelikelihoodthatanindividualwillbestoppedbythepolice,wedrawonwhathasbecomeknownasthe‘veilofdarkness’technique.Thisapproachispremisedontheassumptionthatifofficersarerelyingondriverrace/ethnicityto guide stop decisions, then such bias will be more apparent in daylight stops, when amotorist’s race/ethnicity ismore likely to be visible, than stops conducted after dark, whenphysicalappearanceishardertodetect.Theveilofdarknesstechnique,whichthusfarhasbeenusedbypolicescholarstostudytrafficstops in six other U.S. locations, allows researchers to avoid the difficulty of identifying andapplyingabenchmarkagainstwhichtocomparetrafficstopdata.Thisisthecentralchallengeintheanalysisoftrafficstops,asthedrivingpopulationinagivenareamaylookquitedifferentfromtheresidentialpopulation.Toaccountforthepossibilitythatthecompositionofdaytimedriversmaydifferfromthoseontheroadatnight,welimitedtheanalysistowhatisknownasthe‘inter-twilightperiod,’orthetimeperiodbetweentheearliestendofciviltwilight(approximately5:09pmonNov.27)andthelatest(approximately8:29pmonJun.27).Focusingonthisperiodallowedustocapitalizeon a natural experiment produced by seasonal changes. Because the sun goes down muchearlier inSanDiegoduringwintermonthsthan itdoes inthesummer,peopleontheroadat6:00pminJanuarywouldexperiencedarkness,butinJulythesamedrivewouldoccurinbroaddaylight.Thus,weareabletocomparethelikelihoodthatdriversontheroadduringthis3-hourand20-minutewindowwerestoppedindaylightversusdarkness,andtobeconfidentthatanydifferencesfoundareduetorace/ethnicityratherthanotherfactors.We omitted from the analysis stops that occurred as a result of a suspect description, codeenforcementeffort,orothertypeofcallforservice.Bylimitingoursampletoonlythosestopsthatinvolveanequipment(e.g.,abrokentaillight)ormovingviolation(e.g.,anillegalleftturn),weareable to focusondiscretionarydecisions,whereanofficer’suseof race/ethnicitymayindicatedisparatetreatment.Ouranalysisproducedaseriesofmixedresults. In2014,Blackdriversweremore likelytobestoppedduringdaylighthoursthanafterdark,comparedtoWhitedrivers.Wefoundnosuchdisparityin2015orinthecombined2014/2015dataset.Our reviewof citywidestops involvingHispanicandAPIdrivers revealednodisparities in theday-night stop patterns of either group compared to White drivers in 2014, 2015, or thecombinedtotal.Putanotherway, theoddsofanHispanicorAPIdriverbeingstoppedduring

iv
daylighthoursarestatisticallysimilartotheoddsofastopinvolvinganHispanicorAPIdriveroccurringafterdark,comparedtotheday-nightstoppatternsofWhitedrivers.To complement our citywide analysis,we also examined division-level stop patterns in 2014and 2015. Our review of aggregate data from the five divisions located above Interstate 8revealed no statistically significant disparities in the day-night stop patterns of either Black,Hispanic,orAPIdriversascomparedtoWhitedrivers.Narrowingthefocustothedivisionlevel,we found evidence of disparities in the day-night stop patterns of both Black and HispanicdriversstoppedintheNortheasterndivision,ascomparedtoWhites.NosuchdisparitieswerefoundbetweenAPIandWhitedrivers,orinanyoftheotherfourdivisionslocatedaboveI-8.DataonstopsconductedbelowInterstate8in2014and2015revealedamuchdifferentsetofresults.Wefindevidencetosuggestthatintheaggregate,BlackandHispanicdriverswerelesslikelybestoppedduringdaylighthoursthantheywereafterdark,ascomparedWhitedrivers.Inotherwords,whenofficersonpatrolbelowI-8wereabletoseeadriver’srace, theyweremore likely tostopaWhitedriver thaneitheraBlackorHispanic (butnotAPI)driver.At thedivision level, this typeofdisparitywasevident in stopsoccurring in theCentraldivisionandexclusivelyamongHispanicdriversstoppedintheMid-Citydivision.Post-stopoutcomesTheReportalsoincludesadetailedanalysisoftheextenttowhichkeypost-stopoutcomesvarybydriverrace.Inanefforttoeliminateotherpossibleexplanationsforracial/ethnicdisparitiesinthedecisiontoinitiateasearch,issueacitation,conductafieldinterview,oreffectuateanarrest, we matched API, Black, and Hispanic drivers with White drivers across a set ofdemographicandstop-basedcharacteristicsusingastatistical techniqueknownaspropensityscorematching.Analysisofthepost-stopoutcomesbetweenmatchedpairsshowsdistinctandsizabledifferences in theexperiencesofBlackandHispanicdrivers and theirmatchedWhitecounterparts. No statistically significant differences were evident in our analysis of the API-Whitepairing.Specifically, the data show that SDPDofficersweremore likely to search Black andHispanicdrivers than White drivers stopped under similar circumstances. These results were largelyconsistentacrossallsearchtypes,includinghighdiscretionsearches,likeconsentsearches,andlow discretion searches, like inventory searches. Across 2014 and 2015,White drivers weresearchedatagreaterratethanAPIdrivers.Analysis of ‘hit rates,’ or the percentage of searches that led to the discovery of illegalcontraband, revealed Black and Hispanic drivers were either less likely to be found with

v
contrabandorfoundwithcontrabandatsimilarratesthanmatchedWhitedrivers,dependingonthenatureofthesearch.Wefoundnomeaningfuldifferences inthehitratesofmatchedAPIandWhitedrivers.Wealsoused thepropensity scorematching technique toevaluatehowdriver race/ethnicityinfluenced arrest and field interview rates, as well as the decision to issue a citation. OuranalysisshowednostatisticaldifferenceinthearrestratesofmatchedBlackandWhitedrivers,whileHispanic driverswere arrested slightlymore often thanmatchedWhites.MatchedAPIdriverswerearrestedlessfrequentlythantheirmatchedWhitecounterparts.Black drivers were subjected to field interviewsmore than twice as often as their matchedWhitepeers,whiletherewasamuchsmallerthoughstatisticallysignificantdifferencebetweenbothHispanic andAPIdrivers as compared tomatchedWhitedrivers. Finally,we found thatBlackdriversreceivedcitations lessoftenthanmatchedWhites,whilematchedHispanic,API,andWhitedriverswereallcitedatnearlyidenticalrates.RecommendationsAnalysis of the 2014 and 2015 traffic stop card data, as well as the contextual insights wegainedfromseveralfocusgroupswithSanDiegocommunitymembers,interviewswithdozensof SDPD officers, and an electronic survey of SDPD officers suggest three broad, thematicresults. First, data on the SDPD’s stop andpost-stop enforcement patterns showmeaningfuldifferences in the treatment of Black and Hispanic drivers, as compared toWhites. Second,these disparities, which match the perceptions of some members of San Diego’s minoritycommunities, contribute to a recognized tensionbetween these communities and the SDPD.Third, SDPD’s existing system for collecting andmanaging traffic stop data is fundamentallyflawed.OurrecommendationstotheDepartmentaredesignedtoaddressthesebroadfindings.Systemicdisparities
1. Acknowledge the existence of racial/ethnic disparities and make combatting suchdisparitiesapriority;
2. Continuetoenhancetrainingandsupervisionaroundissuesofracial/ethnicdisparities;3. Maketrafficstoppracticesmoretransparent;and4. Maketrafficstoppracticesmoresystematicanddata-driven.
Police-communityrelations
5. Makecommunityengagementacoredepartmentalvalue;and
vi
6. Worktoimprovecommunicationandtransparencyregardingpolicepractices.Datacollectionandmanagement
7. Revisethecurrentdatacollectionsystem;8. Coordinateexistingdatacollectionefforts;9. Collectadditionaldata;10. Strengthenaccountabilityandoversightofdatacollectionandmanagement.
WesubmitthisReportduringachallengingtimeforpolicedepartmentsandindividualofficersacrossthecountry.Publicscrutinyoftheroleofpoliceinoursocietyandtensionbetweenlawenforcementandcommunitiesofcolorhasseldombeenmoreacutethanitistoday.Analysisof2014and2015trafficstopdatashowsthatperceptionsofdifferentialtreatmentaresupportedby data, and highlight several substantive issues that, in our view, should be given theDepartment’sfullattention.InsightsfrombothcommunitymembersandSDPDofficerssuggestthatthesearenotinsurmountablechallenges.Rather,thegoalofafairandtransparentpoliceforcedefinedbyastrongbondwithCityresidentsisonethatallinvolvedcaredeeplyabout.

vii
ACKNOWLEDGEMENTSCityCouncilwomanMartiEmeraldcommissioned this research,with funding fromtheCityofSanDiego.Weareappreciativeofalltheindividualswhomadethisresearchpossible.WethankMarisaBerumen,DeputyChiefofStaffforCouncilwomanEmerald,andRonaldVilla,DeputyChiefOperatingOfficeroftheCityofSanDiego,forfacilitatingthisresearch.ChrisHaley,InformationServicesProgramManagerfortheSanDiegoPoliceDepartment,wasinstrumental in sharing data with us. Both Ms. Haley and Almis Udrys, Director of thePerformance and Analytics Department of the City of San Diego, provided thorough andthoughtfulfeedbackonearlydraftsoftheReport.WethankKristinaPeralta,Director,PurchasingandContractingfortheCityofSanDiego,andSandraNordahlandTannazNiknejadiof theSanDiegoStateUniversityResearchFoundationfordiligentlymakingsureourcontracttoconducttheresearchwasexecuted.We thank the San Diego Police Department officers who were generous with their time inparticipatinginanelectronicsurveyaswellasfollow-upinterviewswithus.WethankourcolleaguesatHarder+CompanyCommunityResearch,particularlyNicoleBracy,AmyRamos,AnnaCruz,LauraFrutos,andAnaRamundo,forgenerouslylendingtheirtimeandexpertiseinplanningandconductingthecommunityfocusgroups.Wearealsogratefultotheparticipantsofthosegroupsforsharingtheirthoughtsandexperiences.WearegratefultoJulieO’ConnoroftheSchoolofPublicAffairsatSanDiegoStateUniversityforherassistancewithourbudgetingforthisproject.JoyceGattasandChristiannePenunuri,bothoftheCollegeofProfessionalStudiesandFineArtsat San Diego State, provided crucial support and feedback throughout this project.We alsothank John Petreikis for design and formatting support. Elliott Alvarado, Stacey Davis, AlexaEvans,andAnthonyTriolaprovidedresearchassistanceonvariouspartsofthisresearch.Lastly, this Report has been greatly enhanced through the thoughtful feedback of severalindividuals: Hank Fradella, Ed Maguire, and Mike White of Arizona State University; PreetiChauhanof JohnJayCollegeofCriminal Justice;GaryCordnerofKutztownUniversity;CarrollSeronoftheUniversityofCaliforniaIrvine;andRuletteArmstead,ShawnFlanigan,PaulKaplan,andLanieLockwood,allofSanDiegoState.

viii
LISTOFTABLES
2.1 DemographicprofileofswornSDPDofficers,byrace/ethnicity,gender,andyear2.2 Racial/ethniccompositionofSDPDpatroldivisionresidents,ages15andabove2.3 SDPDtrafficstopcarddatafrom2000and20012.4 SDPDsearchratesin2000and2001,bydriverrace/ethnicity2.5 Hitratesin2000and2001,bydriverrace/ethnicity3.1. Informationmissingfromthe2014and2015datasets3.2. Incompletestopcardssubmittedin2014and2015,bypolicedivision3.3. Incompletestopcardssubmittedin2014and2015,bydriverrace/ethnicity3.4. Comparingjudicialcitationrecordswithstopcardcitationrecords3.5. Focusgroupsandparticipants3.6 Descriptivestatisticsforpoliceofficersurveyrespondents 4.1. Previousresearchemployingtheveilofdarknessanalyticalapproach4.2. DescribingdatageneratedbytrafficstopsconductedbySDPDofficersin2014and2015,
bystoptype4.3. ModelingtheeffectsofdaylightontheoddsthatBlackdriverswillbestopped
citywideforeitheramovingviolationoranequipmentviolation4.4. ModelingtheeffectsofdaylightontheoddsthatBlackdriverswillbestopped
citywideforeitheramovingviolationoranequipmentviolationduringtheDSTperiod4.5. SDPDvehiclestops,bypatroldivision,2014and2015combined4.6. ModelingtheeffectsofdaylightontheoddsthatBlackdriverswillbestoppedforeither
a moving violation or an equipment violation in 2014 and 2015 combined, by stoplocation
4.7. Modeling the effects of daylight on the odds that Hispanic drivers will be stoppedcitywideforeitheramovingviolationoranequipmentviolation
4.8. Modeling the effects of daylight on the odds that Hispanic drivers will be stoppedcitywideforeitheramovingviolationoranequipmentviolationduringtheDSTperiod
4.9. Modeling theeffectsofdaylighton theodds thatHispanicdriverswillbe stopped foreitheramovingviolationoranequipmentviolationin2014and2015combined,bystoplocation
4.10. ModelingtheeffectsofdaylightontheoddsthatAsian/Pacific Islanderdriverswillbestoppedcitywideforeitheramovingviolationoranequipmentviolation
4.11. ModelingtheeffectsofdaylightontheoddsthatAsian/PacificIslanderdriverswillbestoppedcitywideforeitheramovingviolationoranequipmentviolationduringtheDSTperiod

ix
4.12. ModelingtheeffectsofdaylightontheoddsthatAsian/PacificIslanderdriverswillbestoppedforeitheramovingviolationoranequipmentviolationin2014and2015combined,bystoplocation
4.13. Thedemographicprofileofdriversstoppedin2014and20155.1. Trafficstopsandpost-stopoutcomesin2014and2015,bySDPDpatroldivision5.2. Trafficstopsandpost-stopoutcomes,bystoptime5.3. Trafficstopsandpost-stopoutcomes,bydriverrace/ethnicity5.4. ComparingsearchratesamongmatchedBlackandWhitedrivers5.5. ComparingsearchratesamongmatchedHispanicandWhitedrivers5.6 ComparingsearchratesamongmatchedAsian/PacificIslanderandWhitedrivers5.7. Rawdataonthediscoveryofcontraband5.8. ComparinghitratesamongmatchedBlackandWhitedrivers5.9. ComparinghitratesamongmatchedHispanicandWhitedrivers5.10 ComparinghitratesamongmatchedAsian/PacificIslanderandWhitedrivers5.11. ComparingarrestratesformatchedBlackandWhitedrivers5.12. ComparingarrestratesformatchedHispanicandWhitedrivers5.13. ComparingarrestratesformatchedAsian/PacificIslanderandWhitedrivers5.14. ComparingfieldinterviewratesformatchedBlackandWhitedrivers5.15. ComparingfieldinterviewratesformatchedHispanicandWhitedrivers5.16. ComparingfieldinterviewratesformatchedAsian/PacificIslanderandWhitedrivers5.17. ComparingcitationratesformatchedBlackandWhitedrivers5.18. ComparingcitationratesformatchedHispanicandWhitedrivers5.19. ComparingcitationratesformatchedAsian/PacificIslanderandWhitedriversA1.1. SDPDPatrolStaffing,bydivision,watch,andyearA1.2. CrimeinSanDiego,CA,bycrimetype,location,andyearA4.1. ModelingtheeffectsofdaylightontheoddsthatBlackdriverswillbestoppedcitywide
foramovingviolationA4.2. Modeling the effects of daylight on the odds that Hispanic drivers will be stopped
citywideforamovingviolationA4.3. Modeling the effects of daylight on the odds that Black driverswill be stopped for a
movingviolation,aboveandbelowInterstate8A4.4. ModelingtheeffectsofdaylightontheoddsthatHispanicdriverswillbestoppedfora
movingviolation,aboveandbelowInterstate8A5.1. Modeling the effects of daylight on the odds that Blackmale driverswill be stopped
citywideforeitheramovingviolationorequipmentviolationA5.2. ModelingtheeffectsofdaylightontheoddsthatBlackmaledriverswillbestoppedfor
eitheramovingviolationorequipmentviolation,aboveandbelowInterstate8
x
A5.3. ModelingtheeffectsofdaylightontheoddsthatHispanicmaledriverswillbestoppedcitywideforeitheramovingviolationoranequipmentviolation
A5.4. ModelingtheeffectsofdaylightontheoddsthatHispanicmaledriverswillbestoppedforeitheramovingviolationorequipmentviolation,aboveandbelowInterstate8
A6.1. ModelingtheeffectsofdaylightontheoddsthatBlackdriverswillbestoppedforeitheramovingviolationoranequipmentviolationin2014,bystoplocation
A6.2. ModelingtheeffectsofdaylightontheoddsthatBlackdriverswillbestoppedforeitheramovingviolationoranequipmentviolationin2015,bystoplocation
A6.3. ModelingtheeffectsofdaylightontheoddsthatHispanicdriverswillbestoppedforeitheramovingviolationoranequipmentviolationin2014,bystoplocation
A6.4. ModelingtheeffectsofdaylightontheoddsthatHispanicdriverswillbestoppedforeitheramovingviolationoranequipmentviolationin2015,bystoplocation
A6.5. ModelingtheeffectsofdaylightontheoddsthatAsian/PacificIslanderdriverswillbestoppedforeitheramovingviolationoranequipmentviolationin2014,bystoplocation
A6.6. ModelingtheeffectsofdaylightontheoddsthatAsian/PacificIslanderdriverswillbestoppedforeitheramovingviolationoranequipmentviolationin2015,bystoplocation
A7.1. Using logistic regression to model the likelihood that SDPD officers will search Blackdrivers
A7.2. UsinglogisticregressiontomodelthelikelihoodthatSDPDofficerswillsearchHispanicdrivers
A7.3. Usinglogisticregressiontomodelpost-stopoutcomesforBlackdriversA7.4. Usinglogisticregressiontomodelpost-stopoutcomesforHispanicdriversA8.1. DescribingmatchedandunmatchedBlackandWhitedriversA8.2. DescribingmatchedandunmatchedHispanicandWhitedriversA9.1. ComparinghitratesamongmatchedBlackandWhitedriversafterdroppingmissingand
nullcasesA9.2. ComparinghitratesamongmatchedHispanicandWhitedriversafterdroppingmissing
andnullcasesA10.1.Comparing citation rates formatched Black andWhite drivers after droppingmissing
andnullcasesA10.2.ComparingcitationratesformatchedHispanicandWhitedriversafterdroppingmissing
andnullcases

xi
LISTOFFIGURES
2.1. ComparingviolentcrimeratesacrossfivemajorCaliforniacities2.2. ComparingpropertycrimeratesacrossfivemajorCaliforniacities2.3. SanDiegoPoliceDepartmentneighborhooddivisions2.4. Violentandpropertycrimerate,bySDPDneighborhooddivision2.5. TherelationshipbetweendivisioncrimeratesandtheallocationofSDPDpatrolofficers3.1. Trackingmissingdata,bymonth3.2. Comparingmonthlytrafficstopvolume,byyear3.3. Monthlytrafficstoppercentages,bydriverrace/ethnicity4.1. Comparingdriverstopratesin2014and2015withSanDiego’sracial/ethnic
composition4.2. Scatterplotoftrafficstopsincludedintheveilofdarknessanalysis4.3. ScatterplotoftrafficstopsincludedintheDaylightSavingTimeveilofdarkness analysis4.4. Examiningtherelationshipbetweenvehiclestopratesandcrime,bySDPDpolice division5.1. TheaveragepercentagedifferencebetweenmatchedandunmatchedBlackand Whitedriversacrosseightvariablesusedtocompletematchingprocess5.2. TheaveragepercentagedifferencebetweenmatchedandunmatchedHispanicand
Whitedriversacrosseightvariablesusedtocompletematchingprocess

1
CHAPTER1:INTRODUCTIONInFebruary2015theCityofSanDiegocontractedwiththeSanDiegoStateUniversitySchoolofPublicAffairstoanalyzetheSanDiegoPoliceDepartment’s(SDPD)enforcementoflocaltrafficlaw. This Report encompasses our analysis of the 259,569 traffic stops conducted betweenJanuary1,2014andDecember31,2015.1Fourquestionsdroveourinquiry:
1. Towhatextent isthereadepartment-levelpatternofracial/ethnicdisparity intheinitiationoftrafficstops?
2. Towhatextentareracial/ethnicdisparitiesintheinitiationoftrafficstopsevidentatthepatroldivisionlevel?
3. Towhatextent isthereadepartment-levelpatternofracial/ethnicdisparity intheoutcomeoftrafficstops?
4. HowdoestheSDPD’strafficenforcementregimeaffectpolice-communityrelationsinSanDiego?
The Report is organized as follows. In Chapter 2we contextualize our analysis by discussingpolicing in San Diego. We begin by describing the organization and operation of theDepartmentandsummarizingcitywidecrimetrends.WethenreviewtheDepartment’srecenthistory,whichhasincludedeffortstoaddressallegationsofofficermisconductandtensionwithcommunitiesofcolor.2Finally,wediscussinsomedetailfindingsfromapreviousindependentanalysisofSDPDtrafficstopdataconductedin2000and2001.3InChapter3wedescribethedatausedtocompleteouranalysis.Wereviewthemechanismforrecording information about traffic stops, the ‘vehicle stop card,’ and discuss observablepatterns in thevolumeandqualityof thedataset.Wealsodescribe theprocessofgatheringcontextual information about traffic stops through conducting focus groups with San DiegocommunitymembersandsurveyingandinterviewingSDPDofficers.InChapter4weexaminetrafficstoppatternsattheDepartmentlevel,attheindividualpatroldivision level, and compare stop patterns above Interstate 8with those occurring below I-8.After discussing the analytical challenges presented by this issue, we describe in detail thestatisticalmethodusedtoaddresstheextenttowhichracial/ethnicdisparitiesexist.The‘veilof
1TherawdatafileswereceivedfromtheSDPDcontainedatotalof259,586records.17recordswerecorruptedandthusdroppedfromtheanalysis.2PoliceExecutiveResearchForum(PERF).(2015).Criticalresponsetechnicalassessmentreview:Policeaccountability-findingsandnationalimplicationsofanassessmentoftheSanDiegoPolicedepartment.Washington,DC:OfficeofCommunityOrientedPolicingServices,U.S.DepartmentofJustice.3Cordner,G.,Williams,B.,&Zuniga,M.(2001).SanDiegoPoliceDepartmentvehiclestopstudy:Year-endreport.SanDiego,CA.

2
darkness’ technique, our chosen approach, allows the researcher to isolate the effect ofrace/ethnicityfromotherfactorsbycomparingthedistributionofstopsmadeduringdaylighthours,whentherace/ethnicityofthedriver ismoreapparent,tothosemadeaftersundown,whendriver race/ethnicity is obscuredby darkness.We complete theChapter by comparingday-nightstoppatternsexperiencedbyAsian/PacificIslander(API),Black,Hispanic,andWhitedrivers.InChapter5wepresentouranalysisofpost-stopoutcomes,witha focusonexamininghowrace/ethnicityaffectsthelikelihoodthatadriverwillhavetheirpersonorvehiclesearchedandwhether that search will lead to the discovery of contraband.We also examine how driverrace/ethnicity influences the odds that a stopped driver receives a citation or is given awarning, is subject to a field interview, and whether the driver is ultimately arrested. TheChapter begins with a detailed discussion of the analytical approach driving our analysis.Propensityscorematchingisatechniquethatallowstheresearchertomatchdriversbasedonasetofdemographicandstop-relatedcharacteristicssoasto isolatetheeffectofrace.Fromtherewepresentadetailedanalysisofdataonseveralpost-stopoutcomes,includingsearches,‘hit rates,’ or the percentage of searches that lead to the discovery of illegal contraband,arrests,fieldinterviews,andtheissuanceofcitationsandwarnings.We conclude the Report in Chapter 6 with a brief summary of our findings and a series ofrecommendations.

3
CHAPTER2:POLICINGINSANDIEGOIntroductionSanDiego, California is the eighth largest city in theUnited States and one of the country’smostdiverseplaces to live.4 It isalsooneof thesafest.AsFigures2.1and2.2 indicate,bothviolent and property crime in San Diego are relatively rare occurrences, compared toCalifornia’sothermajor cities. Further, in2014, theCityof SanDiegohad the second lowestviolent crime rate (3.81 per 1,000 residents) and property crime rate (19.59 per 1,000residents) among the country’s 32 cities with populations greater than 500,000.5 Even withslight increases in 2015, the rates of both violent crime (up 5.3 percent from 2014) andpropertycrime(up7.0percent)inSanDiegoremainathistoricallylowlevels.6Despite these optimal circumstances, the recent history of the SanDiego PoliceDepartment(SDPD)hasbeenchallengedbyhiringandretentiondifficulties,allegationsofmisconduct,andpublic criticism.7 In this Chapter,we discuss the context of policing in San Diego and brieflyreviewtheissuesthatprecipitatedthisReport.
4UnitedStatesCensusBureau.(2015,May).Annualestimatesoftheresidentpopulationforincorporatedplacesof50,000ormore,rankedbyJuly1,2014population:April1,2010toJuly1,2014.RetrievedAug.24,2016,fromhttp://factfinder.census.gov/faces/tableservices/jsf/pages/productview.xhtml?src=bkmk;Cima,R.(2015,August11).ThemostandleastdiversecitiesinAmerica.RetrievedAug.24,2016,fromhttp://priceonomics.com/the-most-and-least-diverse-cities-in-america/.5Burke,C.(2016,Apr.).Thirty-sixyearsofcrimeintheSanDiegoregion:1980-2015.SANDAG,CriminalJusticeResearchDivision.RetrievedJul.19,2016,fromhttp://www.sandag.org/uploads/publicationid/publicationid_2020_20533.pdf.6Burke,C.(2016,Apr.).Thirty-sixyearsofcrimeintheSanDiegoregion:1980-2015.SANDAG,CriminalJusticeResearchDivision.RetrievedJul.19,2016,fromhttp://www.sandag.org/uploads/publicationid/publicationid_2020_20533.pdf.7e.g.,Dillon,L.(2014,Dec.23).MisconductissueswillfollowSDPDinto2015.VoiceofSanDiego.RetrievedAug.22,2016,fromhttp://www.voiceofsandiego.org/topics/government/misconduct-issues-will-follow-sdpd-into-2015/;Garske,M.,&Stickney,R.(2014,Sept.24).$5.9Mpaidtosettleex-copAnthonyArevaloscivillawsuit.NBC&SanDiego.RetrievedNov.8,2016,fromhttp://www.nbcsandiego.com/news/local/Anthony-Arevalos-Jane-Doe-Settlement-Details-SDPD-Sex-Crimes-277069491.html;Kucher,K.,Davis,K.,&Repard,P.(2015,Mar.17).Audit:SDPDflawsledtomisconduct.TheSanDiegoUnionTribune.Retrieved,Nov.8,2016,fromhttp://www.sandiegouniontribune.com/sdut-police-misconduct-review-justice-2015mar17-htmlstory.html.

4
Figure2.1.ComparingviolentcrimeratesacrossfivemajorCaliforniacities
Source:FederalBureauofInvestigation(2012)
Figure2.2.ComparingpropertycrimeratesacrossfivemajorCaliforniacities
Source:FederalBureauofInvestigation(2012)
0
500
1,000
1,500
2,000
2,500
3,000
1985 1988 1991 1994 1997 2000 2003 2006 2009 2012
Fresno LosAngeles SanDiego SanFrancisco SanJose
0
2,000
4,000
6,000
8,000
10,000
12,000
1985 1988 1991 1994 1997 2000 2003 2006 2009 2012
Fresno LosAngeles SanDiego SanFrancisco SanJose
5
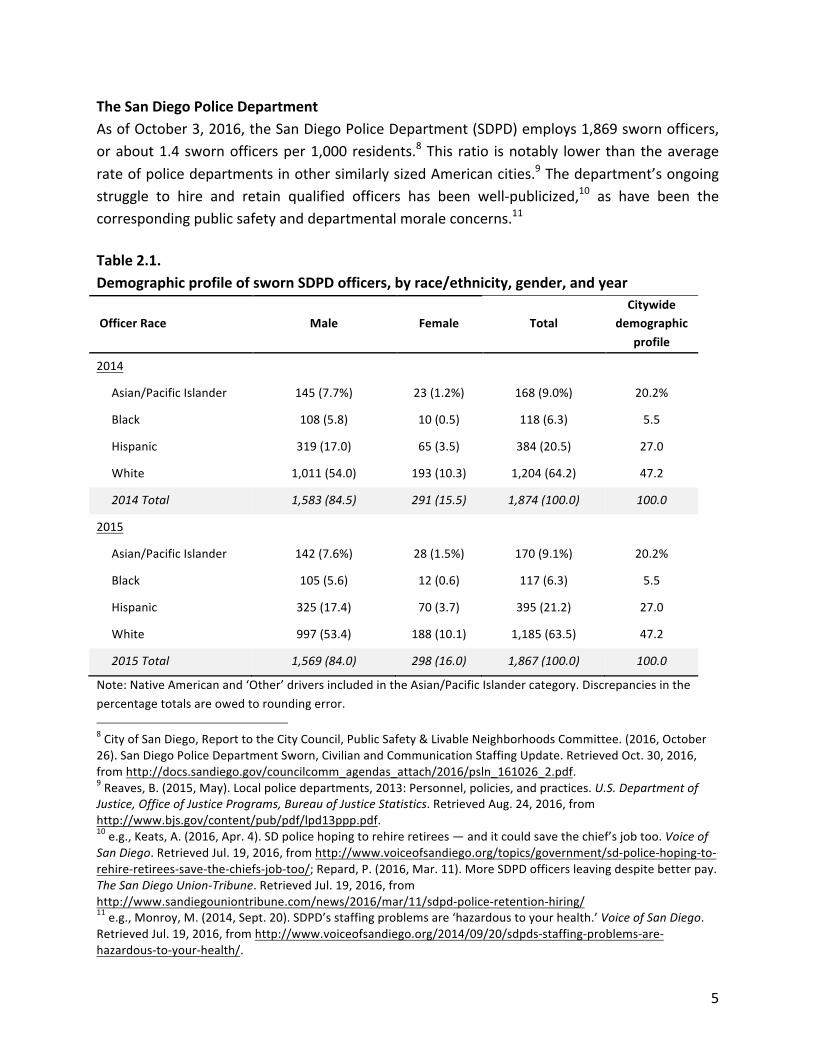
TheSanDiegoPoliceDepartmentAsofOctober3,2016,theSanDiegoPoliceDepartment(SDPD)employs1,869swornofficers,orabout1.4swornofficersper1,000residents.8This ratio isnotably lower thantheaveragerateofpolicedepartmentsinothersimilarlysizedAmericancities.9Thedepartment’songoingstruggle to hire and retain qualified officers has been well-publicized,10 as have been thecorrespondingpublicsafetyanddepartmentalmoraleconcerns.11Table2.1.DemographicprofileofswornSDPDofficers,byrace/ethnicity,gender,andyear
OfficerRace Male Female TotalCitywide
demographicprofile
2014
Asian/PacificIslander 145(7.7%) 23(1.2%) 168(9.0%) 20.2%
Black 108(5.8) 10(0.5) 118(6.3) 5.5
Hispanic 319(17.0) 65(3.5) 384(20.5) 27.0
White 1,011(54.0) 193(10.3) 1,204(64.2) 47.2
2014Total 1,583(84.5) 291(15.5) 1,874(100.0) 100.0
2015
Asian/PacificIslander 142(7.6%) 28(1.5%) 170(9.1%) 20.2%
Black 105(5.6) 12(0.6) 117(6.3) 5.5
Hispanic 325(17.4) 70(3.7) 395(21.2) 27.0
White 997(53.4) 188(10.1) 1,185(63.5) 47.2
2015Total 1,569(84.0) 298(16.0) 1,867(100.0) 100.0
Note:NativeAmericanand‘Other’driversincludedintheAsian/PacificIslandercategory.Discrepanciesinthepercentagetotalsareowedtoroundingerror. 8CityofSanDiego,ReporttotheCityCouncil,PublicSafety&LivableNeighborhoodsCommittee.(2016,October26).SanDiegoPoliceDepartmentSworn,CivilianandCommunicationStaffingUpdate.RetrievedOct.30,2016,fromhttp://docs.sandiego.gov/councilcomm_agendas_attach/2016/psln_161026_2.pdf.9Reaves,B.(2015,May).Localpolicedepartments,2013:Personnel,policies,andpractices.U.S.DepartmentofJustice,OfficeofJusticePrograms,BureauofJusticeStatistics.RetrievedAug.24,2016,fromhttp://www.bjs.gov/content/pub/pdf/lpd13ppp.pdf.10e.g.,Keats,A.(2016,Apr.4).SDpolicehopingtorehireretirees—anditcouldsavethechief’sjobtoo.VoiceofSanDiego.RetrievedJul.19,2016,fromhttp://www.voiceofsandiego.org/topics/government/sd-police-hoping-to-rehire-retirees-save-the-chiefs-job-too/;Repard,P.(2016,Mar.11).MoreSDPDofficersleavingdespitebetterpay.TheSanDiegoUnion-Tribune.RetrievedJul.19,2016,fromhttp://www.sandiegouniontribune.com/news/2016/mar/11/sdpd-police-retention-hiring/11e.g.,Monroy,M.(2014,Sept.20).SDPD’sstaffingproblemsare‘hazardoustoyourhealth.’VoiceofSanDiego.RetrievedJul.19,2016,fromhttp://www.voiceofsandiego.org/2014/09/20/sdpds-staffing-problems-are-hazardous-to-your-health/.

6
Per Table 2.1, despite efforts to diversify the force,12 the demographic profile of the SDPD’ssworn officers is disproportionately male and less racially and ethnically diverse than thecitywidepopulation.13TheSDPDisnotuniqueinitsrelativehomogeneity.Infact,accordingtoarecentNewYorkTimesanalysisof2007FBIdata,the“race/ethnicitygap”betweenthepoliceandresidentsinothermajorcities,includingLosAngeles,SanFrancisco,andmanyothers,isfargreaterthaninSanDiego.14WealsonotethatasofthiswritingSDPD’sforceiscomprisedof16percent female officers, slightly below the 17 percent average among departments servingcitieswithpopulationsof250,000ormore.15Figure2.3.SanDiegoPoliceDepartmentneighborhooddivisions
12Tragaser,C.(2015,Aug.21).SanDiegoPoliceDepartmentacademyclassseesincreaseddiversity.KPBS.org.RetrievedJuly28,2016,fromhttp://www.kpbs.org/news/2015/aug/21/san-diego-police-department-academy-class-sees-inc/.13UnitedStatesCensusBureau.(2015,August12).State&CountyQuickFacts,SanDiego(city),California.RetrievedAug.24,2016,fromhttp://quickfacts.census.gov/qfd/states/06/0666000.html.14Ashkenas,J.,&Park,H.(2015,April8).TheracegapinAmerica’spolicedepartments.TheNewYorkTimes.RetrievedfromAug.11,2016,fromhttp://www.nytimes.com/interactive/2014/09/03/us/the-race-gap-in-americas-police-departments.html?_r=0.15Reaves,B.(2015,May).Localpolicedepartments,2013:Personnel,policies,andpractices.U.S.DepartmentofJustice,OfficeofJusticePrograms,BureauofJusticeStatistics.RetrievedAug.,24,2016,fromhttp://www.bjs.gov/content/pub/pdf/lpd13ppp.pdf.
LAJOLLA
OTAY MESA
Pacific Ocean
SOUTHERN
CENTRALSOUTHEASTERN
EASTERN
NORTHEASTERN
RAMONA
ESCONDIDO
LAKESIDE
POWAY
CARLSBAD
SAN DIEGUITO
SWEETWATER
MIRAMAR
EL CAJON
SANTEE
CHULA VISTA
SPRING VALLEY
LA MESA
NATIONAL CITY
NORTHERN
NORTHWESTERN
WESTERN MID-CITY
San Diego Police Department District Boundaries
Legend
District Boundaries
Beats
¯
0 52.5 Miles
Datum: D_North_American_1983Projection: Lambert_Conformal_ConicSource: San Diego Police Department, U.S. Census Bureau (2010)
KEARNYMESA
RAMONA
Scripps Ranch

7
TheDepartmentdividespatrolactivitiesacrossninegeographicdivisions,visibleinFigure2.3.Thesedivisions vary greatly across several relevant categories, including residents’ racial andethnic composition, their socio-economic status, as well as the presence of both crime andpolice.Table2.2.Racial/ethniccompositionofSDPDpatroldivisionresidents,ages15andabove
Asian/PI Black Hispanic White Total
AboveInterstate8
Northern 37,473(19.0%) 3,440(1.7%) 25,673(13.0%) 130,299(66.2%) 196,885(100.0%)
Northeastern 63,499(35.6) 5,184(2.9) 18,239(10.2) 91,654(51.3) 178,576(100.0)
Eastern 17,685(14.9) 6,162(5.2) 18,201(15.3) 76,539(64.5) 118,587(100.0)
Western 13,232(11.5) 4,136(3.6) 20,014(17.4) 77,629(67.5) 115,011(100.0)
Northwestern 15,380(27.1) 510(0.9) 3,908(6.9) 36,889(65.1) 56,687(100.0)
Sub-total 147,269(22.1) 19,432(2.9) 86,035(12.9) 413,010(62.0) 665,746(100.0)
BelowInterstate8
Central 6,605(8.2%) 6,213(7.7%) 32,844(40.9%) 34,728(43.2%) 80,390(100.0%)
Southeastern 32,904(25.8) 22,024(17.3) 59,397(46.5) 13,344(10.5) 127,669(100.0)
Southern 10,524(13.0) 2,999(3.7) 58,859(72.6) 8,701(10.7) 81,083(100.0)
Mid-City 20,364(15.5) 12,751(9.7) 51,516(39.2) 46,800(35.6) 131,431(100.0)
Sub-total 70,397(16.7) 43,987(10.5) 202,616(48.2) 103,573(24.6) 420,573(100.0)
Citywidetotal 217,666(20.0) 63,419(5.8) 288,651(26.6) 516,583(47.6) 1,086,319(100.0)
Source:TheCityofSanDiego.16Note:Percentagediscrepanciesreflectroundingerror.
Table2.2displays the racialandethnicbreakdownof theDepartment’sninepolicedivisions.The highest concentrations of Black residents are found in the Southeastern and Mid-Citydivisions, whereWhite and Asian/PI populations are among their lowest. Similarly, Hispanicresidentstendtoreside intheSouthern,Southeastern,andMid-Citydivisions.Poverty isalsoconcentratedintheseneighborhoods.Infact,censustractsinthesedivisionsarehometomanyoftheSanDiego’spoorestresidents.17Conversely,neighborhoodslocatedaboveInterstate8,18
16TheCityofSanDiego,PublicSafety&LivableNeighborhoodsCommittee(2015,Feb.13).ReporttotheCityCouncil(ReportNo.15-016).VehicleStopDataCards:JanuarythroughDecember2014.RetrievedAug.27,2016,fromhttp://docs.sandiego.gov/councilcomm_agendas_attach/2015/psln_150225_3.pdf.17Kyle,K.(2012,August6).WhereSanDiego’spoorestlive:Map.TheVoiceofSanDiego.RetrievedAug.24,2016,fromhttp://www.voiceofsandiego.org/community/where-san-diegos-poorest-live-map/.

8
includingthose intheNorthern,Northeastern,Northwestern,Eastern,andWesterndivisions,whereincomelevelstendtobehigher,arealsohometogreaterpercentagesofWhiteandAPIresidents.Figure2.4.Violentandpropertycrimerate,bySDPDneighborhooddivision
Source:TheCityofSanDiego.19Note:Crimeratesarecalculatedper1,000patroldivisionresidentsandreflectdatafrom2014and2015.
Figure2.4highlightstherelationshipbetweenpropertycrimeandviolentcrimeacrosstheninedivisions.20In2014and2015,thehighestrateofviolentcrimeoccurredintheCentraldivision(11.0 incidents per 1,000 residents),21 followed by the Mid-City (6.0) and Western (5.6)
18WeuseInterstate8hereandthroughouttheremainderoftheReportasaroughpointofdemarcationfordivisionsandneighborhoodsinthenorthernportionoftheCityandthoseinthesouthernportionoftheCity.Thedistinctionbetweenlocations‘AboveInterstate8’and‘BelowInterstate8’isnotexact,astwopatroldivisionsthatweconsider‘AboveI-8’includesmallparcelsoflandlocatedbelowI-8.19SeeTheCityofSanDiego,ActualCrimesbyNeighborhood,2014and2015,CrimeStatisticsandMaps:AutomatedRegionalJusticeInformationSystem(ARJIS).RetrievedOct.14,2016,fromhttps://www.sandiego.gov/police/services/statistics.20SeeAppendix1foradetaileddescriptionofpropertyandviolentcrimeacrosstheSDPD’sninepatroldivisionsin2014and2015.21AccordingtotheheSDPD,“Crimeratesper1,000populationarecommonlyusedtocomparecrimeindifferentareas,andworkwellforareasthathaveasignificantresidentialpopulation.Cautionisadvisedwhencomparing
0
5
10
15
20
25
30
35
40
0
2
4
6
8
10
12
Prop
ertycrim
erate
Violen
tcrim
erate
Violentcrimerate Propertycrimerate

9
divisions.ThehighestrateofpropertycrimeoccurredintheWestern(33.7per1,000residents),Central(33.2),andEasterndivisions(24.4).22Onaverage,in2014and2015,violentcrimewasmorelikelytooccurbelowInterstate8(6.2incidentsper1,000people)thanindivisionstothenorthofthehighway(2.6),whilethepropertycrimeratesweresimilar ineach location(21.6belowInterstate8comparedto20.6aboveInterstate8).Figure 2.5 shows the relationship between a division’s crime rate and the allocation of non-trafficpatrolofficers.23Figure2.5TherelationshipbetweendivisioncrimeratesandtheallocationofSDPDpatrolofficers
Source:SanDiegoPoliceDepartment,CityofSanDiego.Note:Crimedata reflectaverages from2014and2015per1,000 residents.Officer rates,whichalso reflect theaveragebetween2014and2015,arelistedper100,000residents.
crimeratesinareaswithfewresidents,especiallyareaswithsignificantdaytimepopulationduetolargerecreationaland/orcommercialareas,sincecrimeratesuseresidentialpopulationfigures.Highercrimeratescanbeexpectedinareassuchasdowntown,wherethelargedaytimeworkingpopulationandnighttimeentertainmentdistrictcrowdsarenotincludedinthearea’sresidentialpopulation.”22Thecorrelationcoefficient(Pearson’sr)betweenviolentandpropertycrimeis0.719,indicatingamoderatelypositiverelationshipbetweenviolentandpropertycrime.23Thetwovariablesarestronglycorrelated(Pearson’sr=0.8725),whichmeansthathighcrimeratesareassociatedwithhighpatrolofficerpresence.
0
20
40
60
80
100
120
0
5
10
15
20
25
30
35
40
45
50
Patrolofficerrate
Crim
erate
Crimerate Patrolofficerrate

10
The highest concentration of non-traffic patrol officers occurs in those divisions with thehighestcrimerates,includingtheCentral(99.5officersper100,000residents),Western(69.8),andMid-City(63.3)divisions.(AfulldocumentationofofficerallocationbydivisionisfoundinAppendix 1.) The SDPD did not provide uswith data on the geographic allocation of traffic-specificofficers,whoarenotassignedtoaparticulardivisionandthusmaypatrolanywhereintheCity’sjurisdiction.To summarize, Black and Hispanic San Diego city residents tend to live in differentneighborhoodsthantheirWhiteandAsian/PIcounterparts.NeighborhoodssouthofInterstate8, including those in the Central, Mid-City, Southern, and Southeastern Divisions, are moreraciallyandethnicallydiversethanthoselocatednorthofInterstate8,andsome–butnotall–ofthesedivisionstendtofacehigherthanaveragecrimerates.Policepresenceisalsohigherinthosepredominantlynon-WhiteDivisions.Police-CommunityRelationsIn this section, we review the recent history of the Department with the hope of providingcontextforouranalysisofthe2014and2015trafficstopdata.Inearly2014,followingseveralhighprofileincidentsofofficermisconduct,formerSDPDChiefWilliam Lansdowne sought assistance from the U.S. Department of Justice’s (DOJ) Office ofCommunity Oriented Policing Services (COPS Office) in reviewing the Department’smanagement of officer misconduct cases, their approach to recruitment and backgroundscreening,andtheoperationoftheSDPDinternalaffairsunit.TheCOPSOfficehiredthePoliceExecutiveResearchForum(PERF)toconducttheassessment.The2015PERFReport,24whichdetailedthefindingsoftheyearlongaudit,identifiedaseriesoforganizational, policy, and personnel weaknesses that contributed to the Department’smisconductproblems.Thereportsetacomprehensivereformagendadesignedtostrengthenthe SDPD’s ability to preventmisconduct and respond effectively to incidents that do occur.PERF alsomade clear that themisconduct scandals had undermined the Department in theeyes of San Diego City residents, particularly among communities of color. The authorsrepeatedlyunderscoredtheimportanceofDepartmentattentiontoissuesofracial/ethnicbias,atonepointnotingthat,
the most common suggestions heard from community members regarding how to
24PoliceExecutiveResearchForum(PERF).(2015).Criticalresponsetechnicalassessmentreview:Policeaccountability-findingsandnationalimplicationsofanassessmentoftheSanDiegoPolicedepartment.Washington,DC:OfficeofCommunityOrientedPolicingServices,U.S.DepartmentofJustice.

11
improvepolicinginSanDiegoweretoincreasepolice-communityengagementthroughproactive and positive interactions and to address issues of perceived bias, especiallyracialbias.25
Thiswasnot the first timetheDepartmenthadbeenaccusedof racial/ethnicbias. In fact, in2000,averysimilarsetofissuesmotivatedSDPDleadershiptorequestanindependentreviewoftrafficstopdatanearlyidenticaltotheonewehaveundertakenhere.Revisitingthe2000and2001dataIn January 2000, in response to “concern… expressed by some community members aboutwhether they [were] being treated fairly in contactswith law enforcement,”26 SDPD officersbegancapturinginformationabouteverytrafficstopconductedinSanDiego.Dr.GaryCordner,acriminologistatEasternKentuckyUniversityatthetime,analyzedthesedata inanefforttoaddress the extent towhich officer stop and post-stop decision-making reflected race-baseddisparities.Table2.3.SDPDtrafficstopcarddatafrom2000and2001 2000 2001
VehicleStops 168,901 121,013
Citationrate(%) 66.1 68.8
Searchrate(%) 6.4 7.1
Hitrate(%) 8.9 8.4
Arrestrate(%) 1.9 1.9
High-level descriptive data from traffic stop cards gathered in 2000 and 2001 are shown inTable2.3.Officerscompletedsignificantlyfewerstopcardsin2001thanin2000,yetremainedfairly consistent from year to year in terms of post-stop activity, including the rate atwhichstoppeddriversweregivencitations,searched,andarrested.
25PoliceExecutiveResearchForum(PERF).(2015).Criticalresponsetechnicalassessmentreview:Policeaccountability-findingsandnationalimplicationsofanassessmentoftheSanDiegoPolicedepartment.Washington,DC:OfficeofCommunityOrientedPolicingServices,U.S.DepartmentofJustice,p.2226Cordner,G.,Williams,B.,&Zuniga,M.(2001).SanDiegoPoliceDepartmentvehiclestopstudy:Yearendreport.SanDiego,CA,p.ii.

12
The28.4percentdeclinefrom2000to2001ledCordnerandhiscolleaguestoopenlyquestiontheaccuracyof the2001data.Theauthorsargued that the“verysubstantialdecrease raisesseriousquestionsaboutthevalidityofthevehiclestopdata.Onequestioniswhetherofficersalwaysfilledoutthevehiclestopforms–theanswertothis isclearlyno.”27Theywentontoassertthattheofficers’non-complianceincompletingtrafficstopcards“wasabiggerproblemin more ethnically-diverse and less-affluent divisions, possibly skewing the data.”28 Theresearcherswereunabletointerprethowthemissingdatamayhaveaffectedtherateofpost-stop activity, or draw conclusions about whether unrecorded post-stop activity may havedisproportionately affected certain racial/ethnic groups. As such, they urge caution in theinterpretationofdatagatheredin2001.Table2.4.SDPDsearchratesin2000and2001,bydriverrace/ethnicity
2000 2001
Asian/PacificIslander 3.2% 3.3%
Black 10.1 11.1
Hispanic 11.4 12.7
White 3.2 4.1
Source:Cordneretal.(2001;2002)Note:ThesedatareflectwhatCordneretal.term“chancesofbeingsearched”andarebasedonarawcomparisonofsearchratesacrossallstopandsearchtypes.AswillbediscussedindetailinChapter4,isolatingtheinfluenceofdriverrace/ethnicityonanofficer’s decision to stop a driver is a complicated task. The central challenge, noted by theCordner-ledteamandmanyothers,29isidentifyingtheappropriatebenchmarkagainstwhichtocomparerace-basedstoppatterns.Afteracknowledgingtheabsenceofa“reliablemethodofdeterminingtheactualethniccompositionofthedrivingpopulation,”theCordneretal.studyproceeded to compare the racial/ethnic composition of drivers stopped to the City’sdemographicprofileaccordingtotheU.S.Census. In2000,“Hispanicsrepresent20.2%ofthecity’sdriving-agepopulationbut29.0%of vehicle stops; thecomparablenumbers forAfrican
27Cordner,G.,Williams,B.,&Velasco,A.(2002).SanDiegoPoliceDepartmentvehiclestopsinSanDiego:2001.SanDiego,CA,p.1.28Cordner,G.,Williams,B.,&Velasco,A.(2002).SanDiegoPoliceDepartmentvehiclestopsinSanDiego:2001.SanDiego,CA,p.229Engel,R.S.,&Calnon,J.M.(2004).Comparingbenchmarkmethodologiesforpolice-citizencontacts:TrafficstopdatacollectionforthePennsylvaniaStatePolice.PoliceQuarterly,7(1),97-125;Fridell,L.A.(2004).Bythenumbers:AguideforanalyzingracedatafromVehicleStops.Washington,D.C.:PoliceExecutiveResearchForum;Ridgeway,G.&MacDonald,J.(2010).Methodsforassessingraciallybiasedpolicing.InS.K.Rice&M.D.White(Eds.)Race,ethnicity,andpolicing:Newandessentialreadings(pp.180-204).NewYork:NewYorkUniversityPress.

13
Americans are 8.0% and 11.7%, respectively.”30 The 2001 data showed similar disparities forbothBlackandHispanicdrivers.31Cordner and colleagues also examined the influence of driver race/ethnicity on officers’decisiontoconductasearchofthedriver,passenger,orvehicle.Unlikewithtrafficstopdata,researchersarenotreliantuponbenchmarkstoassesstheinfluenceofrace/ethnicityonpost-stopoutcomes,likecitationandsearchrates.AsTable2.4shows,in2000and2001,BlackandHispanicdriversweresearchedathigherratesthaneitherWhiteorAsian/PIdrivers.Table2.5.Hitratesin2000and2001,bydriverrace/ethnicity
2000 2001
Asian/PacificIslander 9.2% 10.1%
Black 13.9 12.4
Hispanic 5.1 5.0
White 13.1 11.7
Note:Thesedatareflectarawcomparisonofhitratesacrossallstopandsearchtypes.Table 2.5 shows the ‘hit rate,’ or the percentage of searches that led to the discovery ofcontraband,achievedbySDPDofficersin2000and2001.Hitratesvariedconsiderablybydriverrace/ethnicitywhileremainingfairlyconsistentfromyeartoyear.Blackdriversweremostlikelytobefoundwithcontraband,followedcloselybyWhites.Hispanicdriversweremorelikelytobe searched than anyother racial/ethnic group, yet searches involvingHispanic driversweresubstantiallylesslikelytouncoverpossessionofcontraband.For several reasons, most saliently the low quality of the 2001 data, we agree with Dr.Cordner’s recommended cautious interpretation of these results. With that said, Cordner’sanalysis of data from stop cards completed in 2000 and 2001 appear to show race-baseddisparities in SDPD officers’ decision to initiate a traffic stop and various post-stop actions,includingthedecisiontosearch.However,withoutevidencetoshowthatpost-stopoutcomeswere the result of race-baseddecisions,we cannot assume this causal link. Aswediscuss inChapter4, this iswhytheveilofdarkness technique isso importantas itcontrols for factorsotherthanrace/ethnicityinthedecisiontomakeastop.
30Cordner,G.,Williams,B.,&Zuniga,M.(2001).SanDiegoPoliceDepartmentvehiclestopstudy:Yearendreport.SanDiego,CA,p.vii.31Cordner,G.,Williams,B.,&Velasco,A.(2002).SanDiegoPoliceDepartmentvehiclestopsinSanDiego:2001.SanDiego,CA.

14
CHAPTER3:DESCRIPTIONOFTHEDATAIn Chapter 3, we describe the data used for this Report, beginning with the administrativerecordsgeneratedbytheSDPDfollowingtrafficstopsconductedbetweenJanuary1,2014andDecember31,2015.FromtherewegoontodetailtheprocessusedtogathertheperspectivesofSDPDstaffandmembersofthecommunity.TrafficStopDataWhenanSDPDofficercompletesatrafficstop,theyarerequiredunderDepartmentpolicytosubmitwhatisknownasa‘vehiclestopcard’(seeAppendix2foracopyofthecard).Officersuse the stop card to record basic demographic information about the driver, including theirrace, gender, age, and San Diego City residency, along with the date, time, location (at thedivision level),andreasonforthestop.Therearealsofieldsfortrackingwhatweterm‘post-stopoutcomes,’includingwhethertheinteractionresultedin:
• theissuanceofacitationorawarning;• theinitiationofafieldinterview;• asearchofthedriver,passenger(s),and/orvehicle;• theseizureofproperty;• discoveryofcontraband;and/or• anarrest.
Lastly,thestopcardgivesofficersspacetoprovideaqualitativedescriptionoftheencounter.Whenincluded,thesedatatendtoexplainwhyaparticularactionwastakenortodescribethetypeofsearchconductedorcontrabanddiscovered.Comparedtoothercities,32thevehiclestopcardisasolidtoolfortrackingofficeractivityandforidentifyingtrendsintheenforcementofexistingtrafficlaw.AswewilldiscussinChapter6,however, there is substantial room to improve the SDPD’s current data collection efforts.Regardless ofwhat this system looks like, the Department should consider including severaldatapoints recommendedby theU.S.Departmentof Justice.33Themost importantpotentialadditionsinclude:
• race/ethnicityandgenderoftheofficerinvolved;• specificgeo-locationofthestop/search;
32See,forexample,Engel,R.S.,Tillyer,R.,Cherkauskas,J.C.,&Frank,J.(2001,Nov.1).TrafficStopDataAnalysisStudy:Year1FinalReport.Cincinnati,OH:UniversityofCincinnatiPolicingInstitute.RetrievedSept.5,2016,fromhttp://www.azdps.gov/about/reports/docs/Traffic_Stop_Data_Report_2007.pdf.33McMahon,J.,&Kraus,A.(2005).Asuggestedapproachtoanalyzingracialprofiling:Sampletemplatesforanalyzingcar-stopdata.Washington,DC:OfficeofCommunityOrientedPolicingServices,U.S.DepartmentofJustice.RetrievedAug.12,2016fromhttp://ric-zai-inc.com/Publications/cops-p071-pub.pdf.

15
• make,model,andvehiclecondition;and• driver/passengerdemeanor.
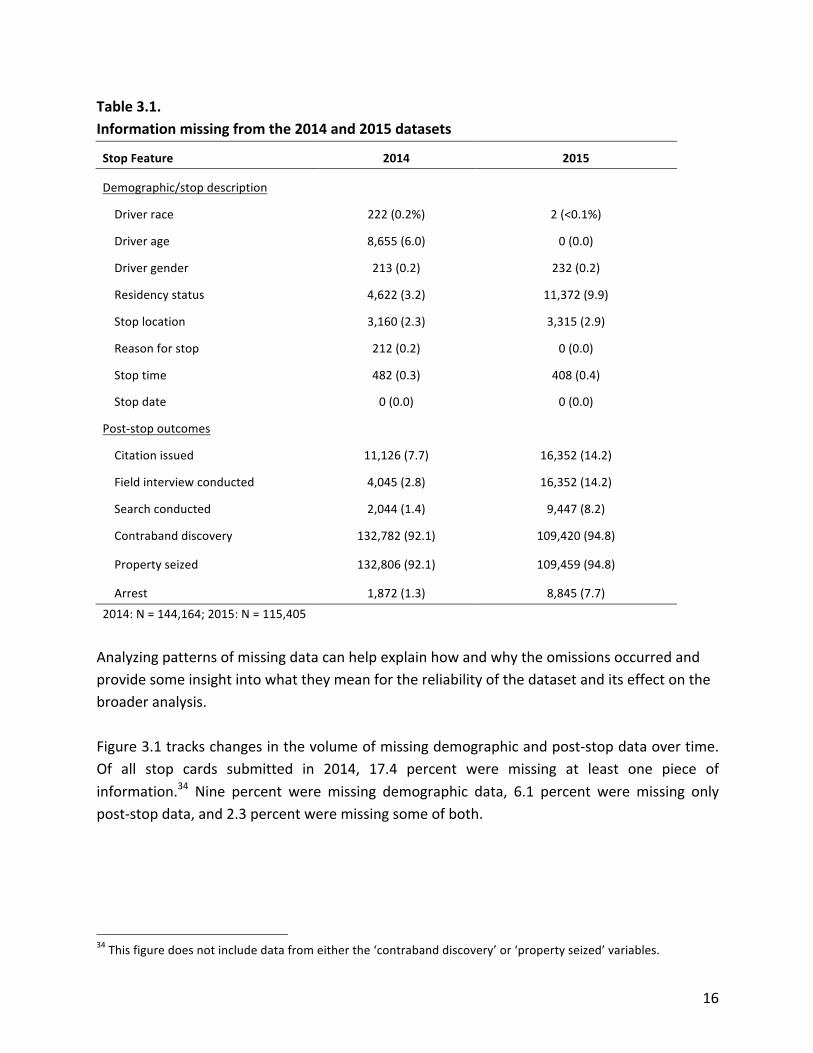
While our analysis was limited by the absence of this information, the incomplete andinconsistent quality of the data, which we discuss in the following section, was a moresubstantialchallenge.MissingandinconsistentdataOftheseveralchallengeswefacedinconvertingtherawfileswereceivedfromtheSDPDintoareliabledataset,missingdatawasthemostsignificant:19.0percentofthecombined259,569stop records submitted in2014and2015weremissingat leastonepieceof information.AsTable3.1shows,thedatawerecomprehensiveondriverrace/ethnicityandgender,aswellasthedate,time,location,andreasonforthestop,butwerelesssoindocumentingthedriver’sageandresidencystatus.Severalpost-stopvariablesalsocontainedhighlevelsofmissingdata,includinginformationonwhether a citationwas issued (10.6 percent), andwhether the driverwas subject to a fieldinterview(7.9percent)orasearch(4.4percent).Therewasalsoanexceedinglyhighnumber–93percent–ofmissingcasesassociatedwiththediscoveryofcontrabandandtheseizureofproperty, raising questions about the reliability of these data. This may be reflective of thedatabasemanagementratherthaneitherofficercarelessnessornon-compliance.Forexample,anofficer simplymaynothave filledouta response forcontraband,whichwouldhavebeenirrelevantifasearchdidnotoccurduringastop.
16
Table3.1.Informationmissingfromthe2014and2015datasets
StopFeature 2014 2015
Demographic/stopdescription
Driverrace 222(0.2%) 2(<0.1%)
Driverage 8,655(6.0) 0(0.0)
Drivergender 213(0.2) 232(0.2)
Residencystatus 4,622(3.2) 11,372(9.9)
Stoplocation 3,160(2.3) 3,315(2.9)
Reasonforstop 212(0.2) 0(0.0)
Stoptime 482(0.3) 408(0.4)
Stopdate 0(0.0) 0(0.0)
Post-stopoutcomes
Citationissued 11,126(7.7) 16,352(14.2)
Fieldinterviewconducted 4,045(2.8) 16,352(14.2)
Searchconducted 2,044(1.4) 9,447(8.2)
Contrabanddiscovery 132,782(92.1) 109,420(94.8)
Propertyseized 132,806(92.1) 109,459(94.8)
Arrest 1,872(1.3) 8,845(7.7)2014:N=144,164;2015:N=115,405Analyzingpatternsofmissingdatacanhelpexplainhowandwhytheomissionsoccurredandprovidesomeinsightintowhattheymeanforthereliabilityofthedatasetanditseffectonthebroaderanalysis.Figure3.1trackschangesinthevolumeofmissingdemographicandpost-stopdataovertime.Of all stop cards submitted in 2014, 17.4 percent were missing at least one piece ofinformation.34 Nine percent were missing demographic data, 6.1 percent were missing onlypost-stopdata,and2.3percentweremissingsomeofboth.
34Thisfiguredoesnotincludedatafromeitherthe‘contrabanddiscovery’or‘propertyseized’variables.

17
Figure3.1.Trackingmissingdata,bymonth
Note: Figure 3.1 doesnot include figures for datamissing fromeither the ‘contrabanddiscovered’ or ‘propertyseized’variables.In2015,21.1percentofstopcardsweremissingatleastonepieceofinformation,withnearlyhalfofthosemissingbothdemographicandpost-stop information.Asignificantspikeofstopcardsmissing both field interview and citation data occurred betweenMarch and August ofthat year, raisingquestionsabout thequalityof thesedataduring thatperiod.Wealsonotethatthevolumeofmissingdataincreasedasmonthlystoptotalsreachedtheirlowestlevels.Inotherwords,thequalityofthestopcarddatadeclinedacrosstheyearalongwiththenumberofbothrecordedstopsandsearches.Table3.2listsmissingdatabypatroldivision.Thehighestpercentageofincompletestopcardswere filed in theSoutheasterndivision (24.1percent), followedby theCentral (21.1percent)andSoutherndivisions (20.0percent). These findings, togetherwith thedata shown inTable3.3,whichlistsmissingrecordsbydriverrace,suggestthatthisdatasetdoesnotprovidethefullpictureoftrafficstopsinSanDiego,particularlyofthoseinvolvingminoritydriversanddriversstoppedindivisionslocatedbelowInterstate8.Aswenotedpreviously,thisistheexactpattern
0
2,000
4,000
6,000
8,000
10,000
12,000
14,000
16,000
0%
5%
10%
15%
20%
25%
30%
35% Jan2014 Feb
Mar Apr
May Jun Jul
Aug
Sep
Oct
Nov Dec
Jan2015 Feb
Mar Apr
May Jun Jul
Aug
Sep
Oct
Nov Dec
Stop
cardvolum
e
Missingdata(%
)
Demographicdata Post-stopdata Someofboth Stopcards

18
thatpromptedGaryCordner andhis colleagues toquestion the validity and reliabilityof the2000and2001data.35Table3.2.Incompletestopcardssubmittedin2014and2015,bypolicedivision
Stopcardssubmitted
Missingdemographicdata
Missingpost-stopdata
Missingbothtypesofdata
Totalincomplete
AboveInterstate8
Northern 37,203 1,872(5.0%) 3,567(9.6%) 965(2.6%) 17.2%
Eastern 31,788 1,505(4.7) 2,217(7.0) 1,467(4.6) 16.3
Northwestern 16,306 903(5.5) 802(4.9) 784(4.8) 15.3
Western 30,078 1,247(4.1) 2,242(7.5) 784(2.6) 14.2
Northeastern 31,692 950(3.0) 1,242(3.9) 1,020(3.2) 10.1
Sub-total 147,067 6,477(4.4) 10,070(6.8) 5,020(3.4) 14.7
BelowInterstate8
Southeastern 19,292 1,773(9.2%) 1,866(9.7%) 1,002(5.2%) 24.1%
Central 29,692 1,429(4.8) 3,070(10.3) 1,756(5.9) 21.1
Southern 29,351 705(2.4) 1,362(4.6) 3,791(12.9) 20.0
Mid-City 27,692 1,309(4.7) 2,304(8.3) 1,034(3.7) 16.8
Sub-total 106,027 5,216(4.9) 8,602(8.1) 7,583(7.2) 20.2
City-widetotal 253,094 11,693(4.6) 18,672(7.4) 12,603(5.0) 17.0
Note1:Missingdatadonotincludevariablesindicatingthediscoveryofcontrabandorpropertyseizure.Note2:Table3.2doesnotincludethe6,475stoprecordssubmittedwithoutstoplocationinformation,whichexplainsthediscrepancybetweenthecity-widetotalslistedhereandthoserefrencedelsewhereintheReport.Thefrequentincidenceofmissingdatareducedthequalityofouranalysisandraisesconcernsoverwhether the stop card recordsprovidea completepictureof traffic stops in SanDiego.These concerns are compoundedby theunexplained changes inmonthly traffic stop volumeduringthetimeperiodweanalyzed.Manyofthequestionsraisedaboutthequalityofthedatausedinthe2000and2001analysisweredrivenbyasubstantialdecrease–28.4percent–inthenumberofdatacardssubmittedbetweenthefirstandsecondyearoftheCordnerteam’sanalysis.Wefindasimilarpatternin
35Cordner,G.,Williams,B.,&Velasco,A.(2002).SanDiegoPoliceDepartmentvehiclestopsinSanDiego:2001.SanDiego,CA.

19
the2014and2015data,as isshowninFigure3.2. In2015,SDPDofficerscompleted115,405stopcards,nearly20percentfewerthanthe144,164completedin2014.Table3.3.Incompletestopcardssubmittedin2014and2015,bydriverrace/ethnicity
Stopcardssubmitted
Missingdemographic
data
Missingpost-stopdata
Missingbothtypesofdata
Totalincomplete
Asian/PacificIslander 41,021 2,625(6.4%) 2,429(6.4%) 1,922(4.7%) 17.5%
Black 28,535 2,136(7.5) 2,577(7.5) 1,302(4.6) 19.6
Hispanic 77,934 5,258(6.7) 5,584(6.7) 5,563(7.1) 20.0
White 111,855 7,051(6.3) 8,082(6.3) 4,690(4.2) 17.7
Total 259,345 17,070(6.6) 18,672(7.2) 13,477(5.2) 19.0
Note:Thesedatadonotincludethe224stoprecordssubmittedwithoutdriverrace/ethnicity.Datafrom2000and2014,thefirstyearsofeachstudy,showsteepdeclinesoverthecourseoftheyear,whilethevolumein2001and2015issubstantiallylower,andcomparativelyflatfrommonthtomonth.InJanuary2000,SDPDofficersrecorded20,487stops,nearlytwicetheannuallowof11,094,fromDecemberofthatyear.In2014,therewasa39percentdropfrom14,745stopsrecordedinFebruary,thatyear’sbusiestmonth,tothe8,988submittedinDecember,theslowest. Contrast thatwith 2001 and2015,where thehigh-to-lowmonthly differenceswere28.0percentand18.9percent,respectively.
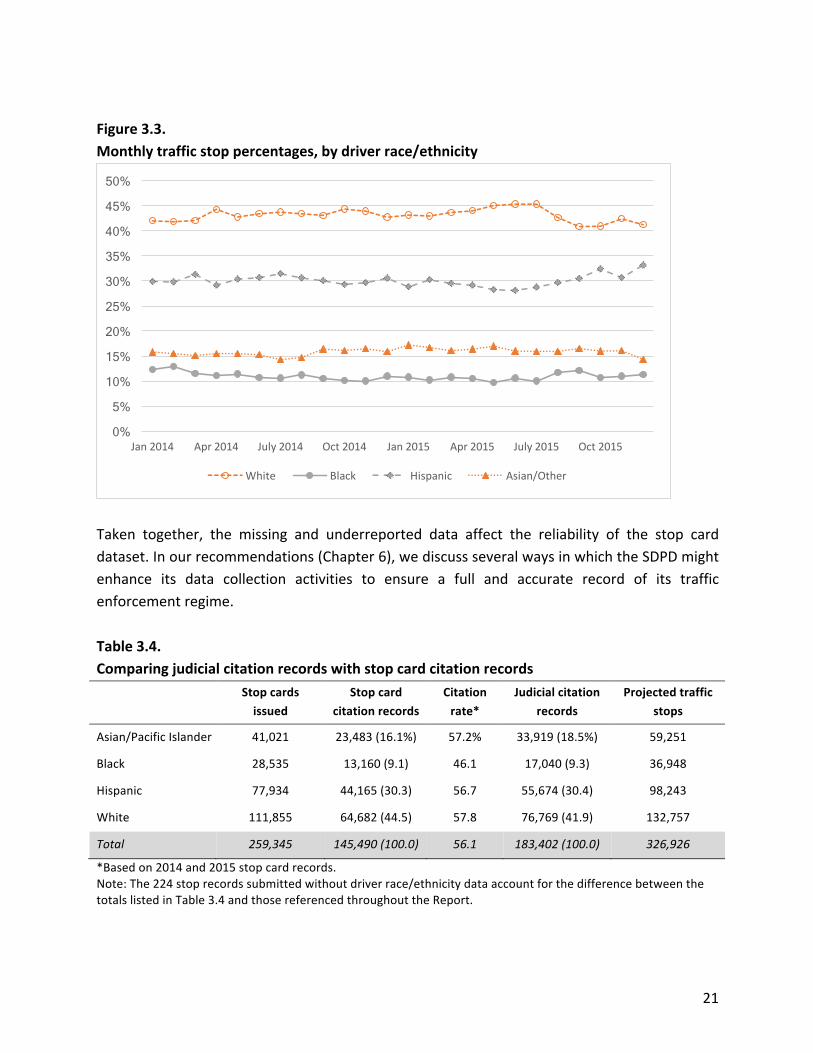
Figure3.3indicatesthatdespitechangesinthevolumeofstopcardsandintherateofmissingdata reported, the proportion of stops by race/ethnicity remained relatively stable. Thesefigures help to address some concerns that the decline in stops recorded, and the overallquality of the data produced, may have disproportionately affected one or more groups ofdrivers,orthatthedownwardtrendsindicateovertrace-drivendatamanipulation.In sum, the volume of stop cards submitted by SDPD officers has steadily declined betweenJanuary 2014 and December 2015. Over that same period, the number of incomplete cardsincreased,withadisproportionatenumber involving traffic stopsoccurring inhigher-minoritydivisionslocatedbelowInterstate8.WedonotknowwhetherthesetrendsreflectachangeinSDPDpolicyand/orleadership,anaturalseasonalshiftindrivingpatterns,orsomeotherfactor.Finally,wenotewhatappearstobesubstantialunder-reportingoftrafficstops.OnAugust9,2016,wereceivedcompletejudicialrecordsofcitationsissuedinSanDiegobetweenJanuary1,2014andDecember31,2015.These recordsaredrawn fromthephysical citations issuedby

20
SDPDofficersandarewhollydistinctfromthevehiclestopcardrecordsthatformthebasisofourbroaderanalysis.Andbecausetrafficcitationsaresubjectto judicialoversight,theyareamoreaccuratereflectionofofficeractivitythanarethestopcardrecords,whicharenotsubjecttoexternalverification.Figure3.2.Comparingmonthlytrafficstopvolume,byyear
According to thesedata, theSDPD issued183,402 citationsover this two-yearperiod, a sum26.1percentgreaterthanthe145,490citationsloggedbyofficersviathetrafficstopdatacard.As is shown in Table 3.4, we used stop card citation rates for each racial/ethnic group togenerate rough estimates of unreported traffic stops. All told, we estimate that the SDPDconducted somewhere between 60,000 and 70,000 traffic stops for which no stop cardinformationwassubmitted.36Wedonotethat theracial/ethniccompositionof thestopcardcitationrecords largelyreflects thecompositionof theactualcitations issued,whichsuggeststhattheunder-reportingwasnotrace-determinative. 36Thesecalculationsreflectatleastonemajorassumption.WeareforcedtoassumethattheSDPDunderreportedcitationstopsatthesamerateasnon-citationstops.Becausewedonothaverecordsofwarningsgiven,thereisnowaytoconfirmthisonewayoranother.Wealsohighlightthepossibilitythatthediscrepancybetweenstopcardrecordsofcitationsissuedandjudicialrecordsofcitationsissuedmayreflectmissingdata.Infact,27,478stopcardsissuedin2014and2015weremissinginformationabouttheissuanceofacitation.
0
5,000
10,000
15,000
20,000
25,000
Jan Feb Mar Apr May Jun Jul Aug Sep Oct Nov Dec
2000 2001 2014 2015
21
Figure3.3.Monthlytrafficstoppercentages,bydriverrace/ethnicity
Taken together, the missing and underreported data affect the reliability of the stop carddataset.Inourrecommendations(Chapter6),wediscussseveralwaysinwhichtheSDPDmightenhance its data collection activities to ensure a full and accurate record of its trafficenforcementregime.Table3.4.Comparingjudicialcitationrecordswithstopcardcitationrecords
Stopcardsissued
Stopcardcitationrecords
Citationrate*
Judicialcitationrecords
Projectedtrafficstops
Asian/PacificIslander 41,021 23,483(16.1%) 57.2% 33,919(18.5%) 59,251
Black 28,535 13,160(9.1) 46.1 17,040(9.3) 36,948
Hispanic 77,934 44,165(30.3) 56.7 55,674(30.4) 98,243
White 111,855 64,682(44.5) 57.8 76,769(41.9) 132,757
Total 259,345 145,490(100.0) 56.1 183,402(100.0) 326,926
*Basedon2014and2015stopcardrecords.Note:The224stoprecordssubmittedwithoutdriverrace/ethnicitydataaccountforthedifferencebetweenthetotalslistedinTable3.4andthosereferencedthroughouttheReport.
0%
5%
10%
15%
20%
25%
30%
35%
40%
45%
50%
Jan2014 Apr2014 July2014 Oct2014 Jan2015 Apr2015 July2015 Oct2015
White Black Hispanic Asian/Other

22
ContextualdatacollectionTosupplementourexaminationofthestopcarddata,wecollectedanarrayofadditionaldatatobetterunderstandwhattranspiresduringtrafficstopsaswellastoprovidecontextaroundthestateofpolice-communityrelationsinSanDiego.CommunityfocusgroupsWesoughttocaptureSanDiegoresidents’experienceswithandperceptionsofpolicing–andof traffic stops in particular – through community focus groups. Focus group interviews areuseful forextractingdetailed informationabout individuals' andgroups' feelings,perceptionsand experiences, and are typically more cost- and time-effective than conducting individualinterviews.Becausefocusgroupscanhelpfacilitateasafespacewhereparticipantscansharetheir ideaswithothersof similarbackgrounds, thegroupcontextcanbeespeciallyuseful forgleaning information from participants who otherwise might be reluctant to expressthemselvesopenlyaboutcertaintopics.The SDSU research team collaboratedwithHarder+Company, a local research companywithexpertise in facilitating such group discussions. We held focus groups in four SDPD policedivisions:Central,Mid-City,Southern,andSoutheastern.Weselectedthesedivisionsbecausethey have the highest levels of crime, police activity, and racial/ethnic diversity.Harder+Company assisted SDSU researchers in focus group recruitment, staffing, andtranscription.SDSUresearchersattendedandobservedfocusgroupsandundertookqualitativeanalysesoftheinterviewdata.Participants were recruited through announcements placed through a variety of channels,including: Craigslist, restaurants, community centers, barber shops, libraries, and other localbusinesses.Selectioncriteriaforfocusgroupparticipationincludedthatparticipantsmustbe:
• betweentheages18and55;• comfortablespeakingineitherEnglishorSpanish;and• a current resident of one of the communities served by the four identified SDPD
divisions.Additionally,during the screeningprocess,weoversampled foryoungadults (ages18 to30),Blacks, Hispanics, and people who self-reported as regular drivers. These oversamplingdecisions were made based on empirical literature that indicates that these are thedemographic groups most likely to be stopped while driving. Given that the focus groupparticipants were not randomly selected from the population of City (or division) residents,findings fromourdiscussionsarethereforenotnecessarily representativeofall residents’ (or
23
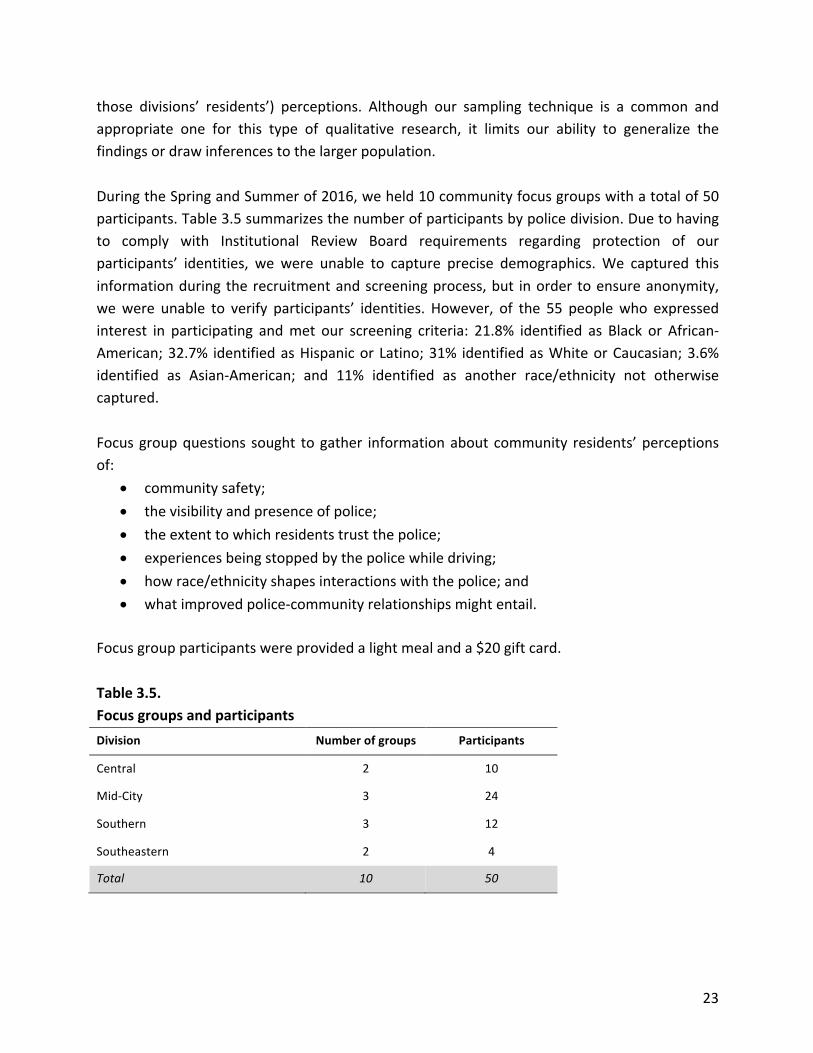
those divisions’ residents’) perceptions. Although our sampling technique is a common andappropriate one for this type of qualitative research, it limits our ability to generalize thefindingsordrawinferencestothelargerpopulation.DuringtheSpringandSummerof2016,weheld10communityfocusgroupswithatotalof50participants.Table3.5summarizesthenumberofparticipantsbypolicedivision.Duetohavingto comply with Institutional Review Board requirements regarding protection of ourparticipants’ identities, we were unable to capture precise demographics.We captured thisinformationduringtherecruitmentandscreeningprocess,but inorder toensureanonymity,wewere unable to verify participants’ identities. However, of the 55 peoplewho expressedinterest in participating andmet our screening criteria: 21.8% identified as Black or African-American;32.7% identifiedasHispanicorLatino;31% identifiedasWhiteorCaucasian;3.6%identified as Asian-American; and 11% identified as another race/ethnicity not otherwisecaptured.Focusgroupquestions sought togather informationaboutcommunity residents’perceptionsof:
• communitysafety;• thevisibilityandpresenceofpolice;• theextenttowhichresidentstrustthepolice;• experiencesbeingstoppedbythepolicewhiledriving;• howrace/ethnicityshapesinteractionswiththepolice;and• whatimprovedpolice-communityrelationshipsmightentail.
Focusgroupparticipantswereprovidedalightmealanda$20giftcard.Table3.5.FocusgroupsandparticipantsDivision Numberofgroups Participants
Central 2 10
Mid-City 3 24
Southern 3 12
Southeastern 2 4
Total 10 50

24
OfficersurveyFromMay to June 2016, the SDSU research team conducted a department-wide, electronicsurveyofall1,867activeSDPDofficers.Table3.6listsbasicdescriptiveinformationforthe365respondents(responserate=19.5percent).Officerswereaskedaboutseveralpertinentissues,including:
• theextenttowhichtheybelieveSanDiegoresidentstrustthepolice;• whether recentevents involving thepolicenationally (e.g., Ferguson,MO)havemade
theirjobsmoredifficult;• theprocessofcollectingtrafficstopdata;• howrace/ethnicityshapespoliceinteractionswiththepublic–bothgenerallyandinthe
contextoftrafficstops;and• howtheSDPDhandlestheissueofracial/ethnicbias,bothintrainingitsofficersandin
handlingincidentsofrace-basedmisconduct.
Table3.6Descriptivestatisticsforpoliceofficersurveyrespondents
Frequency Percent
Race/ethnicity Asian 11 3.0
Black 9 2.5
Hispanic 51 14.0
White 203 55.6
Other 47 12.9
Noresponse 44 12.1
Rank PoliceOfficer(patrol) 179 49.0
Sergeantorabove 141 38.6
Other 7 1.9
Noresponse 38 10.4
Experience(years) 1orfewer 4 1.1
Between2and5 47 12.9
Between6and10 62 17.0
Between11and20 97 26.6
21ormore 120 32.9
Noresponse 35 9.6
25
AfullcopyofthesurveyisfoundinAppendix3.OfficerinterviewsLastly, during June 2016, the SDSU research team also conducted in-depth, one-on-oneinterviewswith52SDPDofficersdrawnfromeachofSDPD’sninepatroldivisionsaswellasthecity-widetrafficdivision.Mostinterviewslastedbetween30and60minutesandwereintendedtodelvedeeperintothetopicscoveredbythedepartment-widesurvey.Wealsoaskedseveralofthesamequestionsofofficersaswedidofcommunityresidentsinfocusgroupstoidentifysimilaranddivergentperspectivesacrossthesegroups.Particularly,wesoughttoheardirectlyfromofficersabout:
• theirperceptionsofcommunitysafetyandtrustinthepolice;• proceduresfollowedduringtrafficstops,includinghowstopdataarecollected;• how race/ethnicity is and is not used in policing, includingwhat training they receive
aroundtheseissues;• difficultiesofficersencounterindoingtheirjobs;and• whatcanandshouldbedonetoimprovepolice-communityrelations.
Wedonotpresentthefull results fromeachofthesethreeadditionalsourcesofdata inthisReport. Rather, in Chapter 6,we drawon our findings from these data to contextualize andsupportourrecommendationstotheDepartment.

26
CHAPTER4:EXAMININGTHEDECISIONTOINITIATEATRAFFICSTOPIntroductionPoliceofficersintheUnitedStatesdotheirjobswithconsiderableindependence.Theytypicallyoperate outside the view of their supervisors and are often the only source of informationabout theirconduct.Thoughguidedby federal, state,and local law,aswellasorganizationalrulesandnorms,theyaloneareresponsiblefordeterminingwhichdriverstostop,howbesttomake an arrest, and when to call for backup, among countless other decisions. ThisdiscretionaryauthorityundergirdstheAmericancriminaljusticesystem;itfillsthegapscreatedby a societywith insufficient resources to support full enforcementof theexisting corpusofcriminalandadministrativelaw.The discretionary authority granted to police officers also forces citizens to accept a certaindegreeofinequality.Often,onedriverisstoppedwhileanothergoingatasimilarspeedisnotstopped.MostrollingstopsandillegalU-turnsaredoneoutsidetheviewofthepolice,andthusgoun-enforced.Thosewhoarestoppedandticketedforsuchinfractionsaretheexception,andthus may, rightly or wrongly, see their ticket as the product of selective enforcement orprejudice.Yetonlytheofficerknowsforsurewhyheorshedecidedtostoponecarasopposedtoanother.Itisnearlyimpossibletodeterminewhythesedecisionsaremadeinthewaythattheyare.For this reason, rather than focusing on individual stop decisions, we analyze the entirepopulationofindividualdecisionsinanefforttoidentifylargertrends.Itisthroughthisbroaderlensthatweattempttodeterminewhetherstoppatternsvarybyrace/ethnicityandwhethersuch variance is indicativeof systemic disparities in theway SDPDofficers enforce theCity’strafficlaws.InFebruary2015,SDPDPoliceChiefShelleyZimmermanpresentedtotheCityCouncil’sPublicSafety and Livable Neighborhoods Committee a report that addressed the SDPD’s trafficenforcementin2014.37Thesedatashoweddisparitiesbetweenactualdriverstopratesandthestop rates one would expect given the City’s racial/ethnic composition: Black and Hispanicdrivers were stopped more than their demographic profile would predict, while White andAsian/Pacific Islander drivers were stopped less. As is shown in Figure 4.1, these disparitiescarriedoverinto2015.
37CityofSanDiego,ReporttotheCityCouncil,PublicSafety&LivableNeighborhoodsCommittee.(2015,Feb.13).VehicleStopDataCards:JanuarythroughDecember,2014.ReportNo:15-016.RetrievedSept.5,2016,fromhttp://docs.sandiego.gov/councilcomm_agendas_attach/2015/psln_150225_3.pdf.

27
Figure4.1.Comparingdriverstopratesin2014and2015withSanDiego’sracial/ethniccomposition
Yet these differences provide very little if any insight into whether there are racial/ethnicdisparities inhowtraffic stopdecisionsaremadebySDPDofficers.Consider that in2014,65percentofdriversstoppedweremale,despitethefactthatmalescompriseonly51percentofthe City’s population, according to the 2010 U.S. Census.38 Perhaps this disparity is in factbecauseSDPDofficersaremoreproactiveintargetingmenthanwomen.Itmayalsoreflectthefactthatmorementhanwomendriveoncitystreets,thatmenaremorelikelytoviolatetrafficlaws,orthatmoremendriveinareasheavilypopulatedbylawenforcement,andarethusmorelikelytobeobservedviolatingthelaw.39Inotherwords,somedriversrunagreaterriskofbeingstoppedthanothers,forreasonshavingnothingtodowiththeirgender.Thesamelogicshoulddefineourthinkingaboutdriverrace.40
38Censusviewer:SanDiego,Californiapopulation:Census2010and2000interactivemap,demographics,statistics,quickfacts.RetrievedSept28,2016,fromhttp://censusviewer.com/city/CA/SanDiego.39SeeFridell,L.A.(2004).Bythenumbers:AguideforanalyzingracedatafromVehicleStops.Washington,D.C.:PoliceExecutiveResearchForum;Ridgeway,G.,(2009).CincinnatiPoliceDepartmenttrafficstops:ApplyingRAND’sframeworktoanalyzeracialdisparities.SantaMonica,CA:RANDCorporation.40Ridgeway,G.(2009).CincinnatiPoliceDepartmenttrafficstops:ApplyingRAND’sframeworktoanalyzeracialdisparities.SantaMonica,CA:RANDCorporation.
0%
5%
10%
15%
20%
25%
30%
35%
40%
45%
50%
Asian/other Black Hispanic White
2014 2015 Citywidepopulation

28
Asaresult,toproperlyassesstheeffectthatadriver’srace/ethnicityhasonthelikelihoodthatheorshewillbestopped,researchersmustdevelopabenchmarkthatenablesthecomparisonofactualstoprateswithadriver’sriskofbeingstoppedintheabsenceofbias.41Anappropriatebenchmark must incorporate the various legal and non-legal factors that shape stop risk,includingwhen,where,andhowoftentheydrive,themake,model,andconditionoftheircar,andtheirbehavioranddemeanorwhiledriving.42The most common approach to this challenge has been to draw on U.S. Census figures tocaptureajurisdiction’sdemographicprofileandthenusethesedatatomakeinferencesaboutthecity’sdrivingpopulation.43Thoughinexpensiveandrelativelyeasytoimplement,theuseofCensus data has come under heavy criticism for its inability to accurately reflect not only ajurisdiction’s driving population, but the various other risk factors at play.44 Other statisticalproxies, includingdrivers’ licensedata45andno-fault trafficaccidentfigures,46havealsobeenusedtoaddresstheselimitations.Other researchershavemadeefforts toobserve the characteristics of thedrivingpopulationfirsthand.Ratherthanrelyingonoutsideinformationasthebenchmark,somehaveattemptedto chart the demographic profile of a jurisdiction’s drivers at various locations and times ofday.47Theobservationalapproachisbothexpensiveandtime-consuming,andnotwithout itsownchallenges.48
41Tillyer,R.,Engel,R.S.,&Cherkauskas,J.C.(2010).Bestpracticesinvehiclestopdatacollectionandanalysis.Policing:AnInternationalJournalofPoliceStrategies&Management,33(1),69-92.42Fridell,L.A.(2004).Bythenumbers:AguideforanalyzingracedatafromVehicleStops.Washington,D.C.:PoliceExecutiveResearchForum;Ridgeway,G.&MacDonald,J.(2010).Methodsforassessingraciallybiasedpolicing.InS.K.Rice&M.D.White(Eds.)Race,ethnicity,andpolicing:Newandessentialreadings(pp.180-204).NewYork:NewYorkUniversityPress;Tillyer,R.,Engel,R.S.,&Cherkauskas,J.C.(2010).Bestpracticesinvehiclestopdatacollectionandanalysis.Policing:AnInternationalJournalofPoliceStrategies&Management,33(1),69-92;andWalker,S.(2001).Searchingforthedenominator:Problemswithpolicetrafficstopdataandanearlywarningsystemsolution.JusticeResearchandPolicy,3,63-95.43Cordner,G.,Williams,B.,&Zuniga,M.(2001).SanDiegoPoliceDepartmentvehiclestopstudy:Yearendreport.SanDiego,CA,p.ii;Cordner,G.,Williams,B.,&Velasco,A.(2002).SanDiegoPoliceDepartmentvehiclestopsinSanDiego:2001.SanDiego,CA.44Engel,R.S.,Frank,J.,Klahm,C.F.,&Tillyer,R.(2006,Jul.).ClevelandDivisionofPoliceTrafficStopDataStudy:FinalReport.Cincinnati,OH:UniversityofCincinnatiDivisionofCriminalJustice.45Fridell,L.A.(2004).Bythenumbers:AguideforanalyzingracedatafromVehicleStops.Washington,D.C.:PoliceExecutiveResearchForum.46Alpert,G.P.,Dunham,R.G.,&Smith,M.R.(2007).InvestigatingracialprofilingbytheMiami-Dadepolicedepartment:Amultimethodapproach.Criminology&PublicPolicy,6,25-56.47E.g.,Lamberth,J.C.(2013,Sept.).FinalReportfortheCityofKalamazooDepartmentofPublicSafety.WestChester,PA:LamberthConsulting.48Engel,R.S.,&Calnon,J.M.(2004).Comparingbenchmarkmethodologiesforpolice-citizencontacts:TrafficstopdatacollectionforthePennsylvaniaStatePolice.PoliceQuarterly,7,97-125.

29
Weaddress theproblemofwhether race/ethnicity impactspolicedecisions to initiate trafficstopsbyemployinga techniqueknownas the“veilofdarkness”method.49What follows isadescriptionofthismethodandadetailedanalysisofourfindings.TheVeilofDarknessTechnique
The veil of darkness technique allows theresearcher to compare the racial/ethnicdistributionoftrafficstopsmadeindaylightwith that of stops made after dark.50 Theapproach rests on the assumption that ifdriver race/ethnicity is a factor indeterminingwhowillbe stopped, itwillbemore apparent among stops made indaylight, when drivers’ physical profile ismore likely to be detectable, than at nightwhen thesecharacteristicsareobscuredbydarkness.51 We do not suggest thatrace/ethnicity is somehow impossible todiscern at night or a certainty during theday;rather,that“therateofpoliceknowingdriverrace/ethnicityinadvanceofthestopmustbesmalleratnightthanduringdaylight.”52 Thestrongestargumentforthisapproachcomesfromresearcherswhohavetriedtomeasuredriverrace/ethnicityatnight.Accordingtoa2003analysisoftrafficlawenforcementinSanta 49E.g.,Grogger,J.&Ridgeway,G.(2006).Testingforracialprofilingintrafficstopsfrombehindtheveilofdarkness.JournaloftheAmericanStatisticalAssociation,101(475),878-887.RetrievedAug.24,2016,fromhttps://www.rand.org/content/dam/rand/pubs/reprints/2007/RAND_RP1253.pdf;Ridgeway,G.,(2009).CincinnatiPoliceDepartmenttrafficstops:ApplyingRAND’sframeworktoanalyzeracialdisparities.SantaMonica,CA:RANDCorporation;Worden,R.E.,McLean,S.J.,&Wheeler,A.P.(2012).Testingforracialprofilingwiththeveil-of-darknessmethod.PoliceQuarterly,15,92-111.50Ridgeway,G.,(2009).CincinnatiPoliceDepartmenttrafficstops:ApplyingRAND’sframeworktoanalyzeracialdisparities.SantaMonica,CA:RANDCorporation.51Thisassumptionispotentiallycomplicatedbyseveralunknownfactors,includingthepresenceorabsenceofambientlight,glare,shadowing,heavilytintedwindows,andsoon,atthetimeofthestop.Interestingly,theonestudytocontrolforambientlightfoundevidenceofracialdisparitywhentheeffectsofstreetlightswereaccountedforandnoevidenceofracialdisparitywhennosuchcontrolswereincludedintheveilofdarknessanalysis.SeeHorrace,W.C.,&Rohlin,S.M(2016).HowdarkIsdark?Brightlights,bigcity:Racialprofiling,ReviewofEconomicsandStatistics,98,226-232.RetrievedOct.24,2016,fromhttps://pdfs.semanticscholar.org/84ff/4695f264da05e69cbc4e3e5dbd794bf9e298.pdf.52Ridgeway,G.,(2009).CincinnatiPoliceDepartmenttrafficstops:ApplyingRAND’sframeworktoanalyzeracialdisparities.SantaMonica,CA:RANDCorporation,p.12.
The “veil of darkness” technique allowsresearchers to avoid the difficulty ofidentifying and applying a benchmark – apoint of reference, such as Census data –against which to compare traffic stop data.This is the central challenge in the review ofsuchdata,asthedrivingpopulationofagivenarea may look quite different from theresidents of that area, as counted by theCensus. Instead, using the veil technique,analysts can examine the likelihood that, forexample,Blackdriverswillbe stoppedduringthe day versus at night, and compare thatlikelihoodwiththeday-versus-nightlikelihoodofWhitedriversbeingstopped.

30
Cruz,California,themostdifficultobservationalconditionsoccureitheratdawnordusk“orindarkareaswherenosupplemental lighting isprovided.”53Asaresult,studyauthorsreliedontheuseofsupplementallightingtoenhancedrivervisibilityduringtheseperiods.Thattheuseof supplemental lighting has become commonplace among observational researchersunderscoresthepoint.54Othersreporthavingtoeliminatenighttimeobservationsaltogether,finding“reliabledatacollectionontherace/ethnicityofthedriver…[tobe]impossible”atduskandaftersundown.55Table4.1.Previousresearchemployingtheveilofdarknessanalyticalapproach
Author(s)/Year Jurisdiction TimePeriodAnalyzedDay-night
DisparityFound?
Grogger&Ridgeway(2006) Oakland,CA Jun2003–Dec2003 No
Ridgeway(2009) Cincinnati,OH 2003-2008 No
Wordenetal.(2012) Syracuse,NY 2006-2009 No
Ritter(2013)56 Minneapolis,MN 2002 Yes
Horrace/ethnicity&Rohlin(2014) Syracuse,NY 2006-2009 Yes
Rossetal.(2016)57 StateofCT Oct2013–Sept2014 Yes
Taniguchietal.(2016)58 Durham,NC Jan2010–Oct2015 Yes
Thechallengeofaccuratelycategorizingadriver’srace/ethnicityatnightisalsoconsistentwithresearchon the validity of eyewitness testimony. To summarize years of research,witnesses
53Rickabaugh,C.A.(2003,Sept.).AstudytoanalyzetrafficstopdatainSantaCruzCounty.ChaddsFord,PA:LamberthConsulting,p.30.54E.g.,Lange,J.E.,Johnson,M.B.,&Voas,R.B.(2005).TestingtheracialprofilinghypothesisforseeminglydisparatetrafficstopsontheNewJerseyturnpike.JusticeQuarterly,22,193-223;Lamberth,J.C.(2013,Sept.).FinalReportfortheCityofKalamazooDepartmentofPublicSafety.WestChester,PA:LamberthConsulting.55Alpert,G.P.,Dunham,R.G.,&Smith,M.R.(2007).InvestigatingracialprofilingbytheMiami-Dadepolicedepartment:Amultimethodapproach.Criminology&PublicPolicy,6(1),25-56,p.36.56Ritter,J.A.(2013).Racialbiasintrafficstops:Testsofaunifiedmodelofstopsandsearches.UniversityofMinnesotaPopulationCenter,WorkingPaperNo.2013-05.RetrievedOct.24,2016,fromhttp://ageconsearch.umn.edu/bitstream/152496/2/WorkingPaper_RacialBias_June2013-1.pdf.57Ross,M.B.,Fazzalaro,J.,Barone,K.,&Kalinowski.(2016).StateofConnecticuttrafficstopdataanalysisandfindings,2014-15.ConnecticutRacialProfilingProhibitionProject.RetrievedOct.24,2016,fromhttp://www.ctrp3.org/reports/.58Taniguchi,T.,Hendrix,J.,Aagaard,B.,Strom,K.,Levin-Rector,A.,&Zimmer,S.(2016).ExploringracialdisproportionalityintrafficstopsconductedbytheDurhamPoliceDepartment.ResearchTrianglePark,NC:RTIInternational.RetrievedOct.24,2016,fromhttps://www.rti.org/sites/default/files/resources/VOD_Durham_FINAL.pdf.

31
aremuchbetteratdescribingbasicfeaturesofcriminalsuspects, includingrace/ethnicityandgender,whenobservedduringdaylighthoursratherthanatnight.59The veil of darkness approachwas first utilizedbyGrogger andRidgeway for their reviewoftraffic stops in Oakland, California.60 Since then, scholars have relied on this technique toexamine data from five other jurisdictions. With minor exceptions, each of the replicationslisted inTable4.1 followedGroggerandRidgeway’soriginalmethodandanalyticalapproach.Wefollowsuit.Tomeasurepossibleday-nightdisparities,wetakeadvantageofanaturalexperimentproducedby seasonal changes throughout the calendar year. In San Diego, the sun goes down earlierduringwintermonths than itdoes in thesummer.Someonedrivinghomefromworkat6:00pm in January would experience darkness, but in July the driver’s commute would occur inbroaddaylight.Theanalysisisconfinedtothe“inter-twilightperiod,”ortheperiodbetweentheearliestendofcivil twilight(5:09pmonNov.27)andthe latest(8:29pmonJun.27),asdefinedbytheU.S.NavalObservatory,inordertocontrolforchangesinthedrivingpopulationduringthecourseof theday.61Theveilofdarkness techniqueallows theanalyst toassessdifferencesbetweendaylightanddarkness stoppatternswithin thiswindowof time. Furthermore,because thesecomparisonsoccurwithinthesamesegmentofthedrivingpopulation(i.e.,driversontheroadbetween5:09and8:29pmduringdarknesswithdriversontheroadbetween5:09and8:29pmduringdaylight),thereisnoneedforanexternalbenchmark.Weexcludedfromtheanalysisthosestopsthatoccurredbetweensundown(alsoasdefinedbythe U.S. Naval Observatory) and the start of civil twilight (n=3,349), as there was no clearstrategyfordeterminingwhetherthesestopsoccurredin‘daylight’or‘darkness.’62Wefurtherlimit our sampleby includingonly those stops that occurred as a result of either equipment
59Loftus,G.R.(1985).Pictureperception:Effectsluminanceonavailableinformationandinformationextractionrate.JournalofExperimentalPsychology:General,114,342–356;Meissner,C.A.,Sporer,S.L.,&Schooler,J.W.(2007).Persondescriptionsofeyewitnessevidence.InR.C.L.Lindsay,D.F.Ross,J.D.Read,&M.P.Toglia(Eds.)Thehandbookofeyewitnesspsychology,Vol.II(pp.1–34).NewYork:PsychologyPress;Yarmey,A.D.(1986).Verbal,visual,andvoiceidentificationofarapesuspectunderdifferentlevelsofillumination.JournalofAppliedPsychology,71,363–370.60Grogger,J.&Ridgeway,G.(2006).Testingforracialprofilingintrafficstopsfrombehindtheveilofdarkness.JournaloftheAmericanStatisticalAssociation,101(475),878-887.RetrievedAug.24,2016,fromhttps://www.rand.org/content/dam/rand/pubs/reprints/2007/RAND_RP1253.pdf.61Thefullschedulecanbefoundhere:http://aa.usno.navy.mil/data/docs/RS_OneYear.php.62Worden,R.E.,McLean,S.J.,&Wheeler,A.P.(2012).Testingforracialprofilingwiththeveil-of-darknessmethod.PoliceQuarterly,15,92-111.

32
(e.g.,abrokentail light)ormovingviolations (e.g.,an illegal left turn).63As isshown inTable4.2, these types of stops, which are the product of a highly discretionary decision-makingprocess, comprise thevastmajorityof traffic stops inSanDiego.Stopsmadeasa resultofasuspectdescription,aninformant’stip,orpre-existingofficerknowledgeareexcluded,astheyinvolve a much lower level of discretionary authority and may lawfully include a driver’srace/ethnicityaspartofthejustificationforstop.Table4.2.DescribingdatageneratedbytrafficstopsconductedbySDPDofficersin2014and2015,bystoptype
Stoptype 2014 2015 Total
Highdiscretion
Movingviolation 103,491(71.9%) 86,387(74.9%) 189,878(73.2%)
Equipmentviolation 38,426(26.7) 27,453(23.8) 65,879(25.4)
Sub-total 141,917(98.6) 113,840(98.6) 255,757(98.6)
Lowdiscretion
Radiocall 763(0.5%) 497(0.4%) 1,260(0.5%)
Codeviolation 752(0.5) 366(0.3) 1,118(0.4)
Priorknowledgeofsuspect 277(0.2) 263(0.2) 540(0.2)
Suspectinformation 211(0.2) 161(0.1) 372(0.1)
Other 32(<0.1) 278(0.2) 310(0.1)
Sub-total 2,035(1.4) 1,565(1.4) 3,600(1.4)
Total 143,952(100) 115,405(100) 259,357(100)
Note:Totalsdonotincludestoprecordssubmittedwithoutdataonstoptype.Discrepanciesinthepercentagetotalsareowedtoroundingerror.
Figure4.2 isascatterplotof thedateandtimesofall stops included in the full sample.Notethatblackmarkersrepresentthosestopsthatoccurredaftertheendofciviltwilight,whichweclassify as occurring during darkness. Greymarkers represent daylight stops,which occurredpriortosunset. 63Wenotethatsomehavearguedthatbecausesomeequipmentviolations(abrokentaillight,forexample)areeasiertoidentifyafterdark,theyshouldbeexcludedfromaveilofdarknessanalysis(Worden,R.E.,McLean,S.J.,&Wheeler,A.P.(2012).Testingforracialprofilingwiththeveilofdarknessmethod.PoliceQuarterly,15,92-111.).Toaccountforthispossibility,wereplicatedboththecitywideandlocation-basedanalysisusingjustmovingviolations.Theresults,showninAppendix4,showednomeaningfullydifferencefromtheanalysisdescribedherein.

33
Ourstatisticalanalysisaggregatesandaveragesallstopsmadeduringtheinter-twilightperiodinanattempttoevaluateday-nightdisparitiesbetweenseveraldrivercategories,including:64
• Blackvs.Whitedrivers• YoungBlackvs.YoungWhite(25andunder)• Hispanicvs.White• YoungHispanicvs.YoungWhite(25andunder)• Asian/PacificIslanderv.White• YoungAsian/PacificIslandervs.YoungWhite(25andunder)
Figure4.2.Scatterplotoftrafficstopsincludedintheveilofdarknessanalysis
Wedistinguishdrivers25andunderinlightoftheconsistentevidencethatyoungerdriversare 64Astherelevantdependentvariableisdichotomous(whetherthestopoccurredduringdaylightorafterdark),werelyonlogisticregressionmodelstoperformtheanalysis.
End of twilight
Sunset
Jan 1 Summer solstice (Jun 21)
Standard time starts (Nov 2)
Standard time ends (Mar 9)
Dec 31
Cloc
k tim
e
5:00 pm
6:00 pm
7:00 pm
8:00 pm
9:00 pm
Figure 1. Date and Time of Intertwighlight Traffic Stops

34
oftenlesswillingtocomplytrafficlaws,65andtendtobemorerecklessdriversingeneral.66Theresearch is also very clear that young people are also more susceptible to criminologicalbehaviorthanareadultsfurtherintotheirlifecourse.67,68To account for potential changes to the driving population over time, our models includedichotomousvariables foreach15-minute interval in the3-hourand20-minute inter-twilightperiod.Thisallowsustocontrolforthelikelihoodthattheracial/ethniccompositionofdriversvariesbytimeofday.The driving populationmay also change based on the day of the week (for example, thosepeople on the road at 7:30 pm on Friday evening may look and act differently than thosedrivingat7:30onaTuesday),sowealsoincludedichotomousvariablesforthedayoftheweek.Theseadjustmentsallowustoholdthedayoftheweekconstant,furtherisolatingtheeffectofdaylight.Similarly,toaccountforseasonaldifferencesinthedrivingpopulation,wecontrolfortheeffectsofstopmonthandstoplocation.
65Yagil,D.(1998).Genderandage-relateddifferencesinattitudestowardtrafficlawsandtrafficviolations.TransportationResearchPartF:TrafficPsychologyandBehaviour,1,123-135;McCartt,A.T.,&Northrup,V.S.(2004).Factorsrelatedtoseatbeltuseamongfatallyinjuredteenagedrivers.JournalofSafetyResearch,35,29-38.66Lawton,R.,Parker,D.,Stradling,S.G.,&Manstead,A.S.R.(1997).Self-reportedattitudetowardsspeedinganditspossibleconsequencesinfivedifferentroadcontexts.JournalofCommunityandAppliedSocialPsychology,7,153-165;Lawton,R.,Parker,D.Manstead,S.G.,&Stradling,A.S.R.(1997).Theroleofaffectinpredictingsocialbehaviors:Thecaseofroadtrafficviolations.JournalofAppliedSocialPsychology,27,1258-1276.67Farrington,D.P.(1986).Ageandcrime.CrimeandJustice,7,189-250;Jennings,W.G.,&Reingle,J.M.(2012).Onthenumberandshapeofdevelopmental/life-courseviolence,aggression,anddelinquencytrajectories:Astate-of-the-artreview.JournalofCriminalJustice,40,472-489;Sampson,R.J.,&Laub,J.H.(1993).CrimeintheMaking.Cambridge:HarvardUniversityPress.68Thereisalsoawell-establishedbodyofresearchshowingthatmalesaremorelikelytoengageinbothreckless(see,forexample,Keane,C.,Maxim,P.S.,&Teevan,J.J.[1993].Drinkinganddriving,self-control,andgender:Testingageneraltheoryofcrime.JournalofResearchinCrimeandDelinquency,30,30-46)andcriminalbehavior(Synder,H.N.[2012].ArrestintheUnitedStates,1990-2010.U.S.DepartmentofJustice,OfficeofJusticePrograms,BureauofJusticeStatistics.RetrievedSept.29,2016,fromhttp://www.bjs.gov/content/pub/pdf/aus9010.pdf).ToaccountforthepossibilitythatSDPDofficersmayasaresultpolicemalesdifferentlythantheydofemales,weanalyzedday-nightdisparitiesusingasampleofmaleonlydrivers.Theresults,whichshowednomeaningfuldifferencefromthemixedgenderanalysis,arelistedinAppendix5.
35
ResultsBeforepresentingtheresultsofourtrafficstop analysis, itmay be helpful to reviewthemetricsusedtointerpretthedata.Thefindingswillbepresentedintermsofoddsratios, which indicate the odds (orlikelihood)ofdaylightaffectingtrafficstoppatterns. An odds ratio of 1.0 indicatesthat time of day does not influence theodds of Black drivers being stopped; inthat case, they are no more and no lesslikely to be stopped after dark than theyareduringdaylight,comparedtothestoppattern ofWhite drivers. A positive oddsratio(>1.0)suggeststhatBlackdriversaremore likely to be stopped during the daythan at night, and thus may indicateracial/ethnic disparity. A negative oddsratio(<1.0)indicatesthatBlackdriversaremore likely to be stopped at night thanduring theday (or, put anotherway, thatWhite drivers are more likely to bestoppedindaylightthanafterdark).BlackDriversTable4.3displaystheresultsofouranalysisofdiscretionarytrafficstopsconductedintheCityof San Diego between January 1, 2014 and December 31, 2015 involving Black and Whitedrivers.Thedatashowthatin2014,whendriverrace/ethnicitywasvisible,Blackdriverswerenearly20percentmorelikelytobethesubjectofadiscretionarytrafficstopthanwereWhitedrivers.Whenconfined todriversaged25andunder, youngBlackdrivers in2014were43.8percentmorelikelytobestoppedindaylightthanafterdark,comparedtoyoungWhites.Thesefindingsarestatisticallysignificantatthe0.01levelandthusindicateracial/ethnicdisparity inthedistributionoftrafficstops.
A p-value is commonly used measure ofstatistical significance. The smaller the p-value,themoreconfidencewehavethattheresults would not occur under the nullhypothesis (e.g., that no relationship existsbetween an officer’s decision to stop aparticulardriverandthatdriver’srace).Forexample,ap-valueof0.01meansthatweare99%confident thatour result isnotduetochance.Followingcommonpracticeinthesocialsciences,wereportp-valuesof.05andlower, which correspond to a level ofconfidence of 95% or higher, as statisticallysignificant:p-valueLevelofconfidence 0.001 99.9%
0.01 99% 0.05 95%

36
Table4.3.ModelingtheeffectsofdaylightontheoddsthatBlackdriverswillbestoppedcitywideforeitheramovingviolationoranequipmentviolation
OddsRatio
p-valueStandarderror
95%ConfidenceInterval
NumberofStops
2014
Blackv.White 1.196 0.005 0.077 1.055,1.356 8,332
YoungBlackv.YoungWhite 1.438 0.003 0.177 1.129,1.832 2,189
2015
Blackv.White 0.800 0.118 0.114 0.605,1.058 6,216
YoungBlackv.YoungWhite 0.783 0.068 0.105 0.602,1.018 1,631
Combined
Blackv.White 1.052 0.293 0.051 0.957,1.156 14,548
YoungBlackv.YoungWhite 1.098 0.309 0.101 0.917,1.316 3,820
Thesesamedisparitieswerenotpresentinthe2015data.Whenthe2015sampleislimitedtostops involving drivers aged 25 and younger, there is evidence, albeit of relatively weakstatistical power, that Black driverswere less likely to be stopped during the day than afterdark.Whenthe2014and2015dataarecombined,wefindnomeaningfulstatisticaldistinctionbetweenBlacksandWhites.
To further control for potential seasonal differences among the driving population, we alsoconductananalysis limitedto inter-twilightstopsoccurring30daysbeforeandafterDaylightSaving Time (DST) clock changes, which in 2014 occurred at 2:00 am on March 9th andNovember2nd.In2015,CaliforniamovedclocksaheadonMarch8andbackonNovember1.Figure4.3isascatterplotofthosedataincludedinthe2014DST-onlyanalysis,reflectingtrafficstopsoccurringduring60-dayperiodsintheSpring(Feb.7th–Apr.9th)andtheFall(Oct.3rd–Dec.2nd).The2015DSTperiod includes stops recordedbetweenFebruary6thandApril8thandbetweenOctober2ndandDecember1st.

37
Figure4.3.ScatterplotoftrafficstopsincludedintheDaylightSavingTimeveilofdarknessanalysis
Delimitingtheanalysisisawaytoevaluatetherobustnessofthefindingsdiscussedaboveandtoprovidemorethoroughprotectionagainstthe influenceofseasonalchangestothedrivingpopulation.Theprimary trade-offof thismoreconservativeapproach is the lossof statisticalpower.AsRidgewaynotes, the smaller sample sizes requiredare still largeenough to reflectsignificantday-nightdisparities,butsmallerdifferencesmaynotbeasreadilyapparent.69AsisshowninTable4.4,ourestimatesshiftsomewhatunderthesemorerestrictiveconditions,withchangesmostapparentinthe2014data.WhentheanalysisisconfinedtostopsoccurringduringtheDST-onlyperiod,disparitiesbetweenBlackandWhitedriversarenolongerevident.Results generated by analysis of the 2015 and combined datasets remain substantivelyunchanged:nostatisticaldifferenceexistsinthelikelihoodthatBlackdriversaremorelikelyto 69Ridgeway,G.,(2009).CincinnatiPoliceDepartmenttrafficstops:ApplyingRAND’sframeworktoanalyzeracialdisparities.SantaMonica,CA:RANDCorporation.
Jan 1 Summer solstice (Jun 21)
Standard time starts (Nov 2)
Standard time ends (Mar 9)
Dec 31
Cloc
k tim
e
5:00 pm
6:00 pm
7:00 pm
8:00 pm
9:00 pm
Figure 2. DST Traffic Stops
End of twilight
Sunset

38
bestoppedbypoliceduringdaylighthoursthantheywereafterdarkwhencomparedtoWhitedrivers.Table4.4.ModelingtheeffectsofdaylightontheoddsthatBlackdriverswillbestoppedcitywideforeitheramovingviolationoranequipmentviolationduringtheDSTperiod
Oddsratio
p-valueStandarderror
95%confidenceinterval
Numberofstops
2014
Blackv.White 1.109 0.480 0.163 0.831,1.479 2,564
YoungBlackv.YoungWhite 1.175 0.573 0.336 0.670,2.059 671
2015
Blackv.White 1.184 0.337 0.208 0.839,1.671 1,994
YoungBlackv.YoungWhite 0.720 0.343 0.249 0.365,1.419 547
Combined
Blackv.White 1.143 0.233 0.128 0.918,1.423 4,558
YoungBlackv.YoungWhite 0.951 0.816 0.206 0.621,1.455 1,218
Thoughwe include controls for stop location in the citywidemodels, for several reasonswebelieve there is value in taking a closer look at division-level differences in the treatment ofBlackandWhitedrivers.First,asshowninFigure4.4,thereappearstobealooserelationshipbetween division-level stop rates and the localized crime rates (Pearson’s r = 0.5134). Thisrelationship suggests that patrol strategies in higher-crime areas, like the Central division,whichishometoboththecity’shighestcrimerateandhigheststoprate,willbesubstantiallydifferentthanintheNortherndivision,wherebothcrimeandstopratesareclosertocitywideaverages. In addition to other factors such as staffing levels and the availability of otherresources, thesedatahighlight theuniquedivision-levelcircumstances thatmayshapepatroldecisions, andwhich in turnmay contribute to division-level differences in the racial/ethnicdistribution of stops. Finally, as we discussed in Chapter 2, crime and poverty tend toconcentrate in neighborhoods with comparatively high levels of minority residents. In SanDiego,mostofthoseneighborhoodsarefoundinthepolicedivisionslocatedbelowInterstate8.

39
Figure4.4.Examiningtherelationshipbetweenvehiclestopratesandcrime,bySDPDpolicedivision
Source:CityofSanDiegoandSDPDNote:Bothvehiclestoprateandcrimeratelistedper1,000divisionresidentsover2014and2015.Table 4.5 lists the volume of recorded stops by patrol division, as well as each division’spopulation and squaremileage. The Northern division was the city’s busiest, accounting for37,203stops,or14.7percentof those recordedbetween January1,2014andDecember31,2015.TheEastern,Northeastern,andWesterndivisionswerethenext-busiestintermsofstopvolume,followedbytheCentral,Southern,andMid-Citydivisions.OfficersintheNorthwesterndivision tallied the fewest stops, accounting for just 6.4 percent of the citywide total. Stopsinitiated in divisions located above Interstate 8 accounted for 58.1 percent of all recordedstops,whilethoserecordedbelowI-8represented41.9percentofthetotal.
0
5
10
15
20
25
30
35
40
45
50
0
20
40
60
80
100
120
140
160
Totalcrim
erate
Stop
rate
Stoprate Totalcrimerate

40
Table4.5.SDPDvehiclestops,bypatroldivision,2014and2015combined Population Squaremileage Stops
AboveInterstate8
Northern 225,234(16.4%) 41.3(12.5%) 37,203(14.7%)
Northeastern 234,394(17.0) 103.8(31.5) 31,692(12.5)
Eastern 155,892(11.3) 47.1(14.3) 31,788(12.6)
Western 129,709(9.4) 22.7(6.9) 30,078(11.9)
Northwestern 70,822(5.1) 41.6(12.6) 16,306(6.4)
Sub-total 816,051(59.3) 256.5(77.8) 147,067(58.1)
BelowInterstate8
Southeastern 175,757(12.8) 19.1(5.8) 19,292(7.6)
Central 103,524(7.5) 9.7(2.9) 29,692(11.7)
Southern 107,631(7.8) 31.5(9.6) 29,351(11.6)
Mid-City 173,012(12.6) 12.8(3.9) 27,692(10.9)
Sub-total 559,924(40.7) 73.1(22.2) 106,027(41.9)
Total 1,375,975(100.0) 329.6(100.0) 253,094(100.0)
Source:CityofSanDiego.Note:Stoptotalsdonotincludethe6,475stoprecordssubmittedwithoutstoplocationinformation.Table4.6 lists theresultsofourcomparisonofstopratesamongBlackandWhitedrivers,bystoplocation,acrossthecombineddatasetof2014and2015(forseparateanalysisof2014and2015 data, see Appendix 6). There is some evidence to support the notion that drivers aretreated differently in certain neighborhoods. In the Northeastern division, strong statisticalevidenceindicatesthatdisparitywaspresent:Blackdriverswere60.2percentmorelikelytobestopped in daylight than after dark, compared to White drivers. We find no meaningfuldifferenceinthetreatmentofdriversbyrace/ethnicityintheEastern,Western,Northern,andNorthwestern divisions. Analysis of the aggregated data from these five divisions shows nostatistically significant difference in the daylight-darkness stop patterns of Black and Whitedrivers.
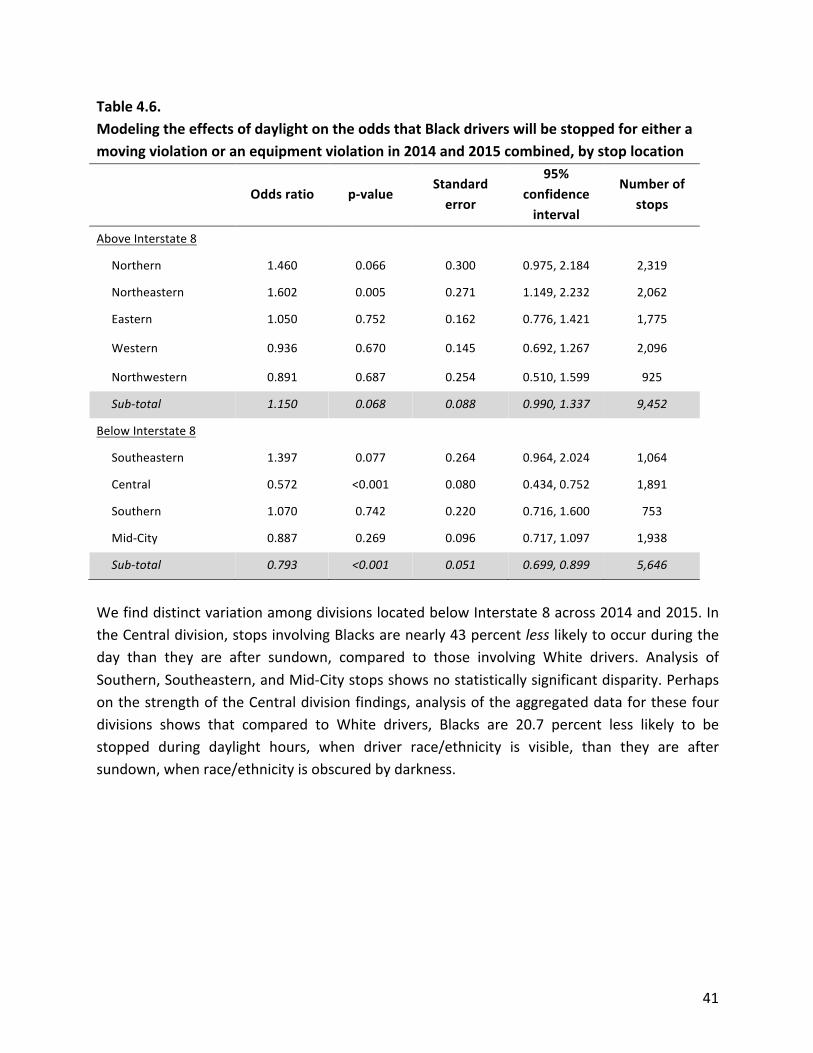
41
Table4.6.ModelingtheeffectsofdaylightontheoddsthatBlackdriverswillbestoppedforeitheramovingviolationoranequipmentviolationin2014and2015combined,bystoplocation
Oddsratio p-valueStandarderror
95%confidenceinterval
Numberofstops
AboveInterstate8
Northern 1.460 0.066 0.300 0.975,2.184 2,319
Northeastern 1.602 0.005 0.271 1.149,2.232 2,062
Eastern 1.050 0.752 0.162 0.776,1.421 1,775
Western 0.936 0.670 0.145 0.692,1.267 2,096
Northwestern 0.891 0.687 0.254 0.510,1.599 925
Sub-total 1.150 0.068 0.088 0.990,1.337 9,452
BelowInterstate8
Southeastern 1.397 0.077 0.264 0.964,2.024 1,064
Central 0.572 <0.001 0.080 0.434,0.752 1,891
Southern 1.070 0.742 0.220 0.716,1.600 753
Mid-City 0.887 0.269 0.096 0.717,1.097 1,938
Sub-total 0.793 <0.001 0.051 0.699,0.899 5,646
WefinddistinctvariationamongdivisionslocatedbelowInterstate8across2014and2015.IntheCentraldivision,stopsinvolvingBlacksarenearly43percentlesslikelytooccurduringtheday than they are after sundown, compared to those involving White drivers. Analysis ofSouthern,Southeastern,andMid-Citystopsshowsnostatisticallysignificantdisparity.PerhapsonthestrengthoftheCentraldivisionfindings,analysisoftheaggregateddataforthesefourdivisions shows that compared to White drivers, Blacks are 20.7 percent less likely to bestopped during daylight hours, when driver race/ethnicity is visible, than they are aftersundown,whenrace/ethnicityisobscuredbydarkness.

42
Table4.7.ModelingtheeffectsofdaylightontheoddsthatHispanicdriverswillbestoppedcitywideforeitheramovingviolationoranequipmentviolation
Oddsratio
p-valueStandarderror
95%confidenceinterval
Numberofstops
2014
Hispanicv.White 0.973 0.561 0.046 0.887,1.067 11,952
YoungHispanicv.YoungWhite 1.052 0.608 0.103 0.868,1.275 2,775
2015
Hispanicv.White 0.935 0.223 0.052 0.839,1.042 9,055
YoungHispanicv.YoungWhite 0.843 0.123 0.093 0.679,1.047 2,392
Combined
Hispanicv.White 0.949 0.141 0.034 0.885,1.018 21,007
YoungHispanicv.YoungWhite 0.939 0.392 0.069 0.814,1.084 5,167
Table4.8.ModelingtheeffectsofdaylightontheoddsthatHispanicdriverswillbestoppedcitywideforeitheramovingviolationoranequipmentviolationduringtheDSTperiod
Oddsratio
p-valueStandarderror
95%confidenceinterval
Numberofstops
2014
Hispanicv.White 1.044 0.686 0.111 0.847,1.288 3,669
YoungHispanicv.YoungWhite 1.098 0.685 0.254 0.698,1.728 854
2015
Hispanicv.White 1.295 0.035 0.158 1.019,1.644 2,950
YoungHispanicv.YoungWhite 0.834 0.461 0.206 0.514,1.353 803
Combined
Hispanicv.White 1.145 0.090 0.092 0.979,1.340 6,619
YoungHispanicv.YoungWhite 0.950 0.756 0.158 0.685,1.316 1,657

43
HispanicdriversTables4.7,4.8,and4.9listresultsofouranalysisoftrafficstopsinvolvingHispanicdrivers.PerTable4.7,whenaggregatedatthecitylevel,theoddsofastopinvolvingaHispanicdriverisnotaffectedbythechangefromdaylighttodarkness,regardlessofwhenthestopoccurredorthecomparisongroupused,asindicatedbyoddsratiosthatalignsocloselyto1.0.Table4.8displaystheresults fromseveralmodelsexaminingday/nightstopratesofHispanicdriversstoppedforeitheranequipmentviolationoramovingviolationduringthe120-dayDSTperiod.Underthesemorerestrictiveanalyticalconditions,the2014datarevealnodisparityinthetreatmentofHispanicandWhitedrivers.In2015,however,Hispanicdriversofallageswere29.5percentmorelikelytobestoppedduringdaylighthoursthanafterdark,whencomparedtoWhites.Thisresultwasstatisticallysignificantatthe0.05level.Whentheanalyticalsampleislimitedtothosedriversages25andyounger,wefindnoindicationofdisparity.
Table4.9.ModelingtheeffectsofdaylightontheoddsthatHispanicdriverswillbestoppedforeitheramovingviolationoranequipmentviolationin2014and2015combined,bystoplocation
Oddsratio p-valueStandarderror
95%confidenceinterval
Numberofstops
AboveInterstate8
Northern 1.043 0.751 0.138 0.805,1.350 2,596
Northeastern 1.337 0.020 0.167 1.047,1.707 2,298
Eastern 0.956 0.715 0.117 0.753,1.215 2,025
Western 0.953 0.656 0.102 0.773,1.176 2,490
Northwestern 1.145 0.462 0.210 0.799,1.640 1,063
Sub-total 1.062 0.268 0.058 0.955,1.181 10,893
BelowInterstate8
Southeastern 1.084 0.662 0.200 0.755,1.558 1,351
Central 0.544 <0.001 0.054 0.447,0.663 2,582
Southern 0.964 0.726 0.101 0.785,1.184 4,547
Mid-City 0.812 0.030 0.079 0.673,0.980 2,476
Sub-total 0.716 <0.001 0.036 0.649,0.790 10,956
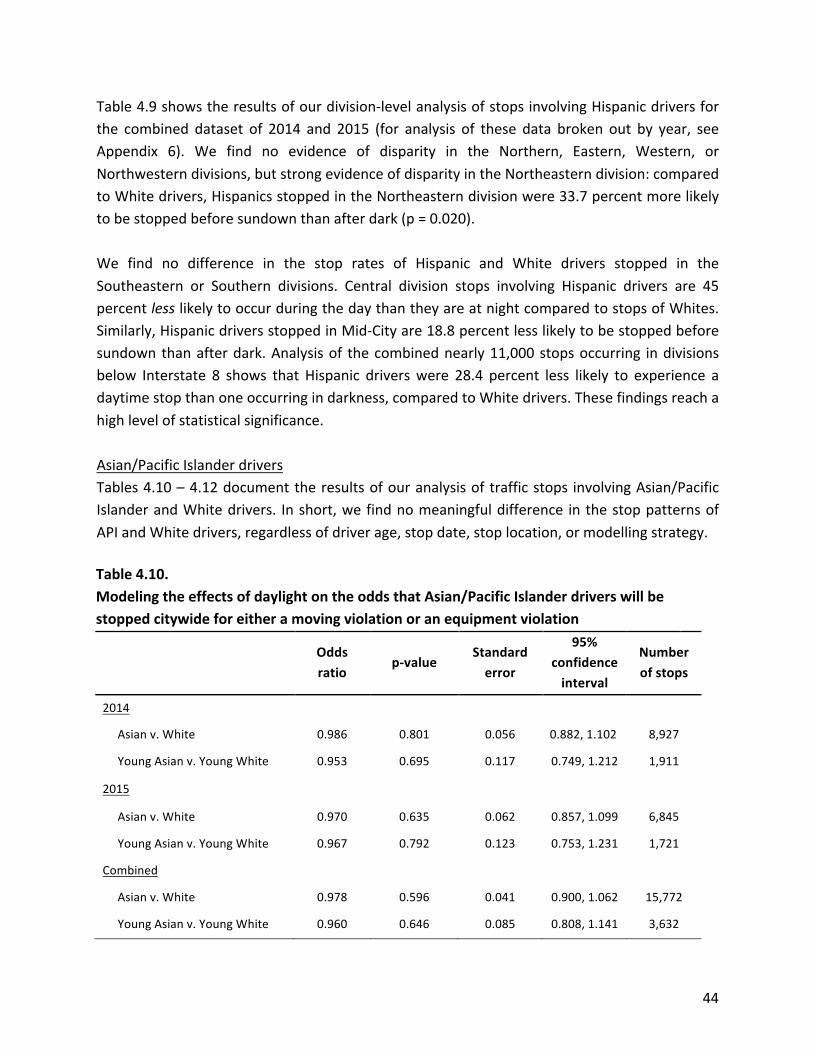
44
Table4.9showstheresultsofourdivision-levelanalysisofstopsinvolvingHispanicdriversforthe combined dataset of 2014 and 2015 (for analysis of these data broken out by year, seeAppendix 6). We find no evidence of disparity in the Northern, Eastern, Western, orNorthwesterndivisions,butstrongevidenceofdisparityintheNortheasterndivision:comparedtoWhitedrivers,HispanicsstoppedintheNortheasterndivisionwere33.7percentmorelikelytobestoppedbeforesundownthanafterdark(p=0.020).We find no difference in the stop rates of Hispanic and White drivers stopped in theSoutheastern or Southern divisions. Central division stops involving Hispanic drivers are 45percentlesslikelytooccurduringthedaythantheyareatnightcomparedtostopsofWhites.Similarly,HispanicdriversstoppedinMid-Cityare18.8percentlesslikelytobestoppedbeforesundownthanafterdark.Analysisof thecombinednearly11,000stopsoccurring indivisionsbelow Interstate 8 shows that Hispanic driverswere 28.4 percent less likely to experience adaytimestopthanoneoccurringindarkness,comparedtoWhitedrivers.Thesefindingsreachahighlevelofstatisticalsignificance.Asian/PacificIslanderdriversTables4.10–4.12documenttheresultsofouranalysisoftrafficstops involvingAsian/PacificIslanderandWhitedrivers. Inshort,wefindnomeaningfuldifference inthestoppatternsofAPIandWhitedrivers,regardlessofdriverage,stopdate,stoplocation,ormodellingstrategy.Table4.10.ModelingtheeffectsofdaylightontheoddsthatAsian/PacificIslanderdriverswillbestoppedcitywideforeitheramovingviolationoranequipmentviolation
Oddsratio
p-valueStandarderror
95%confidenceinterval
Numberofstops
2014
Asianv.White 0.986 0.801 0.056 0.882,1.102 8,927
YoungAsianv.YoungWhite 0.953 0.695 0.117 0.749,1.212 1,911
2015
Asianv.White 0.970 0.635 0.062 0.857,1.099 6,845
YoungAsianv.YoungWhite 0.967 0.792 0.123 0.753,1.231 1,721
Combined
Asianv.White 0.978 0.596 0.041 0.900,1.062 15,772
YoungAsianv.YoungWhite 0.960 0.646 0.085 0.808,1.141 3,632

45
Table4.11.ModelingtheeffectsofdaylightontheoddsthatAsian/PacificIslanderdriverswillbestoppedcitywideforeitheramovingoranequipmentviolationduringtheDSTperiod
Oddsratio
p-valueStandarderror
95%confidenceinterval
Numberofstops
2014
Asianv.White 1.090 0.520 0.146 0.838,1.417 2,758
YoungAsianv.YoungWhite 1.307 0.340 0.367 0.754,2.266 614
2015
Asianv.White 1.244 0.138 0.183 0.932,1.660 2,200
YoungAsianv.YoungWhite 1.413 0.222 0.400 0.812,2.460 582
Combined
Asianv.White 1.161 0.130 0.114 0.957,1.408 4,958
YoungAsianv.YoungWhite 1.322 0.153 0.259 0.901,1.941 1,196
Table4.12.ModelingtheeffectsofdaylightontheoddsthatAsian/PacificIslanderdriverswillbestoppedforeitheramovingviolationoranequipmentviolation,bystoplocation
Oddsratio p-valueStandarderror
95%confidenceinterval
Numberofstops
AboveInterstate8
Northern 0.927 0.570 0.124 0.713,1.205 2,585
Northeastern 1.117 0.196 0.056 0.944,1.321 3,231
Eastern 1.237 0.085 0.153 0.971,1.575 2,016
Western 0.872 0.315 0.119 0.666,1.139 2,196
Northwestern 0.852 0.256 0.120 0.646,1.123 1,310
Sub-total 0.945 0.259 0.047 0.858,1.042 11,603
BelowInterstate8
Southeastern 1.357 0.179 0.308 0.869,2.118 473
Central 1.022 0.874 0.143 0.777,1.345 1,960
Southern 1.370 0.132 0.286 0.910,2.063 767
Mid-City 1.064 0.647 0.144 0.816,1.387 1,499
Sub-total 1.010 0.895 0.078 0.868,1.176 4,699
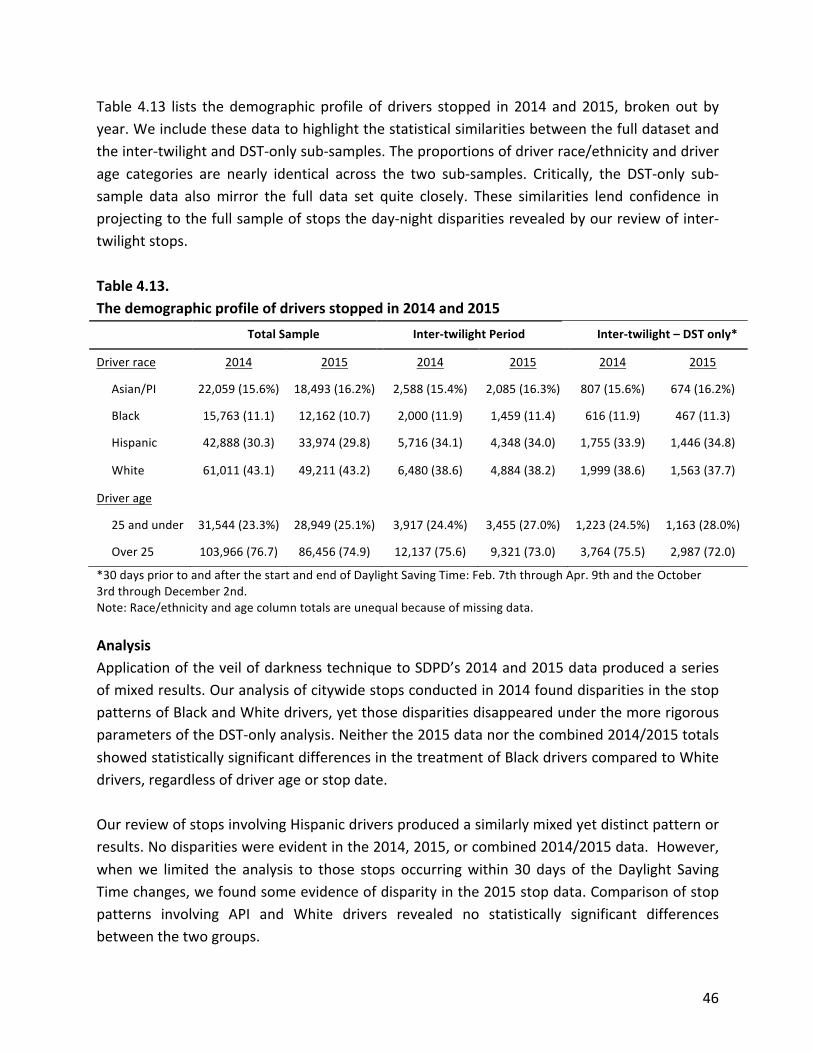
46
Table 4.13 lists thedemographic profile of drivers stopped in 2014and2015, brokenoutbyyear.Weincludethesedatatohighlightthestatisticalsimilaritiesbetweenthefulldatasetandtheinter-twilightandDST-onlysub-samples.Theproportionsofdriverrace/ethnicityanddriverage categories are nearly identical across the two sub-samples. Critically, the DST-only sub-sample data alsomirror the full data set quite closely. These similarities lend confidence inprojectingtothefullsampleofstopstheday-nightdisparitiesrevealedbyourreviewofinter-twilightstops.Table4.13.Thedemographicprofileofdriversstoppedin2014and2015
TotalSample Inter-twilightPeriod Inter-twilight–DSTonly*
Driverrace 2014 2015 2014 2015 2014 2015
Asian/PI 22,059(15.6%) 18,493(16.2%) 2,588(15.4%) 2,085(16.3%) 807(15.6%) 674(16.2%)
Black 15,763(11.1) 12,162(10.7) 2,000(11.9) 1,459(11.4) 616(11.9) 467(11.3)
Hispanic 42,888(30.3) 33,974(29.8) 5,716(34.1) 4,348(34.0) 1,755(33.9) 1,446(34.8)
White 61,011(43.1) 49,211(43.2) 6,480(38.6) 4,884(38.2) 1,999(38.6) 1,563(37.7)
Driverage
25andunder 31,544(23.3%) 28,949(25.1%) 3,917(24.4%) 3,455(27.0%) 1,223(24.5%) 1,163(28.0%)
Over25 103,966(76.7) 86,456(74.9) 12,137(75.6) 9,321(73.0) 3,764(75.5) 2,987(72.0)
*30dayspriortoandafterthestartandendofDaylightSavingTime:Feb.7ththroughApr.9thandtheOctober3rdthroughDecember2nd.Note:Race/ethnicityandagecolumntotalsareunequalbecauseofmissingdata.AnalysisApplicationoftheveilofdarknesstechniquetoSDPD’s2014and2015dataproducedaseriesofmixedresults.Ouranalysisofcitywidestopsconductedin2014founddisparitiesinthestoppatternsofBlackandWhitedrivers,yetthosedisparitiesdisappearedunderthemorerigorousparametersoftheDST-onlyanalysis.Neitherthe2015datanorthecombined2014/2015totalsshowedstatisticallysignificantdifferencesinthetreatmentofBlackdriverscomparedtoWhitedrivers,regardlessofdriverageorstopdate.OurreviewofstopsinvolvingHispanicdriversproducedasimilarlymixedyetdistinctpatternorresults.Nodisparitieswereevidentinthe2014,2015,orcombined2014/2015data.However,whenwe limited the analysis to those stops occurringwithin 30 days of theDaylight SavingTimechanges,wefoundsomeevidenceofdisparityinthe2015stopdata.Comparisonofstoppatterns involving API and White drivers revealed no statistically significant differencesbetweenthetwogroups.
47
Inadditiontoourcitywideanalysis,wealsoexamineddivision-levelstoppatterns.Ourreviewof aggregate data from the five divisions located above Interstate 8 revealed no statisticallysignificant disparities in the daylight-darkness stop patterns of Black and White drivers orHispanicsandWhites.Narrowingthefocustothedivisionlevelrevealedstrongandconsistentdisparities in the day-night stop rates among Black and Hispanic drivers stopped in theNortheasterndivision,ascomparedtoWhites.NosuchdisparitieswereevidentamongstopsoccurringintheNorthern,Eastern,Western,orNorthwesterndivisions.DataonstopsconductedbelowInterstate8revealadifferentsetofresults.Wefindsubstantialevidencetosuggest that in theaggregate,bothBlackandHispanicdriverswere less likelybestoppedduringdaylighthours than theywereafterdark, compared to stops involvingWhitedrivers.Inotherwords,whenthepolicewereabletoseeadriver’srace,theyweremorelikelyto stopaWhitedriver than theywereaBlackorHispanicdriver.At thedivision level, theseresults were evident in stops occurring in the Central division and among Hispanic (but notBlack)driversstoppedintheMid-Citydivision.
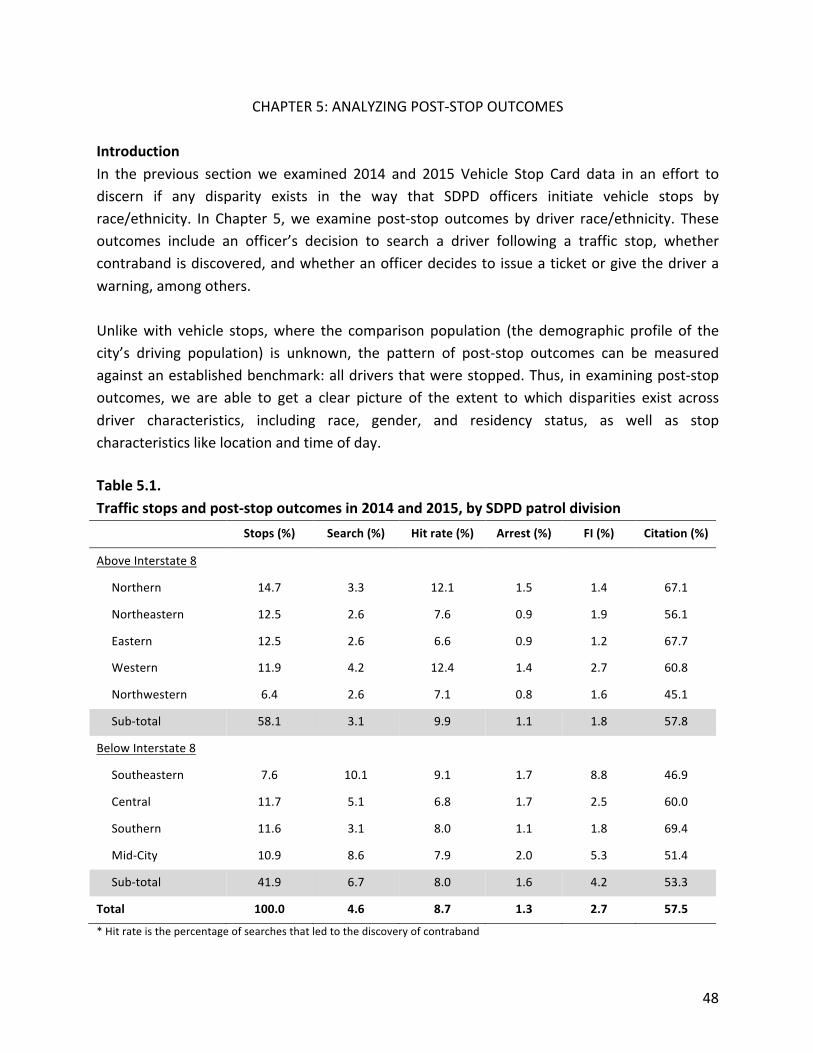
48
CHAPTER5:ANALYZINGPOST-STOPOUTCOMESIntroductionIn the previous section we examined 2014 and 2015 Vehicle Stop Card data in an effort todiscern if any disparity exists in the way that SDPD officers initiate vehicle stops byrace/ethnicity. In Chapter 5,we examine post-stop outcomes by driver race/ethnicity. Theseoutcomes include an officer’s decision to search a driver following a traffic stop, whethercontrabandisdiscovered,andwhetheranofficerdecidestoissueaticketorgivethedriverawarning,amongothers.Unlikewith vehicle stops,where the comparison population (the demographic profile of thecity’s driving population) is unknown, the pattern of post-stop outcomes can be measuredagainstanestablishedbenchmark:alldriversthatwerestopped.Thus,inexaminingpost-stopoutcomes, we are able to get a clear picture of the extent to which disparities exist acrossdriver characteristics, including race, gender, and residency status, as well as stopcharacteristicslikelocationandtimeofday.Table5.1.Trafficstopsandpost-stopoutcomesin2014and2015,bySDPDpatroldivision
Stops(%) Search(%) Hitrate(%) Arrest(%) FI(%) Citation(%)
AboveInterstate8
Northern 14.7 3.3 12.1 1.5 1.4 67.1
Northeastern 12.5 2.6 7.6 0.9 1.9 56.1
Eastern 12.5 2.6 6.6 0.9 1.2 67.7
Western 11.9 4.2 12.4 1.4 2.7 60.8
Northwestern 6.4 2.6 7.1 0.8 1.6 45.1
Sub-total 58.1 3.1 9.9 1.1 1.8 57.8
BelowInterstate8
Southeastern 7.6 10.1 9.1 1.7 8.8 46.9
Central 11.7 5.1 6.8 1.7 2.5 60.0
Southern 11.6 3.1 8.0 1.1 1.8 69.4
Mid-City 10.9 8.6 7.9 2.0 5.3 51.4
Sub-total 41.9 6.7 8.0 1.6 4.2 53.3
Total 100.0 4.6 8.7 1.3 2.7 57.5
*Hitrateisthepercentageofsearchesthatledtothediscoveryofcontraband

49
Table5.1listsbypolicedivisionbothvehiclestoptotalsandtheincidenceratesofkeypost-stopoutcomes.IntheNortherndivision,policeconductedasearchin3.3percentof37,203vehiclestops,or1in30.ContrastthatwiththeSoutheasterndivision,where1in10stopsresultedinaformal search – three times the rate in the Northern division. The same kind of variance ispresent in other raw post-stop data. Drivers stopped in theWestern division aremore thantwiceas likelytofaceafield interview(FI) thanaredriversstopped intheEasterndivision.Asimilarpatternisvisibleincitationrates:45.1percentofstopsconductedintheNorthwesterndivision resulted in the issuance of a ticket, compared to almost 70 percent of stops in theSoutherndivision.Theseobservedpatternsdonot appear tobe random.To someextent, they followdivision-based differences in terms of crime rates and Department allocation of officer resources.Driversstoppedinthecity’shigher-crimeneighborhoodstendtofaceagreaterpolicepresence.That the SDPD may police some areas differently than other locations is common practiceamongothermajorcitypolicedepartmentsandiswell-supportedintheresearchliterature.70These data are also consistentwith thewell-established notion that police officers stop andsearchdriverswithtwostrategicgoalsinmind:(1)topromotepublicsafetythroughtrafficlawenforcementanddeterrence;and(2)toinvestigatethepossibilitythatthedriver(orpassenger)hasengagedinothercriminalactivity.71
Post-stopenforcementpatternsvaryjustaswidelyacrossothermetricsaswell.AsisshowninTable 5.2, drivers stopped in the middle of the night are more likely to be searched andultimatelyarrested thanaredrivers stopped in themorningorafternoon.Similar variation isfound across day of theweek,month, driver gender, and race,which is shown in Table 5.3.These raw numbers suggest that on balance Black drivers, compared to drivers of otherraces/ethnicities,weremorefrequentlysearchedandarrestedfollowingastop,lessfrequentlyfoundwithcontraband,andtheleastfrequentlyticketed.
70Braga,A.,Papachristos,A.,&Hureau,D.(2012).Hotspotspolicingeffectsoncrime.CampbellSystematicReviews,8,1-96;Weisburd,D.,&Telep,C.(2014).Hotspotspolicing:Whatweknowandwhatweneedtoknow.TheJournalofContemporaryCriminology,30,200-220;CrimeSolutions.gov(2015).HotSpotsPolicing.RetrievedAug.16,2016fromhttps://www.crimesolutions.gov/PracticeDetails.aspx?ID=8.71Ashton,R.J.(2007,Jul.).Bridgingthelegalgapbetweenthetrafficstopandcriminalinvestigation.ThePoliceChief,74(7).RetrievedAug.16,2016,fromhttp://www.policechiefmagazine.org/magazine/index.cfm?fuseaction=display_arch&article_id=1229&issue_id=72007;Whrenv.UnitedStates.(1996).517U.S.806.
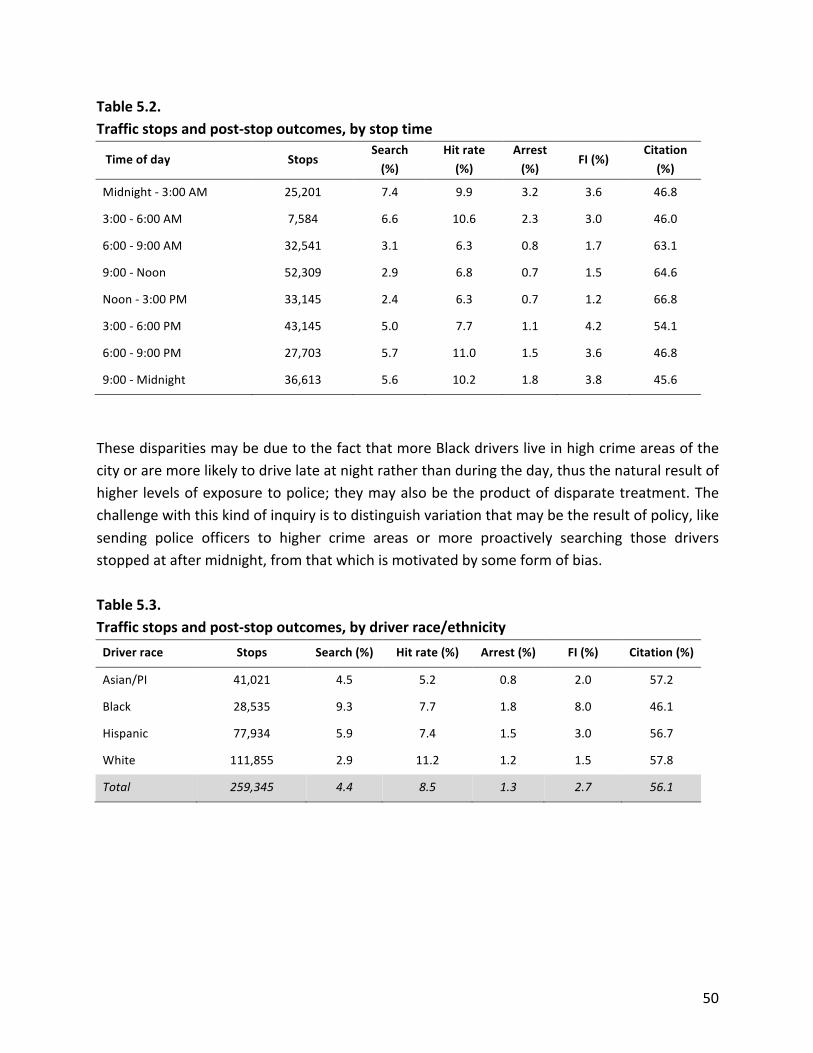
50
Table5.2.Trafficstopsandpost-stopoutcomes,bystoptime
Timeofday StopsSearch(%)
Hitrate(%)
Arrest(%)
FI(%)Citation(%)
Midnight-3:00AM 25,201 7.4 9.9 3.2 3.6 46.8
3:00-6:00AM 7,584 6.6 10.6 2.3 3.0 46.0
6:00-9:00AM 32,541 3.1 6.3 0.8 1.7 63.1
9:00-Noon 52,309 2.9 6.8 0.7 1.5 64.6
Noon-3:00PM 33,145 2.4 6.3 0.7 1.2 66.8
3:00-6:00PM 43,145 5.0 7.7 1.1 4.2 54.1
6:00-9:00PM 27,703 5.7 11.0 1.5 3.6 46.8
9:00-Midnight 36,613 5.6 10.2 1.8 3.8 45.6
ThesedisparitiesmaybeduetothefactthatmoreBlackdriversliveinhighcrimeareasofthecityoraremorelikelytodrivelateatnightratherthanduringtheday,thusthenaturalresultofhigher levelsofexposuretopolice;theymayalsobetheproductofdisparatetreatment.Thechallengewiththiskindofinquiryistodistinguishvariationthatmaybetheresultofpolicy,likesending police officers to higher crime areas or more proactively searching those driversstoppedataftermidnight,fromthatwhichismotivatedbysomeformofbias.Table5.3.Trafficstopsandpost-stopoutcomes,bydriverrace/ethnicityDriverrace Stops Search(%) Hitrate(%) Arrest(%) FI(%) Citation(%)
Asian/PI 41,021 4.5 5.2 0.8 2.0 57.2
Black 28,535 9.3 7.7 1.8 8.0 46.1
Hispanic 77,934 5.9 7.4 1.5 3.0 56.7
White 111,855 2.9 11.2 1.2 1.5 57.8
Total 259,345 4.4 8.5 1.3 2.7 56.1
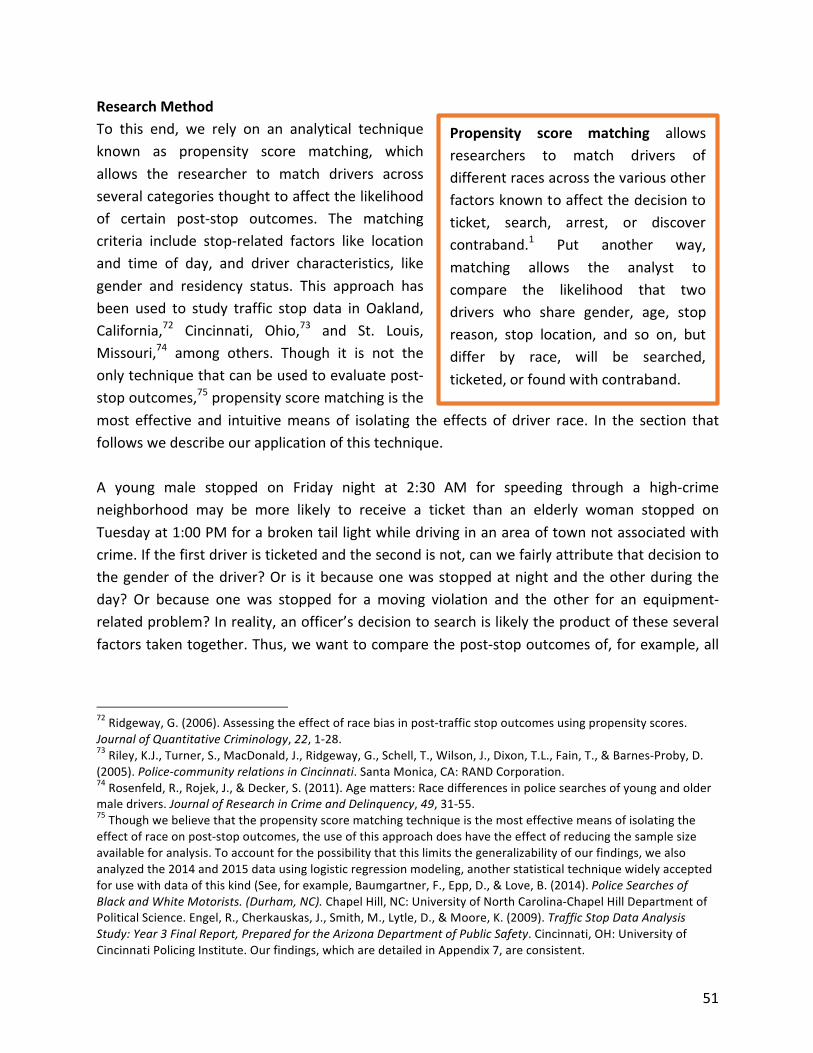
51
ResearchMethodTo this end, we rely on an analytical techniqueknown as propensity score matching, whichallows the researcher to match drivers acrossseveralcategoriesthoughttoaffectthelikelihoodof certain post-stop outcomes. The matchingcriteria include stop-related factors like locationand time of day, and driver characteristics, likegender and residency status. This approach hasbeen used to study traffic stop data in Oakland,California,72 Cincinnati, Ohio,73 and St. Louis,Missouri,74 among others. Though it is not theonlytechniquethatcanbeusedtoevaluatepost-stopoutcomes,75propensityscorematchingisthemost effective and intuitivemeans of isolating the effects of driver race. In the section thatfollowswedescribeourapplicationofthistechnique.A young male stopped on Friday night at 2:30 AM for speeding through a high-crimeneighborhood may be more likely to receive a ticket than an elderly woman stopped onTuesdayat1:00PMforabrokentaillightwhiledrivinginanareaoftownnotassociatedwithcrime.Ifthefirstdriveristicketedandthesecondisnot,canwefairlyattributethatdecisiontothegenderofthedriver?Or is itbecauseonewasstoppedatnightandtheotherduringtheday? Or because one was stopped for a moving violation and the other for an equipment-relatedproblem?Inreality,anofficer’sdecisiontosearchislikelytheproductoftheseseveralfactorstakentogether.Thus,wewanttocomparethepost-stopoutcomesof,forexample,all
72Ridgeway,G.(2006).Assessingtheeffectofracebiasinpost-trafficstopoutcomesusingpropensityscores.JournalofQuantitativeCriminology,22,1-28.73Riley,K.J.,Turner,S.,MacDonald,J.,Ridgeway,G.,Schell,T.,Wilson,J.,Dixon,T.L.,Fain,T.,&Barnes-Proby,D.(2005).Police-communityrelationsinCincinnati.SantaMonica,CA:RANDCorporation.74Rosenfeld,R.,Rojek,J.,&Decker,S.(2011).Agematters:Racedifferencesinpolicesearchesofyoungandoldermaledrivers.JournalofResearchinCrimeandDelinquency,49,31-55.75Thoughwebelievethatthepropensityscorematchingtechniqueisthemosteffectivemeansofisolatingtheeffectofraceonpost-stopoutcomes,theuseofthisapproachdoeshavetheeffectofreducingthesamplesizeavailableforanalysis.Toaccountforthepossibilitythatthislimitsthegeneralizabilityofourfindings,wealsoanalyzedthe2014and2015datausinglogisticregressionmodeling,anotherstatisticaltechniquewidelyacceptedforusewithdataofthiskind(See,forexample,Baumgartner,F.,Epp,D.,&Love,B.(2014).PoliceSearchesofBlackandWhiteMotorists.(Durham,NC).ChapelHill,NC:UniversityofNorthCarolina-ChapelHillDepartmentofPoliticalScience.Engel,R.,Cherkauskas,J.,Smith,M.,Lytle,D.,&Moore,K.(2009).TrafficStopDataAnalysisStudy:Year3FinalReport,PreparedfortheArizonaDepartmentofPublicSafety.Cincinnati,OH:UniversityofCincinnatiPolicingInstitute.Ourfindings,whicharedetailedinAppendix7,areconsistent.
Propensity score matching allowsresearchers to match drivers ofdifferentracesacrossthevariousotherfactorsknowntoaffectthedecisiontoticket, search, arrest, or discovercontraband.1 Put another way,matching allows the analyst tocompare the likelihood that twodrivers who share gender, age, stopreason, stop location, and so on, butdiffer by race, will be searched,ticketed,orfoundwithcontraband.

52
youngmenstoppedlateonFridaynightsforspeedinginahigh-crimeneighborhood,toseeifrace/ethnicityisadeterminativefactorintheseoutcomes.Figure5.1.TheaveragepercentagedifferencebetweenmatchedandunmatchedBlackandWhitedriversacrosseightvariablesusedtocompletematchingprocess
Note:Matchedpairsconsistof19,948Blackand19,948Whitedrivers.Nomatcheswerepossiblefor8,579Blackand91,859Whitedrivers.
Figures 5.1 and 5.2 document the average differences between matched and unmatcheddriversacrosstheeightvariablesuponwhichthematchwasbased.Thesevariablesincludethereasonforandlocation(policedivision)ofthestop,thedayoftheweek,month,andtimeofdayduringwhichthestopoccurred,andthedriver’sage,gender,andresidencystatus.Per Figure 5.1, the stop location of matched Black and White drivers differs by only 0.44percent,while the stop locationof unmatcheddriversdiffers by an averageof 8.55percent.Similarly,matcheddriverswereofidenticalagecategoriesin99.6percentofcases,comparedto94.63percentof cases involvingunmatchedBlackandWhitedrivers.Overall, theaveragedisparitybetweenmatchedBlackandWhitedriversis0.67percent,comparedtoa7.38percentdifferencebetweenunmatcheddrivers.Figure5.2showssimilaroutcomesfromthematchingprocessinvolvingHispanicandWhitedrivers.
0%
2%
4%
6%
8%
10%
12%
14%
16%
18%
Stoptype Division Time Stopday Month Age Gender Residency
Matched Unmatched

53
Figure5.2.TheaveragepercentagedifferencebetweenmatchedandunmatchedHispanicandWhitedriversacrosseightvariablesusedtocompletematchingprocess
Note:Matchedpairsconsistof39,252Hispanicand39,252Whitedrivers.Nomatcheswerepossiblefor38,682Hispanicand72,603Whitedrivers.These figures illustrate a critical attribute of the propensity score matching approach: anydifferenceswefindbetweenBlackandHispanicdriversandtheirmatchedWhitecounterpartsintermsofsearchesconducted,citationsissued,orcontrabandfound,arenottheresultofanyof the factors listed. Inotherwords,basedonthe informationavailable, race/ethnicity is theonlydifferencebetweenthetwogroupsofdrivers,andthustheonlyfactorthatmayexplaintheobserveddifferencesinpost-stopoutcomes.76 76SeeRidgeway,G.,(2009).CincinnatiPoliceDepartmenttrafficstops:ApplyingRAND’sframeworktoanalyzeracialdisparities.SantaMonica,CA:RANDCorporation.Thereareotherfactorsthoughttoaffectthelikelihoodofcertainpost-stopoutcomes,including,forexamples:officerdemographics(Rojek,J.,Rosenfeld,R.,&Decker,S.(2012).Policingrace:Theracialstratificationofsearchesinpolicetrafficstops.Criminology,50,993-1024;Tillyer,R.Klahm,C.F.,&Engel,R.S.(2012).Thediscretiontosearch:Amultilevelexaminationofdriverdemographicsandofficercharacteristics.JournalofContemporaryCriminalJustice,28,184-205.)andperformancehistory(Alpert,G.P.,Dunham,R.G.,&Smith,M.R.(2004).Towardabetterbenchmark:Assessingtheutilityofnot-at-faulttrafficcrashdatainracialprofilingresearch.JusticeResearchandPolicy,6,43-69),age(Giles,H.,Linz,D.,Bonilla,D.,&Gomez,M.L.(2012).PolicestopsofandinteractionswithHispanicandWhite(non-Hispanic)drivers:Extensivepolicingandcommunicationaccommodation.CommunicationMonographs,79(4),407-427),make,model,andconditionofthevehiclestopped(Engel,R.S.,Frank,J.,Klahm,C.F.,&Tillyer,R.(2006,Jul.).ClevelandDivisionofPoliceTrafficStopDataStudy:FinalReport.Cincinnati,OH:UniversityofCincinnatiDivisionofCriminalJustice),
0%
2%
4%
6%
8%
10%
12%
14%
16%
18%
20%
Stoptype Division Time Weekday Month Age Gender Residency
Matched Unmatched

54
ResultsWhat follows are the results of our comparative analysis of post-stop outcomes for Black,Hispanic,andAPIdriversandtheirmatchedWhitecounterparts,beginningwiththedecisiontosearch.ThedecisiontosearchPolicesearchescanbeclassifiedbasedonthe legal rules thatdefinethem.TheSDPDvehiclestopcardlistsfoursuchsearchtypes:consentsearch,Fourthwaiversearch,searchincidenttoarrest, and inventory search. We frame each search type in terms of the level of officerdiscretionthatmaydeterminethedecisiontoinitiatethesearch.We classify searches occurring incident to an arrest and inventory searches as involving lowlevelsofdiscretionaryauthority.Officersarewithintheirlegalrightstoconductasearchwhenan arrest ismade,77 andwhen a vehicle is impounded.78 Becausemost such searches occurautomatically, race-based disparities that exist say less about officer behavior than they doaboutthefactorsthatledtothearrestorimpound.Consentsearchesareclassifiedasinvolvinghigherlevelsofofficerdiscretion.Aconsentsearchoccurs after an officer has requested and received consent from the driver to search thedriver’s person or vehicle. When granting consent, the driver waives his or her FourthAmendmentprotectionagainstunreasonablesearchandseizure.79Aconsentsearchinvolvesahighdegreeofpolicediscretion, as thereare few if any legal strictures inplace toguide therequest for or the nature of a search following the grant of consent.Wewould expect thatwhatever disparity exists would manifest more clearly in the execution of discretionarysearches.InthecaseofaFourthwaiversearch,policeofficersarepermittedtosearchapersonand/orvehicle ifandwhentheydeterminethat thedriverorpassenger iseitheronprobationoronparole.Byvirtueof this legal status, thedriver implicitlyagrees towaiveFourthAmendmentprotection.Asaresult,thesesearchesoftenoccurintheabsenceofprobablecause.80
andthedemeanorofthedriver(Engel,R.S.,Klahm,C.F.,&Tillyer,R.(2010).Citizens’demeanor,race,andtrafficstops.InS.K.Rice&M.D.White(Eds.),Race,ethnicity,andpolicing:Newandessentialreadings.NewYork:NewYorkUniversityPress),amongothers.BecausetheSDPDdoesnotcollectthesedata,itisimpossibletoincludetheminourmatchingprotocol.77U.S.v.Robinson.(1973).414U.S.218;Arizonav.Gant.(2009).556U.S.332.78SouthDakotav.Opperman.(1976).428U.S.364.79Schnecklothv.Bustamonte.(1973).412U.S.218.80Peoplev.Schmitz.(2012).55Cal.4th909.

55
Fourthwaiversearchesinvolveanambiguouslevelofofficerdiscretion.81Ononehand,officerswhoarelegallypermittedtoconductaFourthwaiversearchhavethediscretionaryauthoritytoopt against doing so. Similarly, officer discretion is used in determining whether a driver orpassenger isonprobationorparole. Ineachcase,thisdiscretionaryauthoritymaybeapplieddifferently based on driver race.82 On the other hand, once it is determined that adriver/passengeriseitheronprobationorparole,theofficerhasfulllegalauthoritytoconductasearch,whichreducestheimportofthedecisiontoinitiatethesearch.Relatedly,wehavenoknowledge of the demographic profile of the City’s probation/parole population or of thepopulation of stopped drivers on probation/parole. Together, these factors complicate ourabilitytoassignmeaningtoresultsgeneratedbyananalysisofFourthwaiversearches.Table5.4.ComparingsearchratesamongmatchedBlackandWhitedrivers
MatchedBlackdrivers(%)
MatchedWhitedrivers(%)
Difference(%)83
p-value
Allsearches 8.65 5.04 52.70 <0.001
Consent 1.39 0.75 60.09 <0.001
Fourthwaiver 2.90 1.30 76.37 <0.001
Inventory 1.91 1.30 42.29 <0.001
Incidenttoarrest 0.90 0.89 0.56 0.480
Other(uncategorized) 1.56 0.86 58.09 <0.001
Note:Theanalysisisbasedonatotalof19,948Blackdriversand19,948matchedWhitedrivers.
An additional search type, the probable cause search, may occur after an officer hasdeterminedthatthereissufficientprobablecausetobelievethatacrimehasbeenorisabouttobecommitted.84Thelawgrantsofficersasubstantialdegreeofleewayindeterminingwhenthe probable cause threshold has beenmet, whichmakes the evaluation of probable causesearch incidence potentially very important. The SDPD Vehicle Stop card does not include a‘probable cause search’ category. Given the legal and practical importance of thedemonstration of probable cause prior to a search, this category of searches should be
81Hetey,R.,Monin,B.,Maitreyi,A.,&Eberhardt,J.(2016).Dataforchange:Astatisticalanalysisofpolicestops,searches,handcuffings,andarrestsinOakland,Calif.,2013-2014.StanfordUniversity,CA:StanfordSPARQ.82E.g.,Burks,M.(2014,Jan.30).Whatitmeanswhenpoliceask:‘Areyouonprobationorparole.’VoiceofSanDiego.RetrievedNov.21,2016,fromhttp://www.voiceofsandiego.org/racial-profiling-2/what-it-means-when-police-ask-are-you-on-probation/.83Tocalculatethepercentagedifferenceusedinthisandsubsequenttables,wedividetheabsolutevalueofthedifferencebetweenthefirsttwocolumns(3.61)bytheaverageofthefirsttwocolumns–inthiscase,searchrates(6.85).3.61/6.85=52.7percent.84Illinoisv.Gates.(1983).463U.S.213.

56
captured. As a result of this omission, we were unable to analyze this category of policeaction.85As is documented in Table 5.4, we found statistically significant evidence of a Black-Whitedisparity across all search types combined, and in four out of five types of searches. For allsearchtypescombined,8.65percentofmatchedBlackdriversweresearchedin2014and2015,compared to 5.04 of matched White drivers. 2.90 percent of stopped Black drivers weresubjectedtoaFourthwaiversearch,comparedto1.30percentofmatchedWhitedrivers.BlackdriverswerealsomorelikelytofaceconsentsearchesthanwerematchedWhites.Toacertainextent, these disparities were also evident in low-discretion searches, including inventorysearchesandunclassifiedsearchtypes.Wefoundnostatisticaldifferencebetweentherateofsearches conducted incident to the arrest of a Black motorist when compared to thoseinvolvingmatchedWhitedrivers.Table5.5.ComparingsearchratesamongmatchedHispanicandWhitedrivers
MatchedHispanic
drivers(%)MatchedWhite
drivers(%)Difference
(%)p-value
Allsearches 6.56 3.93 50.22 <0.001
Consent 0.92 0.60 42.69 <0.001
Fourthwaiver 1.07 0.90 17.62 0.004
Inventory 2.68 1.06 86.49 <0.001
Incidenttoarrest 0.91 0.68 29.86 <0.001
Other(uncategorized) 0.99 0.70 33.84 <0.001
Note:Theanalysisisbasedonatotalof39,252Hispanicdriversand39,252matchedWhitedrivers
85ThedatafilewereceivedfromtheSDPDincludedseveraluncategorizedsearches(i.e.,asearchwasrecorded,buttheofficerinvolvedeitherdidnotconsideritaFourthwaiversearch,aconsentsearch,asearchincidenttoarrest,oraninventorysearch,or,simplyneglectedtocategorizeitassuch).Theseincidentsarereferredtoas‘Other(uncategorized)’searches.Thecurrentvehiclestopdatacarddoesincludefieldsthatallowtheofficertodescribethenatureoftheprobablecauseusedtojustifythesearch,including“Contrabandvisible,”“Odorofcontraband,”“Caninealert,”“Observedevidencerelatedtocriminalactivity,”or“Other”(SeeAppendix2fordetails).Yetinmostcases,theofficersarenotconsistentinthisdocumentation.In2014,forexample,the‘Other(uncategorized)’categoryincluded938searches.Ofthese,595(63.4percent)wereunlabeled,whileanother145(15.5percent)weredescribedas‘Other,’inmostcaseswithoutanyadditionalinformation.Becausewecannotconfidentlycharacterizesome78.9percentofthesedataasmeetingtheprobablecausestandard,weneglectedtocreatesuchacategory.

57
Table5.5displays the resultsofourcomparisonofHispanicdriversand theirmatchedWhitecounterparts.We findstatistically significantevidenceofaHispanic-Whitedisparityacrossallsearch types combined, as well as in all five types of searches. In the aggregate, officersconductedasearch in6.56percentof stops involvingHispanicdrivers, compared to the3.93percentofstopsinvolvingmatchedWhitedrivers.Thoughconsentsearchesarerelativelyrareoccurrences,regardlessofdriverrace,in2014and2015 Hispanic drivers were subject to consent searches more often than their Whitecounterparts.WefindstatisticallysignificantdifferencesbetweenHispanicandmatchedWhitedriversacrossall search types, includingconsent searches, Fourthwaiver searches, inventorysearches, those conducted incident to arrest, and other uncategorized searches. Hispanicdriverswerealsosignificantlymore likely to facean inventorysearchthanare theirmatchedWhitecounterparts.Table5.6liststheresultsofouranalysisofsearchesinvolvingmatchedAPIandWhitedrivers.Under certain conditions, we find statistically significant evidence that White drivers weresearched at greater rates thanmatchedAPIs. In the aggregate,matchedWhite driversweresearched following 3.48 percent of stops, compared to a 2.61 percent search rate for APIdrivers.WealsofindthatWhitesweresubjecttohigherratesofinventorysearches,searchesconductedincidenttoarrest,anduncategorizedsearches.TherewasnostatisticallysignificantdifferenceineitherconsentorFourthwaiversearchrates.Table5.6.ComparingsearchratesamongmatchedAsian/PacificIslanderandWhitedrivers
MatchedAsian/PI
drivers(%)MatchedWhite
drivers(%)Difference
(%)p-value
Allsearches 2.61 3.48 -28.57 <0.001
Consent 0.48 0.49 -2.06 0.390
Fourthwaiver 0.64 0.74 -14.49 0.063
Inventory 0.69 1.02 -38.60 <0.001
Incidenttoarrest 0.35 0.68 -64.08 <0.001
Other(uncategorized) 0.50 0.64 -24.56 0.006
Note:Theanalysisisbasedonatotalof34,068Asian/PIdriversand34,068matchedWhitedrivers
Insum,wefindthatBlackandHispanicdriversweremore likelytobethesubjectofapolicesearchfollowingatrafficstopthanwerematchedWhites.Thesedisparitiesareconsistentwith
58
thosegeneratedbyrecentanalysesofpolicesearchdecisionsinMinneapolis,Minnesota,86St.Louis,Missouri,87andPortland,Oregon,88amongseveralotherjurisdictions.89HitratesTheterm‘hitrate’isusedtodescribethefrequencythatapoliceofficer’ssearchleadstothediscovery of unlawful contraband, which the SDPD defines as “property that is illegal topossess.”90Thismetricisareflectionofthequalityandefficiencyofapoliceofficer’sdecisiontosearchandisawell-acceptedmeansofidentifyingracial/ethnicdisparities.91 Ourhit rateanalysiswas complicatedby several challenges stemming from theway that theSDPDcapturesdataonthediscoveryofcontraband.ThefirstinvolvedhowtotreatthetensofthousandsofambiguouslylabeledcasesincludedaspartoftherawdatacompiledbytheSDPD.As isdocumented inTable5.6,averyhighnumber–over90percent–of caseswereeithermissing informationon thediscoveryof contrabandor codedambiguously.Weacknowledgethat thesemissingdataare likely theproductof theSDPD’sdatamanagementsystemratherthanofficer non-compliance. Indeed, our hit rate analysis reflects the assumption that thesemissing/ambiguousdataindicatethatnocontrabandwasdiscovered.Withthatsaid,wecannotoffer any evidence to substantiate this assumption, and thus make these calculations withslightlylessconfidencethansomeofourothers.
86Briggs,S.J.(2016).Theimpactofpolicedeploymentonracialdisparitiesindiscretionarysearches.RaceandJustice.Availableonlinebeforeprint.DOI:10.1177/2153368716646163.87Rojek,J.,Rosenfeld,R.,&Decker,S.(2012).Policingrace:Theracialstratificationofsearchesinpolicetrafficstops.Criminology,50,993-1024.88Renauer,B.C.(2012).Neighborhoodvariationinpolicestopsandsearches:Atestofconsensusandconflictperspectives.JusticeQuarterly,15,219-240.89Tillyer,R.,&Klahm,C.F.(2015).Discretionarysearches,theimpactofpassengers,andtheimplicationsforpolice-minotityencounters.CriminalJusticeReview.Availableonlinebeforeprint.DOI:10.1177/0734016815581049;Tillyer,R.,Klahm,C.F.,&Engel,R.S.(2012).Thediscretiontosearch:Amultilevelexaminationofdriverdemographicsandofficercharacteristics.JournalofContemporaryCriminalJustice,28,184-205;Fallik,S.W.,&Novak,K.J.Thedecisiontosearch:Israceorethnicityimportant?JournalofContemporaryCriminalJustice,28,46-165.90TheDepartmentalsonotesthat,“Determiningwhetherpropertyiscontrabandiscontextual—somepropertythatisgenerallylegaltopossessmaybeillegalincertaincircumstances.Forexample,anopencontainerofalcoholisgenerallylegalforadults21yearsorolder,howeverisillegalwhenpossessedinavehicle.Similarly,paroleesmayhaverestrictionsregardingpossessionofspecificweaponsthatwouldotherwisebelegal.91Persico,N.,&Todd,P.E.(2008).Thehitratetestforracialbiasinmotor-vehiclesearches.PoliceQuarterly,25,37-53;Ridgeway,G.&MacDonald,J.(2010).Methodsforassessingraciallybiasedpolicing.InS.K.Rice&M.D.White(Eds.)Race,ethnicity,andpolicing:Newandessentialreadings(pp.180-204).NewYork:NewYorkUniversityPress;Tillyer,R.,Engel,R.S.,&Cherkauskas,J.C.(2010).Bestpracticesinvehiclestopdatacollectionandanalysis.Policing:AnInternationalJournalofPoliceStrategies&Management,33,69-92.

59
Table5.7.Rawdataonthediscoveryofcontraband
Searchconducted?
Contrabandfound? Yes No Missing Total
Yes 981 26 0 1,007
No 6,775 9,554 31 16,360
Null 337 63,488 722 64,547
Missing 3,434 163,453 10,777 177,664
Total 11,527 236,521 11,530 259,578
The second and related challenge resulted from the fact that according to the SDPD,contraband discovery should be considered valid for the purposes of our analysis only if itfollowsasearch.PerTable5.7therewere26caseswherecontrabandwasdiscovered,butnosearch was recorded. Furthermore, there are 3,771 cases where a search occurred, but theoutcome of the searchwas eithermissing or ambiguously coded. Finally, therewere 11,499caseswheresearchdatawasmissingorlistedasnull,including31caseswhere‘nocontraband’waslisted.
To address these data issues, we excluded the 11,499 cases where search data wasmissing/null,andthe26caseswherethediscoveryofcontrabandwasreported,butnosearchwas conducted. From there, we classified cases where information on the discovery ofcontrabandwaseithermissingornullasindicativeofa‘nocontraband’finding.Werecognizethattherearepossible implications fortreatingthesemissingcasesdifferentlyandthushaveincluded the results of additional analyses, includingmodels wherewe drop allmissing/nullcases,inAppendix8.TogeneratethedatashowninTable5.8,weinterpretedallmissingandnullcasesasindicatingthatnocontrabandwasdiscovered(n=242,211).Fromthere,wecalculatedhitratesusingthe19,948 matched Black and 19,948 matched White drivers that we used to analyze theDepartment’s searchdecisions.Police searched1,726 (8.65percent)ofBlackdrivers stoppedanddiscovered contrabandon 137occasions, or 7.9 percent of the time.OfmatchedWhitedrivers,1,005(5.04percent)weresearched,with125ofthosesearched(12.4percent)foundtobe holding contraband. Matched Whites were more likely to be found with contrabandfollowingFourthwaiversearchesandconsentsearches.Therewerenostatisticallysignificantdifferences in thehit ratesofmatchedBlackandWhitedrivers followingsearchesconductedincidenttoarrest,inventorysearches,orother,uncategorizedsearches.
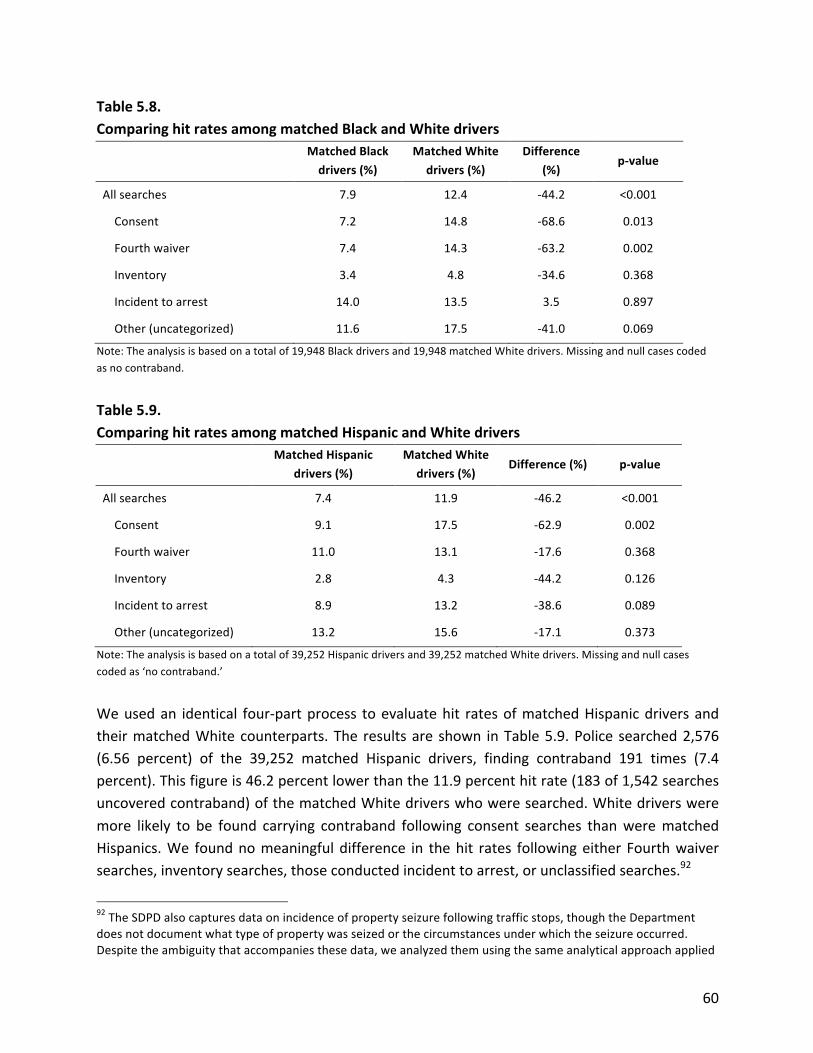
60
Table5.8.ComparinghitratesamongmatchedBlackandWhitedrivers
MatchedBlackdrivers(%)
MatchedWhitedrivers(%)
Difference(%)
p-value
Allsearches 7.9 12.4 -44.2 <0.001
Consent 7.2 14.8 -68.6 0.013
Fourthwaiver 7.4 14.3 -63.2 0.002
Inventory 3.4 4.8 -34.6 0.368
Incidenttoarrest 14.0 13.5 3.5 0.897
Other(uncategorized) 11.6 17.5 -41.0 0.069
Note:Theanalysisisbasedonatotalof19,948Blackdriversand19,948matchedWhitedrivers.Missingandnullcasescodedasnocontraband.Table5.9.ComparinghitratesamongmatchedHispanicandWhitedrivers
MatchedHispanicdrivers(%)
MatchedWhitedrivers(%)
Difference(%) p-value
Allsearches 7.4 11.9 -46.2 <0.001
Consent 9.1 17.5 -62.9 0.002
Fourthwaiver 11.0 13.1 -17.6 0.368
Inventory 2.8 4.3 -44.2 0.126
Incidenttoarrest 8.9 13.2 -38.6 0.089
Other(uncategorized) 13.2 15.6 -17.1 0.373
Note:Theanalysisisbasedonatotalof39,252Hispanicdriversand39,252matchedWhitedrivers.Missingandnullcasescodedas‘nocontraband.’
Weusedan identical four-partprocess toevaluatehit ratesofmatchedHispanicdriversandtheirmatchedWhitecounterparts.The resultsare shown inTable5.9.Police searched2,576(6.56 percent) of the 39,252 matched Hispanic drivers, finding contraband 191 times (7.4percent).Thisfigureis46.2percentlowerthanthe11.9percenthitrate(183of1,542searchesuncoveredcontraband)ofthematchedWhitedriverswhoweresearched.Whitedriversweremore likely to be found carrying contraband following consent searches thanwerematchedHispanics.We foundnomeaningfuldifference in thehit rates followingeither Fourthwaiversearches,inventorysearches,thoseconductedincidenttoarrest,orunclassifiedsearches.92
92TheSDPDalsocapturesdataonincidenceofpropertyseizurefollowingtrafficstops,thoughtheDepartmentdoesnotdocumentwhattypeofpropertywasseizedorthecircumstancesunderwhichtheseizureoccurred.Despitetheambiguitythataccompaniesthesedata,weanalyzedthemusingthesameanalyticalapproachapplied

61
Table5.10.ComparinghitratesamongmatchedAsian/PacificIslanderandWhitedrivers
MatchedAPIdrivers(%)
MatchedWhitedrivers(%)
Difference(%)
p-value
Allsearches 9.42 10.39 -9.78 0.465
Consent 9.68 16.56 -52.44 0.075
Fourthwaiver 9.22 12.90 -33.33 0.208
Inventory 5.15 3.17 47.60 0.230
Incidenttoarrest 12.61 12.23 3.04 0.920
Other(uncategorized) 12.29 12.79 -3.95 0.881
Note:Theanalysisisbasedonatotalof68,136Asian/PacificIslanderdriversand68,136matchedWhitedrivers.Missingandnullcasescodedas‘nocontraband.’
InTable5.10,wedocumentthehitratesofsearchesinvolving68,136matchedAPIandWhitedrivers.Therewerenostatisticallysignificantdifferencesevident.Toreview,wecomparedthehitrates–thepercentageofsearchesthatledtothediscoveryofcontraband – of searches involving API, Black, and Hispanic drivers with those of matchedWhitedrivers.Despitehavinghighersearchrates,BlackandHispanicdriverswereeither lesslikelyorjustaslikelytobefoundcarryinganillegalsubstance,afindingthatisconsistentwiththosegeneratedbyotherrecentstudies.93MatchedWhiteandAPIdriverswereequally likelytobefoundcarryingcontraband.ArrestWe also used propensity scorematching to compare the arrest rates of Black and HispanicdriverswithWhitedriverswhowerestoppedundersimilarcircumstances.AsisshowninTable5.11,1.79percent (20,872stops ledto374arrests)ofmatchedBlackdriverswereultimatelyarrested,comparedwith1.84percent(384of20,872)ofmatchedWhitedrivers.Thisdifferencewasnotstatisticallysignificant.
tothediscoveryofcontraband.Propertywasseizedfrom8.9percentofBlackdriverssearched,arate28percentfewerthanthe11.8percentseizurerateofmatchedWhitedrivers(differencestatisticallysignificantatthe0.01level).Similarly,propertywasseizedfrom11.1percentofHispanicdriversstoppedandsearchedbytheSDPD,comparedtotheseizurerateof12.3percentofmatchedWhites(differencenotstatisticallysignificant).93Tillyer,R.,&Klahm,C.(2011).Searchingforcontraband:Assessingtheuseofdiscretionbypoliceofficers.PoliceQuarterly,14,166-185;Warren,P.Y.,&Tomaskovic-Devey,D.(2009).Racialprofilingandsearches:Didthepoliticsofracialprofilingchangepolicebehavior?.CriminalJustice&PublicPolicy,8,343-369;Williams,B.N.,&Stahl,M.(2008).AnanalysisofpolicetrafficstopsandsearchesinKentucky:Amixedmethodsapproachofferingheuristicandpracticalimplications.PolicySciences,Vol.41,221-243.

62
Table5.11.ComparingarrestratesformatchedBlackandWhitedrivers
MatchedBlack
drivers(%)
MatchedWhite
drivers(%)
Difference(%)
p-valueMatchedpairs
Arrest 1.79 1.84 -2.8 -0.69 20,872
Note:Missingandnulldataconsideredasindicativeof‘noarrest.’AswedocumentinTable5.12,651of41,220stopsinvolvingmatchedHispanicdriversresultedinanarrest,oranarrestrateof1.71percent.StopsinvolvingmatchedWhitedriversendedinarrestslightlylessoften(537times,orarateof1.41percent),thoughthedifferencebetweenthetwogroupsprovedtobestatisticallysignificant.Table5.12.ComparingarrestratesformatchedHispanicandWhitedrivers
MatchedHispanicdrivers(%)
MatchedWhite
drivers(%)
Difference(%)
p-valueMatchedpairs
Arrest 1.71 1.41 19.2 <0.001 41,220
Note:Missingandnulldataconsideredasindicativeof‘noarrest.’
Table 5.13 documents our analysis of arrests involving matched API andWhite drivers. APIdrivers were arrested following 0.85 percent of stops (304 arrests out of 35,847 stops), 44percentlowerthanthe1.33percentarrestrateformatchedWhites(477of35,847stopsledtoanarrest).Thisdisparityisstatisticallysignificantatthe0.001level.Table5.13.ComparingarrestratesformatchedAsian/PacificIslanderandWhitedrivers
MatchedAsian/PIdrivers(%)
MatchedWhite
drivers(%)
Difference(%)
p-valueMatchedpairs
Arrest 0.85 1.33 -44.04 <0.001 35,847
Note:Missingandnulldataconsideredasindicative‘noarrest.’The findings involving Black and Hispanic drivers are inconsistent withmuch of the existingresearchontheeffectsofrace/ethnicityonpolicearrestdecisions.Infact,accordingtoa2011

63
paper,24ofthe27studiespublishedontheissuefoundthatBlacksandotherminoritiesweremorelikelytobearrestedthanWhitesencounteringthepoliceundersimilarcircumstances.94FieldInterviewsPerSDPDProcedure6.03,whichestablishesDepartmentguidelinesfortheuseandprocessingofFieldInterviewReports,afieldinterviewisdefinedas“anycontactorstopinwhichanofficerreasonably suspects that a person has committed, is committing, or is about to commit acrime.” According to one SDPD Sergeant, FIs are “the bread and butter of any ganginvestigator”andimportantforidentifyingcriminalsuspects.95The traffic stop data card includes space for officers to document these encounters. Ouranalysis of the SDPD’s field interview records also showed statistically significant differencesbetweenmatchedpairs.AsweshowinTable5.14,matchedBlackdriversweresubjecttofieldinterview questioning 1,203 times (6.60 percent of stops) between January 1, 2014 andDecember31,2015,while552Whitedriversweregivenfieldinterviews(2.75percent)duringthatsameperiod,adifferenceofjustover82percent.Table5.14.ComparingfieldinterviewratesformatchedBlackandWhitedrivers
MatchedBlack
drivers(%)
MatchedWhite
drivers(%)
Difference(%)
p-valueMatchedpairs
Fieldinterview 6.60 2.75 82.4 <0.001 20,060
Note:Missingandnullcasesconsideredasindicativeof‘nofieldinterview.’Table5.15documentstheresultsofouranalysisofmatchedHispanicandWhitedrivers.SDPDofficersconductedfield interviewswith2.98percentofmatchedHispanics,arate37percentgreaterthanthe2.05percentexperiencedbyWhitedrivers. 94Kochel,T.R.,Wilson,D.B.,&Mastrofski,S.D.(2011).Effectofsuspectraceonofficers’arrestdecisions.Criminology,49,473-512.Seealso,Alpert,G.P.,Becker,E.,Gustafson,M.A.,Meister,A.P.,Smith,M.R.,&Strombom,B.A.(2006).Pedestrianandmotorvehiclepost-stopdataanalysisreport.LosAngeles,CA:AnalysisGroup.RetrievedOct.3,2016,fromhttp://assets.lapdonline.org/assets/pdf/ped_motor_veh_data_analysis_report.pdf;Smith,M.R.,&Petrocelli,M.(2001).Racialprofiling?Amultivariateanalysisofpolicetrafficstopdata.PoliceQuarterly,4,4-27;Withrow,B.L.(2004).Race-basedpolicing:AdescriptiveanalysisoftheWichitastopstudy.PolicePracticeandResearch,5,223-240.95O'Deane,M.,&Murphy,W.P.(2010,Sept.23).Identifyinganddocumentinggangmembers.PoliceMagazine.RetrievedAug.16,2016,fromhttp://www.policemag.com/channel/gangs/articles/2010/09/identifying-and-documenting-gang-members.aspx.
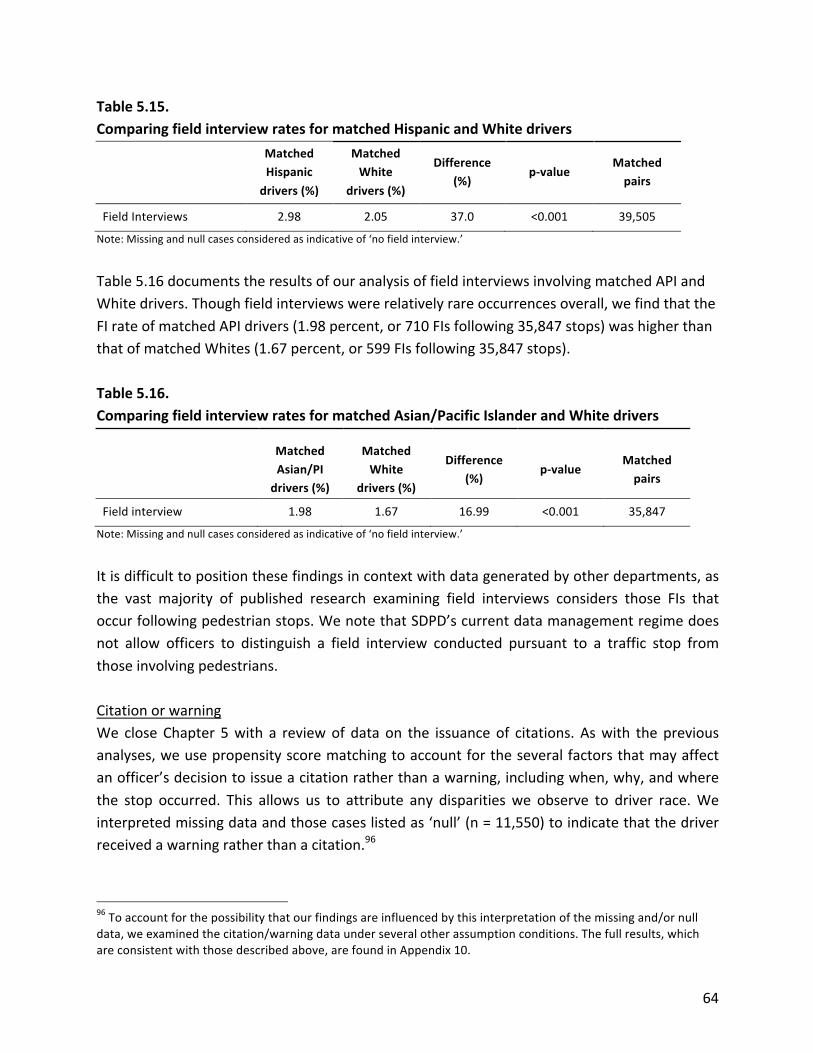
64
Table5.15.ComparingfieldinterviewratesformatchedHispanicandWhitedrivers
MatchedHispanicdrivers(%)
MatchedWhite
drivers(%)
Difference(%)
p-valueMatchedpairs
FieldInterviews 2.98 2.05 37.0 <0.001 39,505
Note:Missingandnullcasesconsideredasindicativeof‘nofieldinterview.’Table5.16documentstheresultsofouranalysisoffieldinterviewsinvolvingmatchedAPIandWhitedrivers.Thoughfieldinterviewswererelativelyrareoccurrencesoverall,wefindthattheFIrateofmatchedAPIdrivers(1.98percent,or710FIsfollowing35,847stops)washigherthanthatofmatchedWhites(1.67percent,or599FIsfollowing35,847stops).Table5.16.ComparingfieldinterviewratesformatchedAsian/PacificIslanderandWhitedrivers
MatchedAsian/PIdrivers(%)
MatchedWhite
drivers(%)
Difference(%)
p-valueMatchedpairs
Fieldinterview 1.98 1.67 16.99 <0.001 35,847
Note:Missingandnullcasesconsideredasindicativeof‘nofieldinterview.’Itisdifficulttopositionthesefindingsincontextwithdatageneratedbyotherdepartments,asthe vast majority of published research examining field interviews considers those FIs thatoccurfollowingpedestrianstops.WenotethatSDPD’scurrentdatamanagementregimedoesnot allow officers to distinguish a field interview conducted pursuant to a traffic stop fromthoseinvolvingpedestrians.CitationorwarningWe closeChapter 5with a reviewof data on the issuanceof citations. Aswith thepreviousanalyses,weusepropensityscorematchingtoaccountfortheseveralfactorsthatmayaffectanofficer’sdecisiontoissueacitationratherthanawarning,includingwhen,why,andwherethe stop occurred. This allows us to attribute any disparitieswe observe to driver race.Weinterpretedmissingdataandthosecaseslistedas‘null’(n=11,550)toindicatethatthedriverreceivedawarningratherthanacitation.96
96Toaccountforthepossibilitythatourfindingsareinfluencedbythisinterpretationofthemissingand/ornulldata,weexaminedthecitation/warningdataunderseveralotherassumptionconditions.Thefullresults,whichareconsistentwiththosedescribedabove,arefoundinAppendix10.

65
The findings, listed in Table 5.17, show thatmatched Black drivers receive a citation in 49.6percentof stops, as compared tomatchedWhitedrivers,whowere cited in 56.1percentofstops. To account for the possibility that those factors that led to a search may affect thelikelihood thatadriverwill receivea citation,wealso limited theanalysis to thosemotoristswhowere stoppedby the SDPDbut not searched. After dropping searcheddrivers from thesample,were-matchedtheremainingdriversusingthesamesetofvariablesandprocedureasdescribed above.97 The results, also displayed in Table 5.17, suggest that the relationshipbetweenthe initiationofasearchandthedecisionto issueacitation isunrelatedtorace. Infact,thepercentageofcitationsincreasedslightlyforbothmatchedBlackandWhitedrivers.Table5.17.ComparingcitationratesformatchedBlackandWhitedrivers Matched
Blackdrivers(%)
MatchedWhite
drivers(%)
Difference(%)
p-valueMatchedpairs
Searcheddriversincluded 49.60 56.10 -12.3 <0.001 20,922
Searcheddriversexcluded 51.97 58.03 -11.0 <0.001 19,353
Note:Missingandnullcasescodedasindicativeof‘nocitationgiven.’AsshowninTable5.18,SDPDofficerscitematchedHispanicandWhitedriversatverysimilarrates.Whensearcheddriversare includedaspartof thematchedsample, thepercentageofdrivers given a citation is nearly identical across races.When searcheddriverswere omittedfrom the sample, the re-matched Hispanic drivers were ticketed 60.67 percent of the time,comparedto59.72forWhites.Table5.18.ComparingcitationratesformatchedHispanicandWhitedrivers
MatchedHispanicdrivers(%)
MatchedWhite
drivers(%)
Difference(%)
p-valueMatchedpairs
Searcheddriversincluded 58.44 58.36 0.1 0.833 41,340
Searcheddriversexcluded 60.67 59.72 1.6 0.007 39,006
Note:Missingandnullcasescodedasindicativeof‘nocitationgiven.’Finally,as is shown inTable5.19,werelativelysmallyetstatistically significantdifferences inthecitationratesofmatchedAPIandWhitedrivers.
97Thecategoricalbalancingrequirements(nostatisticaldifference)weremetforeachoftheindependentvariablesusedtomatchBlack/HispanicandWhitedrivers.

66
Publishedresearchontherelationshipbetweendriverrace/ethnicityandthecitation/warningdecisionhasgenerated inconsistent findings. In somestudies, analystshave found thatBlackandHispanicdriversare less likelytoreceiveatrafficcitationthanWhitedrivers.98 Inothers,data showthatminoritydrivers receivecitationsatgreater rates thanWhites stoppedundersimilarconditions.99NopublishedresearchthatweareawareofexaminesthecitationpatternsofAPIdrivers.Table5.19.ComparingcitationratesformatchedAsian/PacificIslanderandWhitedrivers Matched
Asian/PIdrivers(%)
MatchedWhite
drivers(%)
Difference(%)
p-valueMatchedpairs
Searcheddriversincluded 59.13 57.39 2.99 <0.001 35,847
Searcheddriversexcluded 60.11 58.66 2.44 <0.001 34,884Note:Missingandnullcasescodedasindicativeof‘nocitationgiven.’SummaryWeusedthepropensityscorematchingtechniquetopairAPI,Black,andHispanicdriverswithWhitedriverswhowerestoppedbytheSDPDundersimilarcircumstances.Bymatchingdriversalong these lines we were able to isolate the effect that driver race/ethnicity has on thelikelihoodthateachgroupwillexperienceoneofseveralpost-stopoutcomes.Wefoundthat:
• 8.65 percent of stops involving Black drivers involved a search, a rate 52.7 percentgreaterthanthe5.04percentofmatchedWhitedriverswhoweresearched.Similarly,Hispanicsweresearchedin6.56percentofstops,50.22percentgreaterthanmatchedWhites (3.93 percent). With few exceptions, these disparities were robust across allsearchtypes.
98Engel,R.S.,Frank,J.,Tillyer,R.,&Klahm,C.F.(2006).Clevelanddivisionofpolicetrafficstopdatastudy:Finalreport.Cincinnati,OH:UniversityofCincinnati.SubmittedtotheClevelandDivisionofPolice,Cleveland,OH;Schafer,J.A.,Carter,D.L.,Katz-Bannister,A.,&Wells,W.M.(2006).Decision-makingintrafficstopencounters:Amultivariateanalysisofpolicebehavior.PoliceQuarterly,9,184-209.99Engel,R.S.,Tillyer,R.,Cherkauskas,J.C.,&Frank,J.(2007).Trafficstopdataanalysisstudy:Year1FinalReport.Cincinnati,OH:UniversityofCincinnati.SubmittedtotheArizonaDepartmentofPublicSafety,Phoenix,AZ;Regoeczi,W.C.,&Kent,S.(2014).Race,poverty,andthetrafficticketcycle:Exploringthesituationalcontextoftheapplicationofpolicediscretion.Policing:AnInternationalJournalofPoliceStrategies&Management,37,190–205.Tillyer,R.,&Engel,R.S.(2013).Theimpactofdrivers’race,gender,andageduringtrafficstops:Assessinginteractiontermsandthesocialconditioningmodel.Crime&Delinquency,59,369-395.
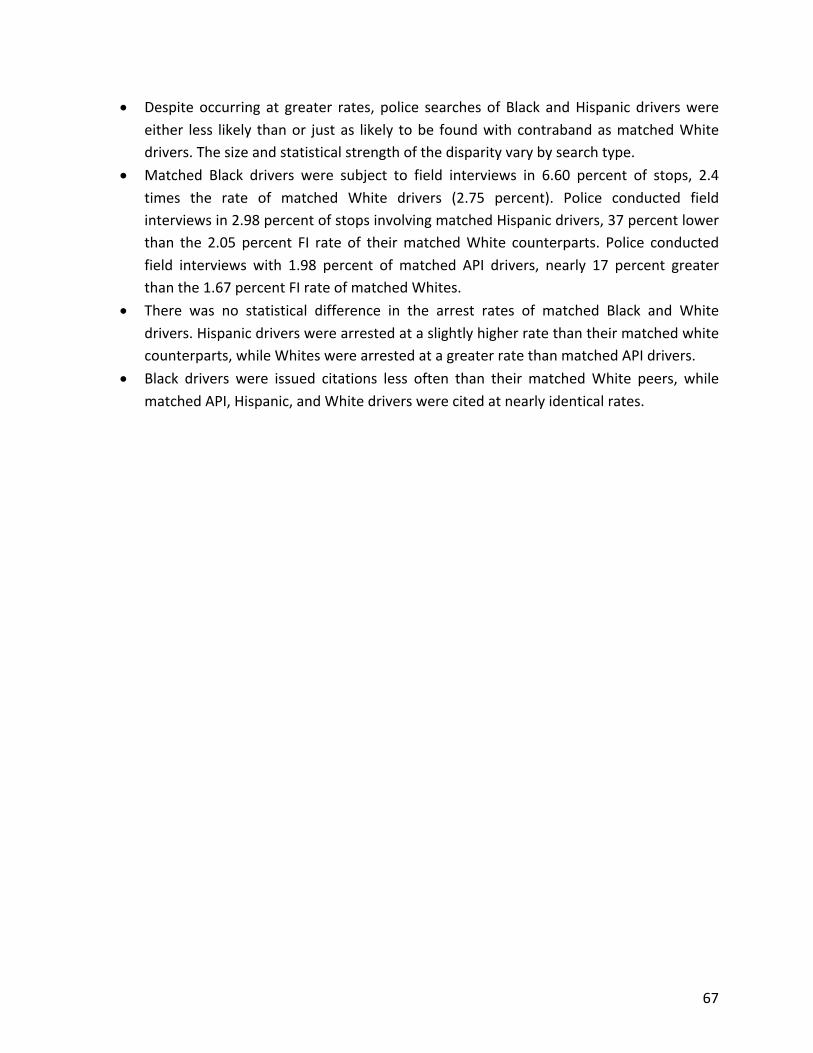
67
• Despiteoccurring at greater rates, police searchesof Black andHispanic driverswereeither less likely thanor justas likely tobe foundwithcontrabandasmatchedWhitedrivers.Thesizeandstatisticalstrengthofthedisparityvarybysearchtype.
• Matched Black drivers were subject to field interviews in 6.60 percent of stops, 2.4times the rate of matched White drivers (2.75 percent). Police conducted fieldinterviewsin2.98percentofstopsinvolvingmatchedHispanicdrivers,37percentlowerthan the 2.05 percent FI rate of theirmatchedWhite counterparts. Police conductedfield interviews with 1.98 percent of matched API drivers, nearly 17 percent greaterthanthe1.67percentFIrateofmatchedWhites.
• There was no statistical difference in the arrest rates of matched Black and Whitedrivers.Hispanicdriverswerearrestedataslightlyhigherratethantheirmatchedwhitecounterparts,whileWhiteswerearrestedatagreaterratethanmatchedAPIdrivers.
• Black drivers were issued citations less often than their matchedWhite peers, whilematchedAPI,Hispanic,andWhitedriverswerecitedatnearlyidenticalrates.

68
CHAPTER6:SUMMARYANDRECOMMENDATIONSSummaryofresearchmethodandfindingsIn this Report,we analyzed several data sources – including records of 259,569 traffic stopsconducted between January 1, 2014 and December 31, 2015, data gathered from 10community focusgroups,anelectronic surveyof theSDPD (n=365),and follow-up interviewswithofficersfromallninepatroldivisions(n=52)–inanefforttoaddressfourbroadquestions:
1. Towhatextent isthereadepartment-levelpatternofracial/ethnicdisparity intheinitiationoftrafficstops?
2. Towhatextentareracial/ethnicdisparitiesintheinitiationoftrafficstopsevidentatthepatroldivisionlevel?
3. Towhatextent isthereadepartment-levelpatternofracial/ethnicdisparity intheoutcomeoftrafficstops?
4. Howdoes SDPD’s traffic enforcement regime affect police-community relations inSanDiego?
The research methodology and findings detailed over the previous several chapters aresummarizedbelow.Inthesubsequentrecommendationssection,wedrawonourfindingsfromthe community focus groups, electronic survey, and officer interviews to contextualize andsupportourrecommendationstotheDepartment.Methodofanalysis:TrafficstopsToproperlyassesstheeffectthatadriver’srace/ethnicityhasonthelikelihoodthatheorshewillbestopped,researchersmustdevelopabenchmarkthatenablesthecomparisonofactualstop rates with a driver’s risk of being stopped in the absence of bias.100 An appropriatebenchmarkmust incorporatethevarious legalandnon-legal factors thatshapethisstoprisk,including:when,where,andhowoftentheydrive;themake,model,andconditionoftheircar;andtheirbehavioranddemeanorwhiledriving.101Thechallengethathasplaguedpastefforts toperformthiskindofanalysis isdrivenbywhatpoliceaccountabilityexpertSamWalkercallsthe“denominator”problem:researchersdonot 100Tillyer,R.,Engel,R.S.,&Cherkauskas,J.C.(2010).Bestpracticesinvehiclestopdatacollectionandanalysis.Policing:AnInternationalJournalofPoliceStrategies&Management,33(1),69-92.101Fridell,L.A.(2004).Bythenumbers:AguideforanalyzingracedatafromVehicleStops.Washington,D.C.:PoliceExecutiveResearchForum;Ridgeway,G.&MacDonald,J.(2010).Methodsforassessingraciallybiasedpolicing.InS.K.Rice&M.D.White(Eds.)Race,ethnicity,andpolicing:Newandessentialreadings(pp.180-204).NewYork:NewYorkUniversityPress;Tillyer,R.,Engel,R.S.,&Cherkauskas,J.C.(2010).Bestpracticesinvehiclestopdatacollectionandanalysis.Policing:AnInternationalJournalofPoliceStrategies&Management,33(1),69-92;andWalker,S.(2001).Searchingforthedenominator:Problemswithpolicetrafficstopdataandanearlywarningsystemsolution.JusticeResearchandPolicy,3(1),63-95.

69
have an accurate way to measure the demographic profile of a city’s driving population.102There are several weaknesses in using Census data as a proxy, including well-establishedracial/ethnicandage-baseddisparitiesbetweenthosewholiveinacityandthosewhodriveonitsroads.103Further,acity’sdrivingpopulationisfluid;thosewhodriveat8ammaylookandactsubstantiallydifferentthanthosewhodriveat8pmacrossmanyrelevantstop-relatedriskfactors.Wecircumventthisproblembyemployingwhatisknownastheveilofdarknesstechnique.Thisapproachrestsontheassumptionthatifstopdisparitiesexist,whetherdrivenbyrace,age,orotherfactors,theywillbemoreapparentamongstopsmadeindaylight,whendrivers’physicalprofileanddemeanoraremorereadilydetectable,thanatnight,whenthesecharacteristicsareobscuredbydarkness.Inanattempttoisolatetheeffectofdriverrace,theanalysisisconfinedto the “inter-twilight period,” or the period between the earliest end of civil twilight(approximately5:09pmonNov.27) and the latest (approximately8:29pmon Jun.27). Thisallowsus to account for changes to thedrivingpopulationduring the courseof theday andobviatestheneedforanexternalbenchmarkagainstwhichtocompareactualstoppatterns.Findings:TrafficstopsComparativeanalysisofdiscretionarytrafficstopsinvolvingBlackandWhitedriversrevealedaninconsistent pattern of results. Our review of the 2014 data (aggregated at the city level)indicatedthatBlackdriverswere19.6percentmorelikelytobestoppedduringdaylighthours,when driver race/ethnicity was visible, than after sundown, when driver race/ethnicity wasobscured by darkness, compared to White drivers. Though the 2014 disparities were morepronouncedwhenthesamplewaslimitedtodriversundertheageof25,theywerenotpresentin the2015dataor in the combined2014/2015data. Similarly,ouranalysisof citywidedatarevealed no indication that officers’ decision to stop Hispanic drivers was affected by thechange from daylight to darkness, regardless of when the stop occurred or the comparisongroupused.In addition toour citywide analysis,we also compared stoppatterns by location.Analysis ofstopsinitiatedindivisionslocatedaboveInterstate8showedthatintheaggregatepolicewerenomore likely to stop eitherBlackorHispanic drivers duringdaylight hours than after dark,compared to White drivers. We found no evidence that Blacks or Hispanics were treateddifferently in the Northern, Eastern, Western, or Northwestern divisions, but statistically 102Walker,S.(2001).Searchingforthedenominator:Problemswithpolicetrafficstopdataandanearlywarningsystemsolution.JusticeResearchandPolicy,3(1),63-95.103Tillyer,R.,Engel,R.S.,&Cherkauskas,J.C.(2010).Bestpracticesinvehiclestopdatacollectionandanalysis.Policing:AnInternationalJournalofPoliceStrategies&Management,33,69-92.

70
significantevidenceofdisparityamongstopsinitiatedintheNortheasterndivision.ComparedtoWhite drivers, Black andHispanic drivers stopped inNortheastern division neighborhoodswere60.2and33.7percentmorelikelytobestoppedindaylightthanafterdark,respectively.Conversely,whentheanalysiswasconfinedtostopsoccurringindivisionsbelowInterstate8,wefoundthatintheaggregateBlackswerenearly20.7percentlesslikelytobestoppedduringdaylighthours,whendriverrace/ethnicityismorelikelytobevisible,thanaftersundown,whenrace/ethnicity is obscured by darkness. Similarly, our review of the nearly 11,000 stopsoccurring below Interstate 8 shows that Hispanic drivers were 28.4 percent less likely toexperience a daytime stop than one occurring in darkness, compared toWhite drivers.WefoundnostatisticaldisparityamongdriversstoppedintheSoutheasternorSoutherndivisions.Centraldivisionstops involvingBlackdriverswere42.8percent less likely tooccurduringthedaythantheyareatnightcomparedtostopsofWhites.HispanicdriversstoppedintheCentraldivision were 45.6 percent less likely to experience a stop during daylight hours than indarkness. Similarly, Hispanic drivers stopped inMid-City were 18.8 percent less likely to bestoppedbeforesundownthanafterdark,comparedtoWhites.Finally, we found no difference in the pattern of stops involving Asian/Pacific Islander andWhitedrivers,regardlessoftheanalyticalapproachtaken(citywideandlocation-based,aswellas theannualandDST-onlyanalyses)or thenatureof the comparison (alldrivers,drivers25andunder).Methodofanalysis:Post-stopoutcomesIn an effort to eliminate potentially confounding explanations for racial/ethnic disparities inpost-stop outcomes, we matched Black, Hispanic, and API drivers with White counterpartsacrossasetofdemographicandstop-basedcharacteristicsusingastatisticaltechniqueknownaspropensityscorematching.Propensityscorematchingallowsresearcherstopairdriversofdifferent races across the various other factors known to affect the likelihood of receiving acitation,beingsearched,arrested,subjecttoafieldinterview,orbeingfoundwithcontraband.Inotherwords, this techniqueenablesamuchmore careful andnuancedcomparisonof thetreatmentofdriverswhosharegender,age,stopreason,stoplocation,andsoon,butdifferbyrace.Analysis of the post-stop outcomes between matched pairs shows statistically significantdifferences in the experiences of Black and Hispanic drivers and their matched Whitecounterparts.

71
Findings:SearchAfter accounting for several possible explanatory factors, we found that Black drivers weresearched by the SDPD following 8.65 percent of discretionary traffic stops, while matchedWhites were searched 5.04 percent of the time. Analysis of specific search types revealedsimilar levels of disparity. Black drivers were 1.85 timesmore likely to submit to a consentsearch and 1.47 times more likely to face an inventory search. The differences were mostextreme in theadministrationof Fourthwaiver searches,whereBlackdriverswere searchedmorethan2.23timesmoreoftenthanmatchedWhites.The data also show similar differences in the search rates involvingHispanic drivers. In fact,dependingonthenatureofthesearch,Hispanicdriverswerebetween17and87percentmorelikely to be searched following a routine traffic stop than were their matched Whitecounterparts. Analysis of search rates involvingmatched API andWhite drivers showed thatWhitedriverswere1.33timesmorelikelytobesearchedthantheirmatchedAPIpeers.Findings:HitrateDespite being subject to higher search rates, Black driverswere less likely to be foundwithcontrabandthanwerematchedWhitedrivers.Hispanicdriverswerealsolesslikelytobefoundholding contraband, again despite being subject to more searches. In fact, contrabanddiscovery rates were lower for searches involving Hispanic drivers, though the statisticalstrength of the differences with pairedWhite drivers varied by search type. NomeaningfuldifferenceswereevidentinthehitratesofmatchedAPIandWhitedrivers.Findings:Fieldinterview,arrest,andcitationFinally, we found statistically significant disparities in the field interview rates of minoritydrivers,andmixedresultsregardingthecitationandarrestratesofBlackandHispanicdriverscompared to matched Whites. For Black drivers, 6.60 percent of stops involved a fieldinterview, some 2.4 times higher than the rate at which matched White drivers wereinterviewed(2.75percent).ThearrestrateofBlackdriverswasnotmeaningfullydifferentfromthatofmatchedWhites,despitetheDepartment’smoreproactiveapproachtosearchingandinterviewingBlackdrivers.WefoundthatBlackdriverswerecitedatlowerrates(49.6percent)thanWhitedrivers(56.1percent)whowerestoppedbytheSDPDundersimilarcircumstances.Our analysis showed that Hispanic drivers were subject to field interviewsmore often thanmatchedWhitedrivers,thoughthedisparitywaslesspronouncedthanwasthecasewithBlackdrivers.TheobserveddisparitybetweenHispanicsandmatchedWhitesdidnotextendtoeitherarrestorthedecisiontoissueacitation.Hispanicdriversweregivencitationsatalmostexactly

72
the same rate as matchedWhite drivers and though we found statistical differences in thearrestratesofthetwomatchedgroups,thepracticaldifferencewasrathersmall(1.71percentarrestrateforHispanicscomparedto1.41percentforWhites).Insum,wefindstatisticallysignificantandmeaningfuldifferencesinthepost-stoptreatmentofBlackandHispanicdriverscomparedtoWhitedriversacrossseveralimportantoutcomes.Inanefforttoputsomeofthesedataintocontext,wehighlightthesubstantialrace-baseddisparitiesinthesearchrate/hitratedata.InSanDiego,matchedBlackdriverswere1.72timesmorelikelytobesearched,and–despitebeingsearchedmorefrequently–were44.2percent less likely tobefoundwithcontraband.Similarly,SDPDofficerssearchedHispanicdriversat1.67timestherateofmatchedWhites,yetwere 46.2 percent less likely to discover contraband following searches of Hispanic driverscomparedtomatchedWhites.Compare these rates to those of two cities recently investigated by the U.S. Department ofJustice.InFerguson,Missouri,theDOJfoundthatBlackdriverswere2.07timesmorelikelytobesearched,yet26percentlesslikelytobefoundwithcontrabandthanwereWhitedrivers.104These disparities contributed to the DOJ’s conclusion that the Ferguson Police Departmentengaged in systematic bias against the city’s Black population.105 In Baltimore, another cityrecentlyfoundbytheDOJtohaveengagedinapatternorpracticeof“discriminatorypolicingagainst African Americans,”106 Black drivers were 23 percent more likely thanWhites to besearched following a traffic stop, yet 74 percent less likely to be found with contraband.107Analysis of data from Los Angeles, California, a city that spent nine years under federaloversight to address a pattern or practice of unlawful police behavior, revealed a similarpattern.108Bycontrast,recentreportsfromtwootherjurisdictionsfoundtohaveengagedinapatternorpracticeofpracticeofunlawfulconduct,Cincinnati,OhioandOakland,California,showedthat 104UnitedStatesDepartmentofJustice,CivilRightsDivision.(2015,Mar.4).InvestigationoftheFergusonPoliceDepartment,p.65.RetrievedSept.8,2016,fromhttps://www.justice.gov/sites/default/files/crt/legacy/2015/03/04/ferguson_findings_3-4-15.pdf.105UnitedStatesDepartmentofJustice,CivilRightsDivision.(2015,Mar.4).InvestigationoftheFergusonPoliceDepartment.RetrievedSept.8,2016,fromhttps://www.justice.gov/sites/default/files/crt/legacy/2015/03/04/ferguson_findings_3-4-15.pdf.106UnitedStatesDepartmentofJustice,CivilRightsDivision.(2016,Aug.10).InvestigationoftheBaltimoreCityPoliceDepartment,p.47.RetrievedSept.8,2016,fromhttps://www.justice.gov/crt/file/883296/download.107UnitedStatesDepartmentofJustice,CivilRightsDivision.(2016,Aug.10).InvestigationoftheBaltimoreCityPoliceDepartment.RetrievedSept.8,2016,fromhttps://www.justice.gov/crt/file/883296/download.108Ayres,I.,&Borowsky,J.(2008),AstudyofraciallydisparateoutcomesintheLosAngelesPoliceDepartment,PreparedfortheACLUofSouthernCalifornia.

73
BlackdriversweremorelikelytobesearchedthanWhites,butfoundlittledifferenceintherateofcontrabanddiscovery.109 Tobeclear,wedonot intendtosuggestthatthesesimilarities indicatethattheSDPDsuffersfrom the same level of the far-reaching, systemic dysfunction revealed by the DOJ’sinvestigationofpolicedepartmentsinFergusonorBaltimore,orthosethatlieatthecenterofreform initiativespursued in theother three jurisdictions.Rather, thecomparison ismadetohighlight the gravity of these particular findings and the pattern of disparate treatment thatexistsacrossseveralpost-stopoutcomes.RecommendationsAs other researchers have recently acknowledged,110 a risk in conducting analyses ofracial/ethnicdifferencesintheratesofcontactwithpoliceandtheoutcomesofthosecontactsis to oversimplify the results. Either the police are racistswho purposefully target people ofcolor, or there are no differences in how people are treated by the police, despite thedisparitiesregularlywitnessedandexperiencedbycommunitiesofcolor.Whilesheddinglighton an important topic, these approaches – either attacking the police or denying thatracial/ethnicbiasexists– inevitablymiss the complexityof the issueand thusdonotofferaproductivewayforward.We follow other recent research on police-community relations in taking a problem-solvingapproachtotheinterpretationofouranalysesofpolicetrafficstopdata.Thatis,inthischapter,we offer potential ways of reducing racial/ethnic disparities in traffic stops and therebyrepairingtheharmsuchdisparitieshaveinflictedonpolice-communityrelations.Inordertodoso,wedrawonnotonly theSDPDtraffic stopdata,butalsodatagathered fromthreeothersources, as described in Chapter 3: focus groups with residents of communities with highnumbersof traffic stops;anSDPD-wideelectronic survey;and in-depth interviewswithSDPDofficers. Here, we draw on all of these data to present a set of recommendations that webelieve, if earnestly implemented,will enable the SDPD to eliminate racial/ethnic disparities.Wefocusourrecommendationsonthreethemes:addressingracial/ethnicdisparities;buildingstrongerpolice-communityrelations;andimprovingdatacollectionpractices. 109Ridgeway,G.,(2009).CincinnatiPoliceDepartmenttrafficstops:ApplyingRAND’sframeworktoanalyzeracialdisparities.SantaMonica,CA:RANDCorporation;Hetey,R.,Monin,B.,Maitreyi,A.,&Eberhardt,J.(2016).Dataforchange:Astatisticalanalysisofpolicestops,searches,handcuffings,andarrestsinOakland,Calif.,2013-2014.StanfordUniversity,CA:StanfordSPARQ,p.136.110See:Hetey,R.,Monin,B.,Maitreyi,A.,&Eberhardt,J.(2016).Dataforchange:Astatisticalanalysisofpolicestops,searches,handcuffings,andarrestsinOakland,Calif.,2013-2014.StanfordUniversity,CA:StanfordSPARQ;Eberhardt,J.(2016).Strategiesforchange:Researchinitiativesandrecommendationstoimprovepolice-communityrelationsinOakland,Calif.StanfordUniversity,CA:StanfordSPARQ.

74
Addressingracial/ethnicdisparitiesTheracial/ethnicdisparitieswefoundinthetreatmentofBlackdrivers–andtoalesserextent,Hispanicdrivers–arebynomeansuniquetotheSDPD.Inrecentyears,analysesofdatafromstateandlocaljurisdictionsacrossthecountryhaveidentifiedsimilardisparitiesintheratesofstops,searches,andarrests.111Moreover,wedidnotfindevidencethatthesedisparitiesweretheresultofdeliberatediscriminationorracismonthepartofSDPDofficers.Rather,asotherresearchers of racial/ethnic disparities in policing have suggested, “many subtle andunexaminedculturalnorms,beliefs,andpracticessustaindisparatetreatment.”112Here,wediscuss4recommendationsaimedtowardtheeliminationofsystemicdisparities: Systemicdisparities
1. Acknowledge the existence of racial/ethnic disparities and make combatting suchdisparitiesapriority;
2. Continuetoenhancetrainingandsupervisionaroundissuesofracial/ethnicdisparities;3. Maketrafficstoppracticesmoretransparent;and4. Maketrafficstoppracticesmoresystematicanddata-driven.
Acknowledgethatracial/ethnicdisparitiesexistandmakecombattingsuchdisparitiesapriorityPrevious research has shown that there is a strong race–crime association not just amongpoliceofficers,butacrossthegeneralpopulationasawhole:Blackfacesaremorefrequentlyassociatedwithcriminalbehaviorthanarenon-Blackfaces,andthisassociationextendstohowBlackpeople– youthandadult alike–are treated throughout the criminal justice system.113Thisisknownasimplicitorunconsciousbias,whichmaybeperpetuatedevenbythemostwell-meaningpeople.Thepost-stopdisparitiesnotedearlierinthisReportsuggestthatimplicitbiasmayexistamongSDPDofficers.
111See,forexamples:Baumgartner,F.,Epp,D.,&Love,B.(2014).PoliceSearchesofBlackandWhiteMotorists.(Durham,NC).ChapelHill,NC:UniversityofNorthCarolina-ChapelHillDepartmentofPoliticalScience.Engel,R.,Cherkauskas,J.,Smith,M.,Lytle,D.,&Moore,K.(2009).TrafficStopDataAnalysisStudy:Year3FinalReport,PreparedfortheArizonaDepartmentofPublicSafety.Cincinnati,OH:UniversityofCincinnatiPolicingInstitute;Ross,M.Fazzalaro,J.,Barone,K.,&Kalinowski,J.(2016).StateofConnecticutTrafficStopDataAnalysisandFindings,2014-2015.ConnecticutRacialProfilingProhibitionProject.112Eberhardt,J.(2016).Strategiesforchange:Researchinitiativesandrecommendationstoimprovepolice-communityrelationsinOakland,Calif.StanfordUniversity,CA:StanfordSPARQ,p.4.113Eberhardt,J.,Goff,P.,Purdie,V.,&Davies,P.(2004).SeeingBlack:Race,crime,andvisualprocessing.JournalofPersonalityandSocialPsychology87(6),876-893;Rattan,A.,Levine,C.,Dweck,C.,&Eberhardt,J.(2012).RaceRaceandthefragilityofthelegaldistinctionbetweenjuvenilesandadults.PLoSONE7(5);Hetey,R.&Eberhardt,J.(2014).Racialdisparitiesinincarcerationincreaseacceptanceofpunitivepolicies.PsychologicalScience25(10),1949-1954.

75
Thefirststepinaddressingtheissueofracial/ethnicdisparitiesisacknowledgingthattheyexistandmakingitadepartmentalprioritytocombatsuchdisparities.WeacknowledgetheSDPD’srecenteffortstodothisbyincorporatingcurriculaonimplicitbias,emotionalintelligence,andculturalcompetencyintoitstrainingforfront-lineofficersandsupervisors(seeAppendix11foradescriptionoftheSDPD’scurrentofficertrainingrequirements).Perhapspartlyduetotheserecenttrainingefforts,SDPDofficersappeartoalreadybeawareofthese issuestosomeextent. Inourelectronicsurveyofthedepartment,weaskedofficerstoassesswhethertheybelievedvariousracial/ethnicgroupsfeelcomfortableinteractingwiththeSDPD. Just over a third – 38.8 percent – of officers who responded to our survey stronglyagreed or agreed that Blacks feel comfortable interacting with the SDPD. In contrast,substantiallymoreofficers believednon-Black citizens feel comfortable: 61.5percent believeHispanics feel comfortable; 80 percent believe Asians feel comfortable; and 87.5 percentbelieveWhitesfeelcomfortableinteractingwiththeSDPD.Wealsoaskedofficerswhethertheybelievetheseracial/ethnicgroupshaveconfidence intheSDPD. The officers who responded to our survey believe Blacks have the lowest confidencelevelsintheSDPD:35.2percenteitherstronglyagreedoragreedthatBlackshaveconfidenceintheSDPD,while60.5percentbelievedHispanicshaveconfidence;78.9percentbelievedAsianshave confidence; and 85.9 percent believed Whites have confidence in the SDPD. Theseresponses indicate that officers are aware of how they may be perceived by differentracial/ethnicgroups.However, only 4.23 percent of our electronic survey respondents strongly agreed or agreedthatracial/ethnicbiasisagenuineproblemfortheSDPD.Ininterviewswithofficers,wesoughttoprobedeeperintothesebeliefs.Whenaskedwhethertheywouldbesurprisedifwefoundracial/ethnicdisparitiesinouranalysisofthetrafficstopdata,thevastmajorityofofficerswespoke to expressed beliefs in line with our survey respondents, stating that they would besurprised if racial/ethnicbiasweretobefoundtoexist inhowtrafficstopsareconductedbythe Department. A typical explanation offered to us by officers is that the demographics ofdriverswhoarestoppedareareflectionofthecompositionofthepatrolarea.Asoneofficerexplained,
ThecommunityIworkinisapredominantlyHispaniccommunity.ThepeopleIpullover,ifyoupullmydata,it'sgonnashowthatthepeopleIpulloverareHispanic…Sothere'sdisparitythere,thatI'mpullingoverHispanicsmorethananyothergroupoutthere.Butit'snotbecauseofmyperceptionorofaracistviewIhave,it'sbecauseofwhereIwork.

76
Indeed,manyoftheindividualofficerswespoketoadamantlystatedthatnotonlydotheynotmakeindividualdecisionsbasedonrace/ethnicity,butalsothatinthetrafficstopcontext,theyfrequentlycannotseetherace/ethnicityofthedriverpriortopullingthemover.Only a handful of officers directly stated that race/ethnicity is a factor –whether explicit orimplicit–inhowtrafficstopdecisionsaremade.Theseofficersspokeaboutthe“race/ethnicityoutofplace”approach,114inwhichofficersdeliberatelytargetindividualswhoserace/ethnicitydoesnotfitthedominantdemographicsofthearea.Officersreadilyofferedexamplesofthis,suchasstoppingaWhitepersoninapredominatelyBlackareaoftheSoutheasterndivision,oraBlackpersoninamajority-WhiteareasuchasLaJolla.Asoneofficercandidlynoted,“I'mnotgoingtolie.IfIseesomebodythat'stotallyoutofplaceandthere'sareasontostopthem,I'mgoingtostopthemandaskthemwhatthey'redoing.Imean,I'mbeingtruthful.Unfortunately,itsucks.It'snotlikeI'mtryingto.”Mostotherofficers,however,deniedusingrace/ethnicityinthisway.Oneofficerwhovoicedatypicalstatementaboutthisexplained,“Iamnotlookingatwhothedriveris,whethertheyaremale,female,orwhatethnicitytheyare.ThatisnotwhatIamlookingforbecauseIdonotwriteacitationbasedonyourethnicity.Iwriteitbasedonthemovingviolationortrafficviolationthatyoudid.”ContinuetoenhancetrainingandsupervisionIn response to thePERF report, theSanDiegoPoliceDepartmenthasalreadymadeprogresstoward establishing a comprehensive training program for its patrol officers and supervisingofficers (see Appendix 11). As of the July 2016 Public Safety and Livable NeighborhoodsCommittee meeting, the SDPD had not only implemented an annual supervisor training onprocedural justice, but had also added competency in procedural justice and communitypolicingconceptstoitspromotionaltestingprocess.TheSDPDhasalsoincorporatedatwo-day“effectiveinteractions”classonunconsciousbiasforallnewofficers.115TheDepartmentshouldbecreditedforitspromptresponsetotheserecommendations.AstheSDPDmakes implicit bias curriculum amandatory part of how both new and veteran patrolofficers,sergeants,andcommandstaffaretrained,itshouldtrackofficersatisfactionwiththetrainingtoensuremaximalefficacyofandofficerbuy-intotrainingontheseimportanttopics.
114Carroll,L.&Gonzalez,M.L.(2014).Outofplace:Racialstereotypesandtheecologyoffrisksandsearchesfollowingtrafficstops.JournalofResearchinCrime&Delinquency,51(5),559-584;Novak,K.&Chamlin,M.(2012).Racialthreat,suspicion,andpolicebehavior:Theimpactofraceandplaceintrafficenforcement.Crime&Delinquency,58(2),275-300.115Zimmerman,S.(July2016).UpdateoftheSanDiegoPoliceDepartment’sresponsetothePoliceExecutiveResearchForum(PERF)recommendations.TestimonysubmittedtothePublicSafetyandLivableNeighborhoodsCommitteeoftheSanDiegoCityCouncil.

77
While not indicated in Chief Zimmerman’s testimony, the unconscious bias training maycurrentlybedrawnfromtwoproviders.116First,theFairandImpartialPolicing(FIP)program117educates patrol officers about how such bias affects people’s perceptions and can therebyaffect the actions that they take, as well as providing tools to help officers recognize theirconsciousandunconsciousbiasesandinsteadtakeactionsthatareunbiased.Trainingforfirst-line supervisors (sergeants) helps these officers to identify when their supervisees may beengaginginbiasedbehavioraswellastoeffectivelyaddresssuchbehavior.Second, the Principled Policing training has been developed by California’s Department ofJustice in partnership with Stanford University’s Social Psychological Answers to Real-worldQuestions (SPARQ) organization. Principled Policing is the first Commission on Peace OfficerStandardsandTraining (POST)-certified trainingonprocedural justiceand implicitbias in theU.S. Thus far, it has been offered to police leaders throughout California, including torepresentativesoftheSDPD,withpositiveresults.118When we asked our community focus group participants about how to improve police-community relations, many agreed that law enforcement would benefit from training thatwould enhance their ability to understand – and effectively respond to – local residents,particularlythosefromdiverseculturalbackgrounds.Tworesidentsfromdifferentdivisionsputitthisway:
Itneedstobemoreofapartnershipmodel.Policeareinthepowerpositionandinsteadof being more militarized, they need to be more emotionally trained. They are notsoldiers;theyareheretokeeppeace.Comearoundmore,smile.(Centraldivision)
Iwish [thepolice] tookabody language class.A lotof things that aregoingwrong isbecausetheydon’tunderstandthebodylanguageofthecommunityortheculturesofpeople of color.We speak really loud. If these officers are not fromour culture theydon’tunderstandthat.(Southeasterndivision)
We note that the SDPD has recently added training in emotional intelligence and effectiveinteractions to its new officer phase training and we encourage the tracking of officersatisfactionwithsuchtraining. 116However,wenotethatathird,morecomprehensiveintervention,consistingnotonlyofimplicitbiastraining,butalsotrainingaroundproceduraljusticeandreconciliation,iscurrentlybeingpilotedinsixU.S.citiesbytheNationalInitiativeforBuildingCommunityTrustandJustice.See:https://trustandjustice.org/.117http://www.fairandimpartialpolicing.com.118https://oag.ca.gov/sites/all/files/agweb/pdfs/law_enforcement/principled-policing-white-paper.pdf.

78
MaketrafficstoppracticesmoretransparentTrafficstopscanbeoneofthemostdangerousactivitiesapatrolofficerengagesinonaregularbasis;thereisnosuchthingasa“routine”trafficstop.Indeed,avastmajorityofofficerswhorespondedtoourelectronicsurvey–96.1percent–stronglyagreedoragreedthatconductingatrafficstopisaninherentlydangerousactivity.Recenteventsinvolvingthedeathsofdriversandofpoliceofficers–includingatragicincidentinthesummerof2016hereinSanDiego119–furtherheightenthetensionforallinvolved.SDPDofficersreceiveextensivetrainingonhowtomanagetheirownsafetyandthesafetyofthecarstheypullover,fromhowtopositiontheirvehiclesinrelationtothatofthecarstheyhavestoppedtohowtoapproachacarandidentifypotential threats to their safety. Yet this trainingdoes not eliminate thepalpable sense thatanythingcanhappenduringatrafficstop.Asoneofficerdescribedittousduringaninterview,“EverytimeIstopacar,Ihavenoclue.Iamstoppingthemforaviolation.Ihavenocluewhattheyhavejustdone,whattheyweregoingtogodoorwhattheymighthave...Itisyourmostdangerous[partofthejob]–youarerollingthediceeverytime.”Sometrafficstopsmayfurther impairpolice-communityrelations,particularly incommunitieswhere these relations may already be strained. Several San Diego residents we spoke withexpressed a belief that traffic stops are conducted in a discriminatory fashion. As oneSoutheasternresidentput it,“ninetimesoutof ten, it'speopleofcolor [beingpulledover]...Thatwillmakethemfeelworseaboutthepolicebecausetheymakeyoufeelalienatedbecauseofyourskincolor.”Several focus group members also expressed concern over the practice of calling multiplepatrolvehiclestothesceneofavehiclestop.Acommonrefrainwasthatsuchpracticeshavetheeffectofheighteningtheanxietyofthedriver,therebycontributingtothevolatilityoftheinteractionandalienatingothermembersofthecommunity,manyofwhomseethispracticeasagratuitousorevenprovocativedemonstrationofforce.AsoneresidentoftheSoutheasterndivisionstated,
Iftheyarepullingpeopleover,itdoesn'ttakefour[cars]topullsomeoneover.It'sverydisrespectful and makes more of a scene. I don't know if it's to show power. Iunderstand if it's two...if someonedoesn't have a partner they needhelp. It's alwaysthreeormore.
119Kennedy,M.(2016,July29).SanDiegopoliceofficershotandkilled,anotherinjuredfollowingtrafficstop.SouthernCaliforniaPublicRadio.RetrievedonAug.24,2016fromhttp://www.scpr.org/news/2016/07/29/63075/san-diego-police-officer-shot-and-killed-another-i/.

79
Ininterviews,officersunderscoredthevalueoftheroutinepracticeofofficersprovidingback-upduringtrafficstopsduetotheperceivedpotentialdangersofsuchstops.Whilethisback-upwasappreciated(andreciprocated)bythepatrolofficersweinterviewed,ittendstoengenderresentment among community residents, particularly those who may not understand theperceived and real risks that officers face during these encounters. Reducing the number ofstops made for violations not directly related to public safety may indirectly improvecommunityrelations,givencommunitymembers'perceptionsaboutsuchstops.Maketrafficstoppracticesmoresystematicanddata-drivenAmongstthemanyrecommendationsrecentlyissuedbyPresidentObama’sTaskForceon21stCenturyPolicing120wasthefollowing:
Law enforcement agencies and municipalities should refrain from practices requiringofficerstoissueapredeterminednumberoftickets,citations,arrests,orsummonses,orto initiate investigative contacts with citizens for reasons not directly related toimprovingpublicsafety,suchasgeneratingrevenue.
Wefoundnoevidenceoftheuseofquotas,norpressuretoissuecitationstoincreaserevenue.TheSDPDandtheCityofSanDiegoshouldbecommendedforthis,inlightofrecentfindingsofaprofitmotiveunderlyingtheissuanceofcitationsinotherjurisdictionsacrossthecountry.However,weurgetheSDPDtomakeitstrafficstoppracticesmoresystematicanddata-driven.TrafficstopsinSanDiegoappeartobeinconsistentlyusedasanenforcementtool,whichmayfurther contribute to negative perceptions of SDPD activity. In interviews, SDPD officersdescribedhighlyvaryingapproachestoandjustificationsformakingtrafficstops.Someofficerswespokewithfrequentlydescribedtrafficstopsasbeingusefulforeducationalpurposes,suchasremindingdriversthattheyshouldnotbetextingwhiledriving,whileothersstatedthattheyhardlyconductanytrafficstopsatall.Stillotherstoutedtheinvestigativeusefulnessoftrafficstopstouncovercriminalactivity.Thisspeakstoahighly-individualizedapproachtothisformoflawenforcement,whichsuggestsonewayinwhichdisparatetreatmentcanarise.AsnotedinChapter5,ouranalysisoftrafficstopdatarevealedthatoutofthe259,569stopsconductedin2014and2015,only981resultedinthediscoveryofcontraband.Thismeansthatcontrabandwasfoundinfewerthanoneoutofevery260trafficstopsconductedbytheSDPDinthepasttwoyears.Otherpost-stopoutcomesindicativeofcriminalinvestigationactivityare
120President’sTaskForceon21stCenturyPolicing.(2015).FinalReportofthePresident’sTaskForceon21stCenturyPolicing.Washington,DC:OfficeofCommunityOrientedPolicingServices,p.26.RetrievedAug.24,2016,fromhttp://www.cops.usdoj.gov/pdf/taskforce/Implementation_Guide.pdf.

80
similarlyrare:acrossthetwoyears,roughly4.4percentofallstopsledtoasearch,2.7percentled to a field interview, and1.3 percent led to an arrest. Collectively, the finding that trafficstops yieldminimal crime control valuewhilepotentially contributing to thedeteriorationofpolice-community relations point to the need for a reconsideration of how traffic stops areused in lawenforcement.This recommendation is in linewithwhatother researchersof thistopic have noted – that “the benefits of investigatory stops are modest and greatlyexaggerated,yettheircostsaresubstantialandlargelyunrecognized.”121Giventhepost-stopdisparitiesdiscoveredinouranalyses,weurgetheDepartmenttoconsiderhowitmightdeviseandimplementpolicyguidingtrafficstopstoaddressthisissue.Strengtheningpolice-communityrelationsDrawing primarily on the datawe collected from our community focus groups and in-depthinterviewswithSDPDofficers,aswellastheevidence-basedrecommendationsrecentlymadeby other researchers, we discuss two recommendations for strengthening police-communityrelations,particularlyinpolicedivisionswheretheserelationsmaycurrentlybestrained:
1. Makecommunityengagementacoredepartmentalvalue,and2. Improvecommunicationandtransparencyregardingpolicepractices.
MakecommunityengagementacoredepartmentalvalueCommunityresidentswhoparticipatedinourfocusgroupsindicatedastrongdesiretoseeandinteract with police officers in their neighborhoods, and to get to know them in non-crimecontrol situations. Residents expressed their belief that the best way to improve police-community relations is to expand opportunities for positive police-community interaction.Likewise,many of the officerswe interviewed, particularly thosewhowork in divisionswithhigherlevelsofcrimeandpoliceactivity,expressedawarenessthatpolice-communityrelationsmustbe improved.ThesefindingsarewhollyconsistentwiththoseofthePERFreport,whichfound a belief among some members of the community that the SDPD has becomedisconnected from the communities it serves.122 Thus, we urge the Department to makecommunity engagement a core departmental value. We note that this is a centralrecommendation of President’s Task Force on 21st Century Policing, which stated that “incommunitiesthathavehighnumbersof interactionswithauthoritiesforavarietyofreasons,
121Epp,C.,Maynard-Moody,S.,&Haider-Markel,D.(2014).Pulledover:Howpolicestopsdefineraceandcitizenship.Chicago,IL:UniversityofChicagoPress,p.153.122PoliceExecutiveResearchForum(PERF).(2015).Criticalresponsetechnicalassessmentreview:Policeaccountability-findingsandnationalimplicationsofanassessmentoftheSanDiegoPolicedepartment.Washington,DC:OfficeofCommunityOrientedPolicingServices,U.S.DepartmentofJustice,p.55.

81
policeshouldactivelycreateopportunitiesforinteractionsthatarepositiveandnotrelatedtoinvestigationorenforcementaction.”123Themost frequent example officers offered of the sign that police-community relations aresuffering in at least somepartsof SanDiegowas theprevalenceof the “one-finger” (middlefinger) wave rather than the “five-finger” wave. Officers use this as an indication that theirpresenceisn’twelcome,andthatanyeffortsatoutreachwouldbefutile.Asoneofficerputit,
I knowthat thepeoplearenotalwaysverypolice-friendly. Iwouldnever stopmycarand just say, ‘howareyoudoing?’because Iamgoing toget theone-finger salute… Ithink in a community where people aremore police-friendly, as you drive down thestreet,ifIweretowaveatsomeone,theywouldwavebackorsmile.Youlearnpeople’sbodylanguage.Theyintentionallyturnaway…Yougetthefeelingthattheydonotlikepoliceinthatarea.
Theseofficersexpressedadesire forgreatercommunityconnection,andsome lamentedthefact that therewas little or no time for community engagement or proactive policing, givenstaffing constraints and the ongoing demands of calls for service. It was clear from theseinterviewsthatpatrolofficers'participationincommunityeventsacrossthenineSDPDdivisionsishighlyvariableandvoluntary.When asked what strong, positive police-community relations would look like, residentsemphasizedthattheywouldinvolvemorenon-serviceandnon-enforcementinteractionswiththeofficerswhopolicetheircommunities.Theresidentswespokewithhadmanysuggestionsforthetypesofactivitiestheywouldliketoengageinwiththeofficers.Itisimportanttonotethatsomeoftheseactivitiesarealreadyoccurring,butunevenlyacrossthecity.OneresidentoftheSoutheasterndescribedherattendanceatonesucheventandhowthisexperiencemadeherlongformoresimilaropportunitiestoengagewithofficers:
IwenttoaneventinSkylineanditwasawesometoconnectwiththecommunity.Thepolice low-riderswere out and theywere bumping old-school and itwas cool to seeSTARPAL (SportsTraining,Academics,Recreation/PoliceAthletic League). Itmademewishthereweremoreprogramstohelpkidsrespectthepolice.Thisexperiencelastyearmademefeelmoreconnectedtothepolice,likewhenIwasakid(andthereweremanymoreeventsbetweenpoliceandresidents).
123President’sTaskForceon21stCenturyPolicing.(2015).FinalReportofthePresident’sTaskForceon21stCenturyPolicing.Washington,DC:OfficeofCommunityOrientedPolicingServices.RetrievedAug.24,2016,fromhttp://www.cops.usdoj.gov/pdf/taskforce/Implementation_Guide.pdf.

82
Similarly, a resident from the Southern division had these suggestions for fostering positiverelations:
… a carnival to get to knoweach other--for residents and police to say hi and get toknoweachother;acommunitymeetingeverymonthwherewetalkaboutourfearsandconcerns;communityoutreachbythecopsinourcommunity.It’snotusagainstthem—theyareheretohelp,solet’sworktogether.
Theresidentswespokewithwanttogettoknowtheirlocalpoliceofficersandwantthepolicegettoknowthem;theywouldliketoseepoliceoutoftheircarsandinteractingwithresidents.Severalresidentsstressedtheimportanceofnurturingrelationshipsbetweenpoliceandyouth,sothatfuturerelationshipswiththecommunityandlawenforcementwillimprove.AsaCentraldivisionresidentobserved,
Ifofficerswouldattendcommunityeventswithkidsorteenagers,thatwouldgofarwithrespect. Be a part of the community…not in your uniform. Go to schools, go to thecommunity garden. Itwill just take the policeDepartment towant to do that.Whenpeopleseethattheyareonthesameleveltheywillfeelfreertoexpressthemselvesandgetthehelptheyneed.
Ourfocusgroupparticipants'suggestionsechothosenotedintherecentanalysisoftheSDPDconducted for the PERF report, in which the most frequent suggestions from communitymemberswere related tomaximizing police-community engagement “through proactive andpositiveinteractions.”124WeacknowledgetheSDPD’sexistingcommunityengagementactivities.Inourinterviewswithofficers at all nine SDPD divisions, it was evident that each division's CommunityLiaison/ResourceOfficershaveattemptedtoconnectwithresidentsthroughawidevarietyofmeetings and events and are disseminating information and sharing resources in multiplevenues.Further, it isclear frombothourofficer interviewsandcommunity focusgroupsthatmanypatrolofficersarecommunity-mindedandenjoyopportunitiestopositivelyengagewithresidentswhileonpatrol.InadditiontothevariouscommunitysafetyandpreventionprogramsofferedthroughtheSDPD,includingtheyouthprogramsSTARPALandKIDZWATCHAcademy,the Department also collaborates with local clergy and advocacy groups in various
124PoliceExecutiveResearchForum(PERF).(2015).Criticalresponsetechnicalassessmentreview:Policeaccountability-findingsandnationalimplicationsofanassessmentoftheSanDiegoPolicedepartment.Washington,DC:OfficeofCommunityOrientedPolicingServices,U.S.DepartmentofJustice,p.22.

83
neighborhood-based initiatives.125 Another way the SDPD currently promotes communityengagement is throughaprogramcalled InsideSDPD, inwhich some sessionsofnewofficertrainingthateverynewrecruitattendsareopentothepublic.InsideSDPDallowscitizenstheopportunity to receive someof the same training theDepartmentprovides to its officersontopicssuchasuseofforce,proceduraljustice,andnon-biasedbasedpolicing.WerecommendthattheSDPDcreateasystemtomakepositive,community-basedinteractionsandactivitiesafundamentalcomponentofofficers’rolesandtoincentivizeofficers’communityengagement activities. We also recommend that the SDPD further publicize and raiseawarenessaboutexistingcommunitymeetingsandevents,andcreateadditionalopportunitiesforofficersandthecommunitytointeract.Wesuggestthatsuchinteractionsinvolvemoreofeachpolicedivision'sofficers–not justCommunity Liaison/Resourceofficers–perhapsonarotatingbasis,andthatthecommunitieswithhighercrimeandlowerpolicetrustareprioritizedinthisprocess.ImprovecommunicationandtransparencyregardingpolicepracticesBoth community residentsand lawenforcementofficers interviewed inour study recognizedthattensionexistsanddesiredbettercommunicationandunderstanding. Severalofficerswespokewithwishedcommunitymembersbetterunderstood thechallengesandconstraintsoftheir jobs,andmanycommunitymembersdesiredmore informationabout localcrime issuesandpolicedecision-making.Policeofficersexpressedadesireformorecitizenstorequesttogoon police ride-alongs so they couldwitness the challenges officers regularly face.126 Citizenswishedofficerswouldsharemoreinformationaboutcrimeproblemsintheircommunitiesandeffortsunderwaytoaddressthem.Aspreviouslynoted,theyalsodesiredmoreinteractionandcollaboration.Expandingandimprovingthelinesofcommunicationbetweenpoliceandresidentsshouldbeahigh priority. The SDPD should seek additional opportunities for information-sharing andclarification of police practices and procedures in the communities they serve. Greatertransparency and communication about these practiceswill strengthen community trust andperceptions of police legitimacy.127 Ongoing communication strategies utilizing social mediaoutlets(Facebook,Twitter,Nextdoor,etc.)andwebsitesshouldcontinue,butmoreface-to-face
125SeetheSDPDwebsiteformoreinformationoncommunitypolicingandcrimepreventionactivities:https://www.sandiego.gov/police/services/prevention/programs(RetrievedSept.28,2016).126Anymemberofthecommunitycanrequestaride-alongthroughthisonlineform:https://www.sandiego.gov/sites/default/files/legacy/police/pdf/RideAlong.pdf(RetrievedSept.28,2016).127See:AdvancementProjectandPolicyLink.(2014).Engagingcommunitiesaspartners:Strategiesforproblemsolving.PartoftheBeyondconfrontation:Community-centeredpolicingtoolsseries.LosAngeles,CA:UrbanPeaceInstitute.RetrievedSeptember8,2016,from:http://www.urbanpeaceinstitute.org/key-projects/.

84
outreach isneeded,especially inthecommunitieswherepolicetrust is lowandresidentsareconcerned about crime and safety, yet suspicious of police crime control strategies. In ourstudy, Southeastern andMid-City were the communities that weremost vocal in asking forgreaterpolicecommunication.AstwoSoutheasternresidentsnoted:
They could do more meetings, maybe get involved in neighborhood watches. Thecommunityneedstohaveawareness(aboutlocalcrimeproblems)andgettoknowthecops;giveustheircardsanddooutreach…buildarelationshipbetweenthepoliceandtheschooldistrict.
If theywouldactuallywalkbeatsandgettoknowpeople; Iwould like if theyhaveanofficermeetandgreettointroduceyourselforshareinputorsuggestions—toincreasefamiliarity.
The SDPD is to be credited for the communication and information/resource disseminationalready underway, but additional work is needed. As noted in the previous section, severalresidents expressed concern and confusion about traffic stoppractices in their communities,particularlyrelatedtothenumberofcarsandofficersinvolvedinsuchstops.TheSDPDshouldexplaintherationalebehindthesedecisionsandaddresscommunities’concerns.Obtainingthesupport of communitymembers in local law enforcement can be a challenging task, butwenote that there are several effectivemodels for doing so.128We recommend that the SDPDconsider adopting one of these models, and in doing so, identify new ways to promotetransparencyandcommunicateinformationaboutlocalcrimeandpoliceenforcementpracticeswithcommunityresidents,particularlyinneighborhoodswithhigherlevelsofpolicepresence,wherepolice-communityrelationsaremoststrained.ImprovingdatacollectionFinally, we include five broad recommendations germane to the collection, analysis, anddisseminationofdatarelatedtoSDPD’strafficenforcementregime:
1. Revisethecurrentdatacollectionsystem;2. Coordinateexistingdatacollectionefforts;3. Collectadditionaldata;and
128See:President’sTaskForceon21stCenturyPolicing.(2015).FinalReportofthePresident’sTaskForceon21stCenturyPolicing.Washington,DC:OfficeofCommunityOrientedPolicingServices.RetrievedAug.24,2016,fromhttp://www.cops.usdoj.gov/pdf/taskforce/Implementation_Guide.pdf;AdvancementProjectandPolicyLink.(2014).Engagingcommunitiesaspartners:Strategiesforproblemsolving.PartoftheBeyondconfrontation:Community-centeredpolicingtoolsseries.LosAngeles,CA:UrbanPeaceInstitute.RetrievedSeptember8,2016fromhttp://www.urbanpeaceinstitute.org/key-projects/.

85
4. StrengthenaccountabilityandoversightofdatacollectionandmanagementRevisethecurrentdatacollectionsystemTheDepartment’scurrenttrafficstopdatacollectionsystem,whichreliesheavilyonthetrafficstop data card, produces duplicative, often inaccurate and unreliable data, is unnecessarilytime-consuming, and harmful to officermorale. For these reasons, we recommend that theSDPDdiscontinuetheuseof thetrafficstopdatacard in favorofasystemthatcapturesandcompilesdatagatheredbyofficersthroughothermeans.Stopcarddataareduplicative.Attheconclusionofatrafficstop,SDPDofficersmustdocumentthecontactinseveraldifferentways.Ifthestopinvolvedtheissuanceofacitationorawrittenwarning, the officer must complete the requisite paperwork. The officer must complete anadditionalsetofformsiftheyconductafieldinterview,asearch,oranarrest.Next,theymustdescribeeveryencounterinaseparateform,calleda“journal,”aninternalmechanismusedtotrackofficerproductivity.Theymust then submitanadditional form logging theirbody-worncamerafootage.Finally,theymustthencompletethetrafficstopdatacard.Ininterviews,SDPDofficersdescribedthisdocumentationprocessasbothtime-consumingandfilledwithredundancy.Manyalsonotedthatmuchofthedatacapturedbyvehiclestopcards,includingdriverrace,gender,age,andstoplocation,isinformationalreadycapturedbymanyoftheotherformstheysubmit.Thisisakeypoint:EliminatingthetrafficstopdatacardwillnothindertheDepartment’sability todocumenttrafficenforcementpatterns,norwill thepublicloseoversightability.Excessivepaperworkisanotedsourceofofficerstress,129afactnodoubtamplifiedbystaffingshortagesandotherresourcedeficiencies.Whetherowedtothetimeittakestocompletethepaperwork,thenotionthattheyarenottrustedandthusmustdocumenteveryactiontaken,orsomeotherreason,webelievethatthestressassociatedwiththeuseofthetrafficstopcardscontributestorelativelylowmoraleDepartment-wide.Stop cards harm officer morale. Lingering questions about the broad purpose of the datacollectioneffortandthestopcarddatainparticularlikelycontributetothesensethatthestopcardsrepresentunnecessary,extraneous,andevenfrivolouswork.Inthewordsofoneofficer,“The collection of traffic stop data is useless.” Others called the process a “waste of time,”
129Crank,J.P.,&Caldero,M.(1991).Theproductionofoccupationalstressinmedium-sizedpoliceagencies:Asurveyoflineofficersineightmunicipaldepartments.JournalofCriminalJustice,19,339-349;Zhao,J.S.,He,N.,&Lovrich,N.(2002).Predictingfivedimensionsofpoliceofficerstress:Lookingmoredeeplyintoorganizationalsettingsforsourcesofpolicestress.PoliceQuarterly,5,43-62.

86
“worthless,” “stupid,” and a “joke.” Officer survey responses make the point moresystematically: 72 percent of respondents either disagreed or disagreed strongly with thenotionthat“completingthetrafficstopdatacardisaworthwhileuseofofficertime.”Severalofficers also reported feeling as though thedata gatheredwouldbeused tounfairly portraytheir work as biased. As one officer put it, “[r]egardless of the outcome, the data will bemisconstruedandmanipulated.” In thewordsofanother, “[in completing the card], I feel asthoughI’mhavingtoproveI’mnotaracistaftereverytrafficstop.”Theeffectsofofficercynicismoveruseofthestopcardsappearstostretchbeyondmorale.Inanefforttoavoidbeingcharacterizedasbiased,severalofficersdiscussedinstanceswheretheychosenottosubmitastopcardfollowingastopinvolvingminoritydrivers,ormislabelingthedriver’s race/ethnicity on the stop card.Others acknowledged choosing not to stopminoritydrivers altogether in hopes of avoiding the possible ramifications of the encounter. That thedatacollectionregimeiscontributingtowhatscholarsrefertoasdepolicingsuggestsstronglythatthereisneedforreform.Stopcarddataareunreliable.Aswenoted inChapter3,andverymuch related to thepointaboutdepolicing,thetrafficstoprecordsusedinthisanalysiswasofrelativelylowquality.Thedatasetcontainedseveralinstancesofmissingdata,aproblemthatwasmostapparentamongpost-stopvariables.Datachartingthe issuanceofcitationsorwarningswasabsent from10.6percentof the259,569stopsrecordedbetween2014and2015.Dataonfield interviews(7.9percent),searches(4.4percent),andarrests(4.1percent),werealsomissinginrelativelyhighvolume.Ofthepoorestqualityweredataassociatedwiththediscoveryofcontrabandandtheseizureofproperty,whereover93percentwereeitherleftblankorambiguouslylabeled,‘null.’Theproblemsassociatedwithmissingcasesareamplifiedbywhatappearstobethesubstantialunder-reporting of traffic stops. As we have noted previously, SDPD records indicate that183,402traffic ticketswere issuedbetweenJanuary1,2014andDecember31,2015.Yet theDepartment’s stop carddatabase includes records of only 145,490 stopswheredriverswereissued a citation. The sizable difference between actual citations and reported citationssuggeststhattensofthousandsoftrafficstopswentundocumented.Thisdisparityraisessignificantquestionsaboutthereliabilityofdatasetusedforthisanalysis,particularly in light of missing stop card data and the inconsistent month-to-monthenforcementtrends.Thesedataqualityissuesarenotnew.Infact,Cordnerandhiscolleaguesraisedaverysimilarsetofconcernsintheir2001analysisofSDPDtrafficstops:
87
This very substantial [year-to-year] decrease [in stop card records] raises seriousquestionsaboutthevalidityofthevehiclestopdata.Onequestion iswhetherofficersalways filled out the vehicle stop forms – the answer to this is clearly no. A naturalfollow-upquestionaskswhatthecomplianceratewas–thiscanonlybeestimated,butitappearstohavebeenabout60%.130
The consistency of our findings with those articulated by Dr. Cordner speaks to a series ofsystemicweaknessesthatmustbeaddressedbeforetheSDPDisabletogenerateathorough,accuratereportingofofficertrafficenforcement.Forthesereasons,werecommendeliminatingthe use of the traffic stop data card and replacing the current systemwith amodified datacollectionandmanagementinfrastructure.CoordinateexistingdatacollectioneffortsTherecommendationtoreplacethetrafficstopdatacardispredicatedonthedevelopmentofa more effective, more efficient system for tracking vehicle stops and post-stop outcomes.Collectionofstopcarddatashouldnotbediscontinuedunlessanduntilaviablereplacementsystemisupandfullyoperational.The current SDPD system of data collection andmanagement is defined by duplication andsiloed information. We believe the department’s current architecture contains many of thenecessary components of amore usable, and thusmore valuable systembased on the datacollectedviatheCADsystem,131trafficcitationsandwrittenwarnings,aswellasformsofficersare required to submit in documentation of field interviews, search/seizure incidence, andarrests.AdditionaldatacollectionInadditiontothedatacurrentlycollected,werecommendtheSDPDcaptureandincorporatethefollowinginformationintothenewdatabase:
• Policeofficerrace,gender,unit(e.g.,GangUnit,AutoTheftUnit,etc.)anddivision(e.g.,Trafficdivision)
• Specificstoplocation(address,intersection,and/orlandmark)• Vehiclemake,model,andcondition
130Cordner,G.,Williams,B.,&Zuniga,M.(2001).SanDiegoPoliceDepartmentvehiclestopstudy:Year-endreport.SanDiego,CA.,p.1-2.131ForanintroductiontopoliceCADsystemsandausefuldescriptionofthestandardcapabilityofsuchsystems,seeLawEnforcementInformationTechnologyStandardsCouncil(LEITSC).(n.d.).StandardFunctionalSpecificationsforLawEnforcementComputerAidedDispatch(CAD)Systems.BureauofJusticeAssistance,OfficeofJusticePrograms,U.S.DepartmentofJustice.RetrievedAug.14,2016,from,https://www.it.ojp.gov/documents/LEITSC_Law_Enforcement_CAD_Systems.pdf.

88
• Descriptionofdriverbehavioranddemeanor• Probablecausesearch• Natureandamountofcontrabanddiscoveredandpropertyseized
Augmenting the current data collection efforts with these additional data would put SDPDsquarelyinlinewithbestpracticesandwouldyieldsignificantbenefitsbothfortheSDPDandtheCityofSanDiego.Officer information. SDPD’s current traffic stop data card contains no information about theofficer conducting the stop, and thus no such information was available for the presentanalysis. To our knowledge,most if not all of the existing data collectionmechanisms, fromtrafficcitationstosearchdetailforms,areassociatedwithofficerbadgenumbers,whichseemstosuggestthattheinclusionofbasicinformationabouttheofficermaynotrepresentamajorchallenge.Officerdataareessentialforchartingenforcementpatternsattheofficerlevel–necessaryforidentifying so-called “rotten apple” officers.132 The Department’s existing early interventionsystem,apointofemphasis inthe2015PERFreport,133hasthepotentialtobeveryuseful inthis regard. We also believe that officer data may hold the key to more effectivelyunderstandingtherolethatrace/ethnicityplaysindrivingstopandpost-stoppatterns.Scholarshavefoundinseveralinstancesthatdisparitiesaremostpronouncedincaseswheretheofficerandthedriverareofdifferentracialorethnicbackgrounds(forexample,whenaWhiteofficerstops,searches,orarrestsaBlackdriver).134ThequalityoffutureanalysisofSDPD’strafficstoppatterns would be strengthened considerably by the capture of officer race/ethnicity andgenderdata.Stop location. Inone-on-one interviews, several SDPDofficersnoted that trafficenforcementpatternsfollowcloselythecrimeanddemographictrendsofthestoplocation.Inthewordsofoneofficer,“ThepopulationintheareaIpatrolismainlyHispanicorBlack.Therefore,majorityof thetrafficstops,criminals,etc.aregoingtobethoseethnicities. Ithasnothingtodowith
132Foranexampleofwhatthisanalysismightlooklike,seeRidgeway,G.,(2009).CincinnatiPoliceDepartmenttrafficstops:ApplyingRAND’sframeworktoanalyzeracialdisparities.SantaMonica,CA:RANDCorporation,pp.43-48.133PoliceExecutiveResearchForum(PERF).(2015).Criticalresponsetechnicalassessmentreview:Policeaccountability-findingsandnationalimplicationsofanassessmentoftheSanDiegoPolicedepartment.Washington,DC:OfficeofCommunityOrientedPolicingServices,U.S.DepartmentofJustice.134Tillyer,R.Klahm,C.F.,&Engel,R.S.(2012).Thediscretiontosearch:Amultilevelexaminationofdriverdemographicsandofficercharacteristics.JournalofContemporaryCriminalJustice,28(2),184-205;Brown,R.A.,&Frank,J.(2006).Raceandofficerdecisionmaking:ExaminingdifferencesinarrestoutcomesbetweenBlackandWhiteofficers.JusticeQuarterly,23,96-126.

89
race,butthepopulationitselfinthecity.”Otherofficerssuggestedthattrafficstopsareusedasameansofinvestigatingandcontrollingcrime.Webelieveanalysisoftherelationshipbetweentraffic enforcement and crime control is hugely important andpotentially beneficial both forlawenforcementpurposesandforenhancingexternaloversightandaccountability.Yet this type of place-driven analysis is not possible when limited to division-level data.Criminological research has established definitively that crime is not randomly dispersedthroughout a city or even a neighborhood.135 Instead, what we heard from SDPD officers islargelyconsistentwiththecurrentresearch:hotspotsofillegalactivityvarybycrimetypeandarea functionof timeofday, timeof year, and,most importantly,by verynarrowlydefinedspaces.136 In fact, the relationshipbetweencrimeandplace ismosteffectively consideredatthe“micro”level.137Accordingtoonerecentstudy,thesecrimeplaces“canbeassmallasthearea immediately next to an automatic teller machine or as large as a block face, a stripshoppingcenter,oranapartmentbuilding.Oftenplacesarethoughtofasaddresses,specifictypesofbusinesses,orblockfaces.”138Assuch,werecommendthatstopdatabecaptured intermsofthespecificlocationoftheencounter,ratherthanbydivision.Further stop-related detail. We recommend that the SDPD incorporate into existing datacollectionefforts themake,model, and conditionof thedriver’s vehicle, aswell as stopandpost-stopdataonstopsinvolvingcyclistsandpedestrians.Anofficer’sknowledgeofhisorherbeatiscriticaltogoodpoliceworkinpartbecauseitallowsthe officer to recognize and act on incongruities.139 Community policing is premised on thisnotion:policeworktogettoknowthecommunitynotonlytofostertrust,butalsotodevelopthe skills to be able to distinguish interlopers from residents.140 The same is true of patrolofficers.AconsistentthemefromourinterviewswithSDPDstaffwastheimportanceoftrafficstops for investigating circumstances or individuals that may appear out of place. Languageusedtodescribevehiclesthatappearincongruousoftengoeshand-in-handwithdiscussionofan individualofaparticular race/ethnicitywhoappearsoutofplace in certainneighborhood 135Braga,A.A.,&Weisburd,D.L.(2010).PolicingProblemPlaces.Oxford,UK:OxfordUniversityPress.136Sherman,L.W.,Gartin,P.R.,&Buerger,M.E.(1989).Hotspotsofpredatorycrime:Routineactivitiesandthecriminologyofplace.Criminology,27,27-56.137Groff,E.R.,Weisburd,D.,&Yang,S.(2010).Isitimportanttoexaminingcrimetrendsatthe‘micro’level?:Alongitudinalanalysisofstreetvariabilityincrimetrajectories.JournalofQuantitativeCriminology,26,7-32.138Eck,J.E.,&Weisburd,D.L.(2015).Crimeplacesincrimetheory.Crimeandplace:Crimepreventionstudies,4.RetrievedAug.10,2016,fromhttp://citeseerx.ist.psu.edu/viewdoc/download?doi=10.1.1.362.1293&rep=rep1&type=pdf.139Mastrofski,S.D.(1983).Policeknowledgeofthepatrolbeat:aperformancemeasure.PoliceatWork:PolicyIssuesandAnalysis,SagePublications,BeverlyHills,CA,45-64.140Greene,J.R.(2000).CommunitypolicinginAmerica:Changingthenature,structure,andfunctionofthepolice.Criminaljustice,3(3),299-378.

90
contexts.Asoneofficerputit,“Idonotwritemanytickets.IpullpeopleoverthatIthinkmightbedoingbadthings.AmIgoingtopullovertheguycominghomefromworkbecausehedoesnothaveafrontlicenseplate?No.IfIseetwopeoplewearinghoodieswiththeirhoodsupinaTesla,yeahchancesareIampullingthemover.”Relatedly,webelievethattheSDPDwouldbenefitfromcapturingdataonindividualbehavioranddemeanor.Particularbehaviorson thepartofeither thedriverorpassenger–apparentnervousness, aggression or combativeness, even obsequiousness – are often associatedwithsuspicionandthususedtojustifyafieldinterview,requestforpermissiontosearch,or,whencombinedwithotherfactors,aprobablecausesearch.141Thatanofficer’sperceptionofcertainbehaviormaybeunwittinglyinfluencedbydriver/pedestrianrace/ethnicity(andstopcontext)is a fundamental component of implicit bias in law enforcement. More to the point,racial/ethnic differences in the characterization of a vehicle as being out of place or in theinterpretationofcertainbehavior,havebeenconsistently linkedtoracial/ethnicdisparities inthe treatment of drivers.142 This is critically important in light of the wide search and fieldinterviewdisparitiesfoundbetweenWhiteandminoritydrivers.Collection of vehicle data and driver behavior/demeanor information, which is widelyconsideredbestpractices,143wouldadddepthand insight into futureanalysis, in theprocessallowing theSDPDtomoreeffectivelydisentanglemanifestationsofbias fromthoseof solid,proactivepolicing.WefurtherrecommendthattheSDPDcollectandtrackanadditionalmechanismforevaluatingracial/ethnic disparities in the enforcement of traffic regulations: stop duration. Frommereinconvenience to other job- or family-related costs, the length of a traffic stop can havesubstantial ramifications for drivers, regardless of whether the stop ends with a citation, awarning, or some other outcome. Discussion of the issue among community focus groupmembersoftenreflectedresearchthathasfoundthatthesecostsareoftenweighmoreheavily
141Alpert,G.P.,MacDonald,J.M.,&Dunham,R.G.(2005).Policesuspicionanddiscretionarydecisionmakingduringcitizenstops.Criminology,43(2),407-434.142Eberhardt,J.,Goff,P.,Purdie,V.,&Davies,P.(2004).SeeingBlack:Race,crime,andvisualprocessing.JournalofPersonalityandSocialPsychology87(6),876-893;Novak,K.&Chamlin,M.(2012).Racialthreat,suspicion,andpolicebehavior:Theimpactofraceandplaceintrafficenforcement.Crime&Delinquency,58(2),275-300.143Tillyer,R.,Engel,R.S.,&Cherkauskas,J.C.(2010).Bestpracticesinvehiclestopdatacollectionandanalysis.Policing:AnInternationalJournalofPoliceStrategies&Management,33(1),69-92.;Ramirez,D.,McDevitt,&Farrell,A.(2000).Aresourceguideonracialprofilingdatacollectionsystems:Promisingpracticesandlessonslearned.U.S.DepartmentofJustice.RetrievedAug.15,2016,fromhttps://www.ncjrs.gov/pdffiles1/bja/184768.pdf.

91
onminoritydrivers,astheirstopshavebeenshowntolast longerthanthoseinvolvingWhitedrivers.144Finally, we recommend that the SDPD take steps to increase the specificity of theirdocumentation of post-stop outcomes in two ways: (1) begin tracking searches justified byprobablecause;and(2)documentingthespecificnatureandamountofcontrabanddiscoveredandpropertyseized.Pedestrianandbicycle stopdata.OnOctober3, 2015,Governor JerryBrown signed into lawAssemblyBill953,145whichrequiresall lawenforcementagencies intheStateofCaliforniatocollectanddisseminatedataonalltrafficandpedestrianstops.TheSDPDmustsubmititsfirstreport to theState’sAttorneyGeneralbyApril1,2019.WeurgetheDepartment to instituteand implement policy mandating data collection for pedestrian and bicycle stops well inadvanceoftheAB953mandate.Further,weurgethedepartmenttodistinguishbystoptype(vehicle, bicycle, or pedestrian) data on relevant post-stop outcomes, including search,contrabanddiscovery,andpropertyseizure,aswellasfieldinterview,arrest,andcitation.StrengthenaccountabilityandoversightofdatacollectionandmanagementRegardlessofwhichapproachtheSDPDtakestowardfuturedatacollectionefforts,westronglyrecommendthattheDepartmentinstituteamorerobustsetofdataimputationqualitycontrolmechanisms. Adoption of the recommendation to replace the current systemwith one thatdrawsmoreheavilyondatafromtheCADsystemandincorporates informationgeneratedbyjudicialrecords,includingtrafficcitationsandotherpost-stopforms,wouldlikelyreducesomeof the quality assurance requirements, as their value as legal documents is predicated onthoroughness and accuracy. However,we recommend that during the transition to the newsystem(orinthealternative,shouldtheDepartmentopttocontinuewithintheparametersofthecurrentapproach), therebemuchmorecarefulorganizationalattentionpaid toensuringdataquality.Apossible first step toward thisend is the incorporationof traffic stops, citations,andotherpost-stopoutcomesintotheDepartment’searlyinterventionsystem.Doingsowouldseemtoobviatetheneedforofficerstosubmita“journal”entryforeachstop(thoughtheuseofdailyactivity journals may continue to be relevant for other Department purposes), freeing up
144Engel,R.S.,&Calnon,J.M.(2004).Comparingbenchmarkmethodologiesforpolice-citizencontacts:TrafficstopdatacollectionforthePennsylvaniaStatePolice.PoliceQuarterly,7,97-125;Ridgeway,G.(2006).Assessingtheeffectofracebiasinpost-trafficstopoutcomesusingpropensityscores.JournalofQuantitativeCriminology,22,1-28.145RacialandIdentityProfilingActof2015,Cal.Assemb.B.953(2015-2016),Chapter466(Cal.Stat.2015).

92
additionaltimeforotherwork.Further,itwouldallowmid-andhigh-levelsupervisorstotrackindividual,squad,division,anddepartment-widetrendsinrealtime.Relatedly,we recommend that theDepartmentbegin tobriefofficerson thepurposeof thedata collection effort and include traffic/pedestrian stop and post-stop outcomes as part ofregular line-up level briefings. Finally, we recommend that the Department work to includeopen format traffic and pedestrian stop data files (e.g., .csv [comma-separated values] filesratherthanPDF)aspartoftheCityofSanDiegoOpenDataPortal.146Doingsowouldincreasethevisibilityofthesedataandfacilitatethird-partyoversight.147,148
146SanDiegoOpenDataPortal.(n.d.).RetrievedAug.15,2016,fromhttp://data.sandiego.gov/.147Ross,D.(2015,May17).Howtojumpstartthereleaseofopendataonpolicing.CodeforAmerica.RetrievedAug.15,2016,fromhttps://www.codeforamerica.org/blog/2015/05/17/5-ways-to-jumpstart-the-release-of-open-data-on-policing/.148TheSDSUresearchteamisinvestigatingfundingopportunitiestoassisttheSDPDinbuildingtherobustdatacollectioninfrastructurewerecommend.OnepromisingfundingsourceistheResearchNetworkonMisdemeanorJusticeatJohnJayCollegeofCriminalJustice.WithfundingfromtheLauraandJohnArnoldFoundation,theNetworkisintheprocessofidentifyingsevenjurisdictionsinwhichtobringtogetherlawenforcementagenciesandresearchinstitutionstobuilddataanalyticinfrastructureandcapacitytoexaminetrendsinvariousformsoflow-levelenforcementactivity:misdemeanorarrests,citations,andpedestrianandtrafficstops.See:http://johnjay.jjay.cuny.edu/mjp/RN_MJ_Solicitation.pdf.

93
Appendix1DetaileddataonSDPDstaffingandcrimeinSanDiegoTableA1.1. SDPDpatrolstaffing,bydivision,watch,andyear 1stWatch 2ndWatch 3rdWatch Total
2014
Northern 28 32 27 87
Northeastern 20 24 17 61
Eastern 19 27 21 67
Western 35 33 24 92
Northwestern 11 9 9 29
AboveInterstate8 113 125 98 336
Southeastern 25 39 23 87
Central 36 34 30 100
Southern 22 24 15 61
Mid-City 35 42 38 115
BelowInterstate8 118 139 106 363
Traffic 41 9 10 60
Annualtotal 272 273 214 759
2015
Northern 36 39 26 101
Northeastern 20 21 16 57
Eastern 21 25 21 67
Western 29 38 22 89
Northwestern 9 9 9 27
AboveInterstate8 115 132 94 341
Southeastern 24 30 28 82
Central 32 36 38 106
Southern 16 22 19 57
Mid-City 28 36 40 104
BelowInterstate8 100 124 125 349
Traffic 38 14 9 61
Annualtotal 253 270 228 751
Source:SanDiegoPoliceDepartment

94
TableA1.2.CrimeinSanDiego,CA,bycrimetype,location,andyear
Population ViolentCrime(rate) Propertycrime(rate) Totalcrime(rate)
2014
Northern 225,234 599(2.7) 5,111(22.7) 5,710(25.4)
Northeastern 234,394 226(1.0) 2,211(9.4) 2,437(10.4)
Eastern 155,892 372(2.4) 3,486(22.4) 3,858(24.7)
Western 129,709 684(5.3) 4,055(31.3) 4,739(36.5)
Northwestern 70,822 58(0.8) 791(11.2) 849(12.0)
AboveInterstate8 816,051 1,939(2.4) 15,654(19.2) 17,593(21.6)
Southeastern 175,757 846(4.8) 2,408(13.7) 3,254(18.5)
Central 103,524 1,099(10.6) 3,336(32.2) 4,435(42.8)
Southern 107,631 303(2.8) 1,905(17.7) 2,208(20.5)
Mid-City 173,012 1,023(5.9) 3,509(20.3) 4,532(26.2)
BelowInterstate8 559,924 3,271(5.8) 11,158(19.9) 14,429(25.8)
Annualtotal 1,375,975 5,210(3.8) 26,812(19.5) 32,022(23.3)
2015
Northern 225,234 626(2.8) 5,499(24.4) 6,125(27.2)
Northeastern 234,394 267(1.1) 2,361(10.1) 2,628(11.2)
Eastern 155,892 446(2.9) 4,109(26.4) 4,555(29.2)
Western 129,709 714(5.5) 4,450(34.3) 5,164(39.8)
Northwestern 70,822 70(1.0) 847(12.0) 917(13.0)
AboveInterstate8 816,051 2,123(2.6) 17,266(21.2) 19,389(23.8)
Southeastern 175,757 888(5.1) 2,523(14.4) 3,411(19.4)
Central 103,524 1,183(11.4) 3,549(34.3) 4,732(45.7)
Southern 107,631 328(3.0) 2,006(18.6) 2,334(21.7)
Mid-City 173,012 1,046(6.0) 3,813(22.0) 4,859(28.1)
BelowInterstate8 559,924 3,445(6.2) 11,891(21.2) 15,336(27.4)
Annualtotal 1,375,975 5,568(4.0) 29,157(21.2) 34,725(25.2)Source:SanDiegoPoliceDepartment

95
Appendix2TheSanDiegoPoliceDepartmentVehicleStopDataCard

96
Appendix3SDPDOfficerSurvey
A research team from San Diego State University is gathering the opinions of SDPD officers as a
part of the ongoing review of traffic stop data and police-community relations in the City of San
Diego. As a part of this process, we are asking you to complete the following survey. It should take
no more than 5 or 10 minutes of your time.
As the recent Department Announcement made clear, your input is extremely important. This is why
we ask that you please be as honest as you can and select the response to each question that best
describes your opinion about each topic.
No personally identifiable information will be collected in this survey. Your participation is voluntary
and your responses will be kept confidential. Responses will not be identified by individual, but
rather will be compiled together and analyzed as a group.
If you have any questions or concerns about this survey or your rights as a research subject,
please contact SDSU professor Joshua Chanin at [email protected].
Thank you very much for your time and for the work you do.
SDPD Officer Survey - May 2016
Police-Community Relations in San Diego
SDPD Officer Survey - May 2016
Strongly Agree Agree Disagree Strongly Disagree Not Sure
1. San Diego residents trust the San Diego Police Department.
Strongly Agree Agree Disagree Strongly Disagree Not Sure
2. San Diego residents trust my division of the San Diego Police Department.
1

97
Strongly Agree Agree Disagree Strongly Disagree Not Sure
Asian
Black
Hispanic
White
3. The following racial/ethnic groups feel comfortable interacting with the SDPD:
Strongly Agree Agree Disagree Strongly Disagree Not Sure
4. Recent events involving police in cities like Ferguson and Baltimore have made my job as a police officer
more difficult.
Strongly Agree Agree Disagree Strongly Disagree Not Sure
5. The community in my patrol area is appreciative of police presence.
Strongly Agree Agree Disagree Strongly Disagree Not Sure
6. The community in my patrol area is willing to work with the police to solve neighborhood problems.
Strongly Agree Agree Disagree Strongly Disagree Not Sure
7. The Department should do more to reach out to members of the community in my patrol area.
Strongly Agree Agree Disagree Strongly Disagree Not Sure
Asian
Black
Hispanic
White
8. The SDPD treats the following racial/ethnic groups fairly:
2

98
Strongly Agree Agree Disagree Strongly Disagree Not Sure
Asian
Black
Hispanic
White
9. The following racial/ethnic groups have confidence in the SDPD:
10. Please use the space below to add any additional thoughts you might have about police-community
relations in San Diego. Is there anything we haven't asked about this topic that you believe should be
addressed?
11. Do you have any suggestions for improving police-community relations in San Diego?
Race, Crime, and Police Patrol
SDPD Officer Survey - May 2016
Strongly Agree Agree Disagree Strongly Disagree Not Sure
Identifying criminal
behavior
Identifying gang-related
activity
Discovering illegal
drugs, guns, or other
contraband
Enforcing traffic laws
12. When you do not have the description of a suspect, a person's race or ethnicity is an important factor
for:
3
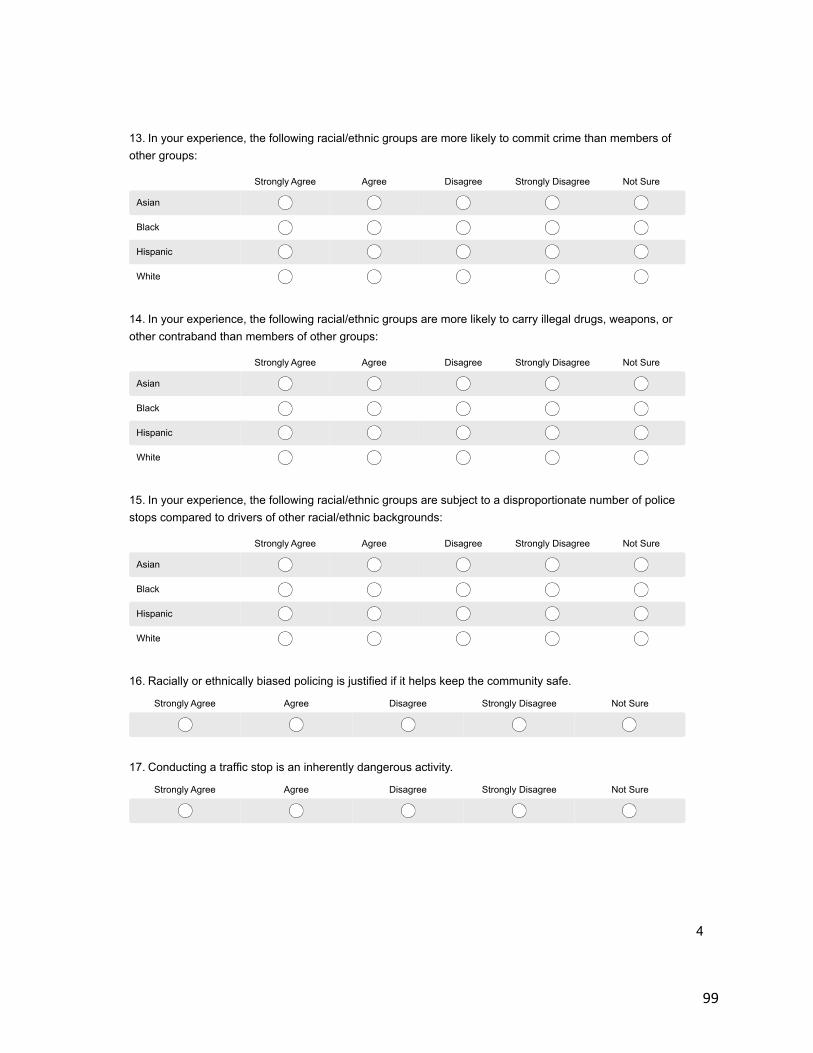
99
Strongly Agree Agree Disagree Strongly Disagree Not Sure
Asian
Black
Hispanic
White
13. In your experience, the following racial/ethnic groups are more likely to commit crime than members of
other groups:
Strongly Agree Agree Disagree Strongly Disagree Not Sure
Asian
Black
Hispanic
White
14. In your experience, the following racial/ethnic groups are more likely to carry illegal drugs, weapons, or
other contraband than members of other groups:
Strongly Agree Agree Disagree Strongly Disagree Not Sure
Asian
Black
Hispanic
White
15. In your experience, the following racial/ethnic groups are subject to a disproportionate number of police
stops compared to drivers of other racial/ethnic backgrounds:
Strongly Agree Agree Disagree Strongly Disagree Not Sure
16. Racially or ethnically biased policing is justified if it helps keep the community safe.
Strongly Agree Agree Disagree Strongly Disagree Not Sure
17. Conducting a traffic stop is an inherently dangerous activity.
4
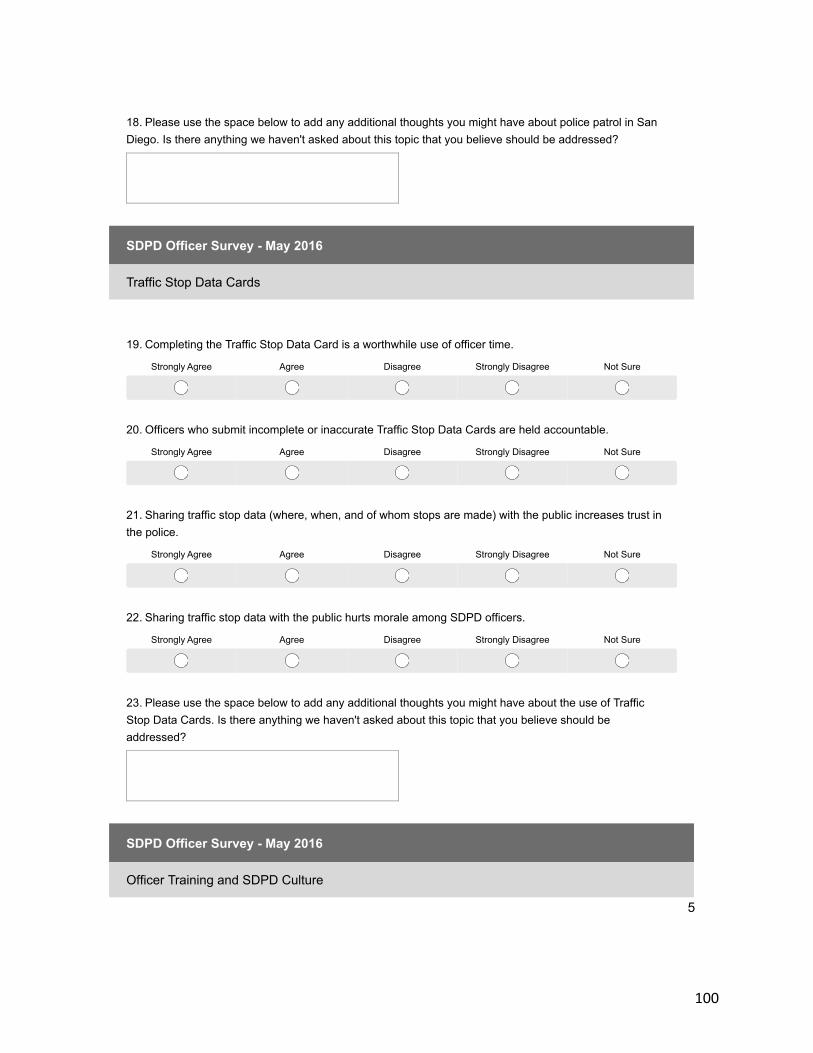
100
18. Please use the space below to add any additional thoughts you might have about police patrol in San
Diego. Is there anything we haven't asked about this topic that you believe should be addressed?
Traffic Stop Data Cards
SDPD Officer Survey - May 2016
Strongly Agree Agree Disagree Strongly Disagree Not Sure
19. Completing the Traffic Stop Data Card is a worthwhile use of officer time.
Strongly Agree Agree Disagree Strongly Disagree Not Sure
20. Officers who submit incomplete or inaccurate Traffic Stop Data Cards are held accountable.
Strongly Agree Agree Disagree Strongly Disagree Not Sure
21. Sharing traffic stop data (where, when, and of whom stops are made) with the public increases trust in
the police.
Strongly Agree Agree Disagree Strongly Disagree Not Sure
22. Sharing traffic stop data with the public hurts morale among SDPD officers.
23. Please use the space below to add any additional thoughts you might have about the use of Traffic
Stop Data Cards. Is there anything we haven't asked about this topic that you believe should be
addressed?
Officer Training and SDPD Culture
SDPD Officer Survey - May 2016
5

101
Strongly Agree Agree Disagree Strongly Disagree Not Sure
24. Officer racial/ethnic bias is a genuine problem for the San Diego Police Department.
Strongly Agree Agree Disagree Strongly Disagree Not Sure
25. SDPD policy is clear on the appropriate use of race/ethnicity in making law enforcement decisions.
Strongly Agree Agree Disagree Strongly Disagree Not Sure
26. Additional training on racial/ethnic bias would make me a more effective officer.
Strongly Agree Agree Disagree Strongly Disagree Not Sure
27. The Department does an effective job identifying officers who are acting in a racially/ethnically biased
manner.
Strongly Agree Agree Disagree Strongly Disagree Not Sure
28. Officers who engage in biased policing are held accountable for their actions.
29. Please use the space below to add any additional thoughts you might have about SDPD policy,
training, or officer culture. Is there anything we haven't asked about this topic that you believe should be
addressed?
Demographics
SDPD Officer Survey - May 2016
6
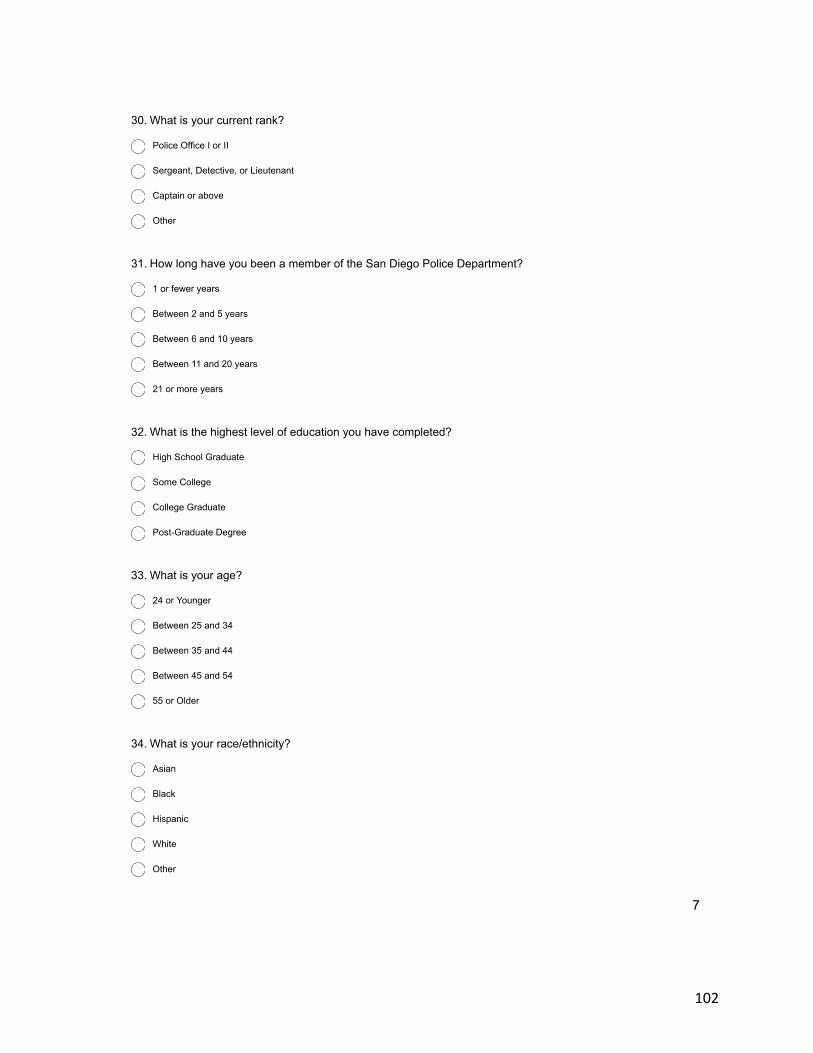
102
30. What is your current rank?
Police Office I or II
Sergeant, Detective, or Lieutenant
Captain or above
Other
31. How long have you been a member of the San Diego Police Department?
1 or fewer years
Between 2 and 5 years
Between 6 and 10 years
Between 11 and 20 years
21 or more years
32. What is the highest level of education you have completed?
High School Graduate
Some College
College Graduate
Post-Graduate Degree
33. What is your age?
24 or Younger
Between 25 and 34
Between 35 and 44
Between 45 and 54
55 or Older
34. What is your race/ethnicity?
Asian
Black
Hispanic
White
Other
7
103
35. How many hours per week do you spend enforcing traffic laws?
0-5
6-10
11-15
16-20
21+
36. To which division are you currently assigned?
Central
Eastern
Mid-City
Northern
Northeastern
Northwestern
Southern
Southeastern
Western
Not Applicable
Thank you again for your time. We are seeking volunteers to participate in short, confidential
follow-up interviews on the topics covered in this survey. If interested, please contact Joshua
Chanin at [email protected].
Follow-up Interview
SDPD Officer Survey - May 2016
8

104
Appendix4LimitingtheveilofdarknessanalysistostopsinvolvingmovingviolationsTheauthorsofarecentpaperanalyzingtrafficstopsinSyracuse,NewYorkarguedthat“somekinds of equipment violations (e.g., malfunctioning headlights) are uniquely nighttimeviolations, and it is conceivable that the incidence of such equipment violations is alsocorrelated with drivers’ race.”149Worden goes on to argue that the inclusion of equipmentviolationsmaybias the veil of darkness analysis. To account for this possibility,we excludedequipmentviolationsandre-appliedtheveilofdarknesstechniquetoasub-sampleofrecordsgenerated for stops involving onlymoving violations. Our findings are shown in Tables A4.1throughA4.4.TableA4.1.ModelingtheeffectsofdaylightontheoddsthatBlackdriverswillbestoppedcitywideforamovingviolation
OddsRatio
p-valueStandarderror
95%ConfidenceInterval
NumberofStops
2014
Blackv.White 1.165 0.066 0.097 0.990,1.374 5,884
YoungBlackv.YoungWhite 1.269 0.128 0.198 0.934,1.724 1,544
2015
Blackv.White 0.793 0.016 0.076 0.656,0.957 4,381
YoungBlackv.YoungWhite 0.649 0.019 0.120 0.452,0.932 1,112
Combined
Blackv.White 0.985 0.809 0.062 0.871,1.114 10,265
YoungBlackv.YoungWhite 0.952 0.676 0.113 0.755,1.120 2,656
Table A4.1 shows the results of an analysis of citywide stops made during the intertwilightperiod involvingBlackandWhitedriversstoppedforamovingviolation.Thesedatashownostatisticallysignificantdifferenceinthe2014stoppatternsofBlacksandWhites.Whenlimitedtomoving violation stops occurring in 2015, our analysis shows that Black driverswere lesslikelytobestoppedduringdaylighthoursthanafterdark,comparedtoWhites.Analysisofthecombined2014/2015data showednomeaningful disparity in the stoppatternsofBlack and
149Worden,R.E.,McLean,S.J.,&Wheeler,A.P.(2012).Testingforracialprofilingwiththeveilofdarknessmethod.PoliceQuarterly,15,92-111.

105
Whitedrivers.TableA4.2.ModelingtheeffectsofdaylightontheoddsthatHispanicdriverswillbestoppedcitywideforamovingviolation
OddsRatio
p-valueStandarderror
95%ConfidenceInterval
NumberofStops
2014
Hispanicv.White 1.039 0.463 0.054 0.938,1.151 8,619
YoungHispanicv.YoungWhite 1.102 0.382 0.123 0.886,1.372 1,849
2015
Hispanicv.White 0.793 <0.001 0.047 0.706,0.891 6,681
YoungHispanicv.YoungWhite 0.711 0.005 0.087 0.559,0.904 1,639
Combined
Hispanicv.White 0.915 0.023 0.036 0.848,0.988 15,300
YoungHispanicv.YoungWhite 0.893 0.165 0.073 0.761,1.048 3,488
TableA4.2showsresultsofourcomparativeanalysisofHispanicandWhitedriversstoppedformoving violations.We find no statistically significant differences in the 2014 data or in thecombined 2014/2015 data. Analysis of the 2015 data shows that Hispanic drivers were lesslikelytobestoppedforamovingviolationduringtheday,whendriverrace/ethnicity ismoreapttobevisibletothenakedeye,thanwereWhites.

106
TableA4.3.ModelingtheeffectsofdaylightontheoddsthatBlackdriverswillbestoppedforamovingviolation,aboveandbelowInterstate8
OddsRatio
p-valueStandarderror
95%ConfidenceInterval
NumberofStops
2014
AboveInterstate8 1.358 0.019 0.177 1.052,1.752 3,771
BelowInterstate8 0.773 0.024 0.088 0.618,0.967 2,240
2015
AboveInterstate8 1.050 0.752 0.162 0.775,1.422 2,983
BelowInterstate8 0.597 <0.001 0.077 0.463,0.770 1,514
Combined
AboveInterstate8 1.191 0.077 0.118 0.981,1.446 6,754
BelowInterstate8 0.692 <0.001 0.058 0.586,0.817 3,754
InTableA4.3wedisplay the resultsofourmovingviolation-onlyanalysisofBlackandWhitedriversbystoplocation.WereportfindingsbyyearforstopsoccurringbothaboveandbelowInterstate8.Thedatashowthatin2014,stopsoccurringaboveI-8involvingaBlackdriverweremore likely to occur duringdaylight hours,whendriver race/ethnicitywas visible, than afterdark,whenitwasnot,comparedtoWhites.Nosuchdisparitieswereevidentineither2015orthecombined2014/2015data.Conversely, records of stops initiated in those divisions located below Interstate 8 in 2014,2015,and2014/2015combinedshowthatBlackdriversweremorelikelytobestoppedduringdaylighthoursthanafterdarkthanwereWhitesstoppedundersimilarconditions.
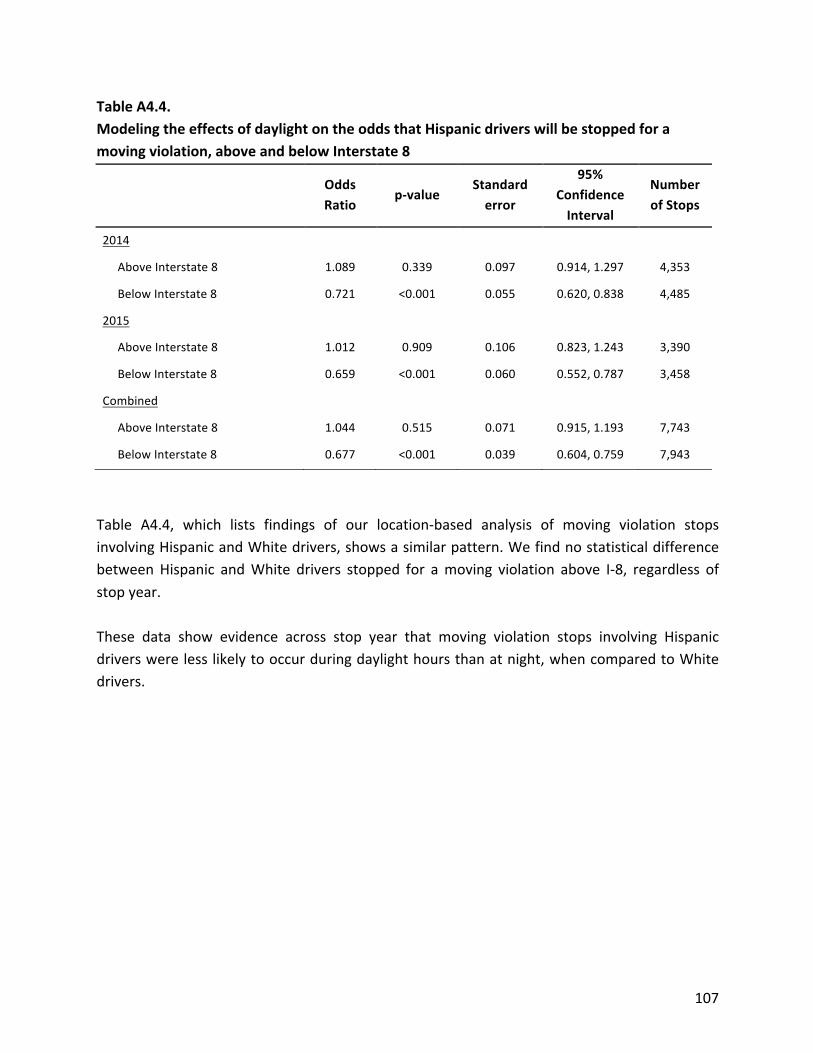
107
TableA4.4.ModelingtheeffectsofdaylightontheoddsthatHispanicdriverswillbestoppedforamovingviolation,aboveandbelowInterstate8
OddsRatio
p-valueStandarderror
95%ConfidenceInterval
NumberofStops
2014
AboveInterstate8 1.089 0.339 0.097 0.914,1.297 4,353
BelowInterstate8 0.721 <0.001 0.055 0.620,0.838 4,485
2015
AboveInterstate8 1.012 0.909 0.106 0.823,1.243 3,390
BelowInterstate8 0.659 <0.001 0.060 0.552,0.787 3,458
Combined
AboveInterstate8 1.044 0.515 0.071 0.915,1.193 7,743
BelowInterstate8 0.677 <0.001 0.039 0.604,0.759 7,943
Table A4.4, which lists findings of our location-based analysis of moving violation stopsinvolvingHispanicandWhitedrivers,showsasimilarpattern.WefindnostatisticaldifferencebetweenHispanic andWhite drivers stopped for amoving violation above I-8, regardless ofstopyear.These data show evidence across stop year that moving violation stops involving Hispanicdriverswerelesslikelytooccurduringdaylighthoursthanatnight,whencomparedtoWhitedrivers.

108
Appendix5LimitingtheveilofdarknessanalysistostopsinvolvingmaledriversTablesA5.1throughA5.4showresultsofourapplicationoftheveilofdarknesstechniquetoasub-sample of male drivers stopped for either moving or equipment-related violations. Theresultsarenotmeaningfullydifferentfromanalysisofstopsinvolvingmaleandfemaledriverscomparedundersimilarconditions.TableA5.1.ModelingtheeffectsofdaylightontheoddsthatBlackmaledriverswillbestoppedcitywideforeitheramovingviolationorequipmentviolation
OddsRatio
p-valueStandarderror
95%ConfidenceInterval
NumberofStops
2014
Blackv.White 1.322 <0.001 0.089 1.159,1.509 5,981
YoungBlackv.YoungWhite 1.487 0.002 0.193 1.153,1.918 1,569
2015
Blackv.White 0.844 0.027 0.064 0.727,0.981 4,616
YoungBlackv.YoungWhite 0.695 0.010 0.098 0.527,0.917 1,219
Combined
Blackv.White 1.084 0.108 0.054 0.982,1.195 10,597
YoungBlackv.YoungWhite 1.040 0.675 0.098 0.865,1.252 2,788
TableA5.1comparescitywidestoppatternsofBlackandWhitemaledrivers.In2014,wefindthat Black men were more likely to be stopped during daylight hours than after dark, ascomparedtoWhitedrivers.In2015,theexactoppositewastrue.Blackmaledriverswerelesslikelytobestoppedduringdaylighthoursthantheywereafterdark,comparedtoWhitemaledrivers.Analysisofthe2014/2015combineddatashownostatisticallysignificantdifferenceinthestoppatternsofBlackandWhitemaledrivers.

109
TableA5.2.ModelingtheeffectsofdaylightontheoddsthatBlackmaledriverswillbestoppedforeitheramovingviolationorequipmentviolation,aboveandbelowInterstate8
OddsRatio
p-valueStandarderror
95%ConfidenceInterval
NumberofStops
2014
AboveInterstate8 1.368 0.013 0.172 1.069,1.749 3,224
BelowInterstate8 0.998 0.984 0.104 0.813,1.225 2,218
2015
AboveInterstate8 1.142 0.347 0.162 0.865,1.508 2,650
BelowInterstate8 0.645 <0.001 0.078 0.509,0.816 1,553
Combined
AboveInterstate8 1.254 0.015 0.117 1.044,1.506 5,874
BelowInterstate8 0.806 0.005 0.063 0.692,0.938 3,771
InTableA5.2,wepresenttheBlack-Whitecomparativeanalysisbystoplocation.StopsofBlackmaledriversinitiatedaboveI-8weremorelikelytooccurduringdaylighthoursthanafterdarkin2014and2014/2015combined,butnot2015,whencomparedtostopsofWhitemen.In2015and2014/2015,stopsofBlackmenoccurringbelowInterstate8werelesslikelytooccurduringdaylighthoursthanafterdark,comparedtostopsinvolvingWhitemales.

110
TableA5.3.ModelingtheeffectsofdaylightontheoddsthatHispanicmaledriverswillbestoppedcitywideforeitheramovingviolationorequipmentviolation
Oddsratio
p-valueStandarderror
95%confidenceinterval
Numberofstops
2014
Hispanicv.White 1.088 0.080 0.053 0.990,1.197 8,723
YoungHispanicv.YoungWhite 1.144 0.173 0.113 0.943,1.389 2,119
2015
Hispanicv.White 0.827 0.001 0.046 0.741,0.923 6,728
YoungHispanicv.YoungWhite 0.737 0.005 0.081 0.595,0.913 1,822
Combined
Hispanicv.White 0.963 0.297 0.035 0.896,1.034 15,451
YoungHispanicv.YoungWhite 0.928 0.308 0.068 0.805,1.071 3,941
TableA5.3displaystheresultsofanalysisofstoppatternsofHispanicandWhitemaledrivers,aggregated at the city level. In 2015, Hispanic males were less likely to be stopped duringdaylightthantheywereafterdark,comparedtoWhitemaledrivers.Analysisofthe2014and2014/2015 combined data show no statistically significant difference in the citywide stoppatternsofHispanicandWhitemaledrivers.
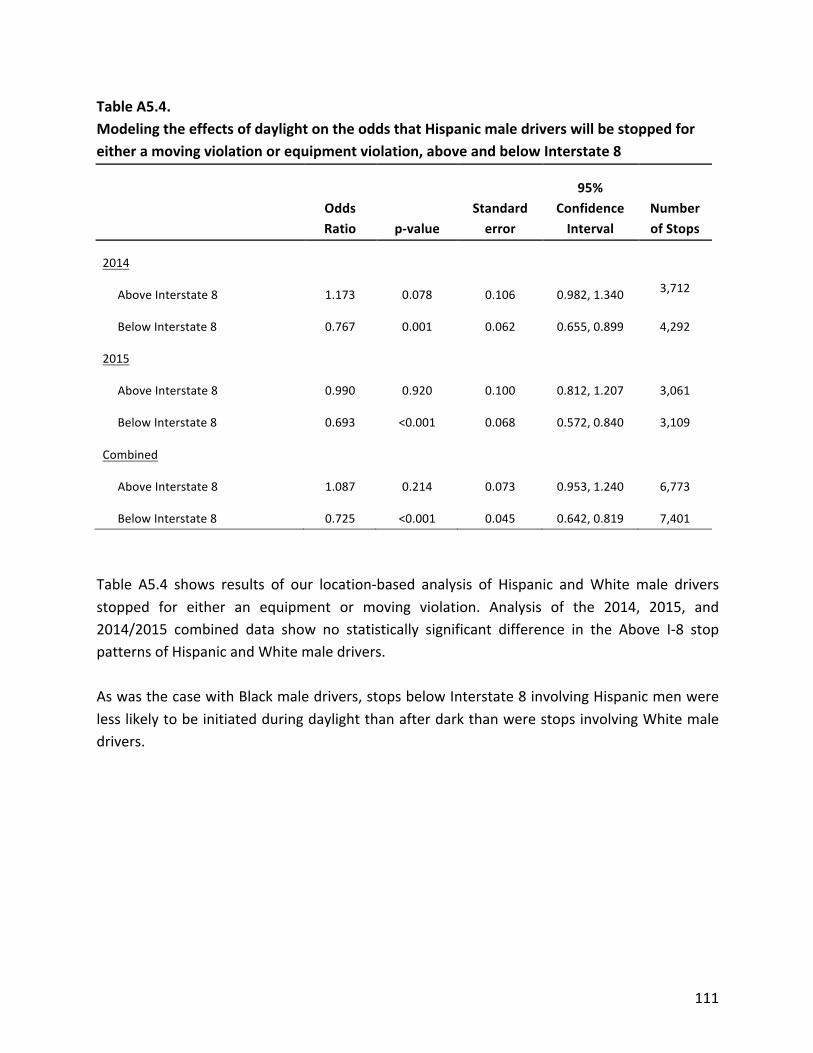
111
TableA5.4.ModelingtheeffectsofdaylightontheoddsthatHispanicmaledriverswillbestoppedforeitheramovingviolationorequipmentviolation,aboveandbelowInterstate8
OddsRatio p-value
Standarderror
95%ConfidenceInterval
NumberofStops
2014
AboveInterstate8 1.173 0.078 0.106 0.982,1.340 3,712
BelowInterstate8 0.767 0.001 0.062 0.655,0.899 4,292
2015
AboveInterstate8 0.990 0.920 0.100 0.812,1.207 3,061
BelowInterstate8 0.693 <0.001 0.068 0.572,0.840 3,109
Combined
AboveInterstate8 1.087 0.214 0.073 0.953,1.240 6,773
BelowInterstate8 0.725 <0.001 0.045 0.642,0.819 7,401
Table A5.4 shows results of our location-based analysis of Hispanic andWhite male driversstopped for either an equipment or moving violation. Analysis of the 2014, 2015, and2014/2015 combined data show no statistically significant difference in the Above I-8 stoppatternsofHispanicandWhitemaledrivers.AswasthecasewithBlackmaledrivers,stopsbelowInterstate8involvingHispanicmenwerelesslikelytobeinitiatedduringdaylightthanafterdarkthanwerestopsinvolvingWhitemaledrivers.

112
Appendix6Division-leveltrafficstoppatterns,byyearTablesA6.1throughA6.6displaytheresultsofouranalysisoftrafficstoppatternsinthenineSDPDpolicedivisions,brokendownbydriverrace/ethnicityandstopyear.TableA6.1.ModelingtheeffectsofdaylightontheoddsthatBlackdriverswillbestoppedforeitheramovingviolationoranequipmentviolationin2014,bystoplocation
Oddsratio p-valueStandarderror
95%confidenceinterval
Numberofstops
AboveInterstate8
Northern 1.038 0.878 0.258 0.638,1.691 1,343
Northeastern 1.908 0.002 0.394 1.273,2.861 1,204
Eastern 1.018 0.918 0.182 0.718,1.445 1,098
Western 1.410 0.057 0.255 0.989,2.011 1,416
Northwestern 1.151 0.681 0.393 0.590,2.246 594
Sub-total 1.253 0.029 0.129 1.024,1.534 5,226
BelowInterstate8
Southeastern 1.641 0.030 0.375 1.048,2.568 740
Central 0.724 0.057 0.123 0.520,1.010 1,306
Southern 0.952 0.844 0.236 0.586,1.548 484
Mid-City 0.977 0.869 0.140 0.738,1.292 1,099
Sub-total 0.905 0.238 0.077 0.766,1.069 3,402
InTableA6.1,we list theoddsthatBlackdriverswillbestoppedforamovingviolationoranequipment violation in daylight, compared to White drivers, using data from 2014. In theNortheastern division, Black drivers were 90.8 percent more likely to be stopped duringdaylighthours,whendriverrace/ethnicitywasvisible,thanindarkness(p=0.002),comparedto White drivers. Disparities were also evident in data from the Southeastern division (p =0.030)andinouranalysisofaggregatedatafromthefivedivisionslocatedaboveInterstate8(p= 0.029). We foundno statistically significant disparities in data from theother sevenpatroldivisions,orintheaggregateddatafrombelowInterstate8.

113
TableA6.2.ModelingtheeffectsofdaylightontheoddsthatBlackdriverswillbestoppedforeitheramovingviolationoranequipmentviolationin2015,bystoplocation
Oddsratio p-valueStandarderror
95%confidenceinterval
Numberofstops
AboveInterstate8
Northern 1.327 0.277 0.345 0.797,2.209 1,211
Northeastern 1.072 0.749 0.235 0.699,1.647 1,087
Eastern 1.281 0.249 0.275 0.841,1.952 898
Western 0.817 0.375 0.186 0.522,1.277 904
Northwestern 0.704 0.403 0.295 0.309,1.602 392
Sub-total 1.067 0.576 0.124 0.849,1.341 4,226
BelowInterstate8
Southeastern 1.113 0.716 0.328 0.625,1.982 456
Central 0.650 0.026 0.125 0.445,0.949 869
Southern 1.208 0.557 0.389 0.643,2.272 333
Mid-City 0.978 0.895 0.163 0.705,1.358 730
Sub-total 0.686 <0.001 0.069 0.564,0.834 2,244
Table A6.2 reproduces the above analysis using data from 2015. We find no statisticallysignificant evidence of Black-White disparity in either the Northeastern or Southeasterndivisions, or the below I-8 aggregation. In 2015, stops in the Central division involving Blackdriverswerelesslikelytooccurduringdaylightthanafterdark(p=0.026),comparedtoWhitedrivers.Whatismore,ouranalysisoftheaggregateddatafromthefourdivisionslocatedbelowInterstate 8 revealed a similar pattern:White driversweremore likely to be stoppedduringdaylighthoursthanafterdark(p<0.001),comparedtoBlackdrivers.Wefoundnostatisticallysignificantdisparitiesindatafromtheothereightpatroldivisions,orintheaggregateddatafromaboveInterstate8.

114
TableA6.3.ModelingtheeffectsofdaylightontheoddsthatHispanicdriverswillbestoppedforeitheramovingviolationoranequipmentviolationin2014,bystoplocation
Oddsratio p-valueStandarderror
95%confidenceinterval
Numberofstops
AboveInterstate8
Northern 0.870 0.398 0.143 0.630,1.202 1,494
Northeastern 1.250 0.139 0.188 0.930,1.679 1,361
Eastern 0.717 0.026 0.107 0.536,0.961 1,227
Western 1.240 0.080 0.152 0.975,1.576 1,701
Northwestern 1.519 0.064 0.064 0.976,2.365 679
Sub-total 1.084 0.262 0.078 0.941,1.249 6,058
BelowInterstate8
Southeastern 0.960 0.850 0.207 0.629,1.465 916
Central 0.595 <0.001 0.072 0.469,0.754 1,718
Southern 0.999 0.991 0.129 0.775,1.286 2,766
Mid-City 0.950 0.682 0.119 0.743,1.215 1,418
Sub-total 0.755 <0.001 0.049 0.665,0.858 6,382
Table A6.3 list the results of our application of the veil of darkness technique to stopsconducted in2014 involvingHispanicandWhitedrivers.Stops in theEastern (p=0.026)andCentral(p<0.001)divisionsinvolvingHispanicdriverswere less likelytooccurduringdaylighthoursthan indarkness,comparedtoWhitedrivers.Analysisof theaggregateddatafromthefourdivisionslocatedbelowInterstate8producedsimilaroutcomes:Whitedriversweremorelikely to be stopped during periods when driver race/ethnicity was visible, compared toHispanicdrivers(p<0.001).Wefoundnostatisticallysignificantdisparitiesindatafromtheothersevenpatroldivisions,orintheaggregateddatafromaboveInterstate8.

115
TableA6.4.ModelingtheeffectsofdaylightontheoddsthatHispanicdriverswillbestoppedforeitheramovingviolationoranequipmentviolationin2015,bystoplocation
Oddsratio p-valueStandarderror
95%confidenceinterval
Numberofstops
AboveInterstate8
Northern 1.033 0.847 0.177 0.739,1.445 1,368
Northeastern 1.241 0.190 0.204 0.898,1.713 1,193
Eastern 1.206 0.284 0.211 0.856,1.701 1,016
Western 0.711 0.037 0.116 0.516,0.979 1,051
Northwestern 1.030 0.909 0.263 0.624,1.698 521
Sub-total 1.044 0.607 0.087 0.887,1.228 4,835
BelowInterstate8
Southeastern 1.191 0.544 0.343 0.678,2.093 577
Central 0.499 <0.001 0.070 0.379,0.657 1,205
Southern 0.983 0.910 0.149 0.730,1.323 2,212
Mid-City 0.807 0.173 0.127 0.593,1.098 890
Sub-total 0.697 <0.001 0.055 0.597,0.815 4,574
Datafrom2015revealsimilarpatterns.StopsconductedintheWestern(p=0.037)andCentraldivisions (p<0.001) involvingHispanicdriverswere less likely tooccurduringdaylighthoursthan after dark, compared toWhites. Similarly, in the aggregate, Hispanics stops conductedbelowI-8werelesslikelytooccurindaylightthanafterdark(p<0.001),comparedtoWhites.Wefoundnostatisticallysignificantdisparitiesindatafromtheothersevenpatroldivisions,orintheaggregateddatafromaboveInterstate8.

116
TableA6.5.ModelingtheeffectsofdaylightontheoddsthatAsian/PacificIslanderdriverswillbestoppedforeitheramovingviolationoranequipmentviolationin2014,bystoplocation
Oddsratio p-valueStandarderror
95%confidenceinterval
Numberofstops
AboveInterstate8
Northern 0.722 0.048 0.119 0.523,0.996 1,500
Northeastern 1.274 0.022 0.134 1.036,1.566 1,912
Eastern 1.348 0.050 0.205 1.000,1.817 1,216
Western 1.074 0.644 0.168 0.792,1.459 1,483
Northwestern 0.811 0.232 0.142 0.575,1.144 800
Sub-total 0.982 0.784 0.067 0.859,1.121 6,349
BelowInterstate8
Southeastern 1.110 0.691 0.293 0.662,1.862 356
Central 0.803 0.202 0.138 0.516,4.028 1,305
Southern 1.509 0.104 0.382 0.919,2.480 499
Mid-City 1.300 0.133 0.226 0.923,1.826 860
Sub-total 1.007 0.947 0.104 0.822,1.233 2,860
TableA6.5liststheoddsthatAPIdriverswillbestoppedforamovingviolationoranequipmentviolationindaylight,comparedtoWhitedrivers,usingdatafrom2014.IntheNortheastern(p=0.022) and Eastern (p = 0.050) divisions, API drivers weremore likely to be stopped duringdaylight hours, when driver race/ethnicitywas visible, than in darkness, compared toWhitedrivers.Data fromtheNortherndivision reveal the inverse:APIdriverswere less likely tobestoppedduringdaylighthoursthanafterdark,comparedtoWhites.Statistically significantdisparitieswerenotpresent in theother six patrol divisions, or in theaggregateddatafromaboveandbelowInterstate8.

117
TableA6.6.ModelingtheeffectsofdaylightontheoddsthatAsian/PacificIslanderdriverswillbestoppedforeitheramovingviolationoranequipmentviolationin2015,bystoplocation Odds
ratiop-value
Standarderror
95%confidenceinterval
Numberofstops
AboveInterstate8
Northern 1.332 0.095 0.229 0.951,1.866 1,368
Northeastern 0.982 0.869 0.110 0.787,1.224 1,682
Eastern 1.065 0.698 0.172 0.776,1.460 1,046
Western 0.717 0.111 0.150 0.476,1.079 937
Northwestern 0.863 0.430 0.161 0.599,1.244 662
Sub-total 0.905 0.176 0.066 0.783,1.046 5,254
BelowInterstate8
Southeastern 1.382 0.391 0.521 0.660,2.900 166
Central 1.468 0.028 0.256 1.043,2.067 962
Southern 1.388 0.274 0.416 0.772,2.498 344
Mid-City 0.846 0.450 0.187 0.548,1.305 499
Sub-total 1.023 0.849 0.122 0.809,1.294 1,839
As is shown in Table A6.6, using data from 2015, we find evidence showing that stopsconductedintheCentraldivision involvingAPIdriversweremore46.8percent likelytooccurduringdaylighthoursthanafterdark(p=0.028)comparedtoWhitedriverstops.Statisticallysignificant disparities were not present in any of the other eight patrol divisions, or in theaggregateddatafromaboveandbelowInterstate8.

118
Appendix7Usinglogisticregressiontomodelpost-stopoutcomes
What followsare the resultsofouranalysisofpost-stopoutcomesusingmultivariate logisticregression.Thistechniqueisvaluableinthatinallowsresearcherstoexaminetherelationshipbetween a dichotomous variable, like search/no search, and several other variables. Thepropensity score matching technique is more effective at isolating the effects of driverrace/ethnicityandthushasstronger internalvalidity thando logistic regressionmodels.Logitmodels allow for use of a larger sub-sample of the traffic stop population and thus have ahigherdegreeofexternalvaliditythandotheresultsofthematchedpairsanalysis.TableA7.1.UsinglogisticregressiontomodelthelikelihoodthatSDPDofficerswillsearchBlackdrivers
Oddsratio p-ValueStandarderror
95%confidenceinterval
Numberofstops
Allsearches 2.98 <0.001 0.091 2.81,3.17 122,547
Consent 3.63 <0.001 0.269 3.14,4.20 116,745
Fourthwaiver 4.48 <0.001 0.254 4.01,5.01 116,745
Inventory 1.99 <0.001 0.121 1.77,2.24 116,745
Incidenttoarrest 1.38 <0.001 0.122 1.17,1.64 116,745
Other(uncategorized) 2.57 <0.001 0.171 2.26,2.93 121,704
TheresultsshowninTableA7.1showclearlythatBlackdriversaremorelikelytobesearchedthan areWhite drivers following discretionary traffic stops, regardless of search type. TableA7.2showssimilarresultswhenthedatasetislimitedtoHispanicandWhitedrivers.HispanicsdriversweremorelikelytobesearchedthanareWhitedrivers.

119
TableA7.2.UsinglogisticregressiontomodelthelikelihoodthatSDPDofficerswillsearchHispanicdrivers
Oddsratio p-ValueStandarderror
95%confidenceinterval
Numberofstops
Allsearches 1.93 <0.001 0.052 1.83,2.04 163,897
Consent 2.02 <0.001 0.140 1.76,2.31 156,689
Fourthwaiver 1.45 <0.001 0.086 1.29,1.63 156,689
Inventory 2.56 <0.001 0.118 2.34,2.81 156,689
Incidenttoarrest 1.20 0.008 0.084 1.05,1.38 156,689
Other(uncategorized) 1.64 <0.001 0.097 1.47,1.85 162,708
TablesA7.3liststheresultsoffourlogisticregressionmodelsdesignedtoestimatetheeffectsof race/ethnicity on the discovery of contraband, aswell as the decision to issue a citation,initiatea field interview,andmakeanarrest following thediscretionary traffic stopsofBlackandWhitedrivers.Thefindingsareinlinewiththeresultsofourmatchedpairsanalysis:BlackdriverswerelesslikelytobecitedthanWhites,andBlackswerealsolesslikelytobefoundwithcontraband. According to this analysis, Black drivers faced a greater likelihood of beingsubjected to a field interview and are substantially more likely to be arrested compared toWhitedrivers.TableA7.3.Usinglogisticregressiontomodelpost-stopoutcomesforBlackdrivers
Oddsratio p-ValueStandarderror
95%confidenceinterval
Numberofstops
Citation 0.59 <0.001 0.009 0.57,0.60 123,082
Fieldinterview 5.32 <0.001 0.204 4.93,5.73 123,082
Contraband* 0.68 <0.001 0.071 0.55,0.83 122,547
Arrest 1.37 <0.001 0.081 1.22,1.54 123,082
*Includesstatisticalcontrolsforpolicesearch
TableA7.4liststheresultsoffourlogisticregressionmodelsevaluatingthepost-stopoutcomesofHispanicandWhitedrivers.Thesefindingsreflecttheresultsofourmatchedpairsanalysis.Hispanic driverswere less likely thanWhitedrivers to be foundwith contraband following a

120
search and were more likely to be the subject of a field interview.We found no statisticaldifferenceineitherthearrestorcitationratesofHispanicandWhitedrivers.TableA7.4.Usinglogisticregressiontomodelpost-stopoutcomesforHispanicdrivers
Oddsratio p-ValueStandarderror
95%confidenceinterval
Numberofstops
Citation 0.99 0.320 0.011 0.97,1.01 164,635
Fieldinterview 1.94 <0.001 0.075 1.80,2.09 164,635
Contraband* 0.58 <0.001 0.054 0.48,0.70 163,897
Arrest 1.17 0.081 0.103 0.98,1.39 164,635
*Includesstatisticalcontrolsforpolicesearch
In each case, the results generated by ourmultiple logistic regressionmodels are consistentwiththefindingsproducedbythepropensityscorematchinganalysisdescribed inChapter5.Taken together, these two sets of results suggest that across most post-stop outcomes,including search, contraband discovery, and field interviews, Black and Hispanic drivers aresubjecttodisparatelevelsofscrutiny.

121
Appendix8DescribingmatchedandunmatcheddriversTable A8.1 lists by race/ethnicity the outcome of thismatching process for Black andWhitedrivers across eight stop characteristicsuponwhich thematchwasbased. These include thereasonforandlocation(policedistrict)ofthestop,thedayoftheweek,month,andtimeofdayduringwhichthestopoccurred,andthedriver’sage,gender,andresidencystatus.TheMatchedBlackDriverscolumnlistsbypercentagethedistributionof19,948stopsinvolvingmatchedBlackdrivers:66.0percentwerestoppedformovingviolations,9.0werestopped intheNorthernpatroldivision,10.1percentwerestoppedbetweennoonand3:00PM,andsoon.TheMatchedWhiteDriverscolumnlistssimilarinformationforthe19,948matchedWhitedrivers. The Unmatched Black Drivers column describes the 4,150 Black drivers for which asuitablematchcouldnotbefound.Therightmostcolumn,UnmatchedWhiteDrivers,describesthe74,017Whitedriversthatwecouldnotappropriatelymatch.TableA8.2liststhesamedataforHispanicdriversandtheirmatched(andunmatched)Whitecounterparts.TableA8.1.DescribingmatchedandunmatchedBlackandWhitedrivers
MatchedBlackdrivers
(n=19,948)
MatchedWhitedrivers
(n=19,948)
UnmatchedBlackdrivers(n=4,088)
UnmatchedWhitedrivers(n=73,979)
Reasonforstop Movingviolation 66.0 64.6 31.3 80.6
Equipmentviolation 32.3 33.4 66.2 18.2
Codeviolation 0.7 0.7 1.1 0.4
Radiocall/citizencontact 0.6 0.7 0.5 0.5
Observation/knowledge 0.3 0.3 0.5 0.1
Suspectinformation 0.2 0.3 0.5 0.1
Other <0.1 0.1 0.0 0.1

122
TableA8.1.DescribingmatchedandunmatchedBlackandWhitedrivers,cont.Stoplocation
Northwestern 3.1 3.5 0.0 9.4
Northern 9.0 9.1 0.0 25.2
Northeastern 9.2 9.2 0.0 15.7
Eastern 14.2 14.2 0.0 15.2
Southeastern 8.4 7.8 82.5 0.0
Central 17.1 17.4 0.4 9.0
Western 11.4 10.8 0.0 19.0
Southern 4.7 5.3 0.1 2.7
Mid-City 22.5 22.7 17.0 3.8
Stoptime 12:00–3:00a.m. 13.3 13.0 14.6 8.0
3:00–6:00a.m. 3.7 4.0 4.1 1.9
6:00–9:00a.m. 11.7 11.1 8.6 13.7
9:00a.m.–12:00p.m. 17.4 17.0 12.4 23.7
12:00–3:00p.m. 10.1 10.3 4.6 15.5
3:00–6:00p.m. 15.5 16.2 24.8 15.4
6:00–9:00p.m. 10.7 11.5 14.7 9.4
9:00p.m.–12:00a.m. 17.6 17.1 16.3 12.3Stopday
Monday 12.4 13.0 15.4 12.2
Tuesday 16.9 16.5 12.6 19.2
Wednesday 15.6 15.8 11.6 19.5
Thursday 16.0 15.7 14.5 17.6
Friday 15.1 14.6 16.5 13.3
Saturday 13.5 13.6 15.1 10.3
Sunday 10.4 10.8 14.4 8.0

123
TableA8.1.DescribingmatchedandunmatchedBlackandWhitedrivers,cont.
Stopmonth
January 8.9 9.4 10.5 8.7
February 10.5 10.5 11.6 10.0
March 9.4 9.6 8.1 9.0
April 9.6 9.4 9.3 10.0
May 8.6 8.8 7.4 8.9
June 7.8 7.8 8.1 8.3
July 7.5 7.5 8.5 8.5
August 8.9 8.6 9.5 7.9
September 7.5 7.5 6.8 6.9
October 6.9 6.7 7.2 7.3
November 7.6 7.6 6.3 7.8
December 6.7 7.0 6.9 6.8
Driverage Under18 0.5 0.7 0.3 1.5
18-25 24.5 24.5 29.2 18.6
26-35 32.4 31.3 30.7 26.2
36-45 17.9 18.3 17.1 18.0
46andover 24.7 24.3 19.9 34.3
Drivergender
Male 70.0 69.6 77.8 59.5
Female 30.0 30.4 22.2 40.5
Driverresidencystatus Resident 77.7 77.6 90.1 73.3
Non-resident 22.3 22.4 9.9 36.7
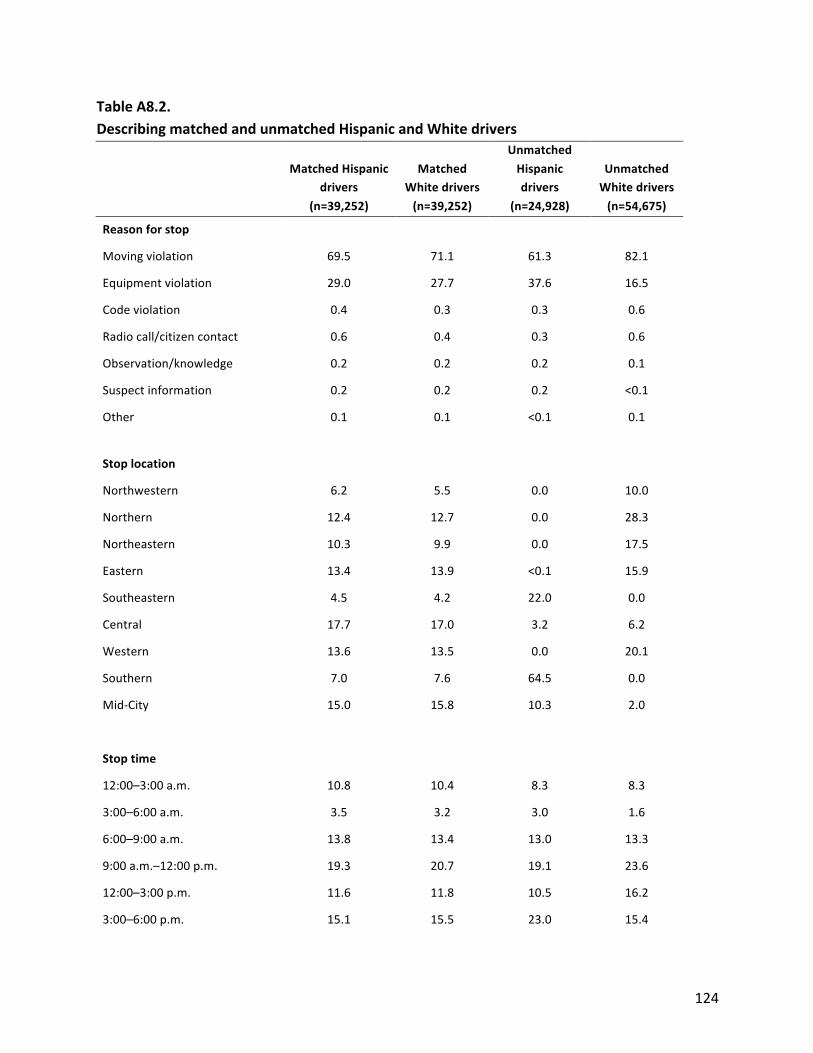
124
TableA8.2.DescribingmatchedandunmatchedHispanicandWhitedrivers
MatchedHispanicdrivers
(n=39,252)
MatchedWhitedrivers(n=39,252)
UnmatchedHispanicdrivers
(n=24,928)
UnmatchedWhitedrivers(n=54,675)
Reasonforstop
Movingviolation 69.5 71.1 61.3 82.1
Equipmentviolation 29.0 27.7 37.6 16.5
Codeviolation 0.4 0.3 0.3 0.6
Radiocall/citizencontact 0.6 0.4 0.3 0.6
Observation/knowledge 0.2 0.2 0.2 0.1
Suspectinformation 0.2 0.2 0.2 <0.1
Other 0.1 0.1 <0.1 0.1
Stoplocation
Northwestern 6.2 5.5 0.0 10.0
Northern 12.4 12.7 0.0 28.3
Northeastern 10.3 9.9 0.0 17.5
Eastern 13.4 13.9 <0.1 15.9
Southeastern 4.5 4.2 22.0 0.0
Central 17.7 17.0 3.2 6.2
Western 13.6 13.5 0.0 20.1
Southern 7.0 7.6 64.5 0.0
Mid-City 15.0 15.8 10.3 2.0
Stoptime
12:00–3:00a.m. 10.8 10.4 8.3 8.3
3:00–6:00a.m. 3.5 3.2 3.0 1.6
6:00–9:00a.m. 13.8 13.4 13.0 13.3
9:00a.m.–12:00p.m. 19.3 20.7 19.1 23.6
12:00–3:00p.m. 11.6 11.8 10.5 16.2
3:00–6:00p.m. 15.1 15.5 23.0 15.4

125
TableA8.2.DescribingmatchedandunmatchedHispanicandWhitedrivers,cont.
6:00–9:00p.m. 10.6 10.0 11.8 9.3
9:00p.m.–12:00a.m. 15.3 14.9 11.4 12.4
Stopday
Monday 12.7 12.4 13.9 12.1
Tuesday 17.5 18.0 15.6 19.2
Wednesday 17.3 17.6 15.0 19.5
Thursday 16.4 16.7 15.2 17.7
Friday 14.4 14.3 16.2 13.2
Saturday 12.2 12.0 12.9 10.2
Sunday 9.5 9.1 11.3 8.1
Stopmonth
January 8.8 8.5 8.6 8.9
February 10.2 10.5 10.3 9.8
March 9.2 9.1 9.4 9.0
April 9.8 9.8 9.1 10.1
May 8.9 8.7 8.4 8.9
June 8.2 7.9 8.5 8.3
July 7.6 7.8 9.0 8.6
August 8.2 8.3 8.6 8.0
September 7.1 7.1 7.3 7.0
October 7.4 7.3 7.1 7.1
November 7.8 8.0 6.9 7.6
December 6.9 7.1 6.8 6.6

126
TableA8.2.DescribingmatchedandunmatchedHispanicandWhitedrivers,cont.
DriverAge
Under18 0.9 0.6 0.5 1.9
18-25 24.9 25.0 29.8 16.1
26-35 30.4 30.7 27.5 25.2
36-45 20.5 20.0 19.9 16.5
46andunder 23.4 23.7 22.2 40.3
Drivergender
Male 66.4 67.3 68.2 57.7
Female 33.6 32.7 31.9 42.3
Driverresidencystatus Resident 70.8 70.7 69.0 76.8
Non-resident 29.2 29.3 31.0 23.2

127
Appendix9ModelingdriverhitratesafterdroppingmissingcontrabandcasesAs we note in Chapter 3, 93 percent of stops recorded in 2014 and 2015 were missinginformation about the discovery of contraband. In the analysis discussed in Chapter 5, weinterpreted these missing data to mean that no contraband was found. To account for thepossibilitythatthisassumptionaffectedtheaccuracyofouranalysis,wedroppedthemissingdataand re-matchedBlackandHispanicdriverswithWhitedrivers. Though the sample sizesweresignificantlysmaller, theresultsareconsistentwiththeprevious ‘hitrate’ findings,as isshowninTablesA9.1andA9.2.TableA9.1.ComparinghitratesamongmatchedBlackandWhitedriversafterdroppingmissingandnullcases
MatchedBlackdrivers(%)
MatchedWhitedrivers(%)
Difference(%) p-Value
Allsearches 10.7 17.9 -50.71 <0.001
Consent 9.9 19.7 -66.25 <0.001
Fourthwaiver 6.9 22.6 -106.06 <0.001
Inventory 19.8 18.6 6.17 0.024
Incidenttoarrest 4.1 9.0 -74.52 0.810
Other(uncategorized) 25.5 39.7 -43.55 0.055Note:Theanalysisisbasedonatotalof1,998Blackdriversand1,998matchedWhitedrivers.Missingandnullcasesdropped.
TableA9.2.ComparinghitratesamongmatchedHispanicandWhitedriversafterdroppingmissingandnullcases
MatchedHispanicdrivers(%)
MatchedWhitedrivers(%) Difference(%) p-Value
Allsearches 9.8 17.1 54.36 <0.001
Consent 9.6 22.2 79.43 <0.001
Fourthwaiver 13.6 16.9 22.20 0.258
Inventory 3.9 5.5 33.80 0.222
Incidenttoarrest 11.0 18.5 51.01 0.021
Other(uncategorized) 35.2 46.1 26.77 0.097Note:Theanalysisisbasedonatotalof3,038Hispanicdriversand3,038matchedWhitedrivers.Missingandnullcasesdropped.

128
Appendix10ModelingdriverhitratesafterdroppingmissingcontrabandcasesTheanalysisofcitationratesdiscussedinChapter5wasbasedontheassumptionthatmissingand null cases indicated that no citation was issued. To address the possibility that thesefindings were skewed by the incorporation of ambiguous data, we re-matched drivers afterdropping fromthesamplestoprecordsthat includedeithermissingornullcitationdata.Theresultsareshown inTableA10.1andA10.2.Theresultsweresubstantivelyunchanged:Blackdrivers remain less likely toreceiveacitationthanWhitedrivers,whileHispanicsandWhitesareticketedatnearlyidenticalrates.TableA10.1.ComparingcitationratesformatchedBlackandWhitedriversafterdroppingmissingcontrabandcases
MatchedBlackdrivers
(%)
MatchedWhite
drivers(%)
Difference(%)
p-ValueMatchedpairs
Searcheddriversincluded 54.6 60.4 -5.1 <0.001 19,103
Searcheddriversexcluded 54.4 60.5 -6.1 <0.001 18,504
Note:Missingandnullcasesdropped.TableA10.2.ComparingcitationratesformatchedHispanicandWhitedriversafterdroppingmissingcontrabandcases Matched
Hispanicdrivers(%)
MatchedWhite
drivers(%)
Difference(%)
p-ValueMatchedpairs
Searcheddriversincluded 63.7 62.7 0.9 0.003 38,059
Searcheddriversexcluded 63.7 62.9 0.8 0.011 37,203
Note:Missingandnullcasesdropped.

129
Appendix11SDPDofficertrainingOnNovember4,2016,wereceivedthefollowingstatementfromtheSanDiegoPoliceDepartmentregardingtheircurrentofficertrainingrequirements:
SDPDisarecognizedleaderinofficertraining.Theconceptsofde-escalation,non-biasedpolicing,communitypolicinganddiversityareembeddedinalltrainingattheacademy,andallswornranksreceiveongoingtrainingintheseareas.Thefollowinghighlightsspecifictrainingcoursesofferedinthepastfewyears.• AcademyTrainingforNewRecruits:
§ PeoplewithDisabilities&MentalIllness—15hours§ PolicingintheCommunity—24hours(POSTonlyrequires18hours)
IncludesCommunityPolicing,MediaSensitivity,CommunityMobilization,CommunityPartnerships,ResourceDevelopment,CrimePrevention,etc.
§ CulturalDiversity/Discrimination—46hours(POSTonlyrequires16hours)IncludesEEO,CulturalDiversity,RacialProfiling,Spanish,LGBT,Hatecrimes
§ VictimologyandVictimAssistance—6hours• NewOfficerPhaseTrainingafterAcademy—increasedby5weeksin2015:
§ Agency-SpecificTraining—immediatelyfollowsacademygraduationIncludesfamilywellnessday(addedin2012)andone-daybustour(addedinspring2015)
§ Observation/CommunityEngagementPhase—onemonth,providedpriortofieldtrainingphases(addedinsummer2015)
§ CrisisResponseTeamTraining(CRT)—40hours,providedtoallnewofficers(addedin2015)Includesde-escalation,dealingwiththementallyill,slowingdownresponses,awaitingadequatecover,andsupervisoryoversight
§ EmotionalIntelligence/EffectiveInteractions—16hours,aftercompletionoffourthfieldtrainingphase,justpriortobeingreleasedontheirown(addedfall2015)
• AdvancedOfficerTraining(AOT)requiredforallofficersandsergeantseverytwo
years—40hours§ 2015-2016agendaincludesthefollowingtopics:
• NonBiasedBasedPolicing—3.5hours• TacticalCommunication—2hours• DefensiveTactics/UseofForce(includingde-escalation)—4.5hours• CivilLiabilities—2hours

130
• Wellness(includingemotionalintelligence)—2hours§ 2017-2018plannedagendaincludesthefollowingtopics:
• NonBiasedBasedPolicing—3hours• TacticalCommunication—2hours• DefensiveTactics/UseofForce(includingde-escalation)—5hours• EmotionalIntelligence—5hours
• CommandTrainingrequiredforallsergeants,lieutenantsandcaptains—40hours(addedinsummer2015)§ 2015agendaincludedthefollowingtopics:
• PERFReportandRecommendationImplementationPlan—1.5hours• EmotionalIntelligenceModel—2hours• ProceduralJusticeModel—2hours• TacticalDe-escalation—1hour• CrucialConversations/PracticalApplicationofEmotionalIntelligence—2
hours• EmployeeWellness/SelfCare—1hour• MitigatingLiabilities—2hours• Captain’sDiscussion—3hours• Non-BiasBasedPolicing—1.5hours• BodyWornCameraPanel(howtoenhanceaccountability,transparencyand
reduceliability)—2hours• Leadership—4hours
§ 2016agendaincludedthefollowingtopics:• Leadership—2hours• CriticalIncidentDebrief(lessonslearned)—2hours• DemonstrationManagement—1hour• TacticalScenarioTraining—4hours
• Fall2015FieldTrainingOfficerRefresher—allFieldTrainingOfficers,includedthe
following:§ ProceduralJustice§ EmotionalIntelligence


