Download - TRIPS Transforming Raw Information In Public Services Michele Chew – Derbyshire County Council
TRIPS
Transforming Raw Information In Public Services
Michele Chew – Derbyshire County Council
A Brief History of TRIPS
• Brainchild of Mike Charnley-Fisher and CSED• Developed in the East Midlands Region• Now entering Phase 2• If proof of concept is successful, TRIPS will be
considered for potential national adoption by DH, and by the NHS IC as a means to better collect national level data
TRIPS : What is it?• An analytical tool that allows different sources of financial
and activity data to be combined• It contains data from the PSSEX1 Returns from the past 5
years and will allow the new 2009/10 PSSEX1 Return data to be added for analysis
• It allows scenarios to be plotted and set up for regular monitoring
• It permits the identification of patterns of service that can then be further explored in TRACS
• It allows us to see the wood for the trees
18 April 2023
3
TRIPS : Current Developments• TRIPS is being further developed in the context of SIIP and
the National Information Strategy.• A Social Care Quality Outcomes Framework (SCQOF) is
being developed.• A zero based review of statutory returns is currently
under way.• The current phase of TRIPS has four deliverables called
Gateways.• This further development of TRIPS is to be undertaken
with SCQOF and the zero based review in mind.
18 April 2023
4

TRIPS : Gateways• Gateway 1: Extraction of Data• Gateway 2: Data Cleansing and Data Dictionary• Gateway 3: Business Logic• Gateway 4: Analysis Packs
18 April 2023
5
Current Outputs from TRIPS
• Bespoke Reports• Two existing analysis packs – Use of Resources
and Expenditure by Service User Group
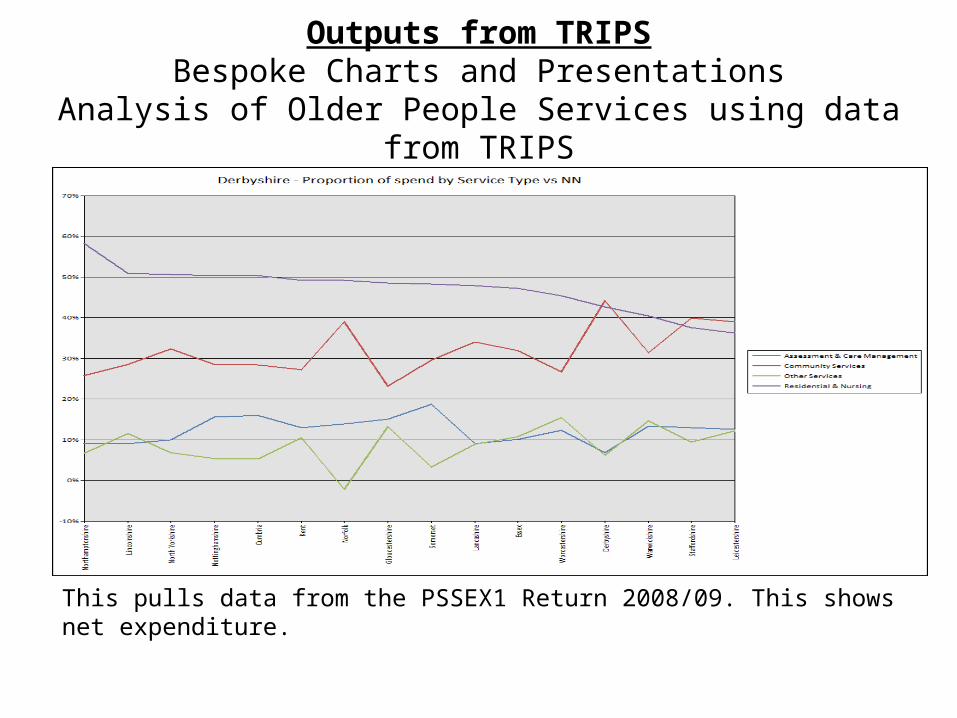
Outputs from TRIPSBespoke Charts and Presentations
Analysis of Older People Services using data from TRIPS
This pulls data from the PSSEX1 Return 2008/09. This shows net expenditure.
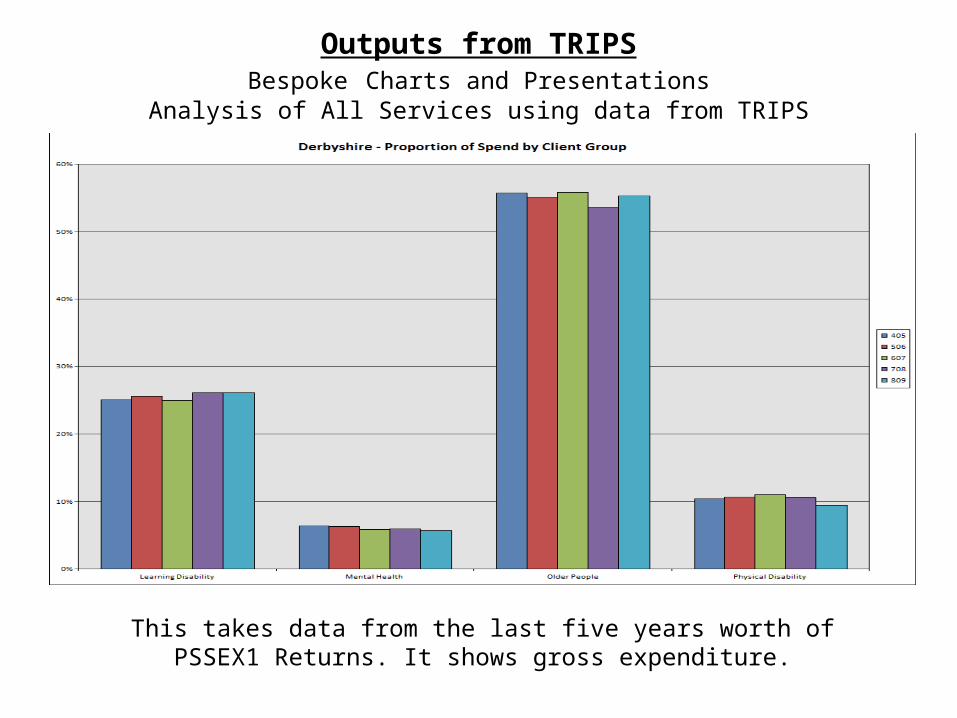
Outputs from TRIPSBespoke Charts and Presentations
Analysis of All Services using data from TRIPS
This takes data from the last five years worth of PSSEX1 Returns. It shows gross expenditure.
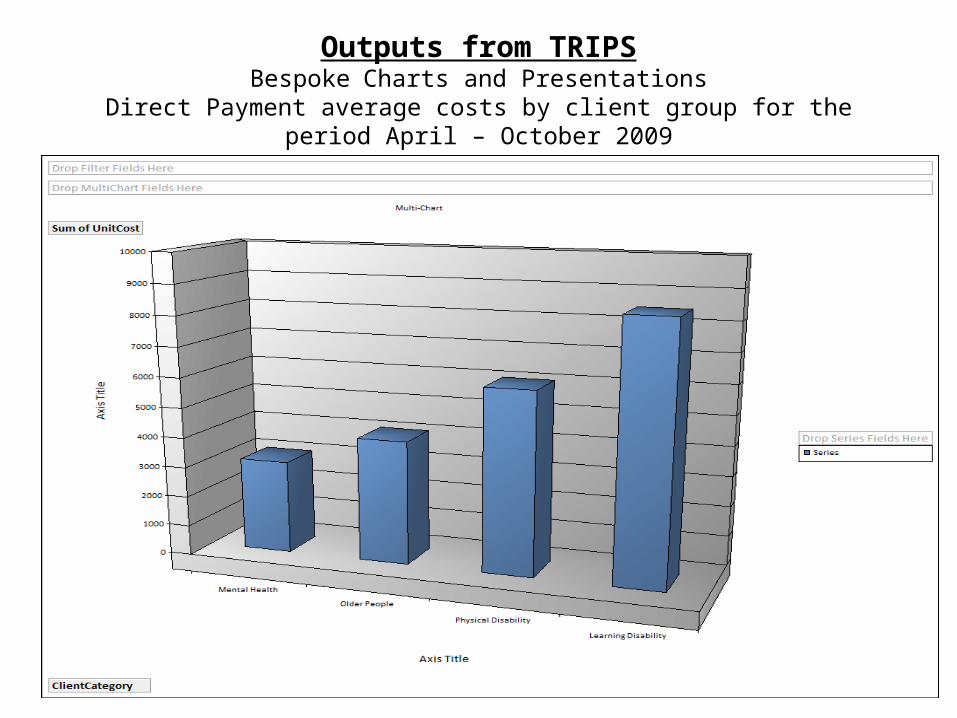
Outputs from TRIPSBespoke Charts and Presentations
Direct Payment average costs by client group for the period April – October 2009

Analysis Pack 1
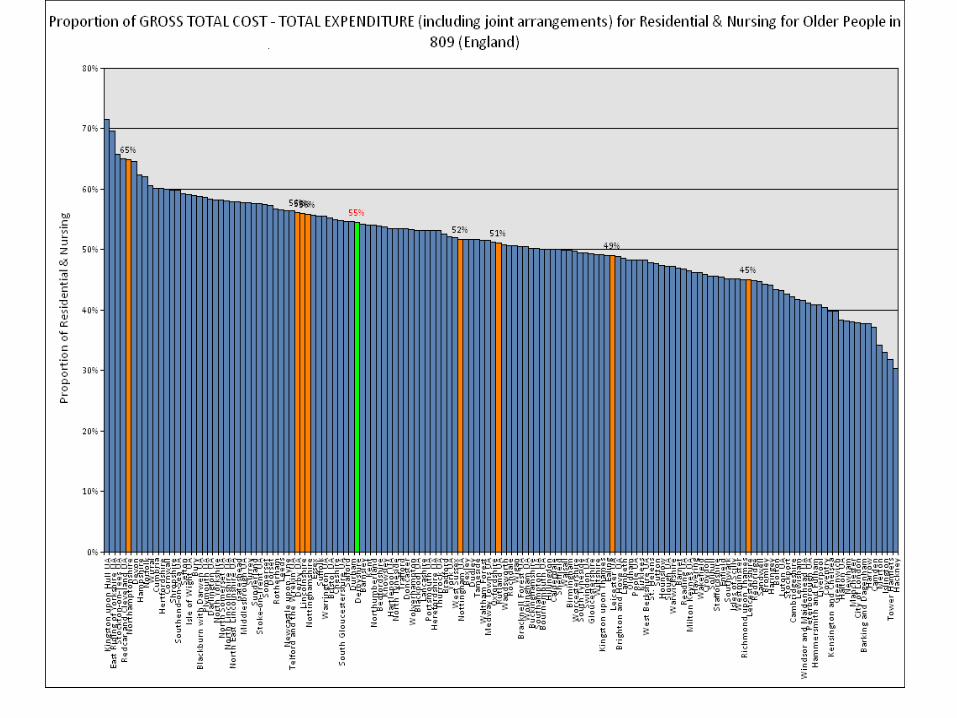
• Use of Resources – source PSSEX1 Returns• Here is an example bar chart showing gross
expenditure on residential and nursing care for older adults in 08/09
• Plus a pie chart showing the proportion of expenditure in 08/09
Outputs from TRIPSCharts and Presentations
Analysis of All Services using data from TRIPS
This takes data from the last five years worth of PSSEX1 Returns. It shows gross expenditure.
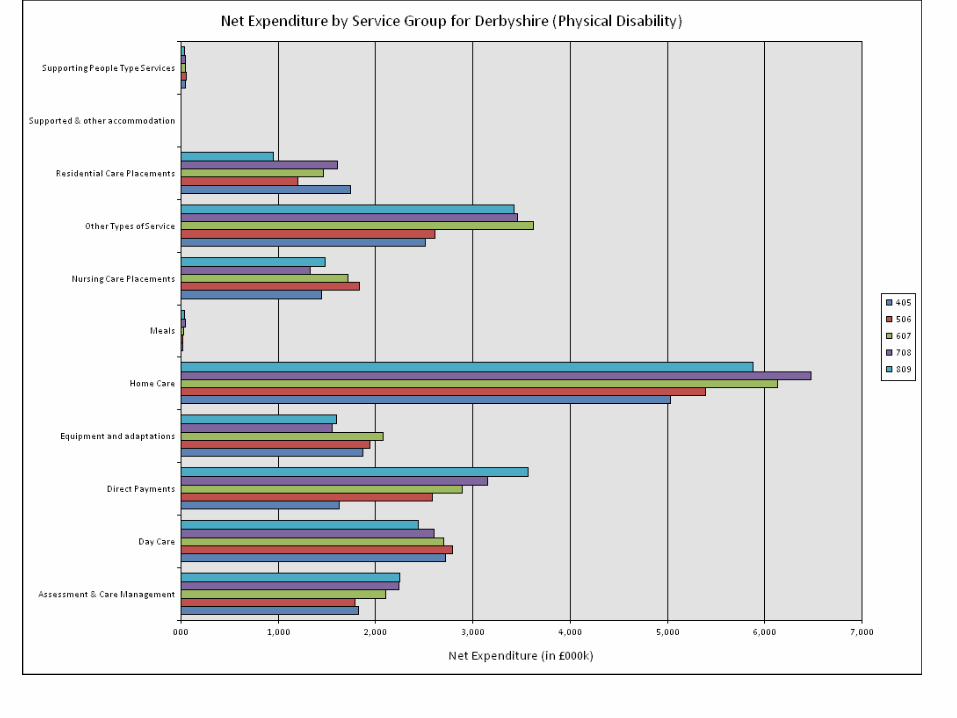
Analysis Pack 2
• Expenditure By Client Group• Here is an example slide showing P&S services
Outputs from TRIPSCharts and Presentations
Analysis of Direct Payment numbers during period April – October 2009
CSED LD Analysis
• CSED used TRIPS to complete analysis of LD services in the East Midlands
• Here is an example slide showing expenditure on community based LD services
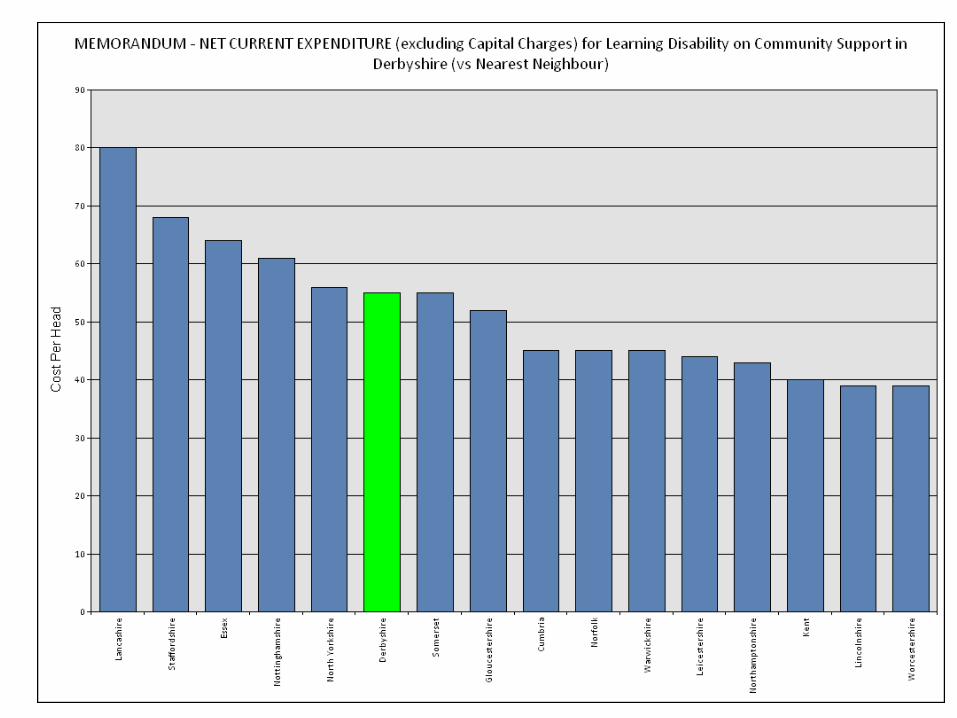
CSED Analysis of LD Services
• TRIPS was used by the Region to complete its analysis of LD Services
ADASS Analysis
• We recently completed an exercise for ADASS based on 08/09 PSSEX1 Data
• Here are two example slides showing Gross Spend per Head for Older People 08/09 by Inner London Authorities and by County Councils
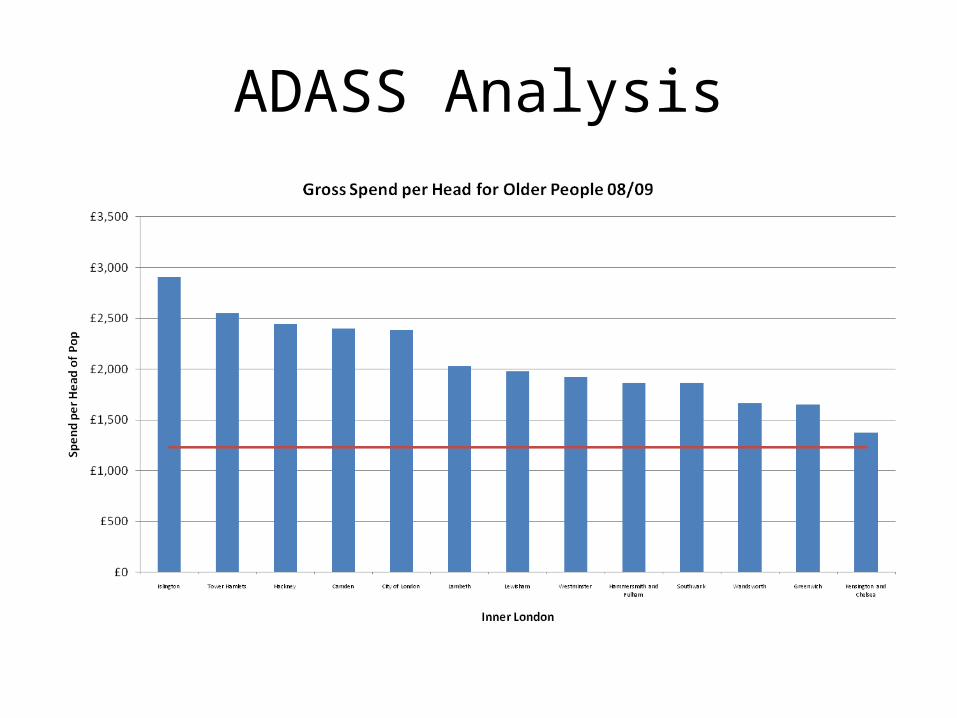
ADASS Analysis
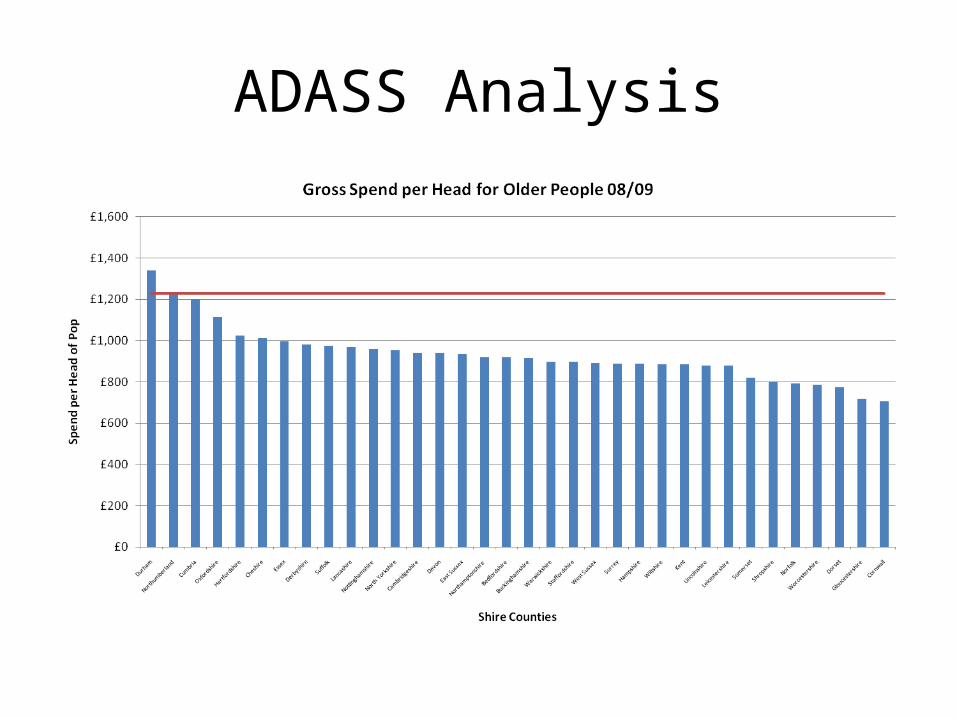
ADASS Analysis
Current use of TRIPS in Derbyshire
• Tidying up data in complex spreadsheets• Providing in-year unit cost analysis for
monitoring purposes• Identifying trends for future analysis and
target setting
New Analysis Packs
• Further Reporting Packs are in Development in the East Midlands:– In-year PSSEX1 Analysis and creation of PSSEX1
Return– Individual Statements/Personalisation– Re-ablement– Unit Cost Analysis
TRIPS Next Steps
• Completion of Proof of Concept in the East Midlands
• If successful, TRIPS could become a useful local solution for LA analysis and reporting, and play a significant role in the provision of data for national level analysis through the NHS IC's NASCIS solution

TRIPS
Any Questions?


