
Supporting Information
Large-scale Hollow Nanoparticles Identification by X-ray Absorption Spectroscopy
Yuanhong Tang,1,a) Zhiqiang WANG,1 Dongniu Wang,2 Jian Wang2 and Tsun-Kong Sham1,a)
1Department of Chemistry, University of Western Ontario, London, N6A 5B7, Canada
2Canadian Light Source Inc., 44 Innovation Boulevard, Saskatoon, S7N 2V3, Canada
a) Author to whom correspondence should be addressed. Electronic mail: [email protected]
and [email protected]. Phone: +1-519-661-2111 Ext. 86341
Thickness Modelling of the SiO2 hNP
To obtain the thickness distribution of the SiO2 hNP, reference spectrum of SiO2 is needed. First
XANES spectra of SiO2 hNP was acquired through stack scan at O K-edge. In the absence of
absorption saturation, XANES spectra are obtained through the transmitted light intensity and the
incident beam intensity (recorded in the absence of sample region of the same stack) using the Beer-
Lambert law:
(1)
where OD is the optical density, also called absorbance (A), T is the transmittance, I0 and I are the
incident and transmitted X-ray photon flux (photons) respectively, μ is the energy dependent mass
absorption coefficient (cm2/g), ρ is the density (g/cm3) of the material, and l is the sample thickness
(nm). Then these spectra were converted to absolute linear absorbance scales (i.e. optical density
per nm thickness sample). This was manipulated using the software package aXis2000 by scaling
the XANES spectra of the pure material to match that of the linear X-ray absorption for the
elemental composition of the material. For a specific compound, the elemental linear X-ray
absorption, which neglects interactions such as bonding among the atoms, is calculated by aXis2000
1
1
2
3
4
5
6
7
8
9
10
11
12
13
14
15
16
17
18
19
20
21
22
23

using equation 1 and 2 (which computes sum of the weighted atomic photoabsorption cross
sections) with a known density,
(2)
where NA is the Avogadro’s number, M is the molecular weight of a compound containing xi atoms
of type i, σai is the atomic photoabsorption cross section (cm2/atom) for type i atom.
Specifically, O reference spectra was obtained by fitting the original XANES spectra to match its
calculated elemental linear X-ray absorption profile (SiO2: density = 2.65 g/cm3, and thickness = 1
nm) in the pre-edge and continuum. The reference spectra of SiO2 and its elemental linear X-ray
absorption profiles are shown in Figure S1. Then, the thickness was obtained by comparing the OD
of each pixel in a STXM image and reference spectra. Due to that the dimension of the SiO2 hNP
(about 125-350 nm) is much larger than the pixel size (30 nm), the obtained values of thickness are
accurate ( 10%).
2
24
25
26
27
28
29
30
31
32
33
34
35
36
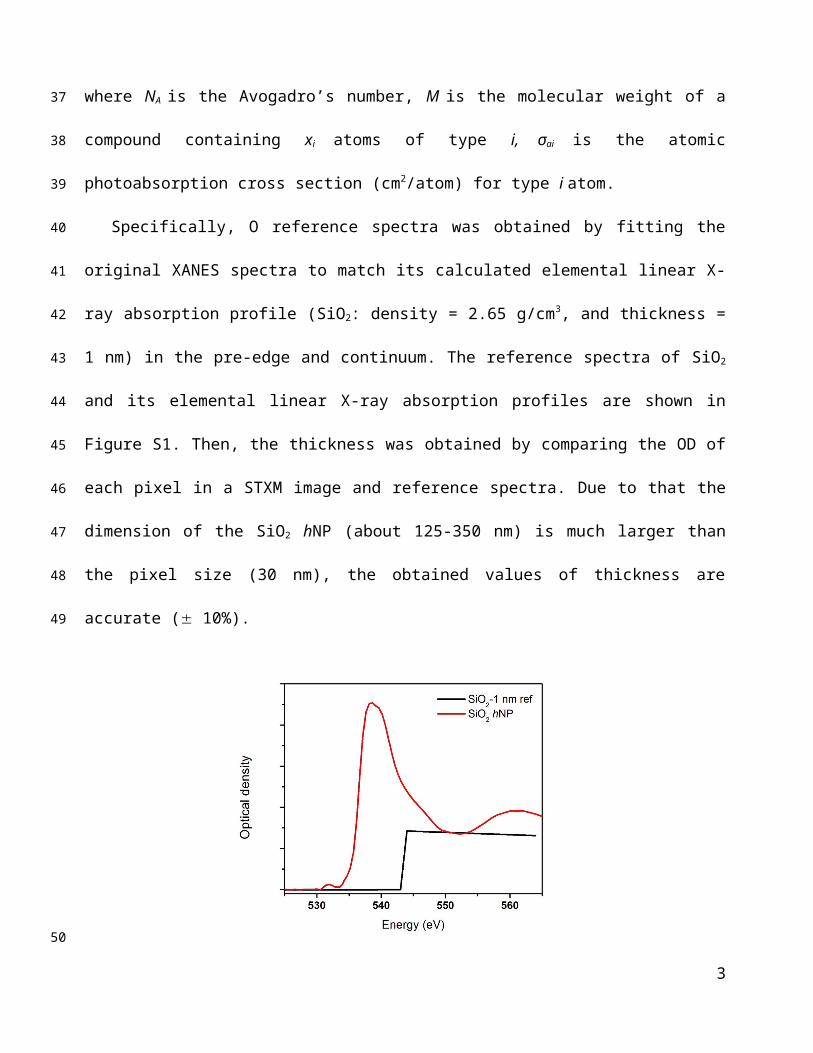
Figure S1. Reference spectra and elemental linear X-ray absorption profiles of SiO2 at O K-edge
(red line: optical density spectrum of 1 nm thickness, black line: elemental linear X-ray absorption
profile based on formula SiO2, density = 2.65 g/cm3, and thickness = 1 nm).
_____________________________
a) Author to whom correspondence should be addressed. Electronic mail: [email protected]
and [email protected].
3
37
38
39
40
41
42
43


