
Through Silicon Via (TSV)Through Silicon Via (TSV) Metrology with White Light Interference MicroscopyMetrology with White Light Interference Microscopy
Erik Novak and Joanna SchmitVeeco Instrument, Inc.
Tucson, Arizona
©2009 Veeco Instruments Inc.2
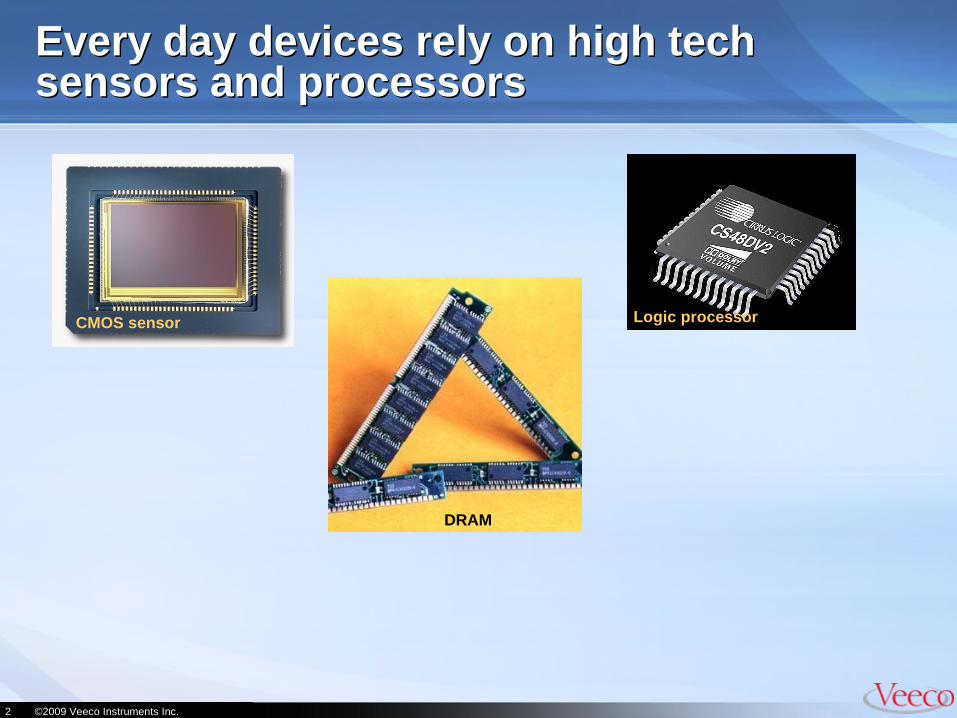
Every day devices rely on high tech sensors and processors Every day devices rely on high tech sensors and processors
CMOS sensor
DRAM
Logic processor

©2009 Veeco Instruments Inc.3
3D Integration Will Enable Advances in Device Performance and Cost 3D Integration Will Enable Advances in Device Performance and Cost

©2009 Veeco Instruments Inc.4
Adoption of TSV is Expected to Accelerate Adoption of TSV is Expected to Accelerate
16% CAGR
3D Equipment: wafer bonders, chip bonders, etching-drilling, plating, lithography, deposition-coating, temporary bonding, grinding-thinning, inspection & metrology, test tools
3D materials: advanced photoresist, permanent & temp adhesives, gas, advanced substrates…
D

©2009 Veeco Instruments Inc.5
TSV Metrology Needs Are DiverseTSV Metrology Needs Are Diverse
Via Dimensions– Via diameters are 50um (CIS) down to 1-2um (Logic)– Via aspect ratios are typically 1:1 to 10:1
Prioritized Measurement Requirements– Depth– Top & Bottom CD– Via Pitch– Sidewall angle (top & Bottom)

©2009 Veeco Instruments Inc.6
Multiple Optical Methods Serve TSV Measurement Needs Multiple Optical Methods Serve TSV Measurement Needs
Infrared illumination based microscopes– “See” through silicon– Allows for alignment of stacked wafers – Poor lateral and vertical resolution due to
– Long wavelength– High measurement noise
White light confocal systems– Good lateral resolution– Lower vertical resolution for high aspect ratios– Slow vertical scans– Does not “see through silicon”
White light interferometric optical profiler– Good lateral resolution– Excellent vertical resolution even at high aspect ratio– Fast vertical scans– Mature technology, in production for decades– Does not “see through silicon”

©2009 Veeco Instruments Inc.7
White Light Interferometers Are Easy-to-Use But Powerful Metrology Systems
Add an specialized objective and precision scanner to an extremely stable microscope platform
Scan objective vertically through focus
CCD camera captures the sinusoidal interference pattern during the scan
Best focus is determined from signal phase and/or contrast
A 3D image is created from the best focus map
Sample
Beamsplitter
ObjectiveMirauInterferometer
Light Source
CCD
Reference signaldetector(s)
Reference signal module
Laser
Mirror on the scanner
Reference mirror
Mirror

©2009 Veeco Instruments Inc.8
System Rapidly Scans Through Focus for Rapid 3D Measurements
System Rapidly Scans Through Focus for Rapid 3D Measurements
VSI•Height ranges up to 10mm
•Measurement Time < 5 sec
•Vertical resolution 0.01nm

©2009 Veeco Instruments Inc.9
Standard WLI Profilers Provide Excellent Metrology for Vias Down to 5 µm Widths Standard WLI Profilers Provide Excellent Metrology for Vias Down to 5 µm Widths
Widthmicrons
MaxAR
TRENCH >2 10:1
VIA >5 4:1
Excellent for measurement of via:
– Depth– Top CD – Via Pitch
1 sigma variation typically < 0.05%

©2009 Veeco Instruments Inc.10
Narrow Features Are Challenging but Measurable with Optimized WLI Systems Narrow Features Are Challenging but Measurable with Optimized WLI Systems
Capabilities of optical profiler are increased by:
– Modified illumination
– Advanced Signal Processing
– Precise system alignments
Very Little Light Strikes The Bottom of the Via

©2009 Veeco Instruments Inc.11
Custom Objective Uses a Separate Illuminator to Penetrate Deep Features Custom Objective Uses a Separate Illuminator to Penetrate Deep Features
MicroscopeObjective
Sample
ReferenceMirror
Fringes in focus
Advantages of illumination from below of the objective• Collimated illuminating beam better penetrates the via• High numerical aperture of objective captures most light

©2009 Veeco Instruments Inc.12
Specialized Signal Processing Distinguishes Between Substrate and Via Signals Specialized Signal Processing Distinguishes Between Substrate and Via Signals
Ghost fringes in void area of via.
‘Ghost’ fringes appear on top and bottom of trenches and vias < 5um wide and may be stronger than the true signal
Narrow features cause signal from each surface to extend into other regions

©2009 Veeco Instruments Inc.13
System Alignment Must Be Perfect to Measure Deep Features System Alignment Must Be Perfect to Measure Deep Features
Objective
System
Lateral misalignment of optical elements
Objective
Relative tilt of objective/sample
MicroscopeObjective
Sample
ReferenceMirror
Position
Fringes below focus
Fringes in focus
•Precise alignment required in order for the light to reach the bottoms of vias and trenches.•Positions and angle of many optical elements needs to be tightly controlled•Laser is used for best performance
Light source positionTilt of the bending mirror/prismTurret lateral offset positionTilt of the objective
(may be caused by the tilt of the reference mirror)
Reference mirror alignment

©2009 Veeco Instruments Inc.14
TSV Enhancement Dramatically Improves Capability of White Light Optical Profiler TSV Enhancement Dramatically Improves Capability of White Light Optical Profiler
Widthmicrons
MaxAR
TRENCH 3-1 40:1
VIA 3-1.5 10:1
Widthmicrons
MaxAR
TRENCH 5-2 10:1
VIA 5 4:1
Standard Capabilities
With TSV Enhancements

Measurement Results

©2009 Veeco Instruments Inc.16
Narrow Trenches Up to 40:1 Aspect Ratio Can Be Measured Using Enhanced WLI systems Narrow Trenches Up to 40:1 Aspect Ratio Can Be Measured Using Enhanced WLI systems
It is easier for the light to travel inside the trench than in a via due to extended dimension in one direction
System Measurement Performance – Trenches up to 500 microns deep– 1:40 aspect ratio trenches– Fields of view from 200 µm x 300 µm to >15mm x 15mm – 4 seconds measurement time– 1 sigma repeatability <0.5%

©2009 Veeco Instruments Inc.17
Many Trenches Are Measured in Each Scan Many Trenches Are Measured in Each Scan
Integrated image processing automatically identifies and reports individual trench data
Average Depth: 14.3 microns (across all the lines)
Width from 1 to 10 microns
Average 1 Sigma Standard Deviation of depth: 70nm

©2009 Veeco Instruments Inc.18
Narrow Vias Can Also be Characterized with TSV-Enhanced WLI System Narrow Vias Can Also be Characterized with TSV-Enhanced WLI System
Lateral dimension is small in both directions: x and y so signal must be optimized
Successful Measurements: – 1.5 micron wide, 10 µm deep – 3 micron wide and 35 µm deep vias – 5 micron wide and 55 µm deep vias
– 1:15 aspect ratio vias– < 5 seconds per measurement– <0.4% 1 sigma on width and height

©2009 Veeco Instruments Inc.19
3 micron wide, 35 micron deep vias Heights are inverted here to show the profile 3 micron wide, 35 micron deep vias Heights are inverted here to show the profile
10 measurements, no remove/replace
3 micron vias:– Average Depth:
34.63 µm – Average width:
3.4 µm
Data is shown inverted for clarity
©2009 Veeco Instruments Inc.20
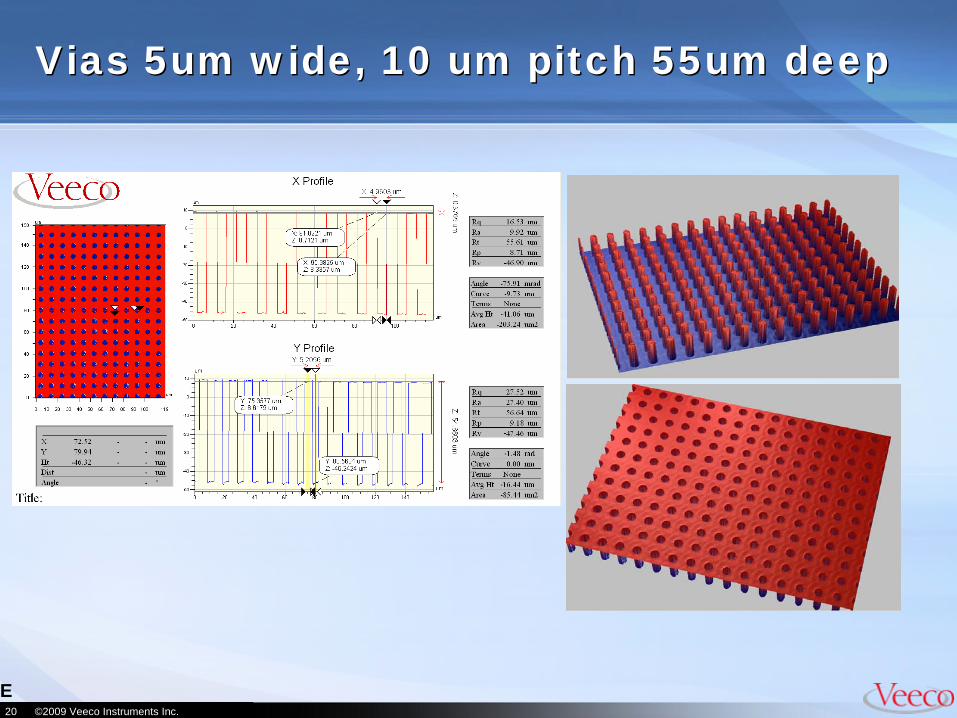
Vias 5um wide, 10 um pitch 55um deepVias 5um wide, 10 um pitch 55um deep
E

©2009 Veeco Instruments Inc.21
Veeco Has Demonstrated Capability on a Large Variety of Features Veeco Has Demonstrated Capability on a Large Variety of Features
CIS DRAM LogicLogic
(Multi-Core)Via dia (um) 5 to 50 20 to 100 5 to 20 1 to 5Thickness (um) ~ 100 20 to 75 50 to 75 20 to 50Density per wafer (k#) 40 to 300 20 to 60 200 to 1,000 1,000 to 10,000
E
Measured TSVs
0
20
40
60
80
100
120
0 5 10 15 20Wi dt h
i n mi cr ons
Dep
th in
mic
rons
Trenches 1 Trenches 2 Vias 1 Trenches 3 Sematech Vias
Current t rend Future trend M IT vias Vias 3 Trenches 4
Industry requirement by technology

©2009 Veeco Instruments Inc.22
Individual Feature Measurements Show High Repeatability Individual Feature Measurements Show High Repeatability
Dimensions Height 1 sigma Std Dev (µm)
Height 1 sigma Std Dev
Width 1 sigma Std Dev (µm)
Width 1 sigma Std Dev
3.4 x 35 µm via
0.10 0.4% 0.02 0.4%
3.0x10 µm via 0.02 0.2% 0.02 0.4%5.0 x 12 µm via
0.02 0.2% 0.01 0.2%
5.0 x 55 µm via
0.02 0.03% 0.01 0.2%
3x14 µm trench
0.07 0.5% 0.01 0.3%
Average results over a field of view typically 10X better
Multiple scans improve results by Sqrt(# measurements)

©2009 Veeco Instruments Inc.23
Enhanced WLI Provides Highly Capable TSV Measurements Enhanced WLI Provides Highly Capable TSV Measurements
Interferometry has the highest vertical resolution of any measurement technique
Visible light provides higher lateral resolution than infrared
Unlike confocal, performance is unchanged as you vary magnification/field of view
Enhanced systems measure:– Trenches of 40:1 aspect ratio, <2 µm wide – Vias of 15:1 aspect ratio, <1.5 µm wide
Systems have been in production environments for >20 years
Configurations range from table-top research systems to self-calibrating, wafer-handling systems

©2009 Veeco Instruments Inc.24
AcknowledgementsAcknowledgements
Samples:– Andy Rudack and Sematech
– MIT Microsystems Technologies Laboratory
Come See Veeco Instruments’ WLI Systems at– Chad Industries, Booth 5251, Semicon West– Veeco Metrology, Booth 8346, Intersolar
My e-mail: [email protected]


