
Twenty Years of TRIPS Agreement: What Difference Did Product Patent Protection Make to
the Pharmaceutical Industry in India?
Sudip Chaudhuri Indian Institute of Management Calcutta
International Workshop on the Impact of the TRIPS Agreement on Key Sectors and its Continuing
Relevance in the Context of Regional and Bilateral Trading Agreements
Centre for WTO Studies, IIFT, New Delhi,
26 and 27 October, 2015

Outline of Presentation
• Present some evidence on what has happened after TRIPS in India in pharmaceuticals
• Analyse how these statistics may change if product patent protection is again abolished in India
• Raise the question of desirability of limiting product patent protection in developing countries

MOLECULE BRAND MNC GROUP Price per unit in Rs
Jevtana 60 Mg Injection Cabazitaxel Sanofi-Aventis Anti-neoplastics 330000 Herceptin Injection 50 Ml Trastuzumab Roche Anti-neoplastics 110700 Erbitux 500 Mg Injection 50 Ml Cetuximab Merck Ltd Anti-neoplastics 92316 Mabthera 500 Mg Injection 50 Ml Rituximab Roche Anti-neoplastics 80000 Novoseven (Eptaccog Alfa) 2.4 Mg Injection 1 Factors Ii, Vii, Ix And X Novo Nordisk India Blood Related 79000 Torisel 25 Mg Injection 1 Ml Temsirolimus Pfizer Ltd Anti-neoplastics 74520
Alimta 500 Mg Injection 1 Pemetrexed
Eli Lilly and Company (India) Anti-neoplastics 73660
Sandostatin 0.1 Mg Injection 1 Octreotide Novartis India Blood Related 72081 Ixempra 45 Mg Injection 1 Ixabepilone BMS India Anti-neoplastics 71175
Sandostatin Lar 20 Mg Injection 1 Ml Octreotide Novartis India Blood Related 65499 3
Price of MNC monopoly drugs in India, 2013: Examples

MOLECULE BRAND MNC GROUP Price per unit in Rs
Velcade 3.5 Mg Injection 1 Bortezomib Johnson & Johnson Anti-neoplastics 60940
Caelyx 20 Mg Infusion 10 Ml
Doxorubicin (Liposomal) Fulford (India) Anti-neoplastics 48956
Macugen 0.3 Mg Injection 90 Ml Pegaptanib Pfizer Ophthal / Otologicals 47164
Remicade 100 Mg Injection 10 Ml Infliximab Fulford (India) Pain / Analgesics 41039
Actemra 400 Mg Injection 1 Tocilizunab Roche Anti-neoplastics 40799
Avastin (Roche) 100 Mg Injection 1 Bevacizumab Roche Anti-neoplastics 37180
Neulastim 6 Mg Injection 1 Pegfilgrastim Roche Anti-neoplastics 33800
Eligard Depot 45 Mg Injection 10 Ml Leuprorelin Ranbaxy Laboratories Hormones 33600
Orencia 250 Mg Injection 1 Abatacept BMS India Pain / Analgesics 30000
4
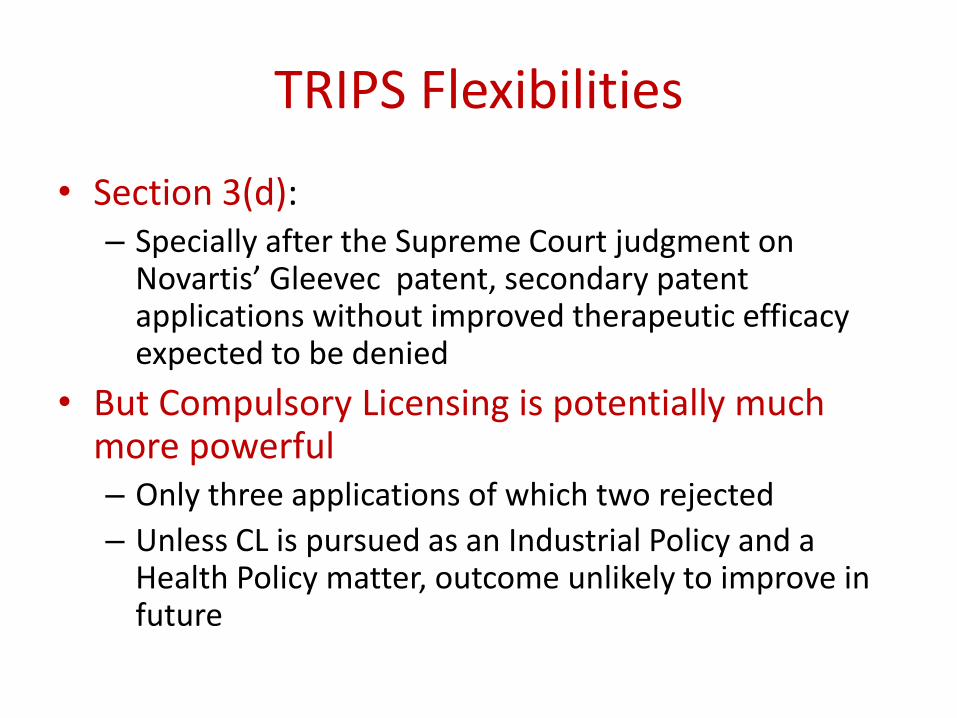
TRIPS Flexibilities
• Section 3(d): – Specially after the Supreme Court judgment on
Novartis’ Gleevec patent, secondary patent applications without improved therapeutic efficacy expected to be denied
• But Compulsory Licensing is potentially much more powerful – Only three applications of which two rejected
– Unless CL is pursued as an Industrial Policy and a Health Policy matter, outcome unlikely to improve in future

Partnership with MNCs: Examples
• Marketing tie ups – Sun Pharma/Merck
– Zydus Cadila/Bayer
– Lupin/Eli Lilly
– Biocon/Bristol Myers Squibb
• Manufacturing tie ups – Aurobindo Pharma/Pfizer
– Dr Reddys Labs/GSK
– Torrent/AstraZeneca
– Shasun/Eli Lilly

30.3
17.2
14.5
0
5
10
15
20
25
30
35
Manufacturing Pharmaceuticals Greenfield
Pe
r ce
nt
FDI flows in India, 2000 to 2012
Source Chalapati Rao et al, 2014

0
2000
4000
6000
8000
10000
12000U
SD m
illio
n
Exports of formulations, 1988-2014
Source: UNCOMTRADE

2000 2005 2014
Dr. Reddy'S Laboratories 30.0 55.8 75.5
Lupin 18.2 44.5 63.7
Aurobindo Pharma 52.8 47.7 73.3
Cipla 20.0 43.9 51.8
Ranbaxy Laboratories 40.7 60.4 53.2
Sun Pharmaceutical Inds 12.8 26.3 75.8
Divi'S Laboratories 87.6 81.9 89.1
Cadila Healthcare 8.5 12.0 54.3
Ipca Laboratories 51.5 53.3 60.2
Intas Pharmaceuticals 2.3 23.6 43.0
Torrent Pharmaceuticals 25.9 15.0 46.6
Major Indian Cos: Export/sales (%)
Source: CMIE Prowess database

EXPORTS OF
PHARMACEUTICALS
1994-95
USD million
1994-95
Percentage
of India’s
total
exports
2013-14
USD million
2013-14
Percentage
of India’s
total
exports
Regulated markets 351.45 43.9 7147.22 47.5
US 85.78 10.7 4025.8 26.7
Other markets 448.91 56.1 7902.78 52.5
Asia 206.3 25.8 2711.43 18.0
Latin America 20.2 2.5 984.23 6.5
Africa 85.3 10.7 3007.09 20.0
Source: Complied from DGCI&S

26.0 24.0 24.4
12.0
30.3
45.0
49.8
44.0
0.0
10.0
20.0
30.0
40.0
50.0
60.0
Glenmark Lupin Sun Pharma Dr Reddys
Pe
r ce
nt
Market Share: US and India, 2014-15
India USA

1995 2000 2005 2014
Sanofi India 13.52 13.26 24.30 22.38
Merck 4.66 4.98 2.99 8.57
Astrazeneca Pharma India 10.00 0.75 0.54 5.58
Abbott India 0.39 0.86 0.58 0.61
Glaxosmithkline Pharmaceuticals 2.79 8.22 1.90 0.36
Novartis India 8.29 6.74 1.83 0.89
Wyeth 1.06 8.65 0.03 0.11
Pfizer 1.77 2.01 0.55 0.04
Major MNCs in India: Export/sales (%)
Source: CMIE Prowess database

0
2000
4000
6000
8000
10000
12000
USD
mill
ion
India: Formulations Trade
Exports Imports
Source: UNCOMTRADE

0
2000
4000
6000
8000
10000
12000R
s m
illio
n
MNCs: Finished goods imports
Source: CMIE Prowess (Top 7 MNCs)

0.0
1.0
2.0
3.0
4.0
5.0
6.0
7.0
8.0
9.0
10.0
19
93
19
94
19
95
19
96
19
97
19
98
19
99
20
00
20
01
20
02
20
03
20
04
20
05
20
06
20
07
20
08
20
09
20
10
20
11
20
12
20
13
20
14
20
15
Companies with more than Rs 100 million R&D expenditure in 2012
Major Indian Cos: R&D/sales
Source: CMIE Prowess database

1995 2000 2005 2014
Dr. Reddy'S Laboratories 2.0 2.7 18.2 10.9
Lupin NA 0.7 6.9 11.1
Ranbaxy Laboratories 5.1 3.3 10.3 10.3
Cadila Healthcare NA 4.7 9.0 12.1
Cipla NA 3.9 4.1 5.4
Sun Pharmaceutical Inds 4.1 3.9 11.1 14.1
Aurobindo Pharma NA 1.9 4.7 3.7
Wockhardt NA 4.2 7.9 13.3
Glenmark Pharmaceuticals NA 3.6 9.0 5.2
Biocon NA NA 3.5 4.2
Suven Life Sciences NA 3.8 2.4 9.8
Natco Pharma 5.2 0.1 3.0 6.5
Major Indian Cos: R&D/sales
Source: CMIE Prowess database

New Drug R&D by Indian companies
• Started by Dr Reddys and Ranbaxy in early 1990s followed by several others - Glenmark, Lupin, Zydus Cadila etc
• Several molecules under development including in collaboration with foreign companies, for example Sanofi and Forest labs by Glenmark
• Initial euphoria subsided; setbacks; limited success
• Neglected diseases: Ranbaxy, anti malarial drug an exception
• Main target: developed countries market which in any case had product patent protection
17

0.00
0.20
0.40
0.60
0.80
1.00
1.20
19
93
19
94
19
95
19
96
19
97
19
98
19
99
20
00
20
01
20
02
20
03
20
04
20
05
20
06
20
07
20
08
20
09
20
10
20
11
20
12
20
13
20
14
20
15
Pe
rce
nt
MNCs: R&D/sales
Source: CMIE Prowess database: Top 8 MNCs

US Pharma Patents from India: 1969-2014
Foreign
Companies
Indian
Companies Total
1969-1994 77 7 84
1995-2014 93 1080 1173
Total 170 1087 1257
19 Source: USPTO

0
20
40
60
80
100
120
140
160
180
19
69
19
71
19
73
19
75
19
77
19
79
19
81
19
83
19
85
19
87
19
89
19
91
19
93
19
95
19
97
19
99
20
01
20
03
20
05
20
07
20
09
20
11
20
13
No
of
US
Pat
en
ts
US Patents from India, 1969-2014
Indian Foreign
Source: USPTO

0
20
40
60
80
100
120
140
160
1801
99
5
19
96
19
97
19
98
19
99
20
00
20
01
20
02
20
03
20
04
20
05
20
06
20
07
20
08
20
09
20
10
20
11
20
12
20
13
20
14
No
of
US
pat
en
ts
US Patents from India, 1995-2014
Indian Foreign

India based patenting in USA by foreign cos
• Before TRIPS – Ciba-Geigy: 42 – Hoechst: 35
• After TRIPS – Mylan (including Generics UK): 30 – Teva: 19 – Fresenius Kabi Oncology: 8 – Hoechst: 11 – Novartis 7 – Astrazeneca: 8 – Aventis: 5
22

Simulation: If product patent protection in pharmaceuticals is again abolished
Prices of new drugs Will fall
Imports of finished products Will fall
Export by Indian cos Expected to continue; in fact situation may improve
R&D by Indian cos: generics Expected to continue
R&D by Indian cos: new drugs Expected to continue
Patenting by Indian cos Expected to continue
R&D by MNCs Unlikely to worsen further
Patenting by MNCs Unlikely to be worse

Simulation: Continued
M&As by MNCs May fall; but not negative
M&As by Indian cos abroad Likely to continue
Marketing tie ups for patented products
Expected to fall; but not negative
Manufacturing tie ups Expected to continue
Exports by MNCs Unlikely to be worse
OVERALL EFFECT POSITIVE

Conclusion
If Public Policy is based on Evidence,
TRIPS Agreement needs to be reviewed


