
U GRO Capital | Q1 FY22 Earnings Presentation
Aug 12th,2021
Tech focused Small Business Lending Platform
NSE: UGROCAP | BSE: 511742
‘To Solve the Unsolved’
India’s $600B+SME Credit Availability Problem
Safe Harbor
This presentation has been prepared by UGRO Capital Limited (the “Company”) solely for your information. By accessing this presentation, you are agreeing tobe bound by the trailing restrictions.
This presentation is for information purposes only and should not be deemed to constitute or form part of any offer or invitation or inducement to sell or issueany securities, or any solicitation of any offer to purchase or subscribe for, any securities of the Company, nor shall it or any part of it or the fact of itsdistribution form the basis of, or be relied upon in connection with, any contract or commitment therefor.In particular, this presentation is not intended to be a prospectus or offer document under the applicable laws of any jurisdiction, including India.
There is no obligation to update, modify or amend this communication or to otherwise notify the recipient if information, opinion, projection, forecast orestimate set forth herein, changes or subsequently becomes inaccurate. However, the Company may alter, modify or otherwise change in any manner thecontent of this presentation, without obligation to notify any person of such change or changes
The financial information in this presentation may have been reclassified and reformatted for the purposes of this presentation. You may also refer to thefinancial statements of the Company available at www.ugrocapital.com before making any decision on the basis of this information.
Certain statements contained in this presentation that are not statements of historical fact constitute forward- looking statements. These forward- lookingstatements include descriptions regarding the intent, belief or current expectations of the Company or its directors and officers with respect to the results ofoperations and financial condition of the Company. Such forward-looking statements are not guarantees of future performance and involve risks anduncertainties, and actual results may differ from those in such forward-looking statements as a result of various factors and assumptions which the Companypresently believes to be reasonable in light of its operating experience in recent years but these assumptions may prove to be incorrect.
Potential investors must make their own assessment of the relevance, accuracy and adequacy of the information contained in this presentation and mustmake such independent investigation as they may consider necessary or appropriate for such purpose.
This presentation and its contents are for general information purposes only, without regard to any specific objectives, financial situations or informationalneeds of any particular person and should not be distributed, published or reproduced, in whole or part, or disclosed by recipients directly or indirectly to anyother person.

Table of Contents
01 Executive Summary 06 Knowledge
02 U GRO Capital - Overview 07 Technology
03 Strong Corporate Governance 08 Multi-pronged Distribution
04 Experienced Management 09 Financial & Operating Metrics andPortfolio Overview
05 Large Institutional Capital 10 Strategy & Long-Term Goals

Executive Summary

₹3,105Cr*
₹1,561 Cr*
Where we stand now
5
Metric
Cumulative Disbursals
Net Worth Employees
Active Lenders on Book
Customers
AUM Secured**
Gross Debt
₹816 Cr
74%32*
8,256₹955 Cr 392
Branches(Pin-codes)
34 (2,000+)*
GNPA / NNPA
2.3%/1.9%
Data as of 30th Jun 2021*Data as of 31st July 2021**Includes quasi-secured portfolio
Demonstrated growth on all fronts despite the disruption caused by COVID 2nd Wave

Executive Summary
6
AUM and Disbursement
▪ AUM stood at ₹1,375 Cr as on Jun’21 (₹847 Cr as on Jun’20). ~62% increase on Y-o-Y basis
▪ Total Gross Disbursement for Q1FY22 was ₹311 Cr and Disbursements (considering only incremental AUM in SCF1) was ₹159 Cr
Net Interest Income
▪ NII for the year Q1FY22 stood at ₹27.4 Cr compared to ₹23.8 Cr in Q1FY21. ~15% increase on Y-o-Y basis
Liability Management
Operating Expense
▪ Diversified lender base of 32 active lenders with addition of 23 new lenders in last 12 months
▪ Borrowing costs on a sequential downtrend; average cost of debt stood at ~10.5% in Q1FY22 compared to ~11.2% in Q1FY21
▪ Cost to Income ratio saw a marginal increase in Q1FY22 rising to 75% compared 74% in Q1FY21
▪ Opex has risen by 16% but the interest income has risen by 63% on a Y-o-Y basis
Credit Costs
▪ GNPA stood at 2.3% and NNPA stood at 1.9%
▪ Collection efficiencies was at 96% in Branch-led channel, 95% in Machinery Finance and 92% for Partnership & Alliances channel in Jun-21
▪ Selectively restructured around 7.5% of our portfolio for fundamentally sound businesses with short term cash flow issues
▪ PBT stood at ₹2.4 Cr in Q1FY22 compared to ₹4.1 Cr in Q1FY21 falling on account of higher provisions
▪ Net worth stood at ₹955 Cr in Mar-21 and CRAR was ~62%
▪ Debt-to-equity ratio stood at 0.84x indicating a long runway for growth as we leverage our balance sheet
Profitability
Net Worth
1 Supply Chain Financing2 Weighted average interest rate on AUM as on 30th Jun 2021
All Fig in ₹ Cr Q1FY22 Q4FY21 Q1FY21 FY21
AUM 1,375 1,317 847 1,317
Net worth 955 952 926 952
Branches 34 34 9 34
Lenders 32 29 9 29
Employees 392 361 175+ 361
Interest Income 49.8 43.8 30.6 147.4
Interest Expense
22.4 16.3 6.8 44.6
NII 27.4 27.5 23.8 102.8
Operating Expense
21.6 21.3 18.7 77.0
Credit Cost 4.9 8.7 1.2 19.6
PBT 2.4 2.4 4.1 12.1
Portfolio Yield2 15.8% 15.5% 14.1% 15.5%
Borrowing Cost 10.6% 10.4% 11.2% 10.4%
7
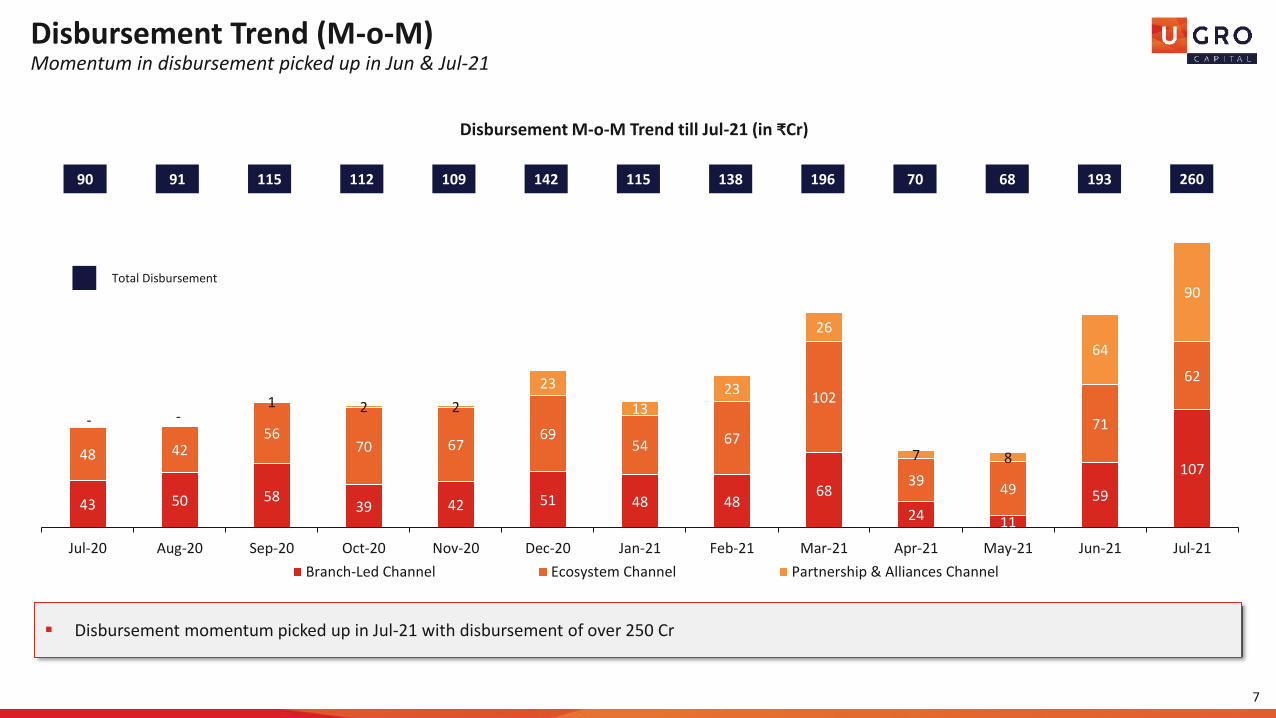
▪ Disbursement momentum picked up in Jul-21 with disbursement of over 250 Cr
43 50 5839 42 51 48 48
68
24 11
59
10748 42
5670 67
6954 67
102
3949
71
62
- -1 2 2
23
1323
26
7 8
64
90
Jul-20 Aug-20 Sep-20 Oct-20 Nov-20 Dec-20 Jan-21 Feb-21 Mar-21 Apr-21 May-21 Jun-21 Jul-21
Disbursement M-o-M Trend till Jul-21 (in ₹Cr)
Branch-Led Channel Ecosystem Channel Partnership & Alliances Channel
90 91 115 112 109 142 115 138 196 70 68
Total Disbursement
Disbursement Trend (M-o-M)Momentum in disbursement picked up in Jun & Jul-21
193 260

572 618 667 695 727 767 802 832 865 863 858 892987
148162
171 194215
223 231 246282 270 263 264
272
159151
141135
130138
138153
170.47 173.77 177.77219
303
Jul-20 Aug-20 Sep-20 Oct-20 Nov-20 Dec-20 Jan-21 Feb-21 Mar-21 Apr-21 May-21 Jun-21 Jul-21
AUM M-o-M Trend till Jul-21 (in ₹Cr)
Branch-Led Channel Ecosystem Channel Partnership & Alliances Channel
8
AUM Trend (Segment-wise MoM)Strong revival in AUM figures on account of good disbursement momentum observed in Jul-21
1,299 1,375879 931 978 1,023 1,071 1,128 1,171 1,232 1,317 1,307
▪ Strong revival in AUM growth in Jul-21 on account of record disbursement
Total AUM
1,561

U GRO Capital - Overview

U GRO Capital | Who we are
A highly specialized, technology enabled small business lending platform
10
We aspire to capture 1% market share of the total MSME lending market by 2025
Strong Corporate GovernanceBoard Controlled, Management Run
Large Institutional Capital~$130M Of Equity Raised
Experienced Management Team250+ Years of Experience
KnowledgeDeep domain expertise
TechnologyData driven approach
a b c
d e
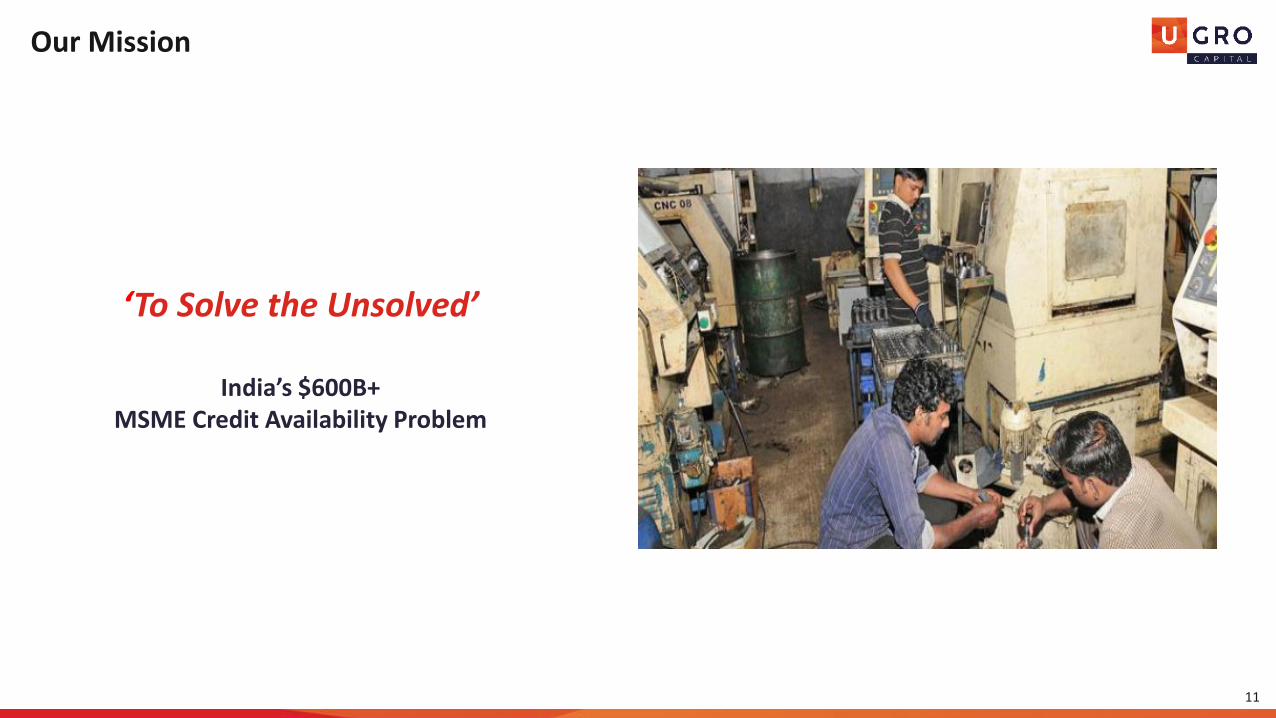
Our Mission
‘To Solve the Unsolved’
India’s $600B+MSME Credit Availability Problem
11

Our Business Model
12
Branch Channel | GRO-PlusPrime and Micro branches across Tier I to Tier VI
locations, serving a broad demographic of MSMEs
Traditional Balance Sheet
Lending using funds from banks; PSL nature of books to aid in obtaining bank financing
Co-origination
Co-originate loans with larger banks to maintain a strong liquidity position and generate fee income
Assignment
Securitization of portions of the loan portfolio so it can be purchased by MFs/Insurance Firms/Banks
Direct Digital Channel | GRO-Direct
Proprietary digital lending platform supplemented by pre-qualified leads
Partnerships & Alliances | GRO-Xstream
Partnerships with FinTechs and NBFCs for a range of secured & unsecured loans
Ecosystem Channel | GRO-Chain
Supply Chain Financing through Anchor & Non-Anchor led ecosystem and Machinery Loan through
the OEM/Dealer ecosystem
Knowledge Meets Technology
Fintech-Enabled Product Underwriting
Distribution Channels Liability Sources
Specialized Programs with DFIs
Impact led financing in partnerships with DFIs in sectors like healthcare, education, clean energy
U GRO’s distribution and liability strategies are both powered by proprietary technology modules
Strong Corporate GovernanceBoard led Management run Institution

Strong Corporate Governance framework enshrined in the Articles…
14
▪ High degree of regulatory oversight and
transparency
▪ An institution created with a long-term view,
designed for continued operational efficiency
▪ Access to permanent capital
▪ Over 80% owned by Institutional Investors
▪ As per our AoA & MoA, we shall appoint a Statutory
Auditor with good reputation, and preferably
having international affiliates.
▪ MSKA & Associates appointed as the statutory
auditor and Deloitte appointed as the internal
auditor
▪ Independent directors to comprise majority for
perpetuity
▪ Any shareholder holding >10% to qualify for a board
seat
▪ Key committees to be headed by an independent
member with required credentials
▪ The majority of the NRC, ALCO and Audit
Committees to comprise of independent directors
▪ Any proposed loan >1% of net worth or to a related
party to require unanimous approval of ALCO and the
Board
▪ Board approved multi-layer credit authority
delegation
▪ Removal of key management (including CRO, CFO) to
require 3/4th board approval
▪ Any significant action by the Company to need 3/4th
approval of the Board
Special Resolution of Shareholders required for effecting any changes to the AoAPromoters/Management do not have unfettered rights to divert business strategy

…supervised by an Independent Board comprising of Industry luminaries (1/2)
15Legend: Independent Directors, Non-executive Directors
▪ Ex-Chairman, MCX, Ex-CIC, GoI, Ex-Director - SIDBI▪ Over 40 years with the IAS (Batch of 1973)▪ Director at Pradeep Phosphates, Invesco Trustee, SME Mavens▪ M.A., Utkal University, M.Sc., London School of Economics
▪ Ex – DMD, SIDBI▪ Over 38 years with experience with SIDBI, UCO Bank and IDBI▪ Currently a director with Capital Small Finance Bank, Aye Finance, Ananya
Finance, NSE Clearing Ltd & member of the advisory committee at Ivy Capand Lok Capital
▪ PGDM from MDI
▪ Board Member – ICRA, Ex-Senior Partner, Deloitte▪ Over 30 years of experience with Deloitte, Vaish and Associates▪ Currently an independent director at ICRA, Indo Rama Synthetics,
Joyville Shaapoorji Housing, RBL Bank▪ Chartered Accountant; BA from Delhi University
NK Maini - Chairman, Risk Management Committee
Satyananda Mishra - Chairman, CSR Committee
Ranjana Agarwal - Chairman, NRC Committee
▪ Ex-CFO, Citi-India▪ Over 40 years of experience with Citi, CEAT, Tata▪ Advisor to EY, Independent Director at Trent, Cashpor Microcredit,
Kalyani Forge, Manappuram, Ujjivan Financial Services▪ PGDM from IIM Calcutta; B. Tech from IIT Kharagpur
S. Karuppasamy - Chairman, Compliance Committee
▪ Ex-Executive Director, RBI▪ Over 40 years of experience with RBI▪ Member of the RBI services board, & director ARCIL & Vivardhana
(MFI)▪ PGD in Bank Mgmt; IIBF; CAIIB (Honorary Fellow) & MA (Economics)
Abhijit Sen - Chairman, Audit Committee
Specialization: Personnel Mgmt
Specialization: Credit, SME
Specialization: Finance Function
Specialization: RBI Regulations
Specialization: Audit, Tax
Shachindra Nath – Executive Chairman and MD
▪ 26 years of experience in creating institutions across the financialservices domain
▪ 6-year stint as the Group-CEO of Religare Enterprise▪ Qualified lawyer and a University Rank holder from BHU (India)
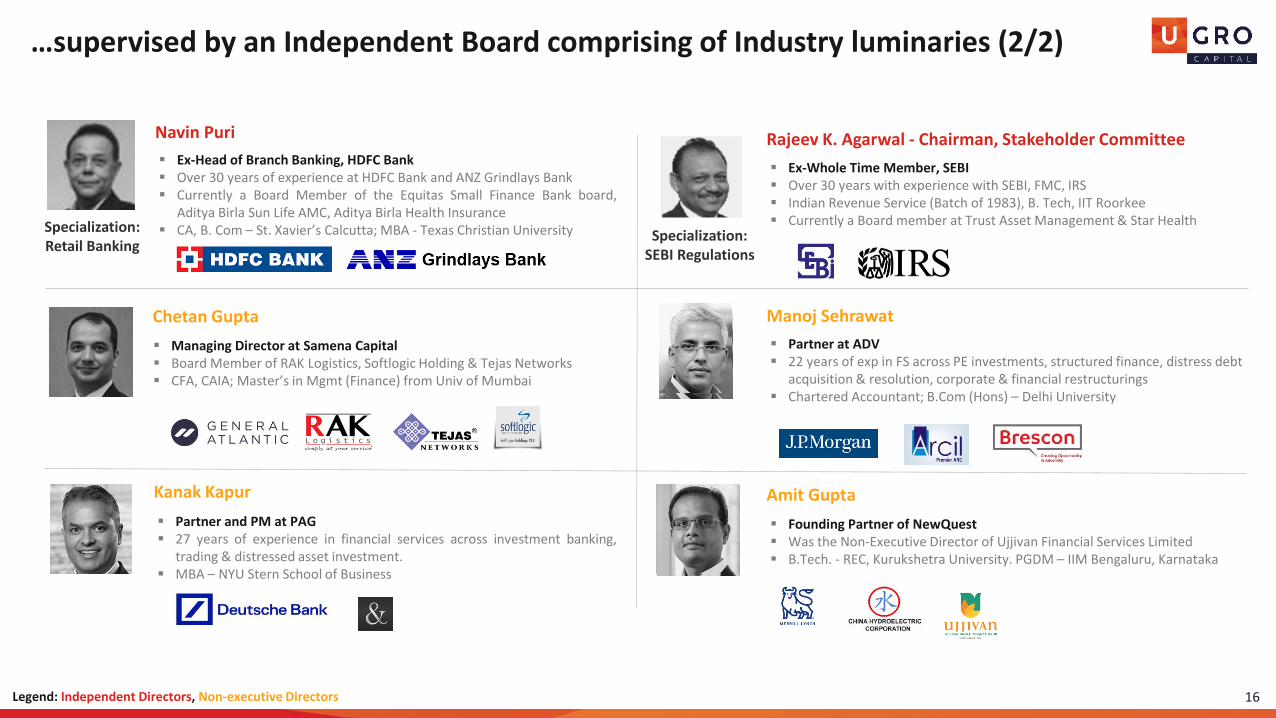
…supervised by an Independent Board comprising of Industry luminaries (2/2)
16Legend: Independent Directors, Non-executive Directors
Specialization: Retail Banking
▪ Ex-Head of Branch Banking, HDFC Bank▪ Over 30 years of experience at HDFC Bank and ANZ Grindlays Bank▪ Currently a Board Member of the Equitas Small Finance Bank board,
Aditya Birla Sun Life AMC, Aditya Birla Health Insurance▪ CA, B. Com – St. Xavier’s Calcutta; MBA - Texas Christian University
Navin Puri
▪ Founding Partner of NewQuest▪ Was the Non-Executive Director of Ujjivan Financial Services Limited▪ B.Tech. - REC, Kurukshetra University. PGDM – IIM Bengaluru, Karnataka
Amit Gupta
▪ Managing Director at Samena Capital▪ Board Member of RAK Logistics, Softlogic Holding & Tejas Networks▪ CFA, CAIA; Master’s in Mgmt (Finance) from Univ of Mumbai
Chetan Gupta
▪ Partner at ADV▪ 22 years of exp in FS across PE investments, structured finance, distress debt
acquisition & resolution, corporate & financial restructurings ▪ Chartered Accountant; B.Com (Hons) – Delhi University
Manoj Sehrawat
▪ Partner and PM at PAG▪ 27 years of experience in financial services across investment banking,
trading & distressed asset investment.▪ MBA – NYU Stern School of Business
Kanak Kapur
Rajeev K. Agarwal - Chairman, Stakeholder Committee
▪ Ex-Whole Time Member, SEBI▪ Over 30 years with experience with SEBI, FMC, IRS▪ Indian Revenue Service (Batch of 1983), B. Tech, IIT Roorkee▪ Currently a Board member at Trust Asset Management & Star Health
Specialization: SEBI Regulations

Experienced ManagementOver 250+ years of combined experience
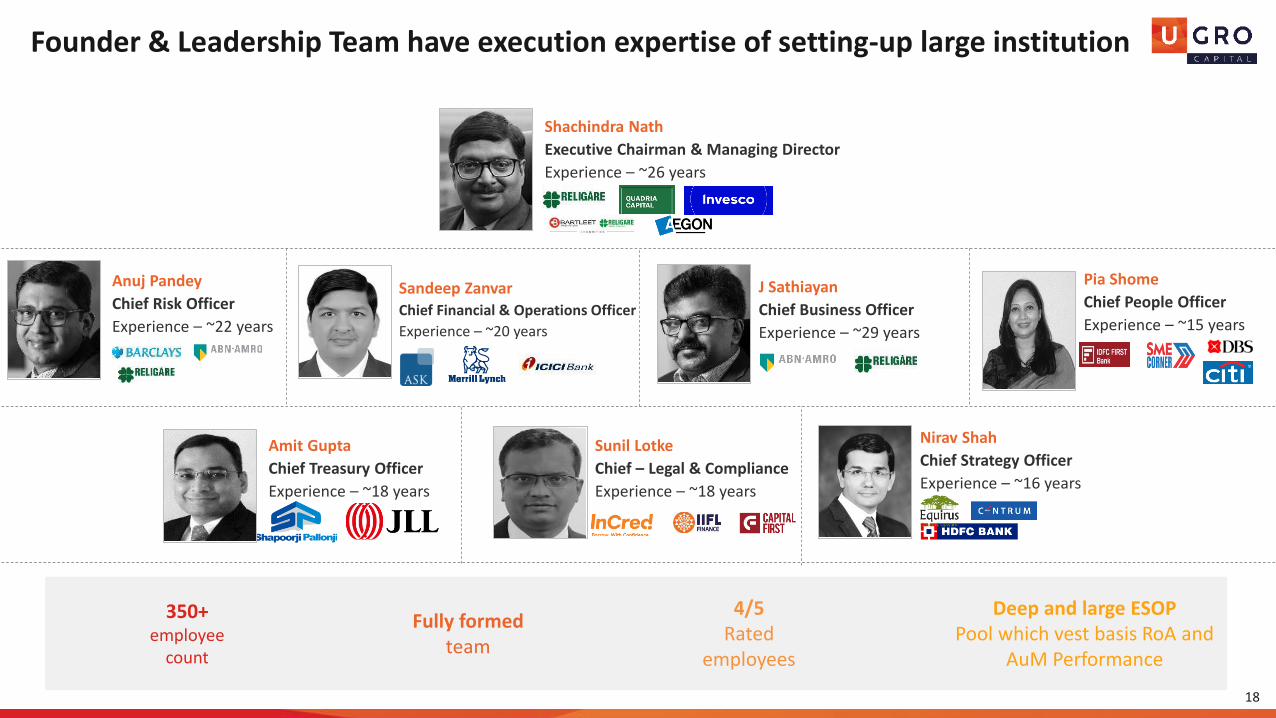
18
Founder & Leadership Team have execution expertise of setting-up large institution
Sunil Lotke
Chief – Legal & Compliance
Experience – ~18 years
Nirav Shah
Chief Strategy Officer
Experience – ~16 years
Amit Gupta
Chief Treasury Officer
Experience – ~18 years
Shachindra Nath
Executive Chairman & Managing Director
Experience – ~26 years
J Sathiayan
Chief Business Officer
Experience – ~29 years
Anuj Pandey
Chief Risk Officer
Experience – ~22 years
Sandeep Zanvar
Chief Financial & Operations Officer
Experience – ~20 years
Pia Shome
Chief People Officer
Experience – ~15 years
350+employee
count
Fully formed team
4/5Rated
employees
Deep and large ESOP Pool which vest basis RoA and
AuM Performance

Large Institutional CapitalBacked by Marquee Institutions & reputed lenders

Promoter2.7% Management ESOPs
4.8%
20.4%
20.4%
18.3%
12.5%
Others20.8%
Shareholding Pattern on a Fully Diluted basis (March-21)
Backed by Marquee Private Equity Funds, U GRO has demonstrated a robust growth since its inception
Disbursement started in Jan’2019
Jan’2019
Raised ~Rs 920 crore of Capital from multiple PE investors of global repute
Dec’2017 – Aug’2018
Acquisition of Chokhani Securities Onboarding of New Management TeamDemerger of the lending business of Asia Pragati approved – $25M
Dec’2017
₹2,500 Cr Milestone
1,000 Cr Milestone
Fund Raise
U GRO Birth
Business Launch
Crossed Rs 1,000 crore in cumulative disbursement
Dec’2019
Crossed Rs 2,500 crore in cumulative disbursement
Mar’2021
20
Chhattisgarh Investments
Jaspal Bindra
Majority of U GRO’s shareholding is
institutionally owned

KnowledgeSector based approach to specialization

Product
Customized products based on the nature of business, non-financial parameters, end use, payment
capacity/ frequency of underlying customer
Loans against property, supply chain financing, unsecured loans
Loans against property, supply chain financing
DistributionOmnichannel
Ecosystem based lendingBranch/DSA led Branch/DSA led
Credit AppraisalSector specific approach,
Cash Flow Based Automated Review
One size fits allCollateral/Bureau score
One size fits allCollateral/Bureau score
Turn-Around Time 4-5 days 15-20 days 30-45 days
Documentation
Combining traditional and non-traditional sources. Use of
information available in public and private domains. Digital document
submission
Financial Statements, P&L Account, Balance Sheets, Bank
Statements
Project Reports. Projected financials, Bank Statements.
22
Specialized MSME Lenders Traditional NBFCs Banks
Specialized MSME Lenders are better positioned to bridge the MSME Credit Gap

U GRO Lies at the intersection of Specialized NBFCs and FinTechs
U GRO intends to create a specialized, scalable platform optimized for end-to-end lending23
Fintech Platforms
Specialized NBFCs
Sector Specialization
Product Specialization
Geographical Specialization
Supply Chain Platforms
Digital Lenders
Off-Balance Sheet Lenders
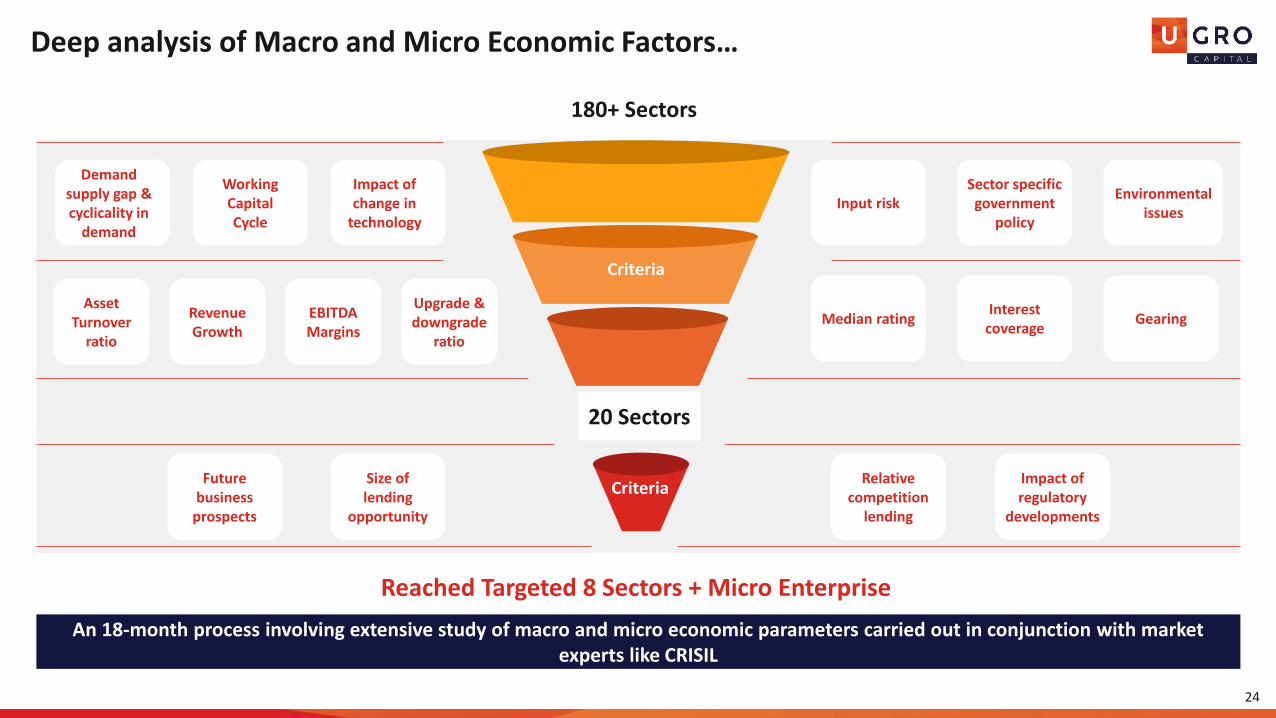
Deep analysis of Macro and Micro Economic Factors…
24
Reached Targeted 8 Sectors + Micro Enterprise
Future business
prospects
Size of lending
opportunity
Relative competition
lending
Impact of regulatory
developments
180+ Sectors
Interest coverage
Asset Turnover
ratio
Demand supply gap & cyclicality in
demand
Impact of change in
technology
Working Capital Cycle
Revenue Growth
EBITDA Margins
Upgrade & downgrade
ratio
Median rating Gearing
Sector specific government
policy
Environmental issues
Input risk
An 18-month process involving extensive study of macro and micro economic parameters carried out in conjunction with market experts like CRISIL
20 Sectors
Criteria
Criteria

…to arrive at a set of Specialized Sectors
• 8 sectors & Micro Enterprises and their allied 200+ ecosystems
• Focus on Micro & Small Businesses clusters in India
• ~50% - Contribution of the 8 sectors to the overall MSME lending market in India
• Partnership with CRISIL to deep dive into sub-sectoral developments on a monthly and quarterly basis
25
Large lending opportunity
Lower impact of regulatory changes
Secular consumption driven growth
Low geographical concentration
Relatively less competition from banks
Keen focus on lending to MSMEs
Micro-Enterprise is a sector in itself
MicroEnterprises

These sectors were further narrowed down based on their ecosystems
Healthcare Education Chemicals
Food Processing/FMCG
HospitalityElectrical Equipment
and Components
Microenterprises Auto & Light Engineering
Key sub-sectors: General nursing homes, eye clinics, dental clinics, diagnostic labs, radiology/pathology labs, pharma retailersKey clusters: NCR, Mumbai, Bengaluru, Hyderabad and Chennai
Key sub-sectors: Fine dining (standalone), QSRs, fine dining chains, manpower agencies, boutique hotels, guest housesKey clusters: NA
Key sub-sectors: K-12 schools, play schoolsKey clusters: NCR, Mumbai, Coimbatore, Chennai, Hyderabad and Pune
Key sub-sectors: Dyes and pigments, bulk and polymers, agrochemicalsKey clusters: Mumbai, NCR, Ahmedabad, Vadodara and Surat
Key sub-sectors: B2B, B2CKey clusters: NCR, Pune, Bengaluru, Chennai, Aurangabad and Rajkot
Key sub-sectors: Kirana stores, family run businesses, first generation entrepreneursKey clusters: Mumbai, Kolkata, NCR, Hyderabad, Bengaluru and numerous Tier II and Tier III locations
Key sub-sectors: Dairy and dairy products, non-alcoholic beverages,consumer foods, poultry, sea food, food and beverage tradersKey clusters: NCR, Mumbai, Chennai, Hyderabad and Pune
Key sub-sectors: Casting and forging, medical equipment and devices, engine parts, drive transmissions etc.Key clusters: NCR, Chennai, Pune, Kolkata, Ludhiana, Bengaluru, Ahmedabad and Rajkot
26
Sub-sectors selected basis the contribution to the overall sector credit demand and risk profiles

GRO Score 2.0, a superior underwriting framework, launched to make our selection sharper
We are on track to achieve 100% digital underwriting in SME lending
Evaluation of repayment
history
Business assessment using transaction data
Forecasting of future cashflow
System generated digital PD
Gro Score 2.0 - first credit score combining commercial and consumer bureau with bank statement now in place
First in-house prototype is ready First prototype ready
▪ Combines entity + individual + banking into ONE model
▪ Trained on own data – eliminates “look-alike” sector definition bias
▪ No specific bureau dependency
▪ Potentially 28% higher approval rates with similar or lesser risk
GRO 2.0 combines credit bureau & banking data into one model
Credit bureau Banking
Business activity
under individual
Nature of past
borrowers
Frequency of
default
History of raising
costly debt
NBFC/ PSU
relative contribution
Transaction
intensity
Credit card usage
Default with prime
lenders
Overdues
Product mix
Pace of borrowingBalances and
utilization
Turnover
PurchasesCheque bounces &
bank charges
Ecommerce
Utility paymentsPayment cycles
Counterparties &
relative strengths
Cash withdrawals
and deposits
GRO Score combines Credit Bureau Data & Banking Data and provides
superior performance through use of ML models
27

“Risk Management” through ‘Expert Scorecards’ for all Sub-sectors (1/2)
▪ Post filtering out the various sub-sectors, its very important to scale the risk associated with an entity present in the sub-sector
▪ The entity is observed through various parameters and their associated weightages
▪ The parameters and their associated weightages vary widely across sectors and subsectors, and can vary within subsectors too (e.g. traders of medical
equipment as compared to manufacturers of the same)
▪ The efficacy of parameters, factors and weightages are monitored and back-tested at regular intervals.
▪ Adjustments can be informed by market changes or accrual of incremental subsector specific knowledge
Parameter Factor Weightage
Entity related
Vintage of the entity 25%
Experience of Promoter 25%
Category of equipment manufactured by the firm 50%
Revenue related
Share of revenues from exports 25%
Share of bidding versus regular orders 30%
Client concentration (of top 3 customers) 15%
Average length of relationship with top 3 customers 10%
Concentration of top 3 vendors/raw material suppliers 10%
Average length of relationship with top 3 suppliers 10%
Cost & Efficiency
Receivable days 50%
Certification and awards (related to quality) 35%
Rejection rate 15%
Case Study 1: Light Engineering
& Medical Equipment
Manufacturers
28

“Risk Management” through ‘Expert Scorecards’ for all Sub-sectors (2/2)
29
Parameter Factor Weightage
Entity related
Vintage of the school 30%
School Principal’s Experience 25%
Association with any reputed brand/group 25%
Exam Board with which the school is affiliated 10%
Typical income profile of students’ families 10%
Service related
Sources of non-fee income 30%
Provision of transport facilities 45%
Availability of Smart Boards and Robotics Lab 25%
Staff related
Average overall experience of teachers 20%
Teacher attrition rate 20%
Average student to teacher ratio 35%
Pass rate of students in board exams 25%
Revenue related
Number of Students 25%
Capacity utilization 20%
Number of operational shifts 15%
Average fees relative to other schools of the same exam board 10%
Proportion of students who delay fee payment 10%
Frequency of fee payment 10%
Average annual tuition fee increase 10%
Cost relatedAverage annual increase in teachers’ salary 40%
Employee costs as a proportion of revenue 60%
Case Study 2: Education K-12 Schools

Advanced Bank, GST and Bureau Analyzers to Size Up the Customer’s Cash Flows, Ability to Repay, Risk-Return Metrics and Estimate Loan Exposure
30
▪ ~ 100 different product variants basis bureau standard definitions classified into ROI/tenor buckets
▪ Product level ROI, tenor assumptions to compute obligations
▪ Product specific obligations computation encoded
▪ Process replicated for all financial applicants for footprint across both Commercial and Consumer bureaus
Category
Counterparty
State
Month
▪ 400+ data parameters
▪ Validate monthly sales, expenses, gross margins
▪ Insight into borrower's business network and concentration
▪ Digitization of sector identification
▪ State-wise break up providing information on operating markets
Overview
Aggregate
Transactions
Bounces
▪ Information related to bank statement analysisobtained from Perfios through an API integration customized to U GRO requirements
▪ Ability to validate business transaction trends (sales, expenses, margins), cheque bounce patterns, loan/EMI details, supplier & vendor identification and concentration
Ban
k Statem
en
t An
alysis Bu
reau
Re
cord
An
alys
is
GST Statement Analysis
Tradelines
Granular Details

TechnologyCredit Process Enabled by Integrated Technology

Technology is essential to achieve a Specialized Model at Scale
32
OPERATIONS
CREDIT UNDERWRITING
COLLECTIONS
DISTRIBUTION
▪ Quick and easy integration with distribution partners
▪ Paperless login enabled by API integrations and OCR
▪ Lower turn-around time
▪ Faster product launches and process iterations
▪ Direct to customer interface and pre-approved programs
▪ Access and process the large trove of private and public data
▪ Centralize underwriting knowledge
▪ Customized scorecards
▪ Automate processes to reduce errors and increase throughput
▪ Access and analyze surrogate data
▪ Comprehensive notification/trigger mechanism for best-in-class
client servicing
▪ Banking integration for automated disbursement, deductions
▪ Digital self service and support
▪ Digital process enablers such as eSign, eKYC, eStamping
▪ Processing at scale
▪ Automated, analytics led early warning systems
▪ Cash less EMI collections
▪ Geo-tagging of customers
Technology has created a new breed of fin-tech lenders in India | Digital lending to increase 10-15 times by 2023, scaling up to~$100B in annual disbursements
| Better Assessment| Shorter TAT | Personalized
Customer Journeys |

33
Technology platform to power the multi-pronged distribution channels
GRO-Protect
Core Engine
Core LMSSystem of Records
Tech
no
logy
Pla
tfo
rms
aGRO-Plus
Branch Led
An uberized distribution model capable of onboarding DSAs, CAs and other intermediaries
• Web-portal for DSAs (Onboarding, Servicing & Training)
• APIs & Portal for Affiliates (Lead Collection, Management & Affiliate Servicing)
• Revamped Gro-Micro Application
b GRO-Chain
Supply Chain
Supply chain financing platform for vendor and dealer/distributor financing
• API Framework for partner integration• Stand-alone LMS• Web Version of Onboarding app to be
developed
dGRO-Direct
Direct Interface
Direct to customer (Online) channel – went live in beta phase in December 2019
• Customer Direct Channel• Self- Service Portal for Direct & Branch
customers (View, Service Loans & Payments)
cGRO-Xstream
Partnerships
An online marketplace for large banks to partner with smaller NBFCs to either co-originate or purchase assets
• New Self Service portal (Upload & Manage)
• API Infrastructure for partners
Platform New Technology Initiatives

Platforms further integrated with rich data enrichment layer
34
A Plug and Play Distribution
Module
GRO Partners & Direct Distribution
Partnership & Alliances Eco System Digital Direct
Customer ERPGRO App Partner LOS
A paperless, and seamless customer onboarding & underwriting process supplemented by physical underwriting
Multiple customer touchpoints
GRO LOS
Data Enrichment Layer
All process are digitized & underwriting powered by ML & AI
Customer Devices
Due Diligence powered by APIs
Technology Platforms
Infrastructure Data Analysis & Computing
Distribution NetworkCreating multi-channel distribution

Multi pronged approach led by Offline presence and Tech capabilities
36
▪ Tier 1-2 Branches – 9 Branches with loans largelysourced by DSAs
▪ Tier 3-6 Branches - Launched 25 new branchesacross 5 states. Loans to be directly sourced byFOS.
Branch Led Channel | GRO-Plus
▪ Supply Chain Financing – Anchor and itsecosystem financing of Supply Chain
▪ Machinery Finance – Secured Loans to machinebuyers with a charge on machines
Ecosystem Channel | GRO-Chain
▪ Co-lending – Joint lending parnerships with NBFCson the downstream
▪ FinTech Parnterships – Partnership with FinTechsto orginate loans. Loans quasi secured with FLDG.
▪ Direct Assignment & Portfolio Acquisition –Upstream or downstream direct assignement toBanks & NBFCs respectively
Partnerships & Alliances | GRO-XStream
▪ Digital Lending Platform – Allows MSMEs todirectly apply for credit further reducing TATs
▪ Beta Phase launched in Dec’19 – Full scale rollout to happen in 2022
Direct Digital Channel | GRO-Direct
U GRO’s distribution model is geared towards catering MSMEs across all geographies and ticket sizesTailored products allow for highly structured deployment of capital – optimized for both the distribution channel and customer
Turnover: ₹0.2-200 CrTicket Size: ₹1-15 lakhs
Turnover: ₹0.2-200 CrTicket Size: ₹0.01-5 Cr
Turnover: ₹2-200 CrTicket Size: ₹0.1-3 Cr
Turnover: ₹0.2-200 CrTicket Size: ₹0.005-3 Cr
a
c
b
d
60% - 70% of Assets 20% - 25% of Assets
10% - 15% of Assets 5% - 10% of Assets

Branch Led | Network of 34 Branches spread across the country
Delhi
Jaipur
Hyderabad
Bangalore
Ahmedabad
Kolkata
Mumbai
Chennai
Tier 1-2 Branches
Head Office
Total 34 Branches
Pune
KarnatakaBommasandraPeenyaMysoreRR NagarMahadevpura
Tamil NaduMangaduTambaramThiruvallurVelloreKancheepuram
TelanganaNizamabadSuryapetNalgondaWarangalKarimnagar
GujaratOdhavHimatnagarBarodaNadiadMehsana
RajasthanAjmerKotputliSikarJhotwaraJagatpura
Tier 3-6 Branches▪ 9 Branches across 8 states in top metro cities
▪ Locations identified through SME cluster analysis and portfolio benchmarking
▪ Distribution led by DSAs
Tier 1-2 Branches
▪ 25 Branches commissioned in Jan’21 – spread across 5 states
▪ Top locations with history of low delinquency & high loan demand identified
▪ Distribution through Feet on Street manpower employed on U GRO rolls
a
Tier 3-6 Micro Branches
37

38
Low-Prime/ Emerging
Medium Prime
Prime/ Near-Prime
<10% 10-14% 14-18% >18%
Pratham Sanjeevani Saathi GRO Micro
a Branch Led | Loan Products curated to cater to the entire pyramid of borrowers
50-250 lacs 50-300 lacs 15-75 lacs 1-25 lacs
NA 10-25 lacs NA 0.5-5 lacs
Secured >>>
UnSecured >>>

Ecosystem Channel – SCF | Products
Vendor
▪ Receives faster payment▪ Reduces cost of capital by leveraging anchor’s
credit rating▪ Liberty to choose when to use
Anchor
▪ Minimises WC investment▪ Off-balance sheet funding▪ Lower financing cost▪ Reap early payment discount
Dealer
▪ Provides much needed WC for purchase of inventory
▪ Lower cost of funds than other WC loans▪ Avail cash discount from vendor
Retailer Financing
Distributor / Dealer Financing
VendorFinancing
1 Anchor Led
2 Non-Anchor Led
▪ No corporate acceptance required▪ Downloadable app for invoice level management▪ Seamless virtual escrow account repayments▪ Automated limit updation and settlement
Additional Product Offering
Anchor led models based on bill discounting from corporates and delivery confirmation
Purchase InvoiceDiscounting
Sales InvoiceDiscounting
Post-ShipmentPre-shipment
b
39
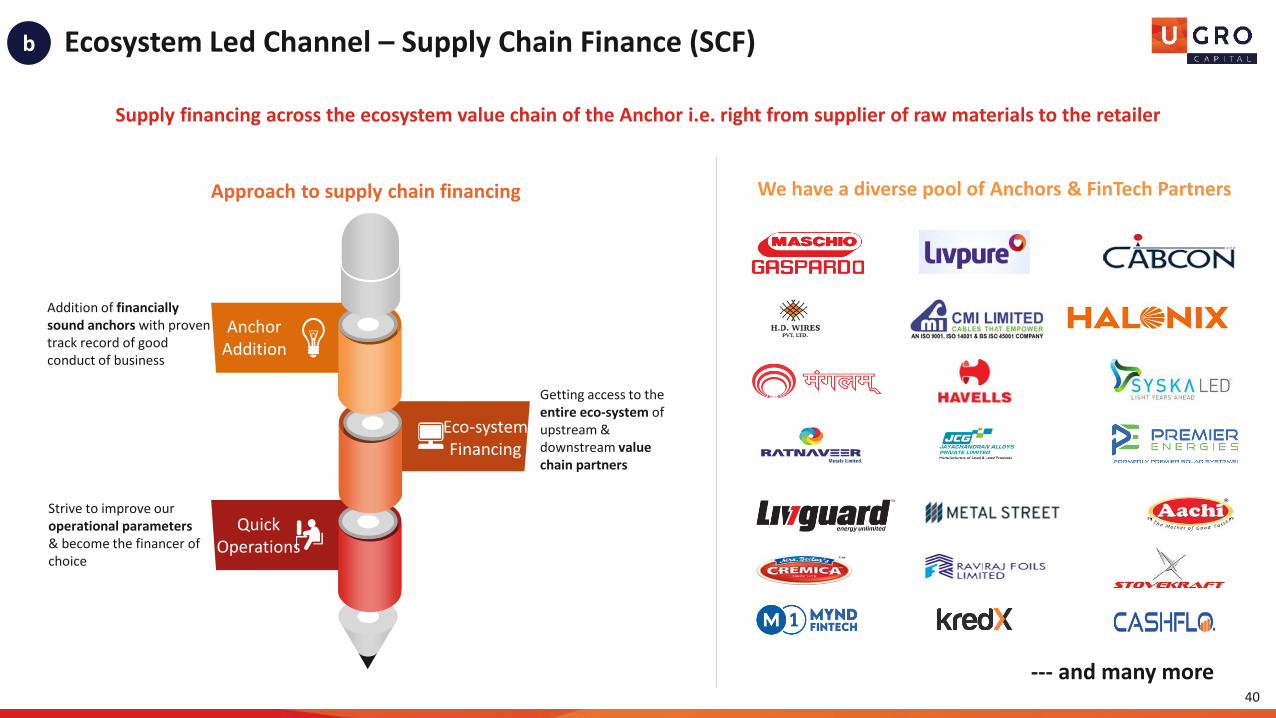
Ecosystem Led Channel – Supply Chain Finance (SCF)
Supply financing across the ecosystem value chain of the Anchor i.e. right from supplier of raw materials to the retailer
Approach to supply chain financing We have a diverse pool of Anchors & FinTech Partners
Addition of financially sound anchors with proven track record of good conduct of business
Getting access to the entire eco-system of upstream & downstream value chain partners
Strive to improve our operational parameters & become the financer of choice
Eco-systemFinancing
AnchorAddition
QuickOperations
--- and many more40
b
41
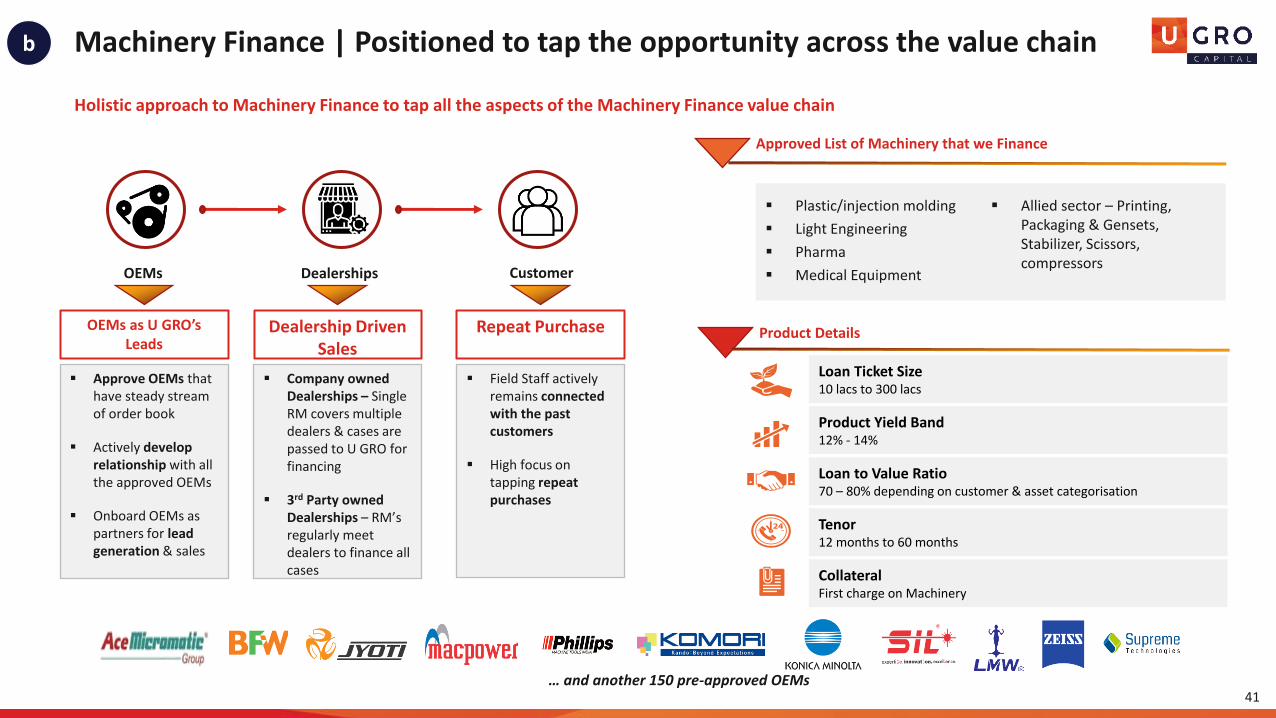
Machinery Finance | Positioned to tap the opportunity across the value chain
Holistic approach to Machinery Finance to tap all the aspects of the Machinery Finance value chain
▪ Approve OEMs that have steady stream of order book
▪ Actively develop relationship with all the approved OEMs
▪ Onboard OEMs as partners for lead generation & sales
OEMs Dealerships Customer
OEMs as U GRO’s Leads
▪ Company owned Dealerships – Single RM covers multiple dealers & cases are passed to U GRO for financing
▪ 3rd Party owned Dealerships – RM’s regularly meet dealers to finance all cases
▪ Field Staff actively remains connected with the past customers
▪ High focus on tapping repeat purchases
Dealership Driven Sales
Repeat Purchase
▪ Plastic/injection molding
▪ Light Engineering
▪ Pharma
▪ Medical Equipment
▪ Allied sector – Printing, Packaging & Gensets, Stabilizer, Scissors, compressors
Approved List of Machinery that we Finance
… and another 150 pre-approved OEMs
Loan Ticket Size10 lacs to 300 lacs
Product Yield Band12% - 14%
Loan to Value Ratio70 – 80% depending on customer & asset categorisation
Tenor12 months to 60 months
CollateralFirst charge on Machinery
Product Details
b

Partnership Channel | Actively partner with FinTechs/NBFCs to improve distribution reach
42
Online Aggregators
E-Commerce Marketplace
B2B Market Place
Offline Aggregators POS/ Wallet/ Payments
Neo Banks
Opportunities
c
Feature Particulars
Type of co-lendingAsset Side downstream co-lending with FinTech/ NBFCs
Customer Profile MSMEs pan India
Sourcing of Loan Partner/ U GRO Underwriting policy
Products Small Ticket, Higher yield secured & unsecured loans
Share of Loan for U GRO
80:20/ 90:10 with 5-15% FLDG cover
Typical Yield 14-15%
We continue to forge partnerships with different FinTechs & NBFCs

Direct Digital – GRO Direct| Our Innovation-Driven Digital Lending Platform
Product Development▪ Sectoral Need Gap
Identification based on Perception Maps
▪ E.g. Solutions available for Dentists Loan (Healthcare → Doctors) & Kirana Shop Loans (FMCG → Trading)
Marketing▪ Customer Data Identification▪ Push & Pull Marketing
Campaigns▪ Personalised Communication▪ Personalised on-boarding
journey (ChatBots)
Product and MarketingInnovation driven by Micro-Level
Focus within Sub-sectors
Sector-Focused Partnerships▪ Ecosystem Players▪ Aggregators▪ Web Portals Listings▪ Payment Gateways▪ Marketplaces▪ Industry Bodies/Associations
Direct To Customer Campaigns▪ Integrated Marketing Automation
Tool for campaign delpoyment▪ Medium: SMS/Flash Message
/WhatsApp/Voice Blasts/Email ▪ Outbound Calling with loan
solutions to optimise conversion
AcquisitionMicro–targeting of customer andpartner audiences for onboarding
▪ Based on Industry First Sector Specific Scorecards
▪ Pings other Tech Platforms for information gathering and validation via customized APIs
▪ Assisted models (Outbound Calling) to induce customers to convert
▪ Outsourced partners to collect documents and meet regulatory compliance
Underwriting/Fulfilment60 Mins Decisioning – 100% Digital
▪ Completely Digital Customer Servicing▪ No reliance on human interrvation ▪ Web-service based APIs for instant
query/request handing over app/web or IVR call
Customer ServiceChatbot based, integrated with
popular message apps (proposed)
43
Beta Launched in Dec 2019*
d
*Beta testing done, to be launched in FY 2021-22

Liability ManagementBacked by a diverse base of Lenders
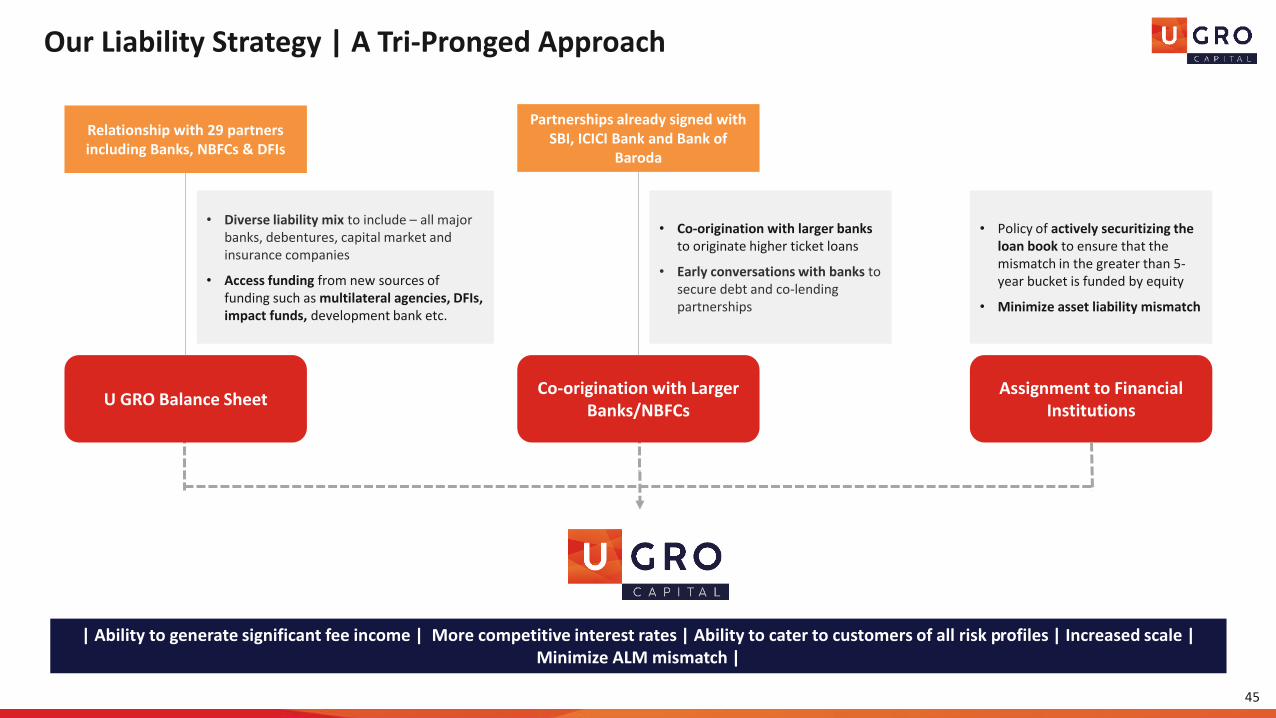
Our Liability Strategy | A Tri-Pronged Approach
45
| Ability to generate significant fee income | More competitive interest rates | Ability to cater to customers of all risk profiles | Increased scale | Minimize ALM mismatch |
U GRO Balance SheetCo-origination with Larger
Banks/NBFCsAssignment to Financial
Institutions
• Policy of actively securitizing the loan book to ensure that the mismatch in the greater than 5-year bucket is funded by equity
• Minimize asset liability mismatch
• Co-origination with larger banks to originate higher ticket loans
• Early conversations with banks to secure debt and co-lending partnerships
Partnerships already signed with SBI, ICICI Bank and Bank of
Baroda
Relationship with 29 partners including Banks, NBFCs & DFIs
• Diverse liability mix to include – all major banks, debentures, capital market and insurance companies
• Access funding from new sources of funding such as multilateral agencies, DFIs, impact funds, development bank etc.
46
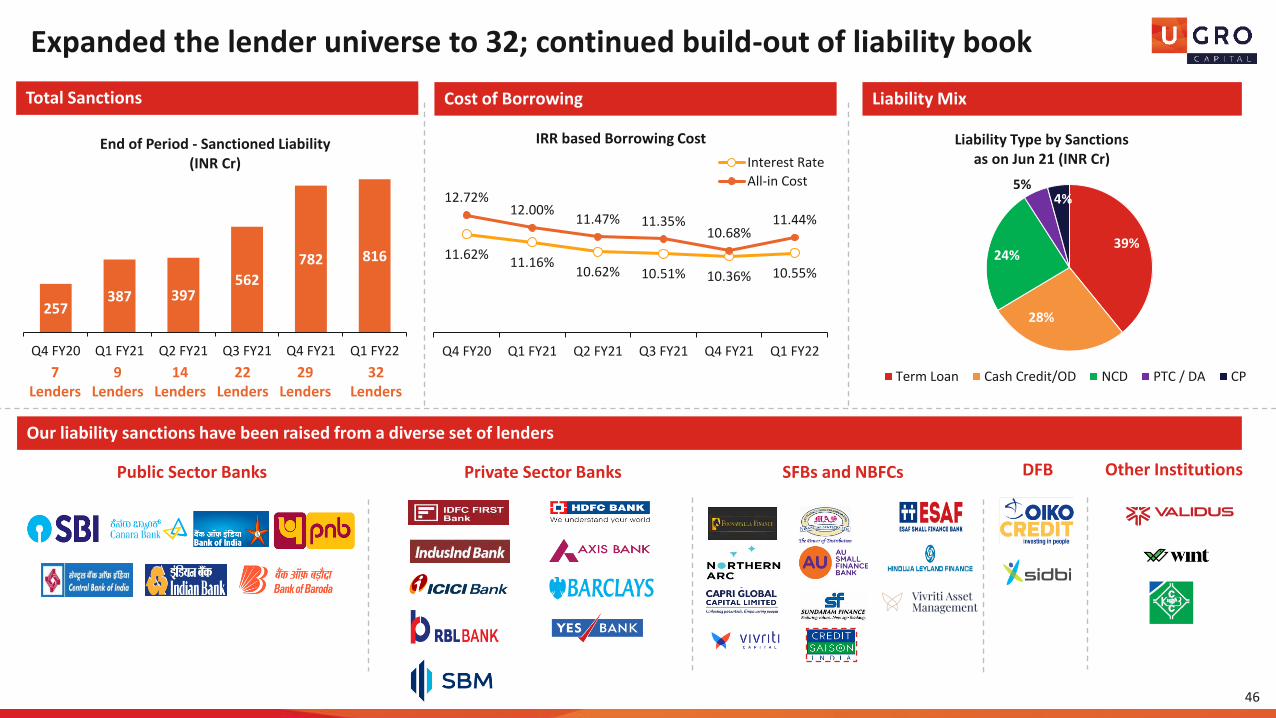
Expanded the lender universe to 32; continued build-out of liability book
11.62%11.16%
10.62% 10.51% 10.36% 10.55%
12.72%12.00%
11.47% 11.35%10.68%
11.44%
Q4 FY20 Q1 FY21 Q2 FY21 Q3 FY21 Q4 FY21 Q1 FY22
IRR based Borrowing Cost
Interest Rate
All-in Cost
39%
28%
24%
5%4%
Liability Type by Sanctionsas on Jun 21 (INR Cr)
Term Loan Cash Credit/OD NCD PTC / DA CP
257387 397
562
782 816
Q4 FY20 Q1 FY21 Q2 FY21 Q3 FY21 Q4 FY21 Q1 FY22
End of Period - Sanctioned Liability (INR Cr)
7Lenders
9 Lenders
Our liability sanctions have been raised from a diverse set of lenders
Public Sector Banks Private Sector Banks Other InstitutionsDFBSFBs and NBFCs
14 Lenders
22Lenders
29Lenders
Total Sanctions Cost of Borrowing Liability Mix
32Lenders
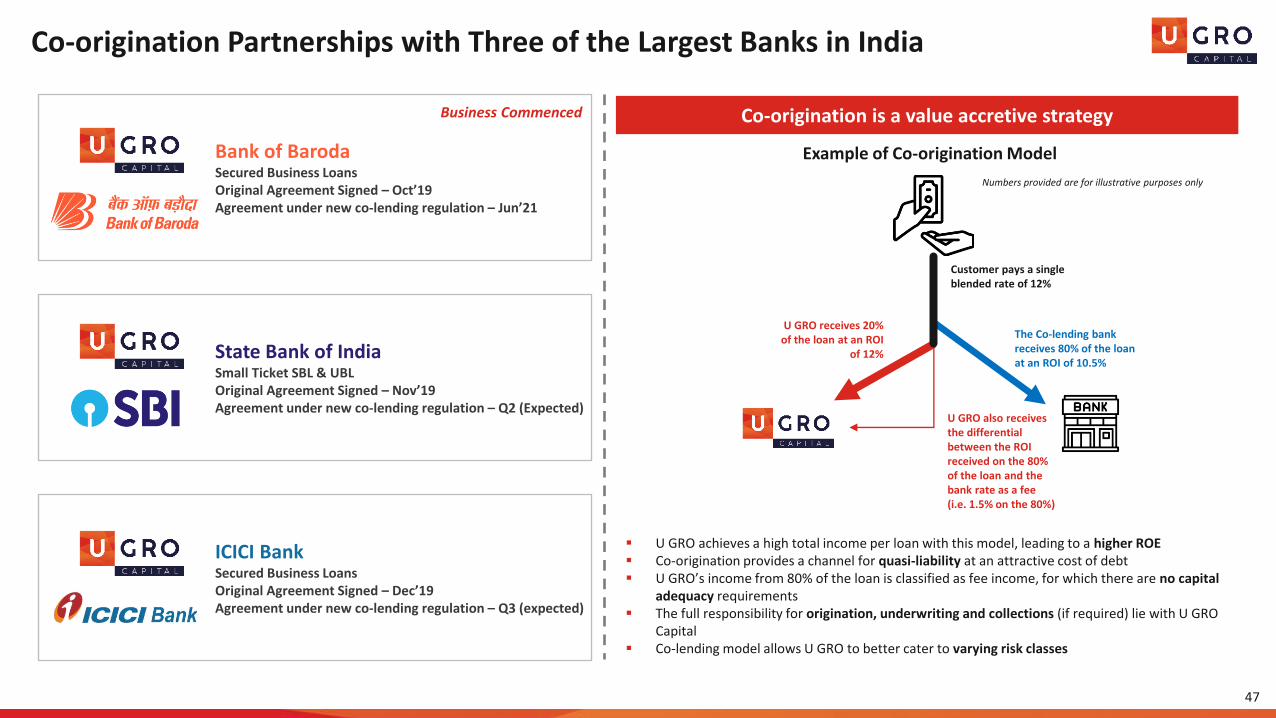
Co-origination Partnerships with Three of the Largest Banks in India
47
Bank of BarodaSecured Business Loans Original Agreement Signed – Oct’19Agreement under new co-lending regulation – Jun’21
State Bank of IndiaSmall Ticket SBL & UBL Original Agreement Signed – Nov’19Agreement under new co-lending regulation – Q2 (Expected)
ICICI BankSecured Business Loans Original Agreement Signed – Dec’19Agreement under new co-lending regulation – Q3 (expected)
Co-origination is a value accretive strategy
Customer pays a single blended rate of 12%
The Co-lending bank receives 80% of the loan at an ROI of 10.5%
U GRO receives 20% of the loan at an ROI
of 12%
U GRO also receives the differential between the ROI received on the 80% of the loan and the bank rate as a fee(i.e. 1.5% on the 80%)
Numbers provided are for illustrative purposes only
▪ U GRO achieves a high total income per loan with this model, leading to a higher ROE▪ Co-origination provides a channel for quasi-liability at an attractive cost of debt▪ U GRO’s income from 80% of the loan is classified as fee income, for which there are no capital
adequacy requirements▪ The full responsibility for origination, underwriting and collections (if required) lie with U GRO
Capital▪ Co-lending model allows U GRO to better cater to varying risk classes
Example of Co-origination Model
Business Commenced

Financial & Operating MetricsAs of Q1 FY22
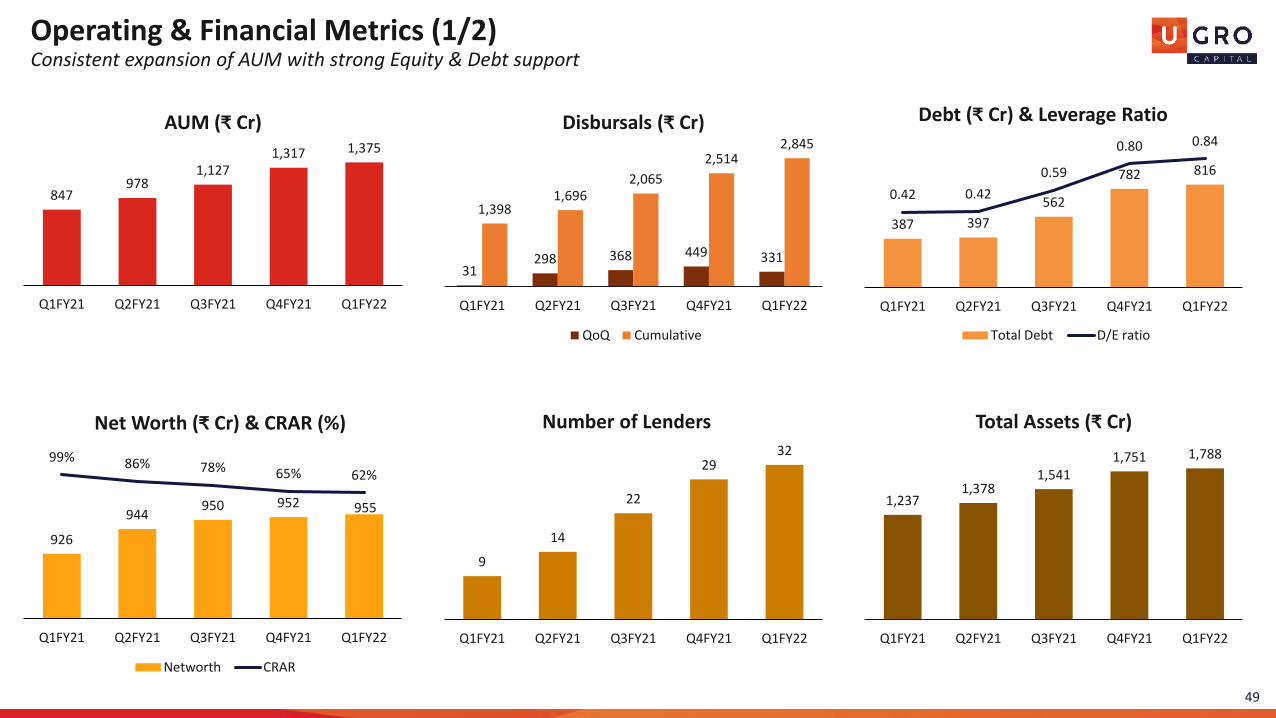
Operating & Financial Metrics (1/2)Consistent expansion of AUM with strong Equity & Debt support
31298 368 449 331
1,3981,696
2,065
2,5142,845
Q1FY21 Q2FY21 Q3FY21 Q4FY21 Q1FY22
Disbursals (₹ Cr)
QoQ Cumulative
387 397
562
782 816
0.42 0.42
0.59
0.80 0.84
Q1FY21 Q2FY21 Q3FY21 Q4FY21 Q1FY22
Debt (₹ Cr) & Leverage Ratio
Total Debt D/E ratio
9
14
22
2932
Q1FY21 Q2FY21 Q3FY21 Q4FY21 Q1FY22
Number of Lenders
1,2371,378
1,5411,751 1,788
Q1FY21 Q2FY21 Q3FY21 Q4FY21 Q1FY22
Total Assets (₹ Cr)
926
944950 952 955
99% 86% 78% 65% 62%
Q1FY21 Q2FY21 Q3FY21 Q4FY21 Q1FY22
Net Worth (₹ Cr) & CRAR (%)
Networth CRAR
847978
1,1271,317 1,375
Q1FY21 Q2FY21 Q3FY21 Q4FY21 Q1FY22
AUM (₹ Cr)
49

20.0
18.5 18.6
21.3 21.6
79%74%
68% 66%75%
Q1FY21 Q2FY21 Q3FY21 Q4FY21 Q1FY22
Opex (₹ Cr) & Cost to Income Ratio
Opex Cost to Income
1.0%
1.9%2.3%
2.7%2.3%
0.6%
1.2% 1.4%1.7% 1.9%
Q1FY21 Q2FY21 Q3FY21 Q4FY21 Q1FY22
GNPA and NNPA (in %)
GNPA NNPA
30.6 34.138.9
43.849.8
14.1% 14.4%14.8%
15.5% 15.8%
Q1FY21 Q2FY21 Q3FY21 Q4FY21 Q1FY22
Interest Inc. (₹ Cr) & Portfolio Yield
Interest Income Interest Yield
6.89.6
11.816.3 22.4
11.2%10.6% 10.5% 10.4% 10.6%
Q1FY21 Q2FY21 Q3FY21 Q4FY21 Q1FY22
Finance Cost (₹ Cr) & Cost of debt*
Interest Expenses Cost of borrowing
23.8 24.427.1 27.5
27.4
11.1% 10.7% 10.3%9.1% 8.3%
Q1FY21 Q2FY21 Q3FY21 Q4FY21 Q1FY22
NII (₹Cr) and NIM%
NII NIM
Operating & Financial Metrics (2/2)Operating & financials ratios continue to improve as with scale
50*restated cost of debt from weighted average costing to IRR based costing
2.4 2.4
1.6 1.7
Q4FY21 Q1FY22
PBT and PAT (₹Cr)
PBT PAT

Portfolio Overview

498 510656
759864 893
187 170
182
229
281 264
177 168
140
139
171219
861 847
978
1,127
1,3171,375
0
200
400
600
800
1,000
1,200
1,400
1,600
Q4 FY20 Q1 FY21 Q2 FY21 Q3 FY21 Q4FY21 Q1FY22
Partnership and Alliances Channel
Ecosystem Channel
Branch-Led Channel
65%
19%
16%
Channel Mix
52
AUM Growth Channel WiseAUM growth subdued in Q1 on account of disruption in our operations due to COVID 2nd wave
▪ Due to the impact of second wave, Portfolio growth was subdued Q1FY22
Product category POS (Cr) ROI (%) Ticket size (Cr)
Branch Channel 893 15.0% 0.33
Ecosystem Channel 264 13.2% 0.76
Partnerships and Alliances 219 21.1% 0.07
Grand Total 1,375 15.8% 0.21

53
Portfolio Sector Snapshot | AUM
25%
17%
15%
12%
11%
11%
7%
1% 1%
Branch-led Sectoral Mix
Light Engineering
Food Processing
Education
Chemicals
Healthcare
Hospitality
Electrical Equipment
Auto Components
Micro Enterprises
46%
21%
20%
7%
3%3%
Supply Chain Finance Sectoral Mix
Electrical Equipment
Light Engineering
Auto Components
Food Processing
Hospitality
Others
94%
4% 2%
Machinery Finance Sectoral Mix
Light EngineeringElectrical EquipmentAuto Components
38%
19%
18%
10%
9%
6%
Partnerships & Alliances (Micro Enterprises) Sectoral Mix
UnsecuredPTCDA / Portfolio AcquisitionsSecuredOnward LendingPOS Based
AUM - 893 Cr
AUM - 181 Cr
AUM - 83 Cr
AUM - 219 Cr
Unsecured, Secured & POS based AUM covered by at least 10% FLDG
54
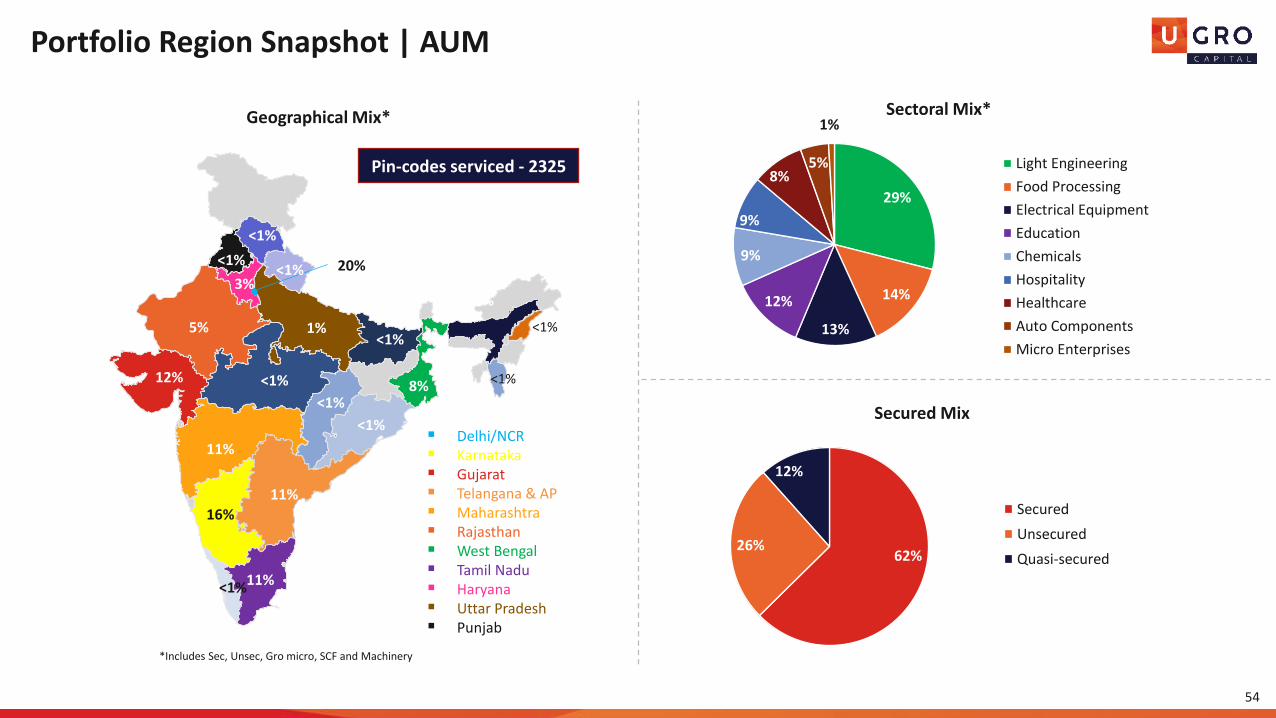
29%
14%
13%
12%
9%
9%
8%5%
1%Sectoral Mix*
Light Engineering
Food Processing
Electrical Equipment
Education
Chemicals
Hospitality
Healthcare
Auto Components
Micro Enterprises
Portfolio Region Snapshot | AUM
62%26%
12%
Secured Mix
Secured
Unsecured
Quasi-secured
<1%
<1%
<1%
<1%
<1%
<1%
<1%
Geographical Mix*
*Includes Sec, Unsec, Gro micro, SCF and Machinery
▪ Delhi/NCR▪ Karnataka▪ Gujarat▪ Telangana & AP▪ Maharashtra▪ Rajasthan▪ West Bengal▪ Tamil Nadu▪ Haryana▪ Uttar Pradesh▪ Punjab
20%
12%
11%
5%
16%
11%
8%
11%
<1%
3%
1%
<1%
<1%
<1%
<1%
<1%
<1%
<1%
<1%
Pin-codes serviced - 2325
<1%
<1%
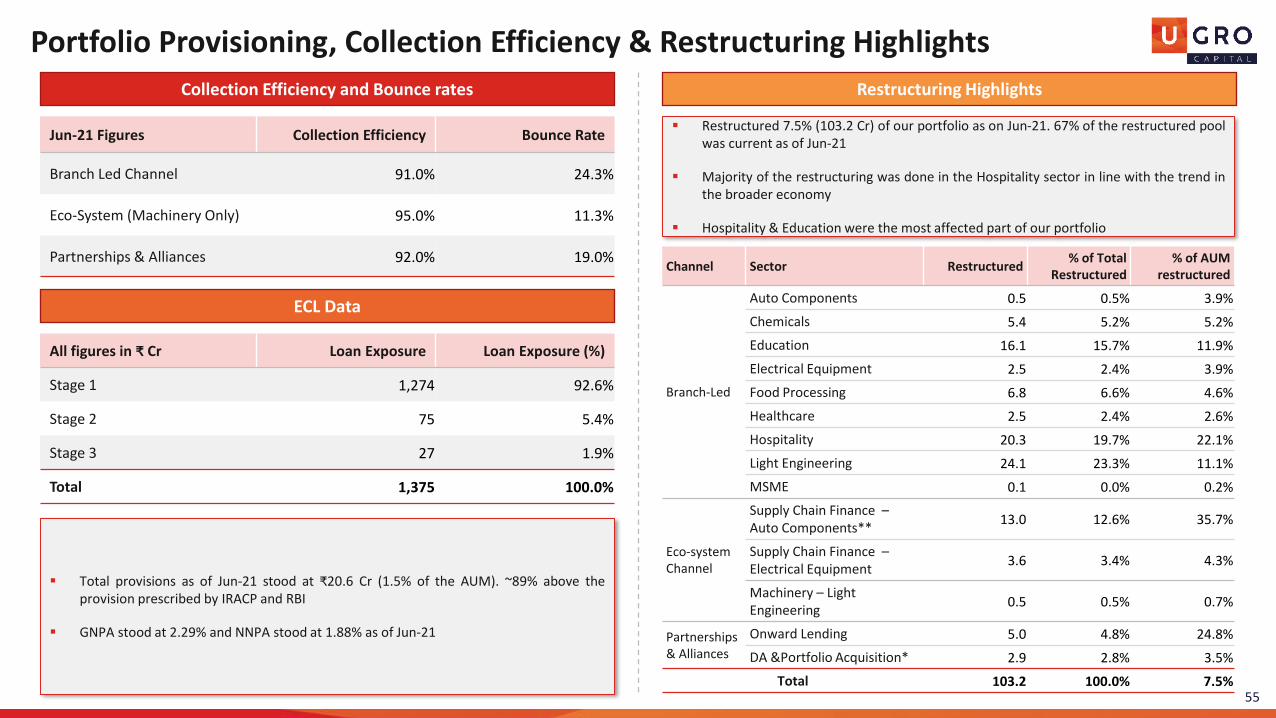
Portfolio Provisioning, Collection Efficiency & Restructuring Highlights
Jun-21 Figures Collection Efficiency Bounce Rate
Branch Led Channel 91.0% 24.3%
Eco-System (Machinery Only) 95.0% 11.3%
Partnerships & Alliances 92.0% 19.0%
Collection Efficiency and Bounce rates Restructuring Highlights
ECL Data
All figures in ₹ Cr Loan Exposure Loan Exposure (%)
Stage 1 1,274 92.6%
Stage 2 75 5.4%
Stage 3 27 1.9%
Total 1,375 100.0%
Channel Sector Restructured% of Total
Restructured% of AUM
restructured
Branch-Led
Auto Components 0.5 0.5% 3.9%
Chemicals 5.4 5.2% 5.2%
Education 16.1 15.7% 11.9%
Electrical Equipment 2.5 2.4% 3.9%
Food Processing 6.8 6.6% 4.6%
Healthcare 2.5 2.4% 2.6%
Hospitality 20.3 19.7% 22.1%
Light Engineering 24.1 23.3% 11.1%
MSME 0.1 0.0% 0.2%
Eco-system Channel
Supply Chain Finance –Auto Components**
13.0 12.6% 35.7%
Supply Chain Finance –Electrical Equipment
3.6 3.4% 4.3%
Machinery – Light Engineering
0.5 0.5% 0.7%
Partnerships & Alliances
Onward Lending 5.0 4.8% 24.8%
DA &Portfolio Acquisition* 2.9 2.8% 3.5%
Total 103.2 100.0% 7.5%
▪ Restructured 7.5% (103.2 Cr) of our portfolio as on Jun-21. 67% of the restructured poolwas current as of Jun-21
▪ Majority of the restructuring was done in the Hospitality sector in line with the trend inthe broader economy
▪ Hospitality & Education were the most affected part of our portfolio
▪ Total provisions as of Jun-21 stood at ₹20.6 Cr (1.5% of the AUM). ~89% above theprovision prescribed by IRACP and RBI
▪ GNPA stood at 2.29% and NNPA stood at 1.88% as of Jun-21
55

56
Financials | Income Statement & Balance Sheet
Income Statement (₹ Cr) Q2 FY21 Q3 FY21 Q4 FY21 Q1 FY22 FY21
Income
Interest Income & Income from Investments 34.49 38.77 44.44 50.72 148.48
Sale of Services 0.00 0.02 3.51 - 3.53
Other operating revenue 0.33 0.30 0.71 0.56 1.34
Total Income (A) 34.82 39.08 48.64 51.28 153.32
Expenses
Finance Costs 9.64 11.78 16.30 22.37 44.56
Employee Benefits Expenses 10.75 10.56 12.91 12.29 45.33
Depreciation, amortization and impairment 2.88 3.01 3.14 2.60 11.74
Provision for loan loss 3.93 5.86 8.67 4.92 19.62
Other expenses 4.87 4.99 5.25 6.74 19.96
Total Expenses (B) 32.08 36.21 46.27 48.92 141.21
Profit Before Tax (C) = (A-B) 2.74 2.87 2.37 2.36 12.12
Tax Expenses (D) (14.44) (3.40) 0.83 0.66 (16.6)
Profit After Tax (E) = (C-D) 17.18 6.27 1.54 1.70 28.71
Balance Sheet (₹ Cr) FY20 FY21
Financial Assets 1,144.33 1,656.89
Loans 832.30 1,278.81
Cash and Investments 222.17 371.27
Other Financial Assets 89.86 6.81
Non-Financial Assets 68.05 94.01
Total Assets 1,212.38 1,750.89
Financial Liabilities 287.37 793.22
Trade/Other Payables 14.20 10.23
Borrowings & Debt Securities 254.54 765.69
Other Financial Liabilities 18.62 17.29
Non-Financial Liabilities 3.49 5.24
Total Equity 921.52 952.44
Equity Share Capital 70.53 70.53
Other Equity 850.99 881.91
Total Liabilities + Equity 1,212.38 1,750.89

Strategy and Long-Term GoalsGrowth & ROE focus

We have a clearly articulated vision to achieve our goals
Liability Side Strategy
▪ Adequately raise debt to fuel the build out of asset
▪ Raise long term, low-cost debt from DFIs & large banks
▪ Achieve high credit rating through build-out of quality portfolio
▪ Lower the cost of debt
▪ Maintain focus on ALM
Asset Side Strategy
▪ Opening of new branches in line with our plans and training & specializing frontline sales to achieve growth targets
▪ Rapid build out of partnerships to steadily ramp up our partnership channel
▪ Addition of financially sound anchors & improvise from our experiences
Technology Vision
▪ Consistent Improvement through upgradation to latest cutting-edge technology
▪ Capture customer data point at every touch point & improve our forecasting algorithm through AI/ML models
Organizational Build-up
▪ Become an employer of choice by groom internal talent for leadership roles
▪ Hire the right talent and cross train manpower to assume bigger roles
▪ Focus on training and development to ensure continuous upskilling of manpower
58

Way forward
FY25E target to reach 270 total branches, of which 225 direct distribution branches
Target to open 36 Intermediated branches in Tier 2 & 3 cities by FY25E while no plans to open any new such branches in Tier 1 cities
FY25E total cumulative disbursements target of ~Rs 119 bn; ~68% CAGR over FY20-25E
Branch led channel to remain as the largest contributor in total disbursals
Prime Branches products Pratham, Sanjeevani & Saathi and Micro Branch product launched to drive disbursals in branch led channels
Partnerships and Alliances to remain a key distribution channel with ~15% contribution to total disbursals by FY25E; Digital channel disbursals to grow substantially over the next 5 years
FY25E AUM target of Rs 200 bn; ~70% contribution from Branch led channels led by Pratham, Sanjeevani, Saathi & Micro-Enterprise product

Where we want to be in next 5 years
60
~₹119B5th Year Disbursals
~₹200BAUM at the end of 5th
Year
4.2% Return on Assets
Debt/Equity Ratio3.8x
18.8% Return on Equity
16.3% Interest Yield
Net Interest Margin (NIM)8.5%
9.5% Borrowing Costs
ROA Tree (Projected)
Interest Income 16-17%
Cross-sell 0.2-0.5%
Co-lending/Assignment Income 0.4-0.6%
Other income 0.5-1%
Interest on cash 0.5-1%
Total Income 17.5-19.5%
Borrowing Costs 7.5-9%
Employee Expenses 2-3%
Provisions 0.4-0.8%
Other operating expenses 1.4-1.6%
Total Expenses 12-14%
PBT ~5.5%
Tax ~1-2%
PAT ~4-5%
ROE ~18.8%
Contact Us
Company : Investor Relations Advisors :
Ugro Capital Ltd.
CIN: L67120MH1993PLC070739
Mr. Nirav ShahChief Strategy Officer & Head of Investor [email protected]
www.ugrocapital.com
Strategic Growth Advisors Private Limited
CIN: U74140MH2010PTC204285
Rahul Agarwal / Vijay [email protected] / [email protected]+91 982143 8864 / +91 99201 24357
www.sgapl.net
61

Appendix

Narrowed down Sub-sectors/ecosystem across our focus sectors
Sector Sub-Sectors Key Clusters
1 HealthcareGeneral nursing homes, eye clinics, dental clinics, diagnostic labs,radiology/pathology labs, pharma retailers
NCR, Mumbai, Bengaluru, Hyderabad and Chennai
2 Education K-12 schools, play schoolsNCR, Mumbai, Coimbatore, Chennai, Hyderabad and Pune
3 Chemicals Dyes and pigments, bulk and polymers, agrochemicalsMumbai, NCR, Ahmedabad, Vadodara and Surat
4 HospitalityFine dining (standalone), QSRs, fine dining chains, manpower agencies,boutique hotels, guest houses
NA
5Electrical equipments & Components
B2B, B2CNCR, Pune, Bengaluru, Chennai, Aurangabad and Rajkot
6 Microenterprises Kirana stores, family run businesses, first generation entrepreneursMumbai, Kolkata, NCR, Hyderabad, Bengaluru and numerous Tier II and Tier III locations
7Food Processing/FMCG
Dairy and dairy products, non-alcoholic beverages, consumer foods,poultry, sea food, food and beverage traders
NCR, Mumbai, Chennai, Hyderabad and Pune
8Auto & Light Engineering
Casting and forging, medical equipment and devices, engine parts, drivetransmissions etc.
NCR, Chennai, Pune, Kolkata, Ludhiana, Bengaluru, Ahmedabad and Rajkot
Sub-sectors selected based on its contribution to the overall sector credit demand and risk profiles63

Growth Potential/Opportunity In Selected Sub-Sectors (1/4)
Healthcare (Nursing Homes, Diagnostic Labs, Eye/Dental Clinics, Retail Pharmacy)
▪ Sector growing at 22% CAGR & expected to see sustainable growth of 14-15% over long term
▪ Significant healthcare shortfall in India (0.7 hospital beds/1000 vs global avg 2.7)
▪Demand-Supply gap, inadequate infra will drive private investments
▪ Increasing lifestyle diseases, rising affordability & awareness provide sustainable growth prospects for new general nursing homes, new clinics for eye & dental and new retail pharmacy operators
▪ Indian diagnostics expected to see 11-12% CAGR over the medium to long term
▪ Pathology (58% of total diagnostics market) is highly fragmented and offers high Free Cash Flow and better Return on Investments of 45-50% on limited capex
Education (K-12 schools, Playschools)
▪ Inadequate education infra in India presents huge capital investment opportunity
▪With over 15 crore children in 0-6 years age group, India has the largest population of children in world
▪Demand for early education and care have led the Indian education sector on a brisk growth track
▪ The preschool education industry itself in India is currently valued at more than Rs 150 bn, growing at 23% CAGR
▪ The unorganized sector, which is made up of local home-grown preschools and constitutes around 70-80% of the market, shows huge growth opportunity
▪ Secondary school enrollment rate at only 54% & 37% of schools not having toilet facilities
64
Growth Potential/Opportunity In Selected Sub-Sectors (2/4)
Chemicals (Bulk Chemicals, Polymers, Agrochemicals, Dyes & Pigments)
▪ India Chemical Industry grown at ~11% CAGR over the last decade. Per capita consumption in India is 1/10th of the worlds average; presents huge capex opportunity
▪ Bulk chemicals (~40% of the world’s chemical market) expected to grow at ~8% CAGR in next 5 years
▪ Increasing focus on domestic production of chemicals would entail large investments from private players
▪Dyes & Pigments – Highly fragmented industry. India accounts for ~16% of the world production. Demand from textile & associated sectors is the key growth driver
▪ Agro chemicals industry expected to grow at 8% CAGR till FY25. Increase in awareness level of farmers, improvement in rural income and the pressure for improving productivity are the key drivers
Hospitality (Fine Dining Restaurants, QSRs, Manpower Agencies, Boutique & Guest Hotels)
▪ India Restaurant industry growing at ~7% led by rising disposable income, nuclear family structure, increasing working population and rapid urbanization and consumerism
▪ India QSR sector is ~4% of total food service market (vs 20% global avg); presents huge capex opportunity
▪Over FY20-25, the QSR market is estimated to be the highest growing sub-segment at 23% CAGR
▪Manpower/Security Solutions - India has the lowest per capita spend among most countries. Faster urbanization & inadequate police infra are key growth drivers
▪ Increasing desire for experiential travel across different segments continues to increase the growing popularity of Boutique Hotels along with Guest Houses in the country
65

Growth Potential/Opportunity In Selected Sub-Sectors (3/4)
Electrical Equipment and Components (B2B, B2C)
▪Govt’s focus on infra expansion to create substantial demand for electrical equipment & components
▪ Favorable demographics (Urbanization, increase in disposable income level, aspiration for good quality products, nuclear families etc.) would catalyze the growth in mid-to long term horizon
▪Govt initiatives - Metering of houses and focus on reducing transmission loss of electricity are creating many opportunities in new geographies for supply of electrical products
▪Demand for electrical equipment & components for renewables industry shows huge potential considering the focus on changing India’s energy profile to a greener one
Food processing (Dairy/Dairy Products, non-alcoholic beverages, consumer foods, poultry, sea food, food and beverage traders)
▪ 2025 target of doubling milk processing capacity would entail huge private capex
▪Growing consumer preference for branded/value-added milk products and increased awareness of nutrition would continue to drive the demand
▪ Per capita milk consumption is increasing at 3% CAGR (vs 1% CAGR globally)
▪Non-Alcoholic beverage consumption on a steady growth trajectory; Rising young population, improving retail penetration across semi-urban and rural markets shows huge potential in sector
▪With long coastline, India is best placed for seafood industry developments; shows huge growth potential
66

Growth Potential/Opportunity In Selected Sub-Sectors (4/4)
Auto and Light Engineering (Casting and forging, medical equipment and devices, engine parts, drive transmissions etc.)
▪ Auto & Light engineering is a sector that enables other sectors. Industrial Consumables are an integral sub-segment of this industry (mainly consist of products replaced regularly due to wear and tear)
▪ Focus on manufacturing sector would entail huge capital expenditure in Engineering/Auto sectors
▪Moving towards a greener future, Auto Industry’s focus on clean vehicle initiatives would propel demand for Industrial products
▪ ‘Make in India’ driving local manufacturing of engineering products (currently imported from China)
▪ 100% electrification of Railways to drive demand of engine parts, drive transmissions & other equipment
Microenterprises (Kirana stores, family run businesses, first generation entrepreneurs)
▪Microenterprise segment accounts for over ~97% of the MSME total, particularly important in Lower Income States such as Uttar Pradesh, Bihar, Chhattisgarh
▪ Kirana stores contribute 11% to India’s GDP & 8% of total workforce. MSME employees in sector at 110 million. 85% of country’s retail trade is unorganized; supported by small traders, retailers & Kirana stores
▪ In the food and grocery segment, more than 95% of the business is in the hands of traditional retailers.
▪Over 100 million households will be added to the high & upper middle classes by 2030; will drive 60% of consumer spending
▪Digitalization/modernization makes Kirana stores an irreplaceable part of the consumer’s daily life
67


