Undergraduate Signal Processing Laboratories on the Android Platform
by
Suhas Ranganath
A Thesis Presented in Partial Fulfillment
of the Requirements for the Degree
Master of Science
Approved April 2013 by the
Graduate Supervisory Committee:
Andreas Spanias, Chair
Cihan Tepedelenlioglu
Konstantinos Tsakalis
ARIZONA STATE UNIVERSITY
May 2013
i
ABSTRACT
The field of education has been immensely benefited by major breakthroughs in
technology. The arrival of computers and the internet made student-teacher interaction
from different parts of the world viable, increasing the reach of the educator to hitherto
remote corners of the world. The arrival of mobile phones in the recent past has the
potential to provide the next paradigm shift in the way education is conducted. It
combines the universal reach and powerful visualization capabilities of the computer with
intimacy and portability. Engineering education is a field which can exploit the benefits
of mobile devices to enhance learning and spread essential technical know-how to
different parts of the world. In this thesis, I present AJDSP, an Android application
evolved from JDSP, providing an intuitive and a easy to use environment for signal
processing education. AJDSP is a graphical programming laboratory for digital signal
processing developed for the Android platform. It is designed to provide utility; both as a
supplement to traditional classroom learning and as a tool for self-learning. The
architecture of AJDSP is based on the Model-View-Controller paradigm optimized for
the Android platform. The extensive set of function modules cover a wide range of basic
signal processing areas such as convolution, fast Fourier transform, z transform and filter
design. The simple and intuitive user interface inspired from iJDSP is designed to
facilitate ease of navigation and to provide the user with an intimate learning
environment. Rich visualizations necessary to understand mathematically intensive signal
processing algorithms have been incorporated into the software. Interactive
demonstrations boosting student understanding of concepts like convolution and the
relation between different signal domains have also been developed. A set of detailed

ii
assessments to evaluate the application has been conducted for graduate and senior-level
undergraduate students.

iii
DEDICATION
To Almighty
iv
ACKNOWLEDGMENTS
First, I would like to express my sincere gratitude to my advisor, Professor Andreas
Spanias, for his invaluable guidance and support. His patience, enthusiasm and vision
helped me achieve more than I ever thought possible.
Next, I would like to express my appreciation to Professors Kostas Tsakalis and
Cihan Tepedelenlioglu for being a part of my supervisory committee. Your advices will
benefit a lot in my academic life.
Thank you my colleagues and friends who give me invaluable assistance during my work
and life. Special thanks to Jayaraman Thiagarajan, Karthikeyan Natesan Ramamurthy,
Deepta Rajan, Mahesh Banavar, Xue Zhang, Alex Fink, Henry Braun, Prasanna Sattigeri,
Mohit Shah and Girish Kalyanasundaram. Thank you all for assisting me to test and
publish the software.
I would like to thank NSF for financing the project and SenSIP center for having
provided materials for the project.
v
TABLE OF CONTENTS
Page
LIST OF FIGURES ................................................................................................... vii
CHAPTER
1 INTRODUCTION .................................................................................. 1
The Role of Software Technology in Engineering Education ........... 2
Interactive Software Tools in DSP Education ................................... 3
Emergence of Mobile Devices ........................................................... 5
Signal Processing Laboratories for the Android Platform ................. 7
Organization of the Thesis ................................................................ 10
2 OVERVIEW, ARCHITECTURE AND IMPLEMENTATION ........ 11
AJDSP Overview .............................................................................. 12
Application Architecture ................................................................... 14
System Implementation .................................................................... 16
Performing Simulations .................................................................... 21
3 INTRODUCTION ................................................................................ 22
List of Implemented Functions ......................................................... 22
Signal Generation Blocks ................................................................. 25
Signal Channeling Blocks ................................................................. 27
Time Domain Signal Processing Blocks .......................................... 28
Frequency Domain Signal Processing Blocks ................................. 29
Signal Display Blocks ....................................................................... 40
Demonstrations ................................................................................. 42

vi
4 LABORATORIES AND ASSESSMENTS ......................................... 44
Laboratories ....................................................................................... 45
Evaluations ........................................................................................ 48
5 CONCLUSIONS AND FUTURE DIRECTIONS ............................... 53
Conclusions ....................................................................................... 53
Future Directions ............................................................................... 54
REFERENCES ........................................................................................................ 56

vii
LIST OF FIGURES
Figure Page
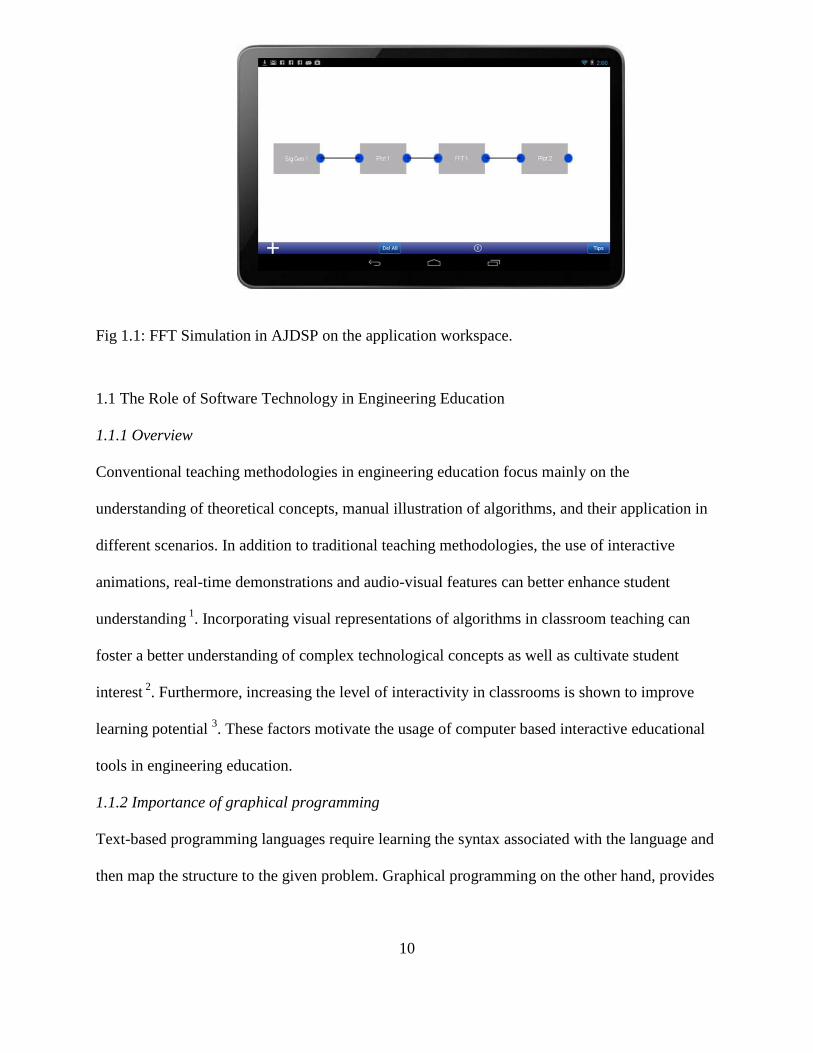
1.1 FFT Simulation in AJDSP .................................................................. 1
1.2 Rise in application downloads on the Google Play store .................... 5
1.3 Filter design simulation in AJDSP with impulse response, z-domain
representations, input parameters and filter coefficients .................... 7
2.1 Function list view and search ............................................................. 11
2.2 PZ Placement demo ............................................................................ 15
2.3 System architecture ............................................................................ 16
2.4 Performing a FFT simulation ............................................................. 17
3.1 Functions in AJDSP : Part 1 .............................................................. 21
3.2 Functions in AJDSP : Part 2 .............................................................. 22
3.3 Plot of a triangular signal ................................................................... 23
3.4 User interface of a MIDI generator .................................................... 25
3.5 DTMF generator ................................................................................. 27
3.6 Convolution of two rectangular signals ............................................. 29
3.7 FFT of a rectangular signal ................................................................ 30
3.8 Impulse response of a filter ................................................................ 31
3.9 Input menu of filter coefficient .......................................................... 35
3.10 Input menu of a kaiser filter ............................................................... 36
3.11 Frequency response of a bandpass filters .......................................... 37
3.12 Frequency response of a low pass filter with bartlett window .......... 39

viii
3.13 User interface of an FIR Design block ............................................... 40
3.14 User interface of an IIR Design block ................................................ 41
3.15 User interface of PZ2Coefficient block .............................................. 42
3.16 FFT of a rectangular signal illustrated using plot ............................... 45
3.17 Frequency response of a high pass Chebyshev II filter ...................... 46
3.18 Convolution of two non-causal rectangular signal ............................. 48
4.1 Block diagram for comparing signal resolution characteristics for different
windows ............................................................................................. 52
4.2 Bandpass filter design using (a) AJDSP (b)Matlab ........................... 54
4.3 Evaluations with graduate students ..................................................... 55
4.4 Evaluations with undergraduate students ............................................ 56
4.5 Educational Value of the application ................................................... 57
4.6 Effectiveness in improving DSP understanding ................................... 58

9
Chapter 1
INTRODUCTION
The use of software technologies in STEM education has proved to be a valuable supplement to
traditional teaching methods. Modern educational software has assisted students and educators in
understanding complex systems through simulation, building mathematical models and creating
visual representations of algorithms. Several toolkits utilizing the processing and graphical
capabilities of modern computer have been developed. Recent years have witnessed the
exponential growth of smartphones and tablet based computers. The high processing speed,
convenience of use and intuitive user interface of these devices make them a suitable platform
for developing tools for engineering education. Android-JDSP (AJDSP), a graphical
programming laboratory evolved from JDSP and iJDSP 11, 33, 34
for undergraduate and graduate
signal processing students is presented in this thesis. The laboratory has been developed as a
standalone application developed exclusively for the Android Platform. The main workspace of
AJDSP with a simulation for fast a Fourier transform of a rectangular signal is shown in Fig 1.1.
10
1.1 The Role of Software Technology in Engineering Education
1.1.1 Overview
Conventional teaching methodologies in engineering education focus mainly on the
understanding of theoretical concepts, manual illustration of algorithms, and their application in
different scenarios. In addition to traditional teaching methodologies, the use of interactive
animations, real-time demonstrations and audio-visual features can better enhance student
understanding 1
. Incorporating visual representations of algorithms in classroom teaching can
foster a better understanding of complex technological concepts as well as cultivate student
interest 2
. Furthermore, increasing the level of interactivity in classrooms is shown to improve
learning potential 3. These factors motivate the usage of computer based interactive educational
tools in engineering education.
1.1.2 Importance of graphical programming
Text-based programming languages require learning the syntax associated with the language and
then map the structure to the given problem. Graphical programming on the other hand, provides
Fig 1.1: FFT Simulation in AJDSP on the application workspace.

11
an extra layer of abstraction between the general programming syntax and the end user, allowing
them to visualize the program flow easily.
Graphical programming is performed by connecting visual modules on a workspace, which is
then interpreted into machine-readable code. Although the representations differ, they contain
the same programming concepts found in most traditional languages. Graphical programming
languages include all the standard constructs, such as data types, loops, event handling, variables,
recursion, and object-oriented programming. They support diagrammatic modeling of processes
and tasks in terms of block diagrams and flowcharts, providing a more intuitive programming
experience to the end user.
1.1.3 Existing Graphical Programming/Simulation Applications
The higher level of abstraction and intuitive usage of graphical programming languages make it a
popular choice for developing educational software. Examples of educational applications using
graphical applications include CiMPLE 4 developed by ThinkLAB for teaching robotic
technology, GnuRadioCompanion 5 a signal processing toolkit for radio technology and
LadderLogic 6, a programming interface for simulating relay logic in Programmable Logic
Controllers. LabView 7 is a popular graphical programming language developed by National
Instruments. It provides toolboxes for data acquisition, instrument control, and industrial
automation applications. Simulink 8 is a block-based simulation environment from Mathworks,
Inc. used for designing models and analyzing dynamic systems. Educational applications
employing visual programming have been developed in several universities. Scratch 9 is a web
based programming language developed by Lifelong Kindergarten Group at the MIT Media Lab,
enabling users to create interactive stories, games and art 10
. J-DSP 11
, developed at the SenSIP
center of Arizona State University, is a visual programming interface to perform digital signal
12
processing labs over the internet. Most graphical programming languages are designed for PCs
and very few applications exist on the mobile platform.
1.2 Interactive Software Tools in DSP Education
Digital Signal Processing (DSP) is one of the major fields of education and research in electrical
and computer engineering. Investigating the application of complex mathematical paradigms in
the real world forms an integral part of signal processing.
Modern computers are capable of executing intricate mathematical computations, allowing the
student to concentrate on the underlying concepts. Several programming environments
supporting signal-processing education have been developed in last decade.
1.2.1 Existing DSP Education Software
The authors in 12
describe a suite of java-based tools to assist in signal processing education. A
basic waveform generator, an audio receiver and a graphic equalizer integrated into a tool for
teaching real time DSP is presented in Morrow, et.al 13
. MentorDSP 14
is an interactive learning
resource for signal processing techniques and statistical analysis. However, these tools feature
dialog based user interface and do not support graphical programming environments.
MATLABTM 15
by Mathworks, Inc. is a commercial simulation environment to perform
numerical computations and signal visualization in a scripting environment. Although MATLAB
implements efficient techniques for computing mathematical algorithms, it lacks a sophisticated
graphic user interface. J-DSP 11, 34
was proposed as a non-commercial, web based visual
programming environment, in order to address DSP education challenges not catered to by other
existing tools.

13
1.2.2 The J-DSP Programming Environment
J-DSP was developed as a standalone Java applet allowing users to run programs directly on a
browser 16
. The primary objective of the J-DSP software was to enable undergraduate students to
have hands on experience signal processing concepts and to facilitate the understanding of
related mathematical algorithms 17
. In addition to signal processing, JDSP has been successfully
extended to multidisciplinary areas such as digital communications, control systems, genomic
signal processing 17
, earth systems signal processing 18
, RF power amplifiers 19
, and sensor
networks 20
. AJDSP is developed as a standalone, graphical programming environment based on
JDSP for the Android platform.
1.3 Emergence of Mobile Devices
1.3.1 Growth of the Mobile Market
In recent years, the rise of mobile devices has opened up a new platform for education software
technologies. Since the first iPhone was introduced in 2007, the popularity of smartphone
devices and tablet PCs have increased exponentially. The first Android powered device was
introduced by Google in October 2008. By the end of 2010 Android had become the world's
leading smartphone platform, overtaking Symbian from Nokia. Statistics show that the sale of
Android and iOS units shipped in 2011 has outpaced that of personal computers units 21. By
2012, 500 million devices were running on Android with 1.3 million activations per day.
Android is presently the leading smartphone environment, capturing 68% of the market. Both
Apple and Google have developed their

14
Fig 1.2: Rise in application downloads on the Google Play store 23
online distribution systems, encouraging a large number of third-party developers to build
applications catering to niche markets. A recent survey indicates that, there are about 675,000
apps in the Android ecosystem and Google’s Play Store has reached more than 25 billion
downloads 22
. The rise of mobile devices reflected in the number of application downloads is
illustrated in Fig 1.2.
1.3.2 Mobile Technology for Interactive Learning
The powerful processors and interactive user interfaces make mobile devices an attractive
platform for education technologies. Understanding the effectiveness of smartphones and tablets
in classroom instruction has been a subject of considerable research in recent years. The
advantages of handheld devices over personal computers in K-12 education have been
investigated in 24
. The study shows that easy accessibility and maneuverability of handheld
devices has been found to boost student interest. The application of mobile technologies in
higher education in 25
indicates that smartphones assist students in grasping complex principles
and leads to increase in class participation. The use of smartphones in engineering and
15
mathematics courses has demonstrated that mobile devices can broaden the scope and
effectiveness of technical education in classrooms 26, 27
.
1.3.3 Existing Mobile Education Apps
Several applications related to signal processing and education are present in the Android
ecosystem. Examples of educational apps include Electrical Engineering 28
, a basic circuit toolkit
by GK Soft and Signal Processing Study Guide 29
, a guide providing concise explanations of
concepts accompanied by a comprehensive set of exercises. AndroSpectro 30
, an audio analysis
application from AndroiDSP and Speedy Spectrum Analyzer 31
, an FFT based spectral analysis
visualizer are some of the signal processing based applications. A well-known tool for signal
processing simulations is MATLAB Mobile, featuring a command-line interface 32
. It provides a
lightweight version of MATLAB that runs on a remote computer. However, this application does
not support a sophisticated graphic user interface and relies heavily on a stable internet
connection. In order to overcome these limitations, iJDSP, a standalone iOS version of the J-DSP
software was proposed in 33, 34
. iJDSP has been the recipient of NEEDS premier award for best
courseware of 2012. AJDSP has been inspired by iJDSP in several aspects. AJDSP was proposed
as a graphical programming environment for conducting signal processing laboratories on the
Android platform 35, 36
.

16
1.4 Signal Processing Laboratories for the Android Ecosystem
Fig 1.3: Filter design simulation in AJDSP with impulse response, z-domain representations, input
parameters and filter coefficients.
AJDSP is designed exclusively for the Android platform using the Android SDK 37. The
modules appear in AJDSP as graphical blocks brought into the workspace by a drag-n-drop
process and connected to each other to establish signal and data flow. Modern mathematical
methods are used to implement a comprehensive list of signal processing algorithms enabling
students to perform undergraduate DSP laboratories. A view supporting dynamical entry of input
parameters is associated with each block. An intuitive user interface has been designed to
immerse the user in a rich and interactive learning setting. Compelling demonstrations encourage
students to visualize concepts like convolution and frequency response in an autodidactic
environment. Interoperability of the application is preserved by adapting the user interface to suit
a diverse set of Android devices. The block diagram for filter design simulation in Android
JDSP, along with input user interface and the signal display modules is illustrated in Fig 1.3.

17
1.4.1 Contributions
Following is the list of contributions made in this thesis:
A architecture for graphical applications on Android devices has been designed and
developed. The Model-View-Controller 38
, a popular paradigm for software architecture,
has been optimized for the Android platform.
A rich suite of signal processing functions required to perform undergraduate DSP
laboratories has been implemented. The algorithms are ported from JDSP 11 and
modified to suit the Android environment.
An intuitive user interface has been designed to maintain consistency, increase usability
and facilitate ease of navigation. User interfaces have been developed in XML to separate
the application presentation with program code.
The architecture of the JDSP was rewired to make it suitable to the Android environment.
The programming constructs for accessing and visualizing data had to be modified to
optimize it for the Android environment. User Interfaces are drawn using code different
from the iOS version of the application. Android supports a variety of devices of different
screen resolutions. The interface had to be customized to all the devices.
A set of laboratory exercises demonstrating the application of AJDSP in an
undergraduate DSP course has been created or adapted from 39
with the advice of
Dr.Spanias. These exercises are designed to illustrate signal processing concepts such as
z-domain and frequency domain representation of signals, the Fast Fourier transform
digital filter design and convolution.
An extensive assessment methodology to identify the impact of employing mobile
devices to perform DSP simulations and laboratories has been developed. The evaluation

18
to assess the interactive capabilities of the AJDSP framework and its ability to sustain
student interest has been designed.
Two workshops 42
; one for graduate students of signal processing and another for
students of EEE407/591. Digital Signal Processing of Arizona State University. The
workshops were organized to test the robustness of the application and to evaluate the
effectiveness of the application in fostering student understanding. Results of the
assessment has been collected and analyzed. The changes proposed in the workshop have
been incorporated in improving the application.
1.5 Organization of the thesis
The rest of the thesis is organized as follows. Chapter 2 presents an overview of the
application, describes the application architecture and the development methodology.
Chapter 3 describes the signal processing functions available in AJDSP. A description of
the laboratory exercises and associated assessment results in provided in Chapter 4. The
laboratory exercises include continuous/ discrete convolution, frequency and z-domain
response, filter design and FFT. Possible extensions of the software in interdisciplinary
areas and health monitoring along with the concluding remarks are discussed in Chapter
5.
19
Chapter 2
OVERVIEW, ARCHITECTURE AND IMPLEMENTATION
AJDSP is a standalone, graphical programming platform that exploits the resources of the
Android platform to create an interesting student-learning environment. Mobile devices, which
have risen in popularity in recent times, combine portability and powerful processing capabilities
with friendly user interfaces to provide a compelling platform for engineering education
applications. AJDSP is aimed at utilizing these features of smartphone technology to develop
novel learning environments for the signal processing community. It employs a graphical
interface suitable to put across intricate concepts in an easily understandable manner. Several
algorithms, necessary to build a sound understanding of signal processing concepts are
implemented as graphical modules. Compelling visualizations helps users to easily visualize the
workings of the implemented algorithms. A set of interactive demonstrations have been built in
to better assist students in understanding and educators to put across concepts like the
convolution and z-transform. Developing the application on Android devices enables us to have
a larger reach among educators and students. The software can be used both as a supplement to
traditional classroom teaching and as a medium of self-learning. Using AJDSP, the students can
learn using a block diagram system level approach with inputs and outputs, establish and run
DSP algorithms with various configurations on their Android devices, access the application
anywhere/anytime without the need for Internet connectivity, use the multi-touch interface to
view interactive demos on convolution and z-transforms and perform undergraduate signal
processing laboratories.

20
2.1 AJDSP Overview.
In this section, I present a brief overview of the signal processing functions and interactive
demonstrations in AJDSP.
2.2.1 Existing Signal Processing Functions
A comprehensive list of signal processing functions, including signal generation, signal
processing and signal display units are incorporated into the application. All functions in AJDSP
are organized as graphical blocks that can be visually added to the main simulation workspace.
AJDSP has capabilities to generate deterministic as well as random signals. In addition to
conventional signals such as rectangular, triangular and exponential signals, MIDI and DTMF
waveform generators are also integrated into the
Fig 2.1 Function list view and search.
21
software. AJDSP has a rich suite of time and frequency domain signal processing functions.
Modern mathematical techniques are used to implement algorithms like the fast Fourier
transform, filter design and z-domain transformations on the Android platform. Visualization
tools for time, frequency and z-domain signals are included in the application. Fig 2.1 shows a
complete list of modules along with the block search functionality. A comprehensive description
of the various signal processing functions in AJDSP is given in Chapter 3.
2.2.2 Brief Overview of Interactive Demonstrations
The interactive demonstrations are included in AJDSP to assist the students in understanding
DSP related concepts. Two demonstrations, one involving convolution and the other illustrating
the relationship between z-domain and frequency domain representations, are included in the
application.
The PZ Placement demonstration is designed to assist students in understanding the relationship
between z-domain and frequency domain representations. The user interface for this
demonstration is shown in Fig 2.2. Poles and zeros can be added on the left panel and the
frequency responses are plotted on the right hand panel. The users can move individual poles and
zeros and examine the corresponding changes in the frequency response. The second
demonstration is based on the process of convolution.

22
This provides a graphical illustration of discrete and continuous time convolution processes. Two
input signals are selected from a drop down menu and added to the demo workspace. Each step
of the convolution procedure including flipping, shifting and progressive multiplication of the
signal samples is illustrated with animations. The impact of the demonstration on student
understanding is assessed through a questionnaire and the results are presented in Chapter 4.
2.3 Application Architecture.
The architecture of AJDSP is based on the Model-View-Controller (MVC) Paradigm illustrated
in Fig 2.3(a). This paradigm separates the representation of information from the user's
interaction with it. The model stores application data and block parameters. The controller acts
mediates between the model and the view, handling events common to both. The view comprises
of the user interfaces, including the application workspace.
Fig 2.2 PZ Placement demo. The interactive movement of poles and zeros result in change of
frequency response. This demonstration was highly rated in the assessments

23
We employ a modified version of the MVC paradigm to design the architecture of AJDSP. The
block diagram of the architecture is shown in Fig 2.3.
2.3.1. Model
The graphical modules along with the block parameters, algorithm implementations and the
input interface constitute the model component. The model contains the configuration
information of the blocks as well as the algorithm parameters. The algorithm parameters are
dynamically set by the user through the user interface. Each module has a Part Calculator
implementing the signal processing algorithms related to the function. The implementation of the
DSP modules is described in Section 2.4.1
2.3.2. View
The View renders blocks into a form suitable for interaction. It provides functionalities for
selection, movement and deletion of blocks. It constitutes the main workspace of the software
and comprises of the user interface for connection of blocks, designing block
Fig 2.3 System architecture.
24
diagrams and performing graphical simulations. Development of the user interface and the
mechanisms of event handling are described in sections 2.4.2 and 2.4.3 respectively.
2.3.2. Controller
The main control functions of the program are handled by the Controller. The Controller has two
main methods: creation of blocks and updating the block parameters during simulations. Block
creation is performed as follows: The block data and parameters are sent to the Parts Controller
which uses the data to create a customized module component for each block. A graphical user
interface of the module is then rendered on the workspace by the View component. The updating
of the blocks is implemented as follows: Parameters are updated during simulations or from user
input and sent to the Parts Controller. The Parts Controller recalculates the parameters using the
corresponding calculator and assigns the altered data to the pins. Each module then updates the
blocks connected to it and the change is transmitted along all the blocks in the simulation.
2.4 System Implementation
2.4.1 Overview of the Android SDK
Android is an open source linux-based operating system registered under the Apache license. It
has a large community of developers writing applications in a customized version of Java. A
detailed description of the Android SDK can be found in 37. Activities, intent, xml components,
canvas, bitmaps and threads are some of the SDK components used in AJDSP. A brief
description of these is given below.

25
Activities and Intents: An activity is a component providing a screen for user interaction.
Each activity typically has a specific function such as taking a photo, composing emails
and checking the inbox. An application usually is composed of multiple loosely-bound
activities. One activity designated as the ‘main’ activity and is launched at startup. Each
activity is capable of starting another activity in response to user navigation. The
activities of the Android SDK are started by messages called intents. The intent is an
object carrying a description of the operation to be performed. Intents can also hold a data
object which needs to be transferred between activities.
Activities and intents constitute basic building blocks of the AJDSP application. The
view window for the main workspace is provided by the StartView Activity and provides
the environment to create graphical simulations. Typically, the user interface of every
module has a dedicated Activity which is accessed from the PartList through an Intent.
Intents are also used to get back to the main workspace from the user interface and to
navigate between user interfaces of the same graphical module.
User Interface: User interface elements are built using View and ViewGroup objects. A
View is an object that renders something on the screen that the user can interact with. A
ViewGroup is an object that holds other View objects and defines the layout of the
interface. The layout can be rendered in two ways: in a separate xml class and along with
the application program. Declaring the user interface in XML keeps the presentation
separate from the application code, enabling the user interface to be modified without
changing the code which uses it.
AJDSP uses the XML interface to draw the user interface menus for each module. Some
of the examples are the user interface for the Part List (Fig 2.1), Signal Generator, FFT

26
and FIR Design modules. Some of the modules require customized views and need to be
rendered by code. The PZ Plot View, Convolution demo and the PZ Placement demo (Fig
2.2) are examples of modules requiring customized views.
Canvas and bitmaps: Canvas is used to create custom graphics or make changes to an
existing view. Canvas is generally used when the view needs to dynamically updated.
The canvas can be modified either in the main UI thread by calling invalidate () or from a
separate thread. The canvas performs the drawing on an underlying Bitmap which is then
placed on the view window.
Bitmaps are used in AJDSP to display UI components such as block diagrams and
buttons. The main application of bitmaps is to maintain the uniformity of the UI across
different screen sizes of Android devices. Bitmaps of different sizes are loaded in the
application and are selected according to the screen size and resolution of the mobile
device.
2.4.1 Implementing Graphical Modules
Each graphical module in AJDSP implements a specific signal processing construct. The
PartObject class contains the parameters and methods for drawing, setting and retrieving the
block data and connections of the block.
Block parameters fall into two main categories: the algorithmic parameters and the block display
parameters. The algorithmic parameters are the input and output variables of the signal
processing algorithms implemented by the module. The input parameters are entered by the user
using the UI of the module and processed in the PartsCalculator class. The calculator computes
the output parameters using the implemented algorithm and returns them to the PartObject
instance. The position of the blocks and the corresponding pins in the workspace are stored in the
27
block display parameters. They are dynamically updated by user actions such as block selection,
block movement, block deletion and establishing connections. These parameters serve to
remember the position of the module in the workspace helping to choose the right blocks to
process user actions.
The Android SDK uses bitmaps for rendering graphical objects into the workspace. A composite
bitmap made up of a rectangular bitmap for the part and circular bitmap for the pins is used to
render the blocks. The module also stores the ego-centric network of the block. When a new
block is connected, it is assigned as a child to the parent block. Any changes occurring in the
parent block is reflected in the corresponding parameters of the child block.
2.4.2 Implementing User Interfaces
The user interface is designed using XML which facilitates the presentation of the application
separated from the code which executes. This enables the modification of the user interface
without changing the application code.
Relative layouts are mainly used in designing the xml layouts. Declaring elements in relative
layouts helps in eliminating the need for nested view groups and reduces the UI hierarchy. Most
of the layouts in AJDSP are constructed using the existing elements such as Linear Layouts,
Relative, Buttons, Spinner and Edit Text. Some of the modules such
as PZPlot, PZPlacement and MIDI require custom user interfaces and implementations handled
in a separate thread. The user interface for the PZ Plot is shown in Fig 2.2.
2.4.3 Event handling
Creation of a graphical simulation involves user action such as movement, placement and
connection of the blocks. Accordingly, the application has capabilities to handle different user
inputs. Response to gesture recognition is handled using the MotionEvent and LongClickListener
28
interfaces provided by the Android SDK. The application mainly implements three gestures;
double tapping to select the input parameters of the bloc, sliding to move the block along with
the connections, and long press to delete the blocks and connections. The ACTION_DOWN,
ACTION_MOVE of the MotionEvent interface and the onLongClick method of the
LongClickListener interface are used to handle the corresponding user actions.
The user interface of the each module is accessed by double tapping of the block. This is
detected by two activations on the ACTION_DOWN pointer within a short time period. The
appropriate block selected by the comparing the coordinates stored in the block display
parameters and the input coordinates. Block movement is performed by placing a finger on the
block and dragging it across the canvas. The block is first selected and then the
ACTION_MOVE pointer is activated. The coordinates of the block is continuously updated
resulting in the movement. Connections and blocks are deleted by using the long press gesture
which triggers the LongClickListener interface. The appropriate parts are selected by comparing
the part coordinates with the input coordinates.
2.6 Performing Simulations
Students can learn DSP concepts by implementing them as simple block diagrams using AJDSP.
An example simulation of a Fast Fourier Transform using AJDSP is described.
The functions are selected through the Function List view accessible by pressing the ‘+’ button
in the main workspace. The Functions List view displays a comprehensive list of functions. The
Signal Generator, FFT and the Plot blocks are selected and added to the main workspace as
shown in Fig 2.4(a). The function parameters of each block can be accessed by double tapping
on the respective blocks and setting the fields to the required values. A connection is established
between two blocks by tapping on the output pin of the first block and then tapping on the input
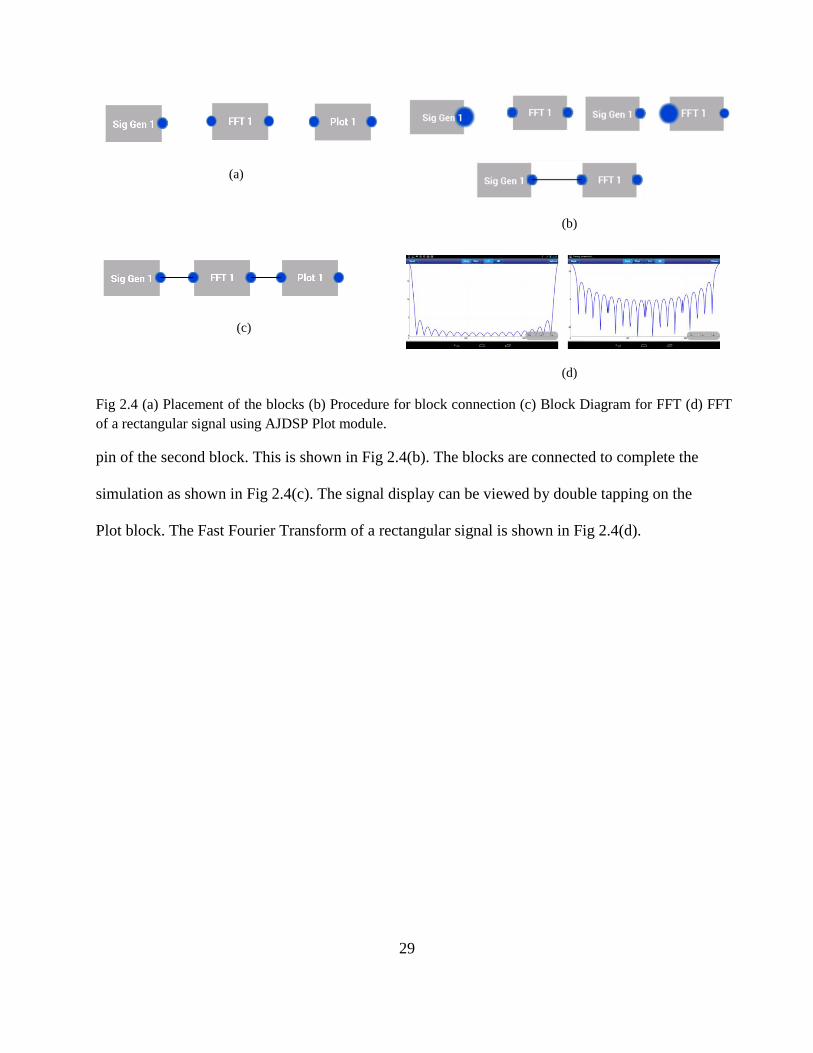
29
(a)
(b)
(c)
(d)
Fig 2.4 (a) Placement of the blocks (b) Procedure for block connection (c) Block Diagram for FFT (d) FFT
of a rectangular signal using AJDSP Plot module.
pin of the second block. This is shown in Fig 2.4(b). The blocks are connected to complete the
simulation as shown in Fig 2.4(c). The signal display can be viewed by double tapping on the
Plot block. The Fast Fourier Transform of a rectangular signal is shown in Fig 2.4(d).

30
Chapter 3
SIGNAL PROCESSING FUNCTIONS
In this chapter the functionalities implemented in Android JDSP is described. A total of 25 signal
processing modules have been developed. The modules are divided into signal generation, time
signal processing, frequency signal processing, signal display and interactive demonstrations.
The signal generation blocks generate deterministic, acoustic and random signals to provide a
diverse set of signals for the processing modules. The time and frequency signal processing
modules implement basic DSP algorithms like FFT, Filter design, signal compression and
convolution. The signal display modules are visualization tools for time, frequency and z-domain
signals and are used to visualize the output of the algorithms. The interactive demonstrations try
to put across concepts like the process of convolution and the relation between z and frequency
domain representations using animations and interactive displays. This chapter described each of
the modules in detail. Section 3.1 given a comprehensive list of the available functions. Section
3.2 describes the signal generation functions. Section 3.3 and 3.4 describes the time and
frequency signal processing functions respectively. Section 3.5 describes the signal visualization
modules while Section 3.6 describes the interactive demonstrations.
3.1 List of Implemented Functions
Given below is a comprehensive list of functions presently implemented in AJDSP.
Signal Generator
PZ Placement
Frequency Response
PZ Plot
Plot

31
FFT
Convolution
Filter
Filter Coefficients
Kaiser Filter
Parks-McClellan
FIR Design
IIR Design
Adder
Down Sampler
Convolution Demo
MIDI
DTMF
PZ2Coefficient
BW Expansion
Junction
Up Sampler.
A detailed illustration of each function is provided below. The underlying signal processing
concepts required for developing the modules were taken from 39. The pin diagram of the
AJDSP functions are shown in Fig 3.1 and 3.2
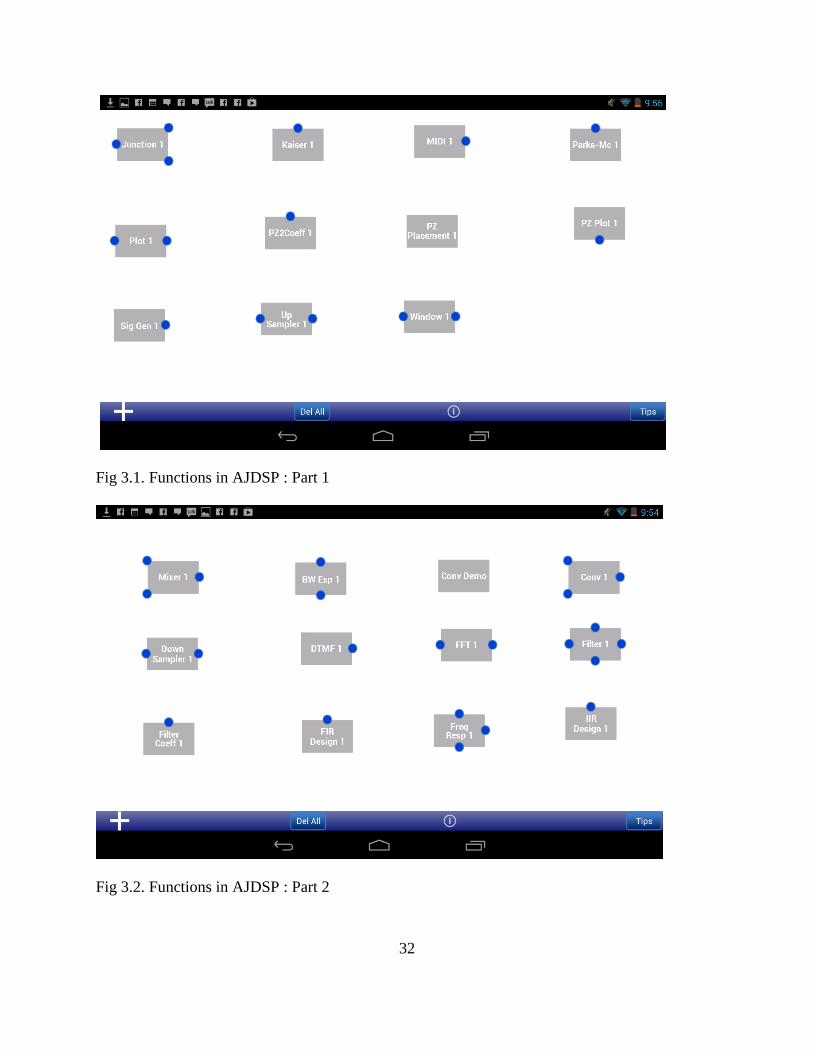
32
Fig 3.1. Functions in AJDSP : Part 1
Fig 3.2. Functions in AJDSP : Part 2

33
3.2 Signal Generation Blocks
3.2.1 Signal Generator
The Signal Generator is the basic input function of AJDSP. It supports a variety of discrete time-
domain signals. It supports periodic and non-periodic impulses, triangular, delta, exponential,
sinusoid, sinc and random signals. The pulse width, amplitude of the signal and time shift can be
defined by the user. Random signals can have uniform, normal, and Rayleigh distributions with
user specified mean and variance. The pin configuration of the signal generator block is given in
Fig 3.1 and plot of a triangular signal is shown in Fig 3.3.
Fig 3.3. Plot of a triangular signal

34
3.2.2 MIDI
The MIDI signal generator simulates a piano keyboard and generates Musical Instrument Digital
Interface (MIDI) sounds at the frequencies described by the MIDI standard. The sounds are
generated by sequence of pre-recorded tones with a sampling frequency of 8KHz. Fig 3.4
illustrates the user interface of the MIDI signal generator. The left hand plot pane shows the time
domain output of the MIDI player and the right hand plot pane shows the frequency spectrum of
the MIDI block’s output. The pin diagram of the MIDI generator is shown in Fig 3.1.
Fig 3.4. User interface of a MIDI generator.

35
3.1.3 DTMF
This block generates Dual-Tone-Multi-Frequency (DTMF) tones used in landline telephony
applications. This block generates a single tone of length and are generated by sequence of pre-
recorded tones with a sampling frequency of 8KHz. The generated tones can be used in a DSP
simulation. The DTMF view and the corresponding waveform are illustrated in Fig 3.5. The pin
configuration is illustrated in Fig 3.2.
3.3 Signal Channeling Blocks
3.3.1 Mixer
The Mixer block adds or subtracts two input signals and gives the result at the output pin. The
plus/minus options can be input by the user. The pin configuration of the Mixer block is
illustrated in Fig 3.2.
3.3.2 Junction
The Junction block propagates its input signal to its two outputs. The input signal can be either
time-domain, frequency-domain, or filter coefficients. The Junction block essentially allows
other blocks to share the same signal or parameters. The pin configuration of the Junction block
is illustrated in Fig 3.2.
Fig 3.5 (a) DTMF (b) Signal Waveform of dial tone “5”
36
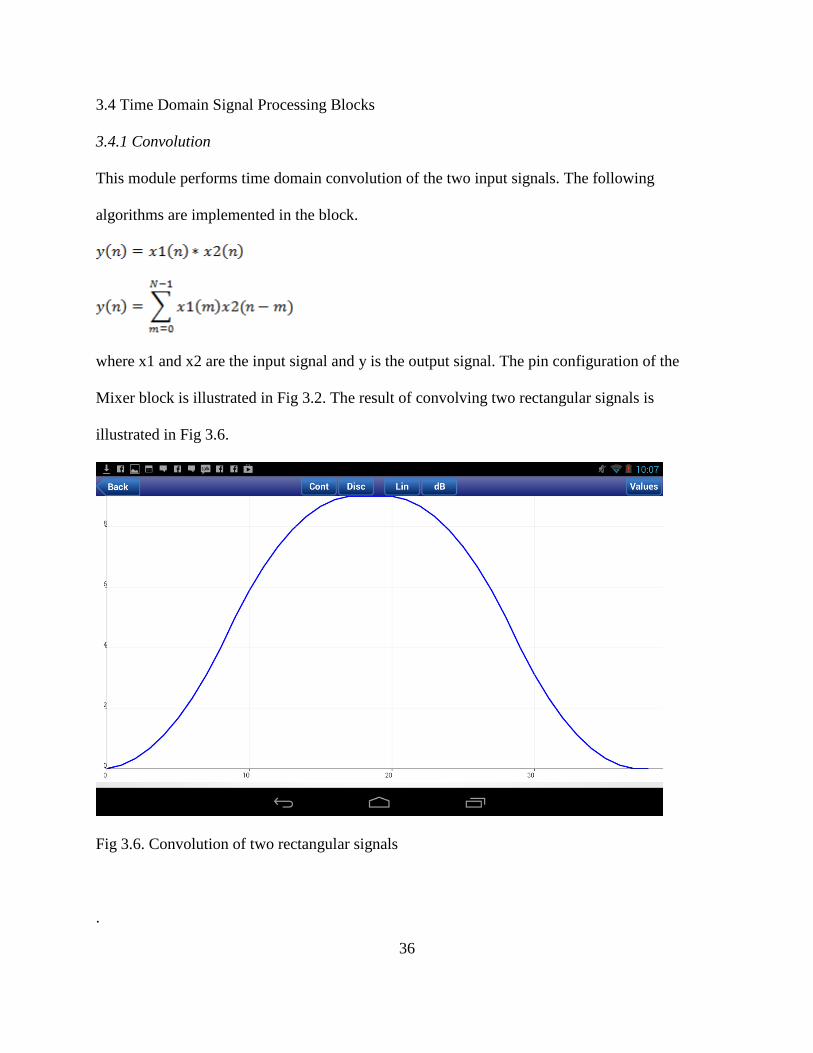
3.4 Time Domain Signal Processing Blocks
3.4.1 Convolution
This module performs time domain convolution of the two input signals. The following
algorithms are implemented in the block.
where x1 and x2 are the input signal and y is the output signal. The pin configuration of the
Mixer block is illustrated in Fig 3.2. The result of convolving two rectangular signals is
illustrated in Fig 3.6.
Fig 3.6. Convolution of two rectangular signals
.

37
3.4.2 Downsampler
This block down–samples the input signal by an integer factor M. The integer factor is input by
the user. The following equation is implemented:
where x is the input signal and y is the output signal. The pin diagram of the convolution block is
given in Fig 3.2.
3.4.3 Upsampler
This block up–samples the input signal by an integer factor L. The integer factor is input by the
user. The following equation is implemented
where x is the input signal and y is the output signal. The pin diagram of the upsampler block is
given at 3.1.
3.5 Frequency Domain Signal Processing Blocks
3.5.1 FFT
The FFT block computes the discrete Fourier transform (DFT), of the input signal using the
Cooley-Tukey algorithm 40. The Cooley-Tukey algorithm is a common fast Fourier transform
algorithm that uses a “divide and conquer” approach to break down a DFT of any composite
size, N, into many smaller DFTs. The possible FFT lengths supported are 8, 16, 32, 64, 128 and
256. The FFT block takes in a signal and computes the magnitude and phase of the Fourier
transform. The frequency domain representation of a triangular signal is given in Fig 3.7. The
block diagram is given at Fig 3.2.
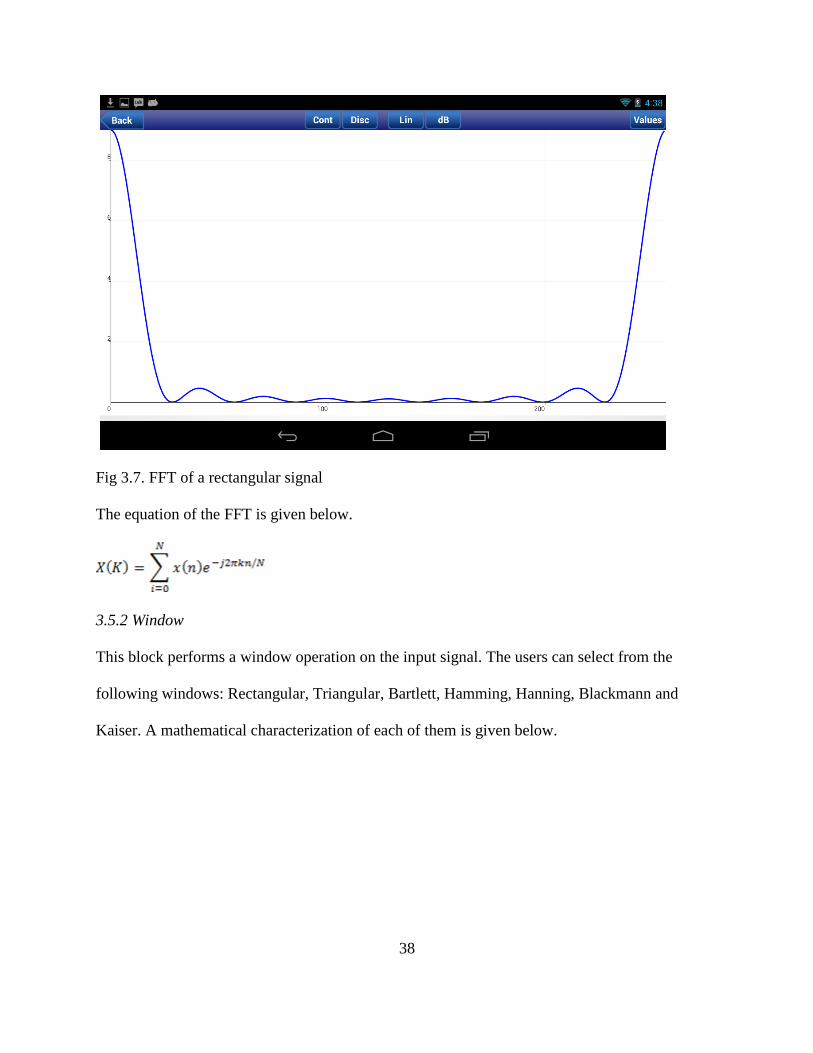
38
Fig 3.7. FFT of a rectangular signal
The equation of the FFT is given below.
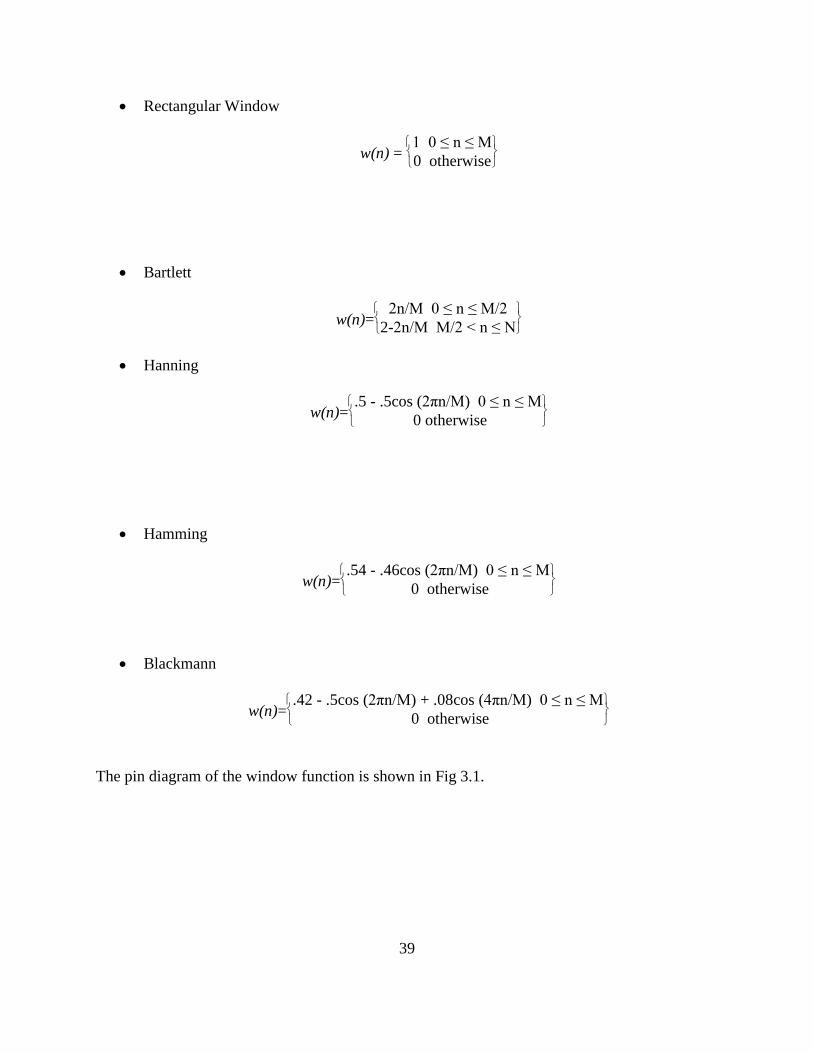
3.5.2 Window
This block performs a window operation on the input signal. The users can select from the
following windows: Rectangular, Triangular, Bartlett, Hamming, Hanning, Blackmann and
Kaiser. A mathematical characterization of each of them is given below.
39
Rectangular Window
w(n) =
1 0 ≤ n ≤ M
0 otherwise
Bartlett
w(n)=
2n/M 0 ≤ n ≤ M/2
2-2n/M M/2 < n ≤ N
Hanning
w(n)=
.5 - .5cos (2πn/M) 0 ≤ n ≤ M
0 otherwise
Hamming
w(n)=
.54 - .46cos (2πn/M) 0 ≤ n ≤ M
0 otherwise
Blackmann
w(n)=
.42 - .5cos (2πn/M) + .08cos (4πn/M) 0 ≤ n ≤ M
0 otherwise
The pin diagram of the window function is shown in Fig 3.1.
40
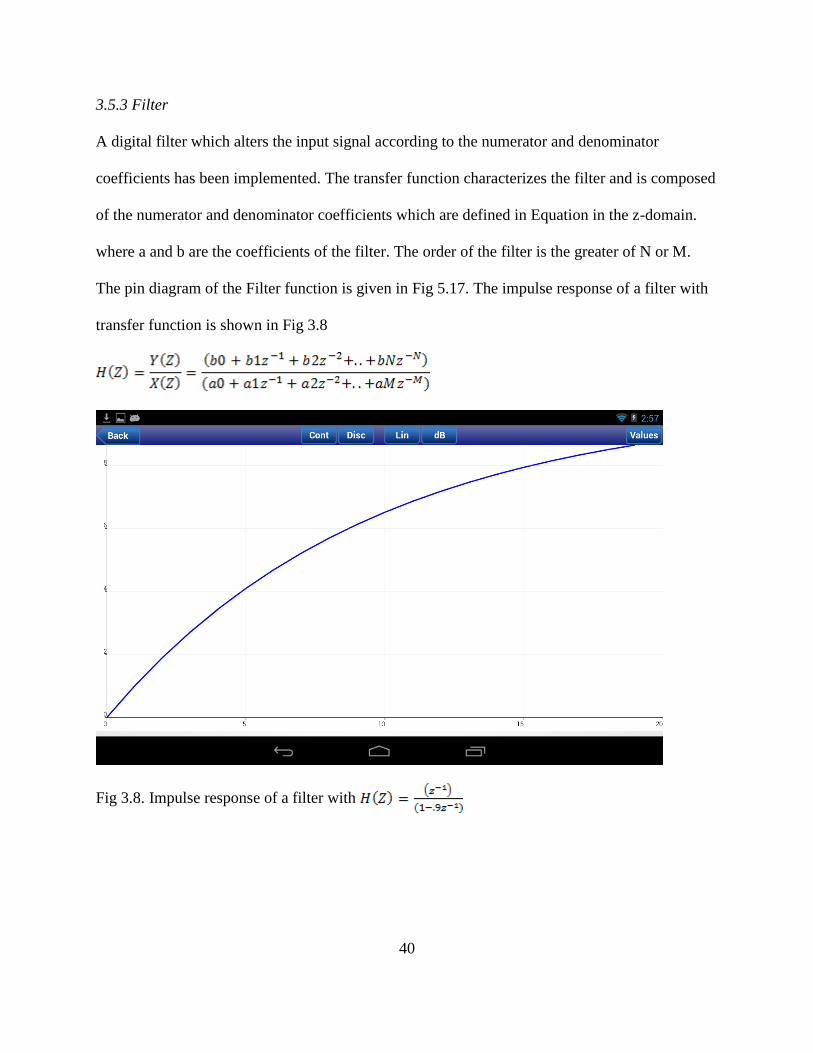
3.5.3 Filter
A digital filter which alters the input signal according to the numerator and denominator
coefficients has been implemented. The transfer function characterizes the filter and is composed
of the numerator and denominator coefficients which are defined in Equation in the z-domain.
where a and b are the coefficients of the filter. The order of the filter is the greater of N or M.
The pin diagram of the Filter function is given in Fig 5.17. The impulse response of a filter with
transfer function is shown in Fig 3.8
Fig 3.8. Impulse response of a filter with

41
Fig 3.9. Input menu of filter coefficient block.
3.5.3 Filter Coefficient
The Filter Coefficients block acts as an input to the filter block and sets the coefficients of the
transfer function. AJDSP has the capability to add a maximum of 11 filter coefficients. The input
menu to the filter is shown in Fig 3.9. The pin diagram is given by Fig 3.2.
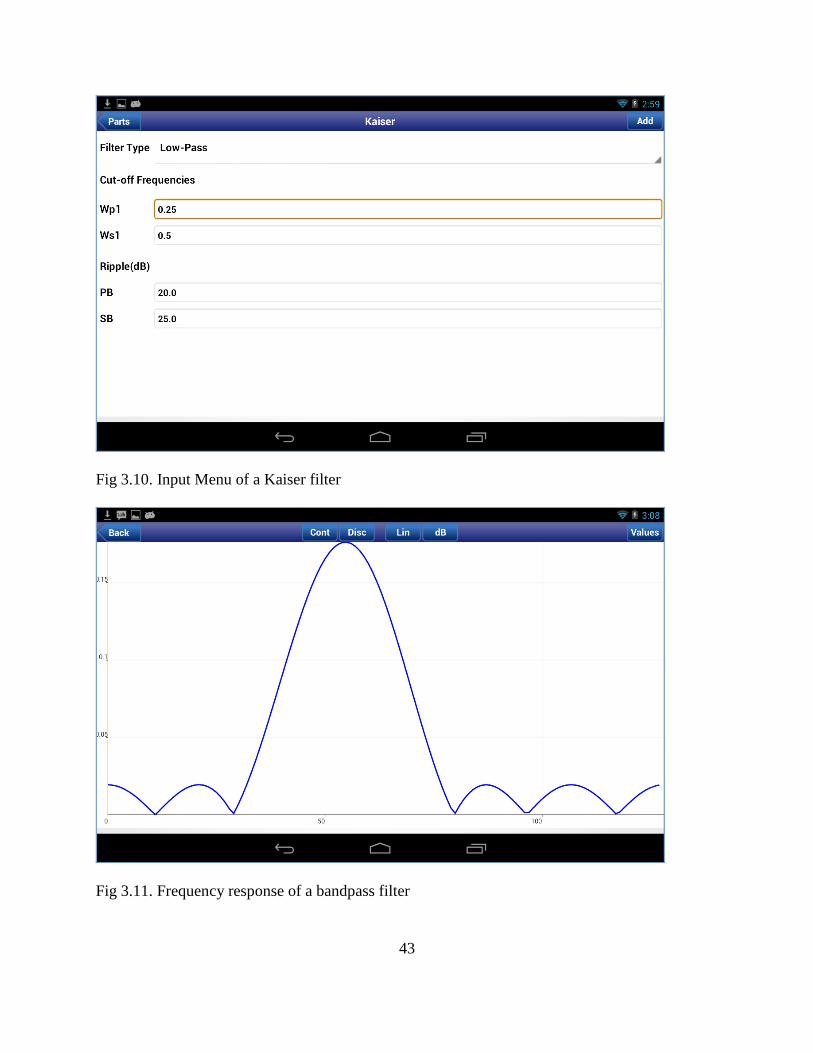
3.5.4 Kaiser
This block designs Kaiser FIR filters based on the windowing method. The design process
involves calculating the Fourier series of the ideal filter and then multiplying it with a Kaiser
window that best fits the filter specifications. The module takes filter type, cut off frequencies
and tolerances for the pass and stop bands. The parameter window of the Kaiser Filter is shown
in Fig 3.10 .The module implements the following equation.

42
The Kaiser Window is given by
w(n)=
I0 (m,β)/ I(β) 0 ≤ n ≤ M
0 otherwise
Where I0 represents the zeroth order modified Bessel function. Parameter M represents the
length of the window. Parameter β controls the shape of the Kaiser window. It is a rectangular
window when β equals to 0. The shape of the window changes, as β increases. The β parameter
is given by the below equation.
Where is the transition band of the filter and A is equal to the smaller of PB and SB.
w(n)=
.1102 (A-8.7) A > 50
0.5842 (A-21)0.4
+0.07866 (A-21) 21 ≤ A ≤ 50
0 A < 21
3.5.5 Parks McClellan
This block designs FIR filters using the Parks-McClellan algorithm with min-max
implementation. Parks-McClellan designs FIR filters by minimizing the maximum difference
between the impulse response of the designed filter (Hd) and the ideal filter for a certain filter
order M (H). This is mathematically described in the following equation. The filter is designed
by minimizing the following expression
2
43
Fig 3.10. Input Menu of a Kaiser filter
Fig 3.11. Frequency response of a bandpass filter

44
The pin diagram of the Parks McClellan block is shown in Fig 5.23. The frequency response of a
bandpass Parks-McClellan filter with cutoff with Wp1=0.4, Ws1=0.25, Wp2=0.6, Ws2=.75 is
shown in Fig 3.11.
3.5.6 FIR Design
This function designs a finite impulse response (FIR) filter based on the windowing method42.
This method is a technique implemented by representing the frequency response of an ideal filter
in a Fourier series and then truncating and smoothing the response using a window. Window
type, filter type, cutoff frequencies and filter order are the parameters input by the user. The
frequency response of a low pass filter with a Bartlett window and cut off frequency of .2π is
shown in Fig 3.12 and user interface is shown in Fig 5.13. The pin diagram of the block is shown
in Fig 3.2.
Fig 3.12. Frequency response of a low pass filter with bartlett window.

45
3.5.7 IIR Design
The block designs an infinite (length) impulse response (IIR) filter based on the bilinear
transformation 42. Butterworth, Chebyshev -I & -II, and Elliptic filters are supported. The block
diagram is shown in Fig 3.2. The frequency response of a low pass Chebyshev II filter is shown
below. The IIR filter are determined by the normalized passband cutoff frequency Wp, gain at
passband edge PB, normalized stopband cutoff frequency Ws and gain at stopband edge SB. The
mathematical representations of highpass filters are given byButterworth
Chebyshev I
Fig 3.13. User interface of FIR Design block

46
Chebyshev II
Where is the Mth order Chebyshev’s polynomial
Elliptic
where UM the Jacobian elliptic is function also called as the Rational Normalized function. The
user interface showing a Chebyshev II high pass filter with Wp1=.4 and Ws1=.2 is given by Fig
5.14. The pin diagram of an IIR filter is given in Fig 3.2.
Fig 3.14. User interface of an IIR Design block.

47
3.5.8 Bandwidth Expansion
This function performs the Bandwidth Expansion of a filter. The bandwidth coefficient is taken
as the input and this factor is multiplied to the z domain transformation. The transfer function of
the input is
This block multiplies the z domain by a factor of g which and produces an output whose transfer
function is
where g is the factor of expansion. The pin diagram of the Bandwidth expansion filter is given by
Fig 3.2.
Fig 3.15. User interface of PZ2Coefficient block.

48
3.5.9 PZ2Coeff
This block enables the user to dynamically add poles and zeros as conjugate pairs on a PZ plane
and calculates the corresponding filter coefficients. The user interface is shown in Fig 3.15. The
users can move the poles and zeros around and the block calculates the corresponding filter
coefficients. Capabilities to add zeros, poles and reset the pole zero diagram are supplied. The
pin diagram of the block is shown in Fig 3.2
3.5 Signal Display Blocks
3.5.1 Plot
The plot function is the primary time domain signal display function of AJDSP. It renders the
input signals to a two dimensional graph.
Fig 3.16. FFT of a rectangular signal illustrated using plot.

49
The function displays magnitude, phase, real and imaginary parts of the signal according to user
input. The signal can be plotted in both linear and dB scales. Values of the signal can be viewed
by clicking the Values button on the right hand corner of the top bar. The zoom function of the
plot block allows the user to examine the property of the signals in different resolutions. The plot
of the FFT of a rectangular signal is plotted in dB and is shown in Fig 3.16.
3.5.2 Frequency Response
This function is the primary frequency domain display function of AJDSP. It takes filter
coefficients as the input, calculates the frequency spectrum of the signal and displays it using the
Activity of the Plot Part. Options for calculating the phase and the magnitude of the signal are
provided and the selected option is sent to the plot activity to be displayed.
Fig 3.17. Frequency response of a high pass Chebyshev II filter
50
3.5.3 PZ Plot
The magnitude of the frequency response for a low pass Parks McClellan Filter with cut-off
frequency of .2 is shown in Fig 3.17. This function displays the z-domain representation of a
given signal. It calculates the position of the poles and zeros by applying the z domain
transformation to the input filter coefficients. It displays the poles and zeros to the in a z-plane as
shown in Fig 3.18. The poles and zeros are displayed by clicking the “Values” button on the
right of the top bar. The pin diagram of the frequency response module is shown in Fig 3.1.
3.6 Demonstrations
3.6.1 Convolution Demo
The demo presents a graphical animation of the process of convolution. Both continuous and
discrete convolution is supported. The user can select from causal and non-causal
rectangular, triangular, sinc, delta and exponential input signals. The animation is rendered using
a SurfaceView object controlled by a thread. The animation is rendered creating a list of signals
which is sequentially let into the SurfaceView window. This demo takes two signals and
illustrates the process of graphical convolution through attractive animations.
3.6.2 PZ Placement Demo
This demo is meant to demonstrate the relationship between z-domain and frequency domain.
The user interface for this demonstration is shown in. Poles and zeros can be added on the left
panel and the magnitude and phase of the frequency response is plotted in the right hand panel.
The users can move the poles and zeros around and examine the corresponding changes in the
frequency response. The placement panel is created using a SurfaceView and controlled by a
Thread Object.

51
Chapter 4
LABORATORIES AND ASSESSMENTS
In this chapter the evaluation methodology and the insights from the feedback obtained is
described. Two workshops were conducted, one for graduate and the other for undergraduate
students. The goal of the graduate student workshop was primarily to assess the robustness and
the accuracy of the software while the undergraduate workshop was conducted to assess the
ability of the application to foster understanding of signal processing concepts. The evaluation
also assessed the interactive capabilities of the AJDSP framework and its ability to sustain
student interest. General assessments about the aesthetics and the usability can be incorporated to
obtain an overall subjective opinion about the application. The impact of the designed
laboratories on student understanding of DSP will also be tested. Furthermore, the exercise
compared user experience between desktop and mobile versions of JDSP. Command line and
graphical interfaces for signal processing applications was also compared with regards to ease of
use and their ability to foster conducive learning environments. The pedagogy adopted for the
use of AJDSP include the following: (a) lecture on the pertinent signal processing concepts, (b) a
pre-quiz on the concepts involved in the laboratory exercise, (c) simulation exercises and
laboratories using AJDSP, (d) a post-quiz to test student understanding of the concepts. This
chapter is organized as follows. Section 4.2 brief descriptions of the exercises and briefly states
the objective of each exercise. Section 4.3 describes the evaluation results and discusses insights
gained. Section 4.4 discusses the overall feedback obtained from the evaluations and planned
improvements for the software.

52
4.2 Laboratories
4.2.1 Discrete and Continuous Convolution
This exercise introduces the concepts of continuous and discrete time convolution and enables
students to visualize the convolution demonstrations. The Convolution Demo block helps the
students to visualize the process of convolution through an animated demonstration. The effect
of causality in continuous and discrete convolution is also demonstrated effectively. For a given
set of input signals, the Convolution Demo block animates the convolution procedure and plots
the resulting impulse response on the same plot screen. The students are asked to make
observations of both continuous and discrete convolutions. Two sets of signals: (a) causal
triangular and non-causal triangular, and (b) causal delta and causal exponential are examined for
discrete convolution while another two sets of signals i.e. (a) non-causal rectangular and non-
causal rectangular (b) non-causal exponential and non-causal triangular are used as input signal
for continuous signals. This exercise evaluates the effectiveness of the convolution demo block
in helping students understand the process of convolution.
4.2.2 Fast Fourier Transform
The second exercise focuses on frequency and z-domain representations. This is aimed at
evaluating the utility of FFT and PZ placement modules of AJDSP. The effectiveness of
different windows in resolving the frequency spectrum of a signal is studied in the first part. The
input signal is composed by adding two sinusoids with closely spaced frequencies. Different
types of windows, such as Rectangular and Bartlett, are applied to the input signal. The resulting
signal is then transformed to the frequency domain using

53
Fig 4.1. Block diagram for comparing signal resolution characteristics for different
windows.
the FFT block to compare the resolution capabilities of the two windows. The block diagram is
illustrated in Fig 4.1. Students were asked to compare the resolution capabilities of the two
windows and relate the window properties to resolution capabilities. The second part had two
main aims: (a) to evaluate the PZ Placement module. (b) to compare desktop and mobile
environments regarding ease of use and support of conducive learning environments. Students
were asked to design a low pass filter using 3 sets of zeros and 2 sets of poles. This exercise was
performed both on desktop using JDSP and mobile tablets using AJDSP and students were asked
to compare their experience. The results of this evaluation are presented in Section 4.2.
4.2.3 Filter Design
The third exercise focuses on filter design. The main objectives of this exercise are (a) evaluate
the filter design modules (b) measure the capability of the software to support learning of filter
design (c) compare the command line and graphical programming interfaces for signal
processing applications on mobile devices. The first part focuses on IIR filter design and students
are asked to design low pass filters using IIR design block. Filter specifications including the
pass-band and stop-band cutoff frequencies and tolerances was provided and the filter was
designed using Butterworth, Chebyshev 1, Chebyshev 2 and Elliptic filters.
54
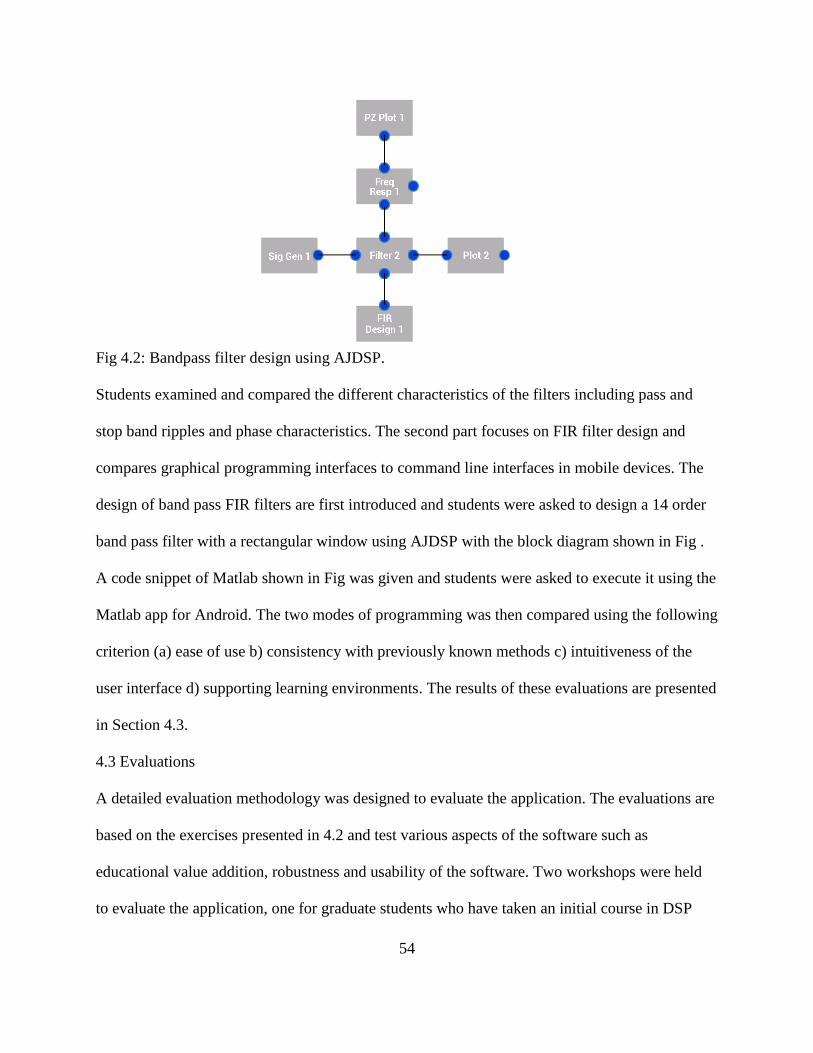
Fig 4.2: Bandpass filter design using AJDSP.
Students examined and compared the different characteristics of the filters including pass and
stop band ripples and phase characteristics. The second part focuses on FIR filter design and
compares graphical programming interfaces to command line interfaces in mobile devices. The
design of band pass FIR filters are first introduced and students were asked to design a 14 order
band pass filter with a rectangular window using AJDSP with the block diagram shown in Fig .
A code snippet of Matlab shown in Fig was given and students were asked to execute it using the
Matlab app for Android. The two modes of programming was then compared using the following
criterion (a) ease of use b) consistency with previously known methods c) intuitiveness of the
user interface d) supporting learning environments. The results of these evaluations are presented
in Section 4.3.
4.3 Evaluations
A detailed evaluation methodology was designed to evaluate the application. The evaluations are
based on the exercises presented in 4.2 and test various aspects of the software such as
educational value addition, robustness and usability of the software. Two workshops were held
to evaluate the application, one for graduate students who have taken an initial course in DSP

55
and the other for undergraduate students who are presently undergoing a senior level DSP class.
Both the workshops followed the pedagogy shown in Section 4.1 but the objectives of each
workshop differed. The objective of the workshop to graduate students was mainly to test the
robustness and usability of the application while giving less importance to education value
gained. The workshop for the undergraduates on the other hand laid emphasis on the educational
value gained by using the software. I now describe both the workshops and the feedback
obtained.
4.3.1 Workshop for Graduate Students
The workshop for graduate students was attended by 20 students. Students were mainly PhD
students and Post Doctorals working in signal processing and related fields such as
communication, machine learning, computer vision and audio processing. These students had the
experience to gauge the effectiveness of the application in teaching DSP concepts and to give
valuable feedback on the robustness and usability of the application. The questionnaires were
designed to obtain feedbacks on three main categories: The ability of the application to assist in
DSP education, the usability of the application and the efficiency and robustness of the
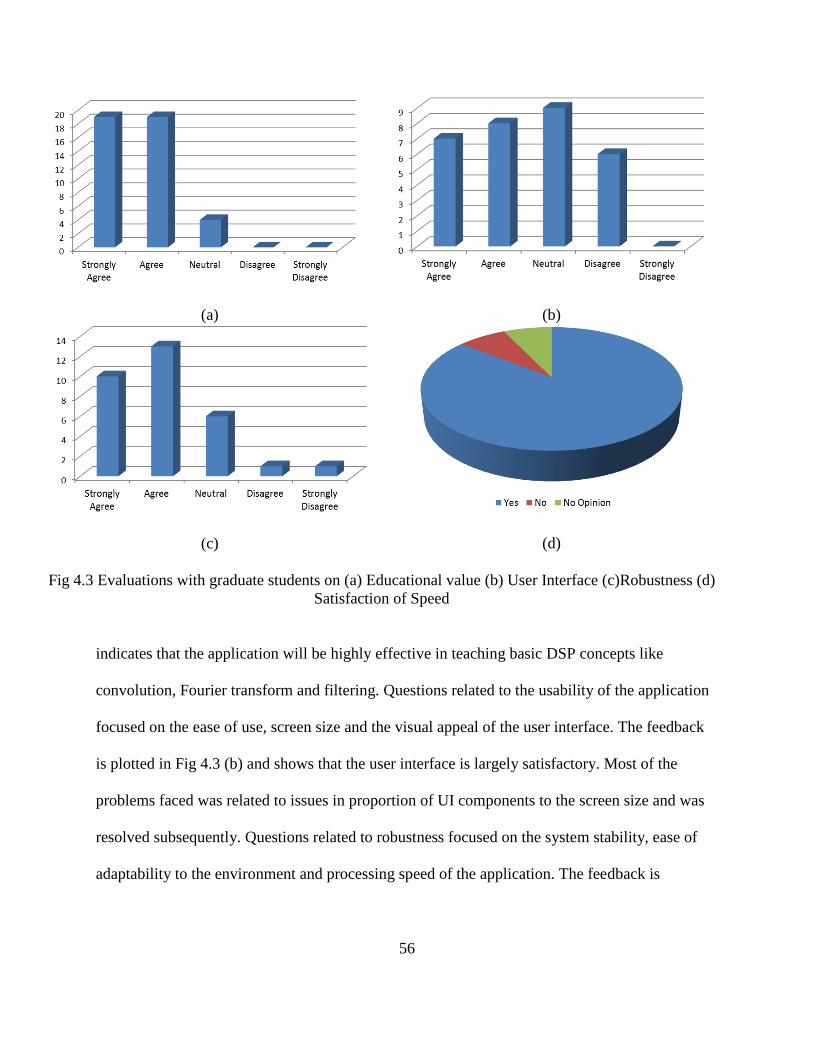
application. The feedback is divided into these categories and is summarized in Fig 4.3.
The questions were followed the Likert scale formatting style 44 were asked in form of a
statement having five possible responses (a) Strongly Agree (b) Agree (c) Neutral (d) Disagree
(e) Strongly disagree. A set of questions were asked on each of the mentioned areas and the
average responses were plotted in Fig 4.3. Questions meant to test the educational value of the
software focused on the concepts put forth in the exercises and obtained feedback on the
effectiveness of the application in teaching them. The feedback is shown in Fig 4.3 (a) and it
56
(a) (b)
(c) (d)
Fig 4.3 Evaluations with Graduate students on (a) Educational value (b) User Interface (c) Robustness (d)
Satisfaction of Speed
(a) (a) (b)
(c) (d)
Fig 4.3 Evaluations with Graduate students on (a) Educational value (b) User Interface (c) Robustness (d)
Satisfaction of Speed
(b)
(a) (b)
(c) (d)
Fig 4.3 Evaluations with Graduate students on (a) Educational value (b) User Interface (c) Robustness (d)
Satisfaction of Speed
(c)
(d)
Fig 4.3 Evaluations with graduate students on (a) Educational value (b) User Interface (c)Robustness (d)
Satisfaction of Speed
indicates that the application will be highly effective in teaching basic DSP concepts like
convolution, Fourier transform and filtering. Questions related to the usability of the application
focused on the ease of use, screen size and the visual appeal of the user interface. The feedback
is plotted in Fig 4.3 (b) and shows that the user interface is largely satisfactory. Most of the
problems faced was related to issues in proportion of UI components to the screen size and was
resolved subsequently. Questions related to robustness focused on the system stability, ease of
adaptability to the environment and processing speed of the application. The feedback is

57
illustrated in Fig 4.3 (c) and (d) and it shows that the application is robust and has satisfactory
processing speed.
4.3.2 Workshop for Undergraduate Students
The workshop for undergraduate students was attended by 15 people. The attendees were mainly
senior undergraduate presently taking an introductory Digital Signal Processing course in
Arizona State University (EEE 407). The students had been introduced to the basic concepts of
DSP such as convolution, filter design and frequency transformation. The objectives of this
workshop were as follows; 1) Evaluate the effectiveness of the application in teaching signal
processing concepts to students 2) Compare the suitability of command line and graphical
programming interfaces in signal processing education 3) Test the robustness of the application.
Questions were in a similar format as the workshop held for graduate students. Two additions to
the previous format was made to fulfill the workshop objectives: 1) the questions of the
workshop was more detailed and were designed to guide the students to the underlying concepts
behind the simulations 2) an additional exercise was designed asking the students to design band
pass filters in MatLAB and AJDSP . This was designed in order to compare the suitability of
command
Fig 4.4: Evaluations with undergraduate students on (a) User interface (b) Application
speed.

58
line and graphical interfaces for signal processing educational laboratories for mobile devices .
The evaluations for the suitability of the user interface and robustness of the application provided
by the undergraduates is presented in Fig 4.4. The satisfaction of the students on the user
interface has considerably improved from the evaluations obtained from the graduate workshop.
This may be attributed to the improvements done to the software by incorporating the feedback
from the graduate workshop. The students were asked to evaluate the effectiveness of the
software in teaching basic signal processing concepts like filtering, convolution and frequency
domain transformations. The questions were formatted similar to the questions on robustness and
the responses are shown in Fig 4.5. The application was effective in putting across DSP concepts
to students. The effectiveness of the application in teaching convolution was especially highly
rated. This can be attributed to the interactive convolution animation. Students were also asked to
compare command line programming interfaces, provided MatLAB and graphical programming
interfaces provided in AJDSP and asked their preference for DSP educational applications on
mobile devices. Graphical programming interfaces were unanimously chosen by the students.
The reasons given were (a) knowledge of the syntax is required in the case of command line
interfaces (b) graphical programming is more intuitive (c) understanding of the concepts is easier
in graphical programming interfaces. (d) working internet connection is required for MatLAB to
run on mobile devices.

59
In order to measure the effectiveness of the application of the application in putting across
different DSP concepts, the answers given in pre-quiz and the post-quiz was compared and
illustrated in Fig 4.6. Students achieved an overall improvement of 11.36% after using the
application. The effectiveness was also measured across different concepts like FFT,
Convolution, Filtering and z-transform. Improvements in student performance were observed in
all concepts with FFT and convolution registering the highest improvement of nearly 30% and
25% respectively.
(a)
(b)
(c)
Fig 4.5: Suitability of the application in teaching DSP concepts (a) Filtering (b) FFT (c) Convolution

60
Fig 4.6: Effectiveness in improving DSP understanding.
61
Chapter 5
CONCLUSIONS AND FUTURE DIRECTIONS
Technological education can be hugely benefited from the emergence of mobile phones. These
devices provide mobility, good processing capabilities and an intimate learning environment.
Employment of graphical programming enables the student to concentrate on the underlying
concepts rather than the programming aspects. There have been previous attempts at building
applications for different levels of education. In this thesis, AJDSP, a DSP education application
developed for the Android platform is introduced. AJDSP is a graphical programming language
directed at undergraduate and graduate signal processing students. It features an exhaustive
implementation of basic DSP algorithms, an intuitive user interface and compelling signal
visualization tools. It has been developed as a native application of Android and makes use of the
device processors for analysis and visualization. AJDSP can be used as a supplement to
traditional classroom education and to facilitate self-learning.
The thesis first surveys various existing applications and brings out the need for a signal
processing educational application for mobile devices. AJDSP is then introduced as a graphical
programming application for Android operating system aimed at DSP educators and students.
The main features of AJDSP including signal processing modules, interactive animations
focusing on particular concepts and the intuitive user interface were then explained. The
architecture of AJDSP was then described as a derivative of the Model-View-Controller
paradigm optimized for the Android platform. The implementation process involving algorithm
implementation, user interface design,

62
handling user actions and maintaining compatibility with the wide range of Android devices was
discussed. Implementation of various DSP algorithms on AJDSP was then explained. Algorithms
were divided into signal generation, signal connection, time and frequency signal processing,
signal display and demonstration modules. The applications along with the concepts depicted in
each module are described. Two workshops were conducted, one for graduate signal processing
students and another for undergraduate DSP students presently taking a senior level DSP course.
The objectives of the workshop were to evaluate the user experience, robustness and the
potential learning benefits that can be derived from the application. The workshop showed the
app was robust and the user interface was reasonably easy to use and intuitive. Feedback from
the workshop was obtained to determine improvements and possible future directions for
application development.
5.2 Future Directions
5.2.1 Application in Health Monitoring
Mobile devices can act as a useful personal health monitoring devices and as educational tools
for students of such disciplines. A number of existing applications explore the potential
applications in health monitoring. Sensors present in mobile devices can collect various signals
useful for health monitoring such as ECG, skin temperature and irregularities on the body
surface. Signal processing algorithms implemented in AJDSP can be used to derive useful
insights from these signals. AJDSP can be used to build non-invasive physiological signal
monitoring tools. The tools can be used to introduce concepts in wireless sensing for health
monitoring to students, and demonstrate the application of DSP concepts to health monitoring
systems. The relation between human activity and health can be demonstrated using different
signal analysis tools. For instance, parameters such as pulse rate, blood pressure, oxygen

63
saturation, and skin conductance can be shown to vary based on physical activity and stress.
These extensions can be used to reach a wider set of students and also to broaden the application
areas of the software.
5.2.2 Extension to other domains.
The existing function modules can be extended to applications related to speech and image
processing. The microphone embedded in the device can be used to collect sound and voice
signals. Simple filtering and Fourier transform can be used to demonstrate basic characteristics
of audio signals. Various concepts like sound compression, spectral distribution and
psychoacoustic modeling can be demonstrated to graduate students specializing in speech
processing.
Extensions to other domains such as image processing, computer vision and social networks can
serve to reach a wider audience of educators and students and can also use to show the
application of basic signal processing algorithms in diverse areas.
64
REFERENCES
[1] Holliday, W. G., Harvey, D. A. 1976. “Adjunct labeled drawings in teaching physics to
junior high school students”. Journal of Research in Science Teaching. (Vol 13): 37–43.
[2] Thornton, P., Houser, C. 2004. “Using mobile phones in education”. IEEE International
Workshop Wireless and Mobile Technologies in Education: 3 – 10.
[3] Chou, C. 2003. “Interactivity and interactive functions in web-based learning systems: a
technical framework for designers”. British Journal of Educational Technology (Vol.34): 265–
279.
[4] ThinkLABS. 2009. “CiMPLE”. http://www.thinklabs.in/.
[5] Blossom, E. “GNURadioCompanion”. http://gnuradio.org/redmine/projects/gnuradio/wiki
/GNURadioCompanion.
[6] Kamen, Edward W. 1999. Industrial Controls and Manufacturing: Academic Press.
[7] National Instruments. 1986. “LabVIEW”. http://www.ni.com/labview/.
[8] MathWorks.Inc.1984. “Simulink”. http://www.mathworks.com/products/simulink/.
[9] Resnick, M., Maloney, J., Monroy-Hernandez, A., Rusk, N., Eastmond, E., Brennan, K.,
Millner, A., Rosenbaum, E., Silver, J., Silverman, B., Kafai, Y.2009. “Scratch: Programming for
All”. Communications of the ACM (November 2009).
[10] MIT Media Lab.2006. “Scratch”. http://scratch.mit.edu/.
[11] Spanias, A., Atti, V.2005. “Interactive online undergraduate laboratories using j-dsp” IEEE
Transactions on Education (Vol. 48, No 4):735– 749.
[12] Shaffer, J. Hamaker, J. Picone, J.1998. “Visualization of signal processing concepts”. IEEE
International Conference on Acoustics, Speech and Signal Processing.(Vol.3): 1853,1856.
[13] Welch,T.B. Morrow,M.G. Wright,C.H.G. and Ives,R.W. 2004. “commDSK: a tool for
teaching modem design and analysis”. ASEE Computer Education Journal. (Vol. XIV): 82–89.
[14] Sicard, E, ni2designs.2008. “MentorDSP”. http://www.mentordsp.com/.
[15] MathWorks.Inc.1983. “MATLAB”. http://www.mathworks.com/products/matlab/.
[16] Clausen,A., Spanias,A., Xavier, Tampi,M.1988. “A java signal analysis tool for signal
processing experiments”. IEEE International Conference on Acoustics, Speech, and Signal
Processing (vol. 3): 1849–1852.

65
[17] Spanias,A. Chakravarthy,N., Song,Y. and Iasemidis,L.2004. “Teaching genomics and
bioinformatics to undergraduates using J-DSP”. ASEE Annual Conference and Exposition.
[18] Ramamurthy, K., Spanias, A., Hinnov, L., Ogg, J. 2008. “On the use of J-DSP in earth
systems”. ASEE Annual Conference and Exposition.
[19] Santucci, R., Gupta, T., Shah, M., Spanias, A.2010. “Advanced functions of JavaDSP for
use in electrical and computer engineering courses”. ASEE Annual Conference and Exposition.
[20] Kwon, V. Berisha, V. Atti, V, Spanias, A. 2009. “Experiments with sensor motes and Java-
DSP”. IEEE Transactions on Education (Vol. 52 No. 2):257–262.
[21] Taylor,C. 2012. “Smartphone Sales Overtake PCs for the First Time [STUDY]”.
http://mashable.com/2012/02/03/smartphone-sales-overtake-pcs/.
[22] Android.2012. “Google Play hits 25 billion downloads”.
http://officialandroid.blogspot.ca/2012/09/google-play-hits-25-billion-downloads.html.
[23] Google Play.2012. “Google Play App Installs” http://3.bp.blogspot.com/-
Y7ycBYyZGco/UGLZa5az3_I/AAAAAAAAJvw/IXNgxKGlU_8/s1600/25%2BBillion%2BGra
ph.jpg.
[24] Soloway,E. Norris,C. Blumenfeld,P, Fishman,B, Krajcik,J., Marx,R.2001. “Log on
education: Handheld devices are ready-at-hand”. Communications of ACM. (Vol. 44, No. 6):15–
20.
[25] Thornton,P., Houser,C. 2005. “Using mobile phones in english education in japan”. Journal
of Computer Assisted Learning (Vol. 21, no. 3): 217–228.
[26] Potts,J., Moore,N. Sukittanon,S. 2011. “Developing mobile learning applications for
electrical engineering courses”. Proceedings of IEEE in Southeastcon: 293 –296.
[27] Yerushalmy, J., Ben-Zaken,O.2004. “Mobile phones in education: A case of mathematics”.
The Institute for Alternatives in Education, University of Haifa, 2004.
[28] GK Soft. “Electrical Engineering”.
https://play.google.com/store/apps/details?id=an.ElectricalEng.
[29] MobileReference. “Signal Processing Study Guide”.
https://play.google.com/store/apps/details?id=com.mobilereference.signal.
[30] AndroiDSP. “AndroSpecto”.
https://play.google.com/store/apps/details?id=com.augury.androspectro \

66
[31] Electron Chaos. “Speedy Spectrum Analyzer”.
https://play.google.com/store/apps/details?id=com.electronchaos.SpeedySpectrumAnalyzer.
[32] MathWorks.Inc. “Matlab Mobile”.
https://play.google.com/store/apps/details?id=com.mathworks.matlabmobile.
[33] Liu,J, Hu,S, Thiagarajan,J.J, Zhang,X. Ranganath,S., Banavar,M.K, Spanias,A.2012.
“Interactive DSP Laboratories on Mobile Phones and Tablets”. IEEE International Conference
on Acoustics, Speech, and Signal Processing.
[34] Hu,S. ,Liu.J, Spanias,A. Thiagarajan,J.J, Ramamurthy,K.N., Zhang,X., Ranganath,S.,
Banavar,M.K.2012. “A Mobile DSP Simulation App for Design, Testing and Education”. IEEE
International Conference on Emerging Signal Processing Applications.
[35] Ranganath, S. Thiagarajan, J.J.,Ramamurthy, K.N., Hu,S. Banavar, M. Spanias, A.2012.
“Work in progress: Performing signal analysis laboratories using Android devices”. Frontiers in
Education Conference: 1, 2.
[36] Ranganath, S. Thiagarajan, J.J.,Ramamurthy, K.N., Hu,S. Banavar, M. Spanias, A.2011.
“Undergraduate Signal Processing Laboratories for the Android Operating System”. Frontiers in
Education Conference.
[37] Android Developers. “Android Software Development Kit”.
http://developer.android.com/sdk/index.html.
[38] Buschmann, F, Meunier,R. Rohnert,H., Sommerlad,P., Stal, M. 1996. Pattern-Oriented
Software Architecture: Wiley.
[39] Spanias,A. 2007. Digital Signal Processing:An Interactive Approach: Lulu.
[40] Cooley,J., Tukey,J. 1965. “An algorithm for the machine calculation of complex fourier
series” Mathematics of Computation (vol. 19, no. 90): 297–301.
[41] Likert, R. 1932. "A Technique for the Measurement of Attitudes". Archives of Psychology
(140): 1–55.
[42] Ranganath,S. Rajan, D. Spanias,A. “AJDSP Signal Analysis Workshop”
http://jdsp.engineering.asu.edu/AJDSP_Workshop_2013/index.html


