

2
Section
1. E-commerce Landscape
2. Baby’s Product Digital Trend
3. Future Opportunity

3
A. Population in Indonesia
Indonesia’s population is entering the middle-class and affluent consumer (MAC)
Source : The Boston Consulting Group

4
A. Population in Indonesia
• The rapid growth of the middle classis generally a phenomenon indeveloping countries. The growth ofthe middle class is driven by a goodeducation, high employmentopportunities, and good purchasingpower so that their consumptionactivity is also good. The averagemiddle class in Indonesia expressthemselves through theirconsumption activities, especially intech products.
• Smartphone users will increase by103 million people and by 2018 arelikely to increase in the next years.
27.4
38.3
52.2
69.4
86.6
103
0
20
40
60
80
100
120
2013 2014 2015 2016 2017 2018
Mill
ion
Years
Monthly Active Smartphone Users in Indonesia
Source : id.techinasia.com

5
A. Population in Indonesia
34.1%
0.0%
5.0%
10.0%
15.0%
20.0%
25.0%
30.0%
35.0%
40.0%
2010 2011 2012 2013 2014 2015 2016
Pen
etra
tio
n P
erce
nta
ge
Years
Indonesia Internet Penetration
Source : APJII, We Are Social, Techinasia

6
82.0
14.7
9.88.5
5.8
0.0
10.0
20.0
30.0
40.0
50.0
60.0
70.0
80.0
90.0
Debit/ATM Card Mobile Banking User e-Money Card Internet Banking User Credit Card
Use
r (i
n M
illio
n)
B. E-banking User in Indonesia
Source : OJK, Buku Bijak Ber-Ebanking 2015

7
C. E-commerce in Indonesia
• E-commerce consumers in Indonesia are still centralized in Java and Bali with 4,6 Million internet users.
• Internet users in Indonesia has reached as much as 85% access the Internet via mobile devices. Startup companies in Indonesia could expect to benefit from the mobile internet growth to finally become one of the interesting and fast growing sector
• Indonesia has become the e-commerce center of the world after China and India. E-commerce sales in Indonesia is forecast to grow 22% in 2016, while it is only 0.24% in India and 0.15% globally.
• Investors have shown interest in E-commerce business, with 13% investing in 2016. 11% on other technology service like on-demand app.

8
D. E-commerce Market Prediction
Source : E-conomySEA, Google & Temasek Report

9
E. E-commerce Online Traffic Q2 2016
• 41.6% of the respondent havemade transaction via Mobile App.
• Next is PC/Laptop Browser with30.3% and followed by
• Mobile Browser with 28.1%.
• This condition indicated thatMobile Commerce (m-commerce)will be the next online shoppingtrend in Indonesia.
Source : Internal survey of Nusaresearch
Mobile App, 41.6%
PC/ Laptop Browser, 30.3%
Mobile Browser, 28.1%
Transaction

10
20%

11
F. Logistic Service Provider
92.98%
45.61%
14.04%
10.53%
8.77%
8.77%
3.50%
1.75%
5.27%
JNE
TIKI
Pos Indonesia
DHL
EMS
Fedex
Go-jek
Wahana Express
Others
Go-jek unexpectedly become most reliable logistic for same day delivery service in regional basis.
Source : Spire research and consulting

12
G. Popular Brand Index
Rank of Popular
E-Commerce PBI IR
1 Lazada 26.4
80%
2 Tokopedia 19.9
3 Bukalapak 13.2
4 OLX 10.7
5 Elevenia 6.7
6 Blibli.com 6.3
7 Mataharimall 4.3
8 Zalora 3.7
9 Shopee 2.3
10 Sale Stock 1.4
11 Qoo10 0.8
12 Berrybenka 0.6
13 Bhinneka 0.4
14 FJB Kaskus 0.4
15 Blanja 0.4
16 Orami by Bilna 0.2
17 Alfacart 0.1
18 Jakartanotebook 0.1
19 Hijabenka 0.1
20 JD.id 0.1
PBI is obtained by the Internet sampling (Online Panel) and with samples of 1200 respondents in the W&S onlinepanel. The results obtained for E-Commerce Category with PBI concept is as follows:
leading as the most popular E-commerce site in Indonesia with
a score of 26.4
Source : Internal survey of Nusaresearch

13
H. E-commerce Landscape in Indonesia
Marketplace FashionB2C

14
I. Baby E-commerce Brand Awareness Comparison
Orami by Bilna BebeloveMothercareIndonesia
BabyZania DuniaBayi AdikBayi Tororo BundaBayi IniBayiku Blibli
2015 62.0 26.0 27.0 20.0 21.0 13.0 37.0 18.0 18.0 10.0
2016 91.0 21.0 18.0 18.0 17.0 17.0 16.0 14.0 14.0 11.0
0.0
20.0
40.0
60.0
80.0
100.0
2015 2016
Source : Internal Survey of Nusaresearch
Still leading the baby e-commerce segment in
Indonesia

15
J. E-commerce Challenges
Logistic Infrastructure
Internet Penetration
Government Policy
Customer’s Trust Payment System Human Resource

16
Section
1. E-commerce Landscape
2. Baby’s Product Digital Trend
3. Future Opportunity

17
A. Popular E-commerce Categories
49.3%
26.2%
24.2%
21.0%
19.8%
15.9%
14.2%
11.9%
9.2%
9.0%
8.4%
7.4%
7.4%
6.9%
6.4%
6.3%
62.4%
43.4%
41.4%
29.0%
35.7%
27.0%
26.9%
16.6%
16.4%
17.4%
15.3%
11.1%
13.3%
9.7%
9.7%
10.6%
Fashion
Handphone
Electronic Devices
Health and Beauty
Home Appliances
Computer
Food
Baby Product
Ticket dan voucher
Camera
Office tools
Book
Motorbike Parts
Music
Industrial
Car Parts
Transaction
Accessed
Source : Internal survey of Nusaresearch
7
n=500

18
B. Ever Purchased vs Last Purchased
63.0%
74.5%
75.4%
29.4%
45.7%
37.5%
34.5%
51.3%
63.4%
57.0%
Infant Milk Formula
Diaper
Baby Soap
Stroller
Baby Porridge
UHT Milk
Baby Carrier
Baby Biscuit
Baby Powder
Baby Massage Oil
26.0%
25.7%
7.6%
6.0%
5.5%
5.5%
4.6%
4.4%
3.4%
1.8%
Infant Milk Formula
Diaper
Baby Soap
Stroller
Baby Porridge
UHT Milk
Baby Carrier
Baby Biscuit
Baby Powder
Baby Massage Oil
Source : Internal survey of Nusaresearch n=500

19
Baby Diapers

20
C. Baby Diapers Brand Awareness Index
84.6
77.4
69.6
49.2
41.0
32.8
27.824.8
10.07.8
12.2
MamyPoko Pampers Sweety Merries Huggies Goo.n Fitti HappyNappy
Pokana Nepia Lainnya
Source : Internal Survey of Nusaresearch
Most engage brand through TV ads for people in Indonesia
n=500

21
D. Most Impactful Baby Diaper Source
83.2
48.5
47.7
47.7
45.9
41.7
41.7
36.1
34.3
33.7
27.7
10.4
TV Commercial
Brochure / Flyers
Recommendation from others
Social Media Ads
Internet (browsing)
Newspaper / Magazine
Billboard
Event sponsorship / exhibition
Recommendation from doctor / nurse
Recommendation from retailer / seller
Radio Ads
Others
Traditional ads like TV and flyers tend to be
most impactful source of information to choose Baby Diapers Brand
n=500Source : Internal Survey of Nusaresearch

22
E. Place to Buy Baby Diapers
37.2
36.6
11.4
7.0
3.8
2.6 1.2.2
Minimarket
Supermarket
Hypermarket
Grocery Store
Baby Shop
Warung / Kiosk
Online Shop
Exhibition
n=500Source : Internal Survey of Nusaresearch
Buying Online

23
Infant Milk

24
25.0
16.615.2
10.0
6.6 6.45.2 4.6
2.6 2.0
5.8
SGM (Ananda, BBLR, Eksplor,
LLM+, …)
Dancow(Batita, Datita,
Nutrigold)
Bebelac Morinaga(BMT, Chil Kid,Chil Mil, Chil
School,Chirumiru,
Hagukumi, NonLactose)
Lactogen(Lactogrow)
Nutrilon Frisian (Baby,Flag)
S-26 (Gold, NutriSure,
Procal, Procal Gold, Promise, Promise Gold,
…)
Pediasure Enfagrow Lainnya
has the highest TOM score compare to other infant milk
brand
F. Infant Milk Top of Mind Brand
Source : Internal Survey of Nusaresearch n=500

25
G. Infant Milk Brand Parent Index
83.4
80.2
70.8
53.4
47.8 47.244.4
37.8
29.2
24.823.4
5.6
Nutricia Nestle Sari Husada(SGM)
MeadJohnson
Morinaga Frisian Abbott WyethNutrition
Sustagen Anmum Friso Lainnya
Source : Internal Survey of Nusaresearch
Leads the baby’s infant Milk market in Indonesia with their
wide line brand product
n=500
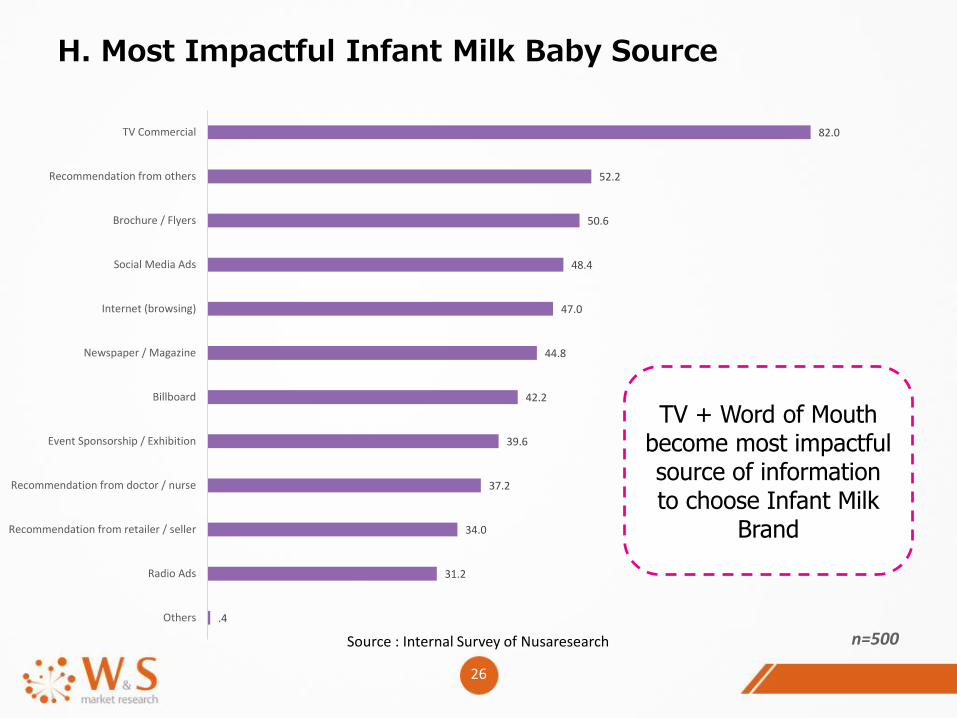
26
H. Most Impactful Infant Milk Baby Source
82.0
52.2
50.6
48.4
47.0
44.8
42.2
39.6
37.2
34.0
31.2
.4
TV Commercial
Recommendation from others
Brochure / Flyers
Social Media Ads
Internet (browsing)
Newspaper / Magazine
Billboard
Event Sponsorship / Exhibition
Recommendation from doctor / nurse
Recommendation from retailer / seller
Radio Ads
Others
TV + Word of Mouth become most impactful source of information to choose Infant Milk
Brand
n=500Source : Internal Survey of Nusaresearch

27
I. Place to Buy Baby Infant Milk
31.8
31.4
9.6
9.4
6.8
5.4
4.8 .8
Supermarket
Minimarket
Hypermarket
Baby shop
Grocery store
Online shop
Warung / Kiosk
Exhibition
Source : Internal Survey of Nusaresearch
Buying Online
n=500

28
Section
1. E-commerce Landscape
2. Baby’s Product Digital Trend
3. Future Opportunity

29
Strategies to Acquire Baby & Mom in Digital Market
1
2
3
4
5
Focus business strategy into mobile user acquisition. Place and engage more ads on mobile or list up in marketplace.
Baby product e-commerce still widely open market, more segmented product would be better option in current state.
Be innovative with delivery service. Make useful of same day delivery to send your product in neighborhood area.
Bundle baby care products tend to be more attractive for people to buy online. Subscription model is upcoming trend.
Offer flexible payment with bank instalment or mobile payment option for further buying convenient.


