University of Louisville FoundationPresident’s Report
Dr. James R. RamseyUniversity of Louisville
December 19, 2011
2011 Is Almost Over!
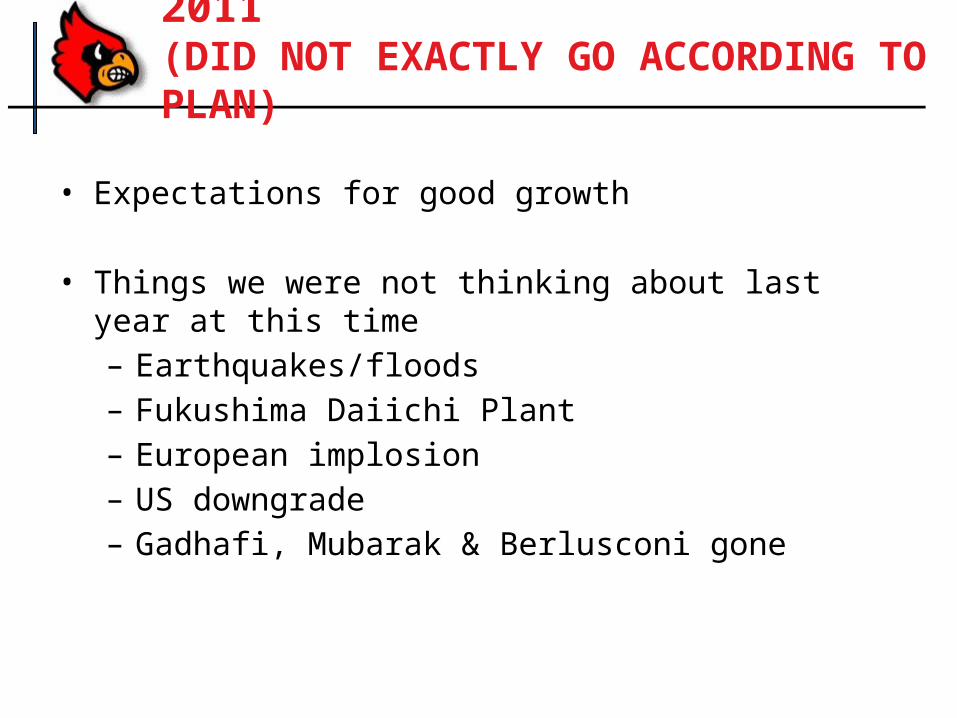
• Expectations for good growth
• Things we were not thinking about last year at this time– Earthquakes/floods– Fukushima Daiichi Plant– European implosion– US downgrade– Gadhafi, Mubarak & Berlusconi gone
2011 (DID NOT EXACTLY GO ACCORDING TO PLAN)
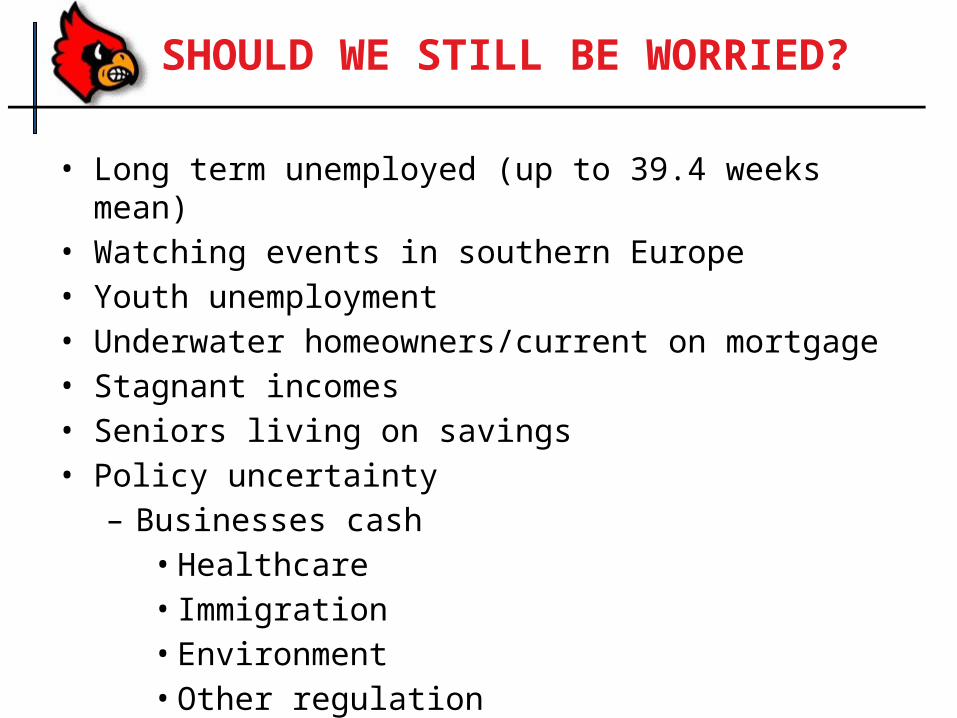
• Long term unemployed (up to 39.4 weeks mean)• Watching events in southern Europe• Youth unemployment• Underwater homeowners/current on mortgage• Stagnant incomes• Seniors living on savings• Policy uncertainty– Businesses cash• Healthcare• Immigration• Environment• Other regulation
SHOULD WE STILL BE WORRIED?

WE KNOW THAT NATIONALLY TIMES HAVE BEEN UNPRECEDENTED
1st Q05
2ndQ05
3rdQ05
4thQ05
1stQ06
2ndQ06
3rdQ06
4thQ06
1stQ07
2ndQ07
3rdQ07
4thQ07
1stQ08
2ndQ08
3rdQ08
4thQ08
1stQ09
2ndQ09
3rdQ09
4thQ09
1stQ10
2ndQ10
3rdQ10
4thQ10
1st Q11
2nd Q11
3rd Q11
4th Q11
-10
-5
0
5
10
2%
US GDP

US EMPLOYMENT
-
Dec-07
Feb-08
Apr-08
Jun-08
Aug-08
Oct-08
Dec-08
Feb-09
Apr-09
Jun-09
Aug-09
Oct-09
Dec-09
Feb-10
Apr-10
Jun-10
Aug-10
Oct-10
Dec-10
Feb-11
Apr-11
Jun-11
Aug-11
Oct-11
Dec-11
-1000
-800
-600
-400
-200
0
200
400
600
120,000
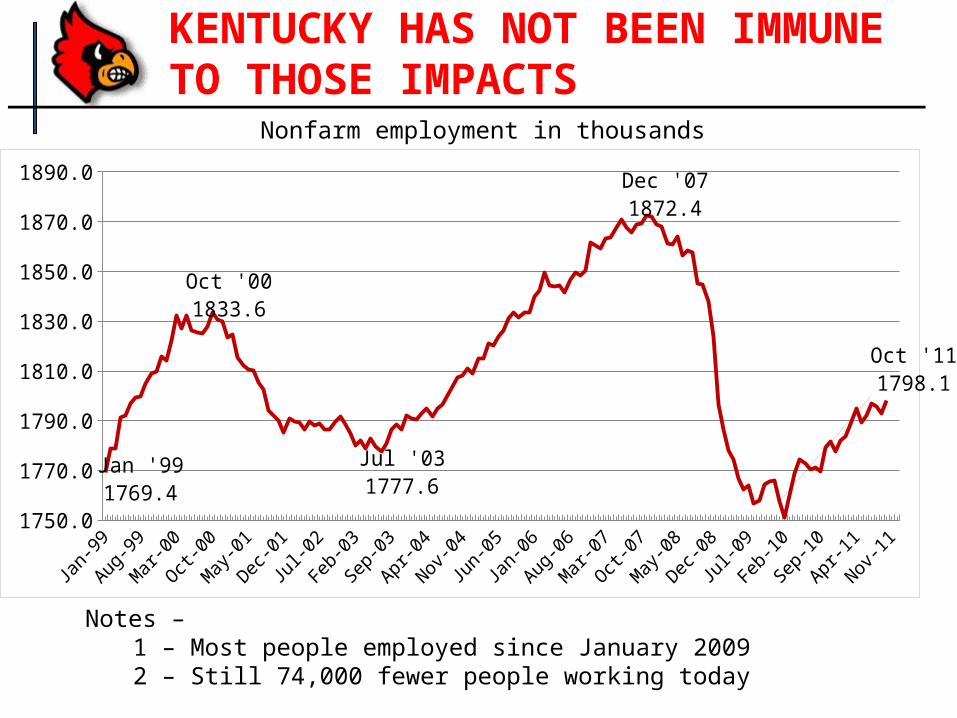
KENTUCKY HAS NOT BEEN IMMUNE TO THOSE IMPACTS
Nonfarm employment in thousands
1750.0
1770.0
1790.0
1810.0
1830.0
1850.0
1870.0
1890.0
Jan '991769.4
Oct '001833.6
Jul '031777.6
Dec '071872.4
Oct '111798.1
Notes – 1 – Most people employed since January 2009
2 – Still 74,000 fewer people working today

• State General Fund Revenue (funds higher education – or is supposed to
STATE POLICY DISCUSSION
FY08 FY09 FY10 FY11 FY12 FY13 FY14General
Fund 1.1 a -2.7 a -2.4 a 6.5% a 2.8% e 1.8% e 2.4% e
%
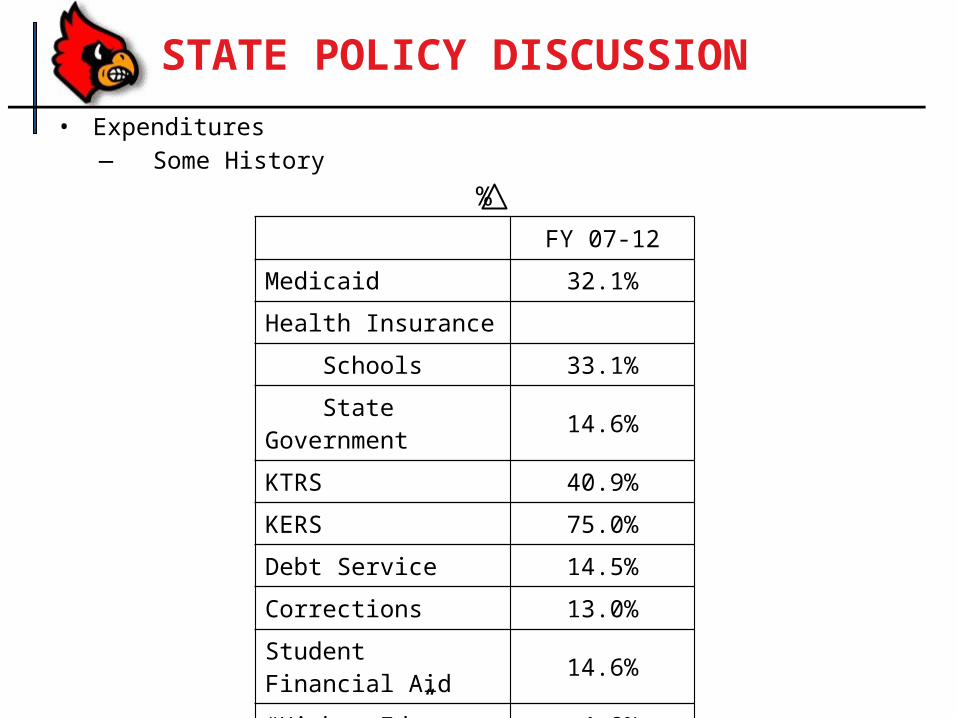
• Expenditures— Some History
%
— Structural Imbalance still exists • 2% cut FY12
STATE POLICY DISCUSSION
FY 07-12
Medicaid 32.1%
Health Insurance
Schools 33.1%
State Government 14.6%
KTRS 40.9%
KERS 75.0%
Debt Service 14.5%
Corrections 13.0%
Student Financial Aid 14.6%
“Higher Ed” -4.8%
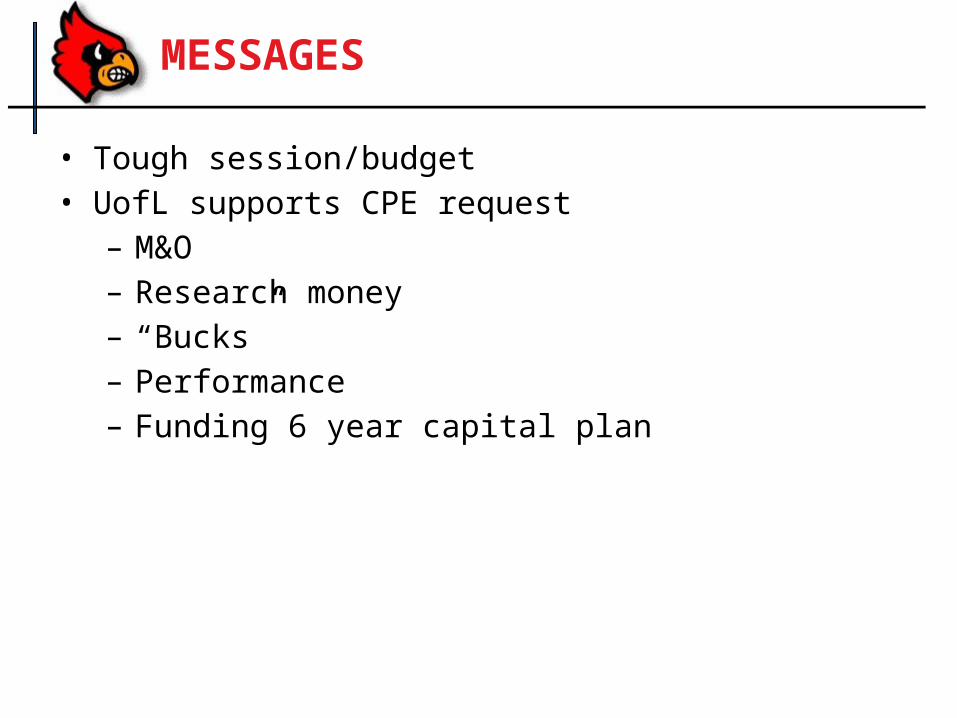
• Tough session/budget• UofL supports CPE request– M&O– Research money– “Bucks”– Performance– Funding 6 year capital plan
MESSAGES
UOFL
IT HAS BEEN TOUGH – REAL TOUGH
BUT MOVING FORWARD
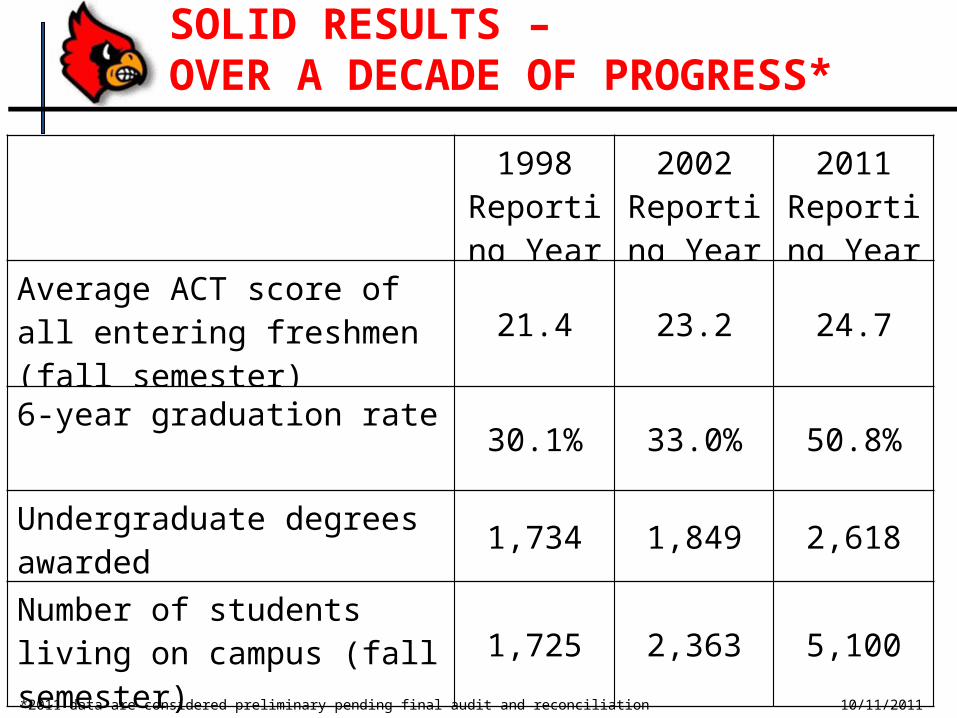
SOLID RESULTS – OVER A DECADE OF PROGRESS*
1998 Reporting Year
2002 Reporting Year
2011 Reporting Year
Average ACT score of all entering freshmen (fall semester)
21.4 23.2 24.7
6‐year graduation rate30.1% 33.0% 50.8%
Undergraduate degrees awarded 1,734 1,849 2,618
Number of students living on campus (fall semester) 1,725 2,363 5,100
*2011 data are considered preliminary pending final audit and reconciliation 10/11/2011
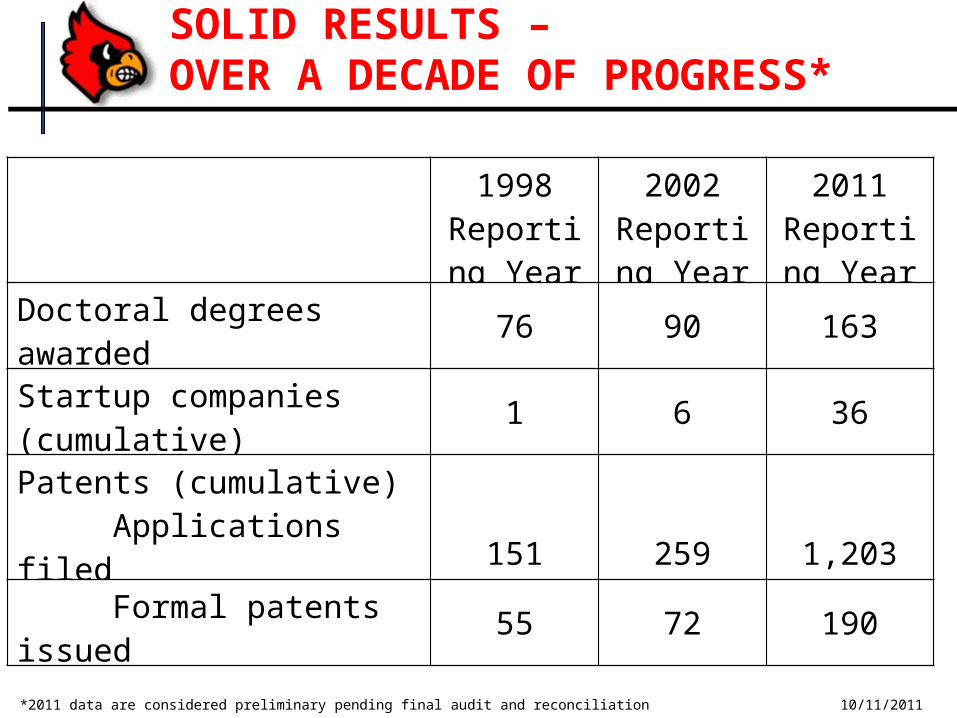
SOLID RESULTS – OVER A DECADE OF PROGRESS*
1998 Reporting Year
2002 Reporting Year
2011 Reporting Year
Doctoral degrees awarded 76 90 163
Startup companies (cumulative) 1 6 36
Patents (cumulative) Applications filed 151 259 1,203
Formal patents issued 55 72 190
*2011 data are considered preliminary pending final audit and reconciliation 10/11/2011
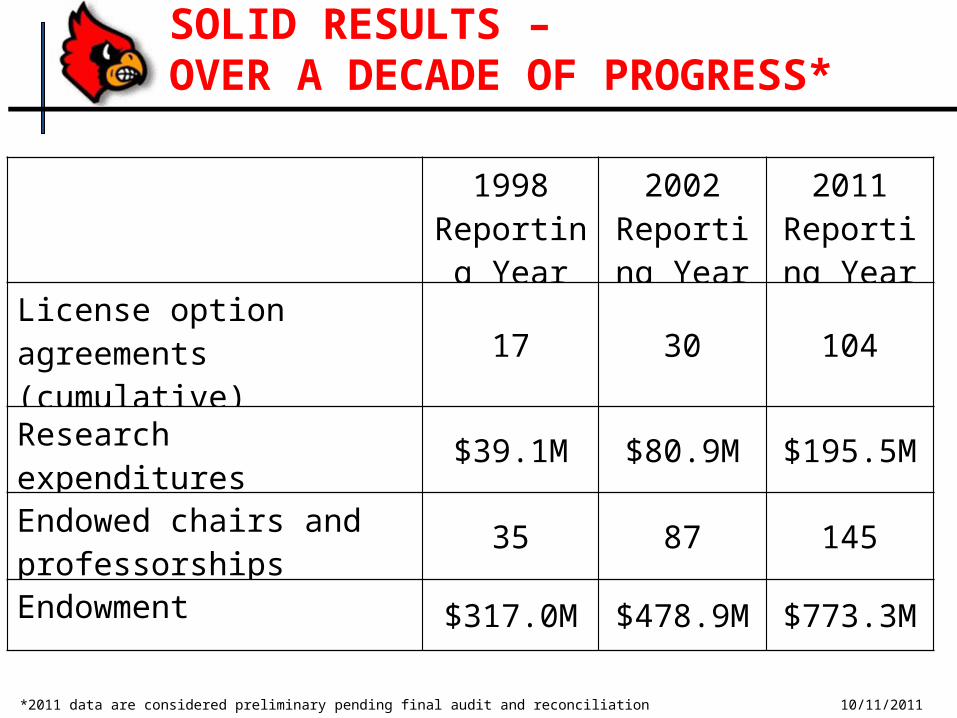
SOLID RESULTS – OVER A DECADE OF PROGRESS*
1998 Reporting
Year
2002 Reporting Year
2011 Reporting Year
License option agreements (cumulative)
17 30 104
Research expenditures $39.1M $80.9M $195.5M
Endowed chairs and professorships 35 87 145
Endowment $317.0M $478.9M $773.3M
*2011 data are considered preliminary pending final audit and reconciliation 10/11/2011
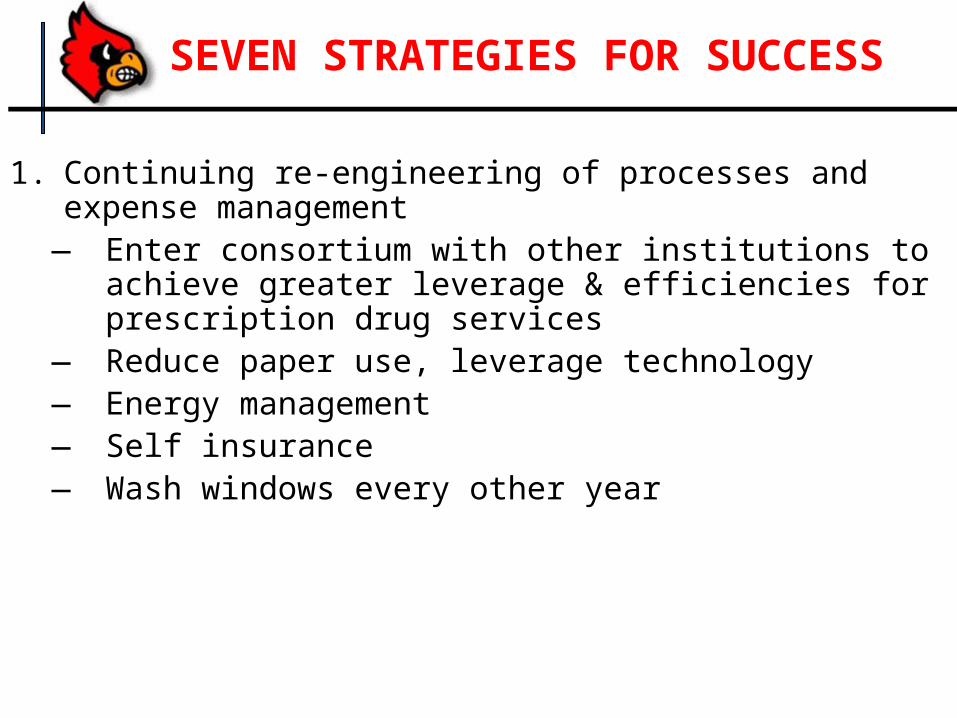
1. Continuing re-engineering of processes and expense management
— Enter consortium with other institutions to achieve greater leverage & efficiencies for prescription drug services
— Reduce paper use, leverage technology— Energy management— Self insurance— Wash windows every other year
SEVEN STRATEGIES FOR SUCCESS
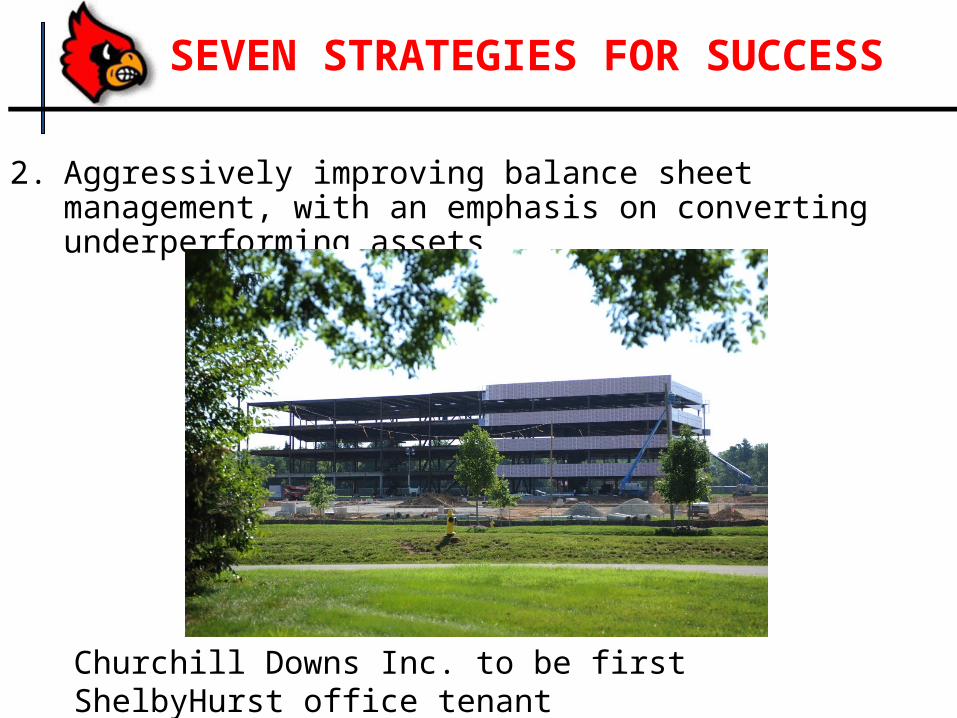
2. Aggressively improving balance sheet management, with an emphasis on converting underperforming assets
SEVEN STRATEGIES FOR SUCCESS
Churchill Downs Inc. to be first ShelbyHurst office tenant

3. Increasing clinical income to support education and research
i.e. The Merger
SEVEN STRATEGIES FOR SUCCESS
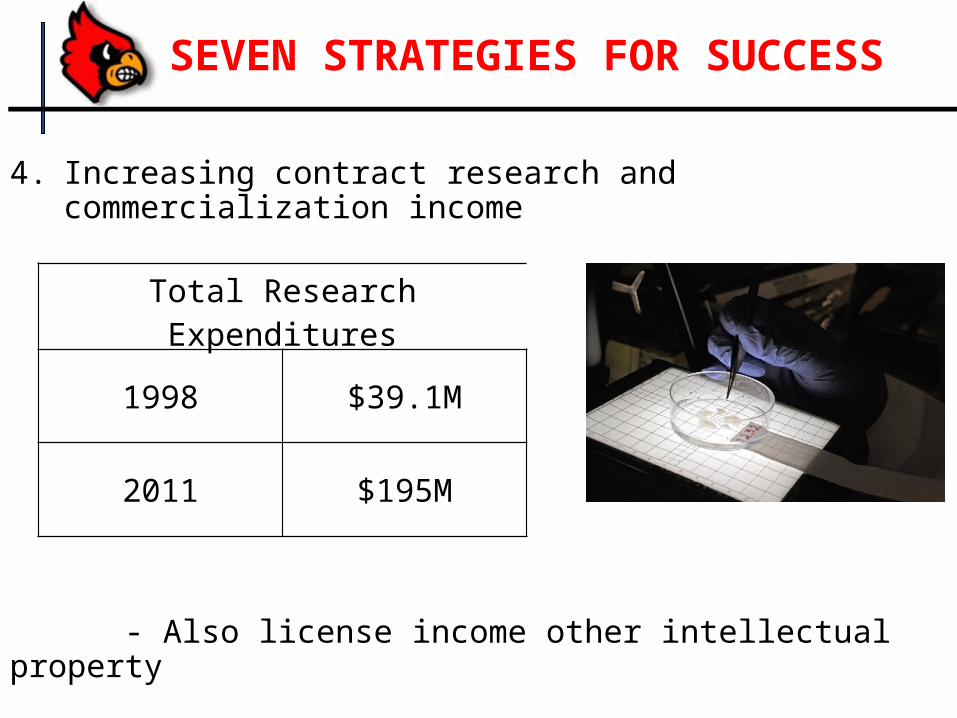
4. Increasing contract research and commercialization income
- Also license income other intellectual property
SEVEN STRATEGIES FOR SUCCESS
Total Research Expenditures
1998 $39.1M
2011 $195M
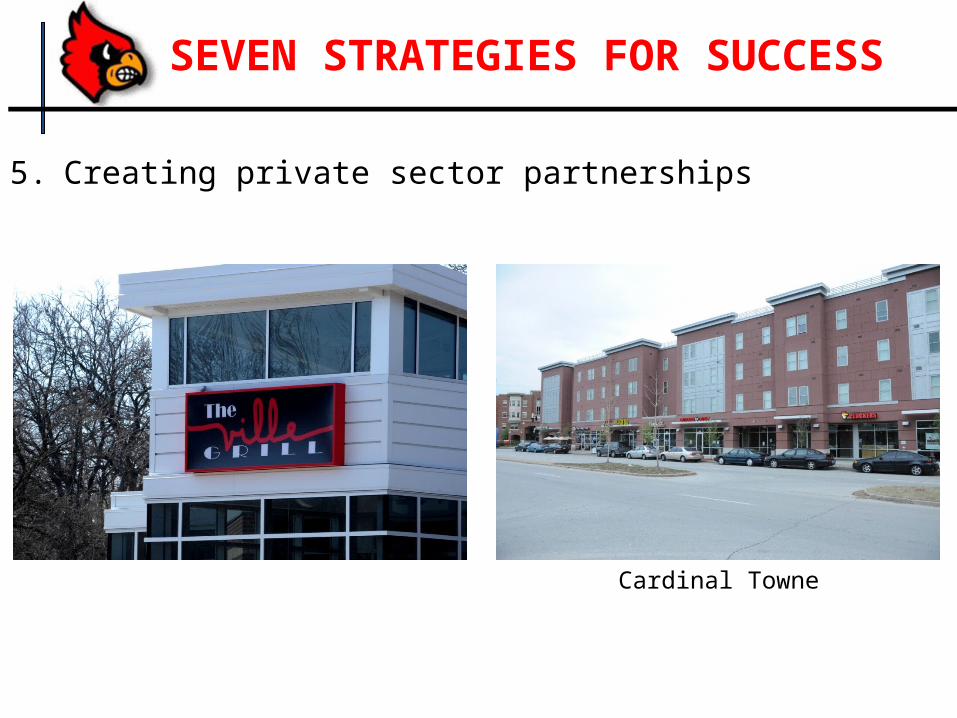
5. Creating private sector partnerships
SEVEN STRATEGIES FOR SUCCESS
Cardinal Towne
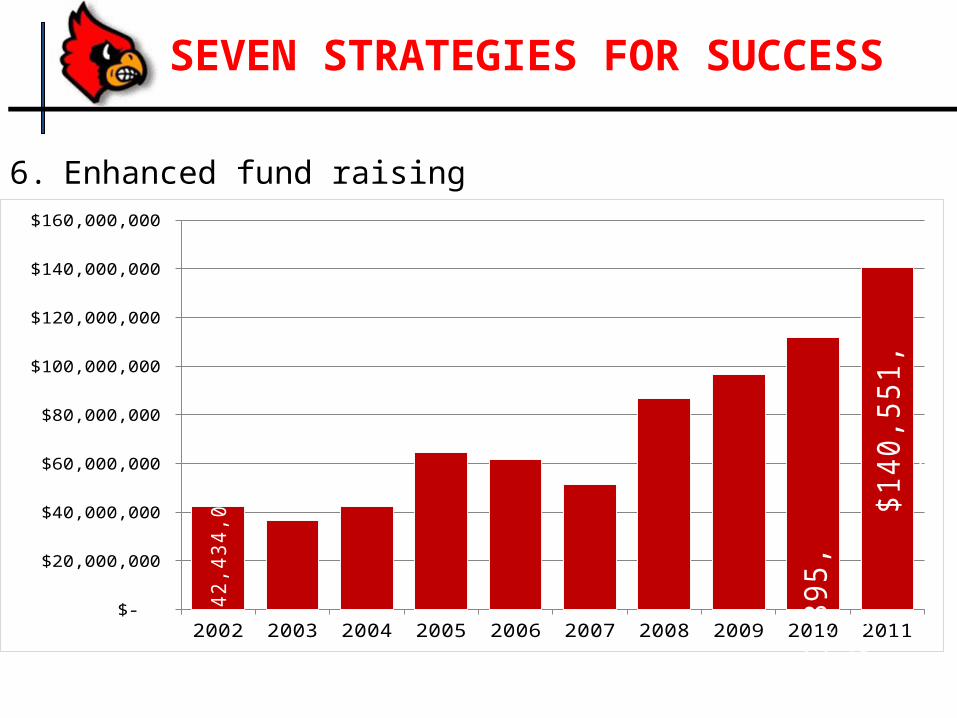
6. Enhanced fund raising
SEVEN STRATEGIES FOR SUCCESS
2002 2003 2004 2005 2006 2007 2008 2009 2010 2011 $-
$20,000,000
$40,000,000
$60,000,000
$80,000,000
$100,000,000
$120,000,000
$140,000,000
$160,000,000
$42
,434
,018
$1
11,8
95,9
88
$1
40,5
51,9
16
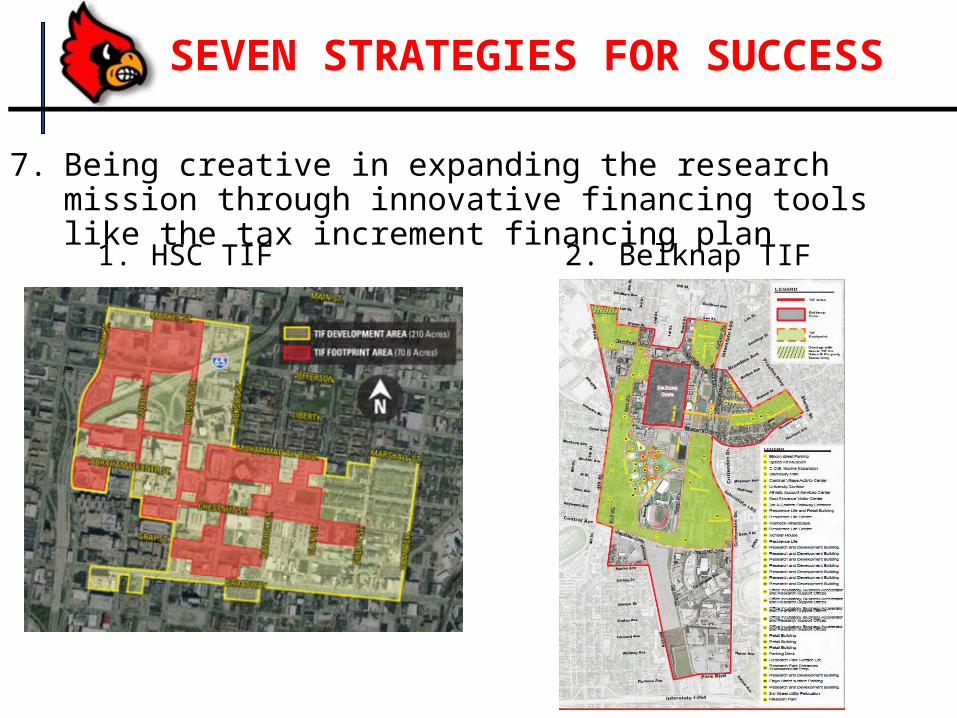
7. Being creative in expanding the research mission through innovative financing tools like the tax increment financing plan
SEVEN STRATEGIES FOR SUCCESS
1. HSC TIF 2. Belknap TIF
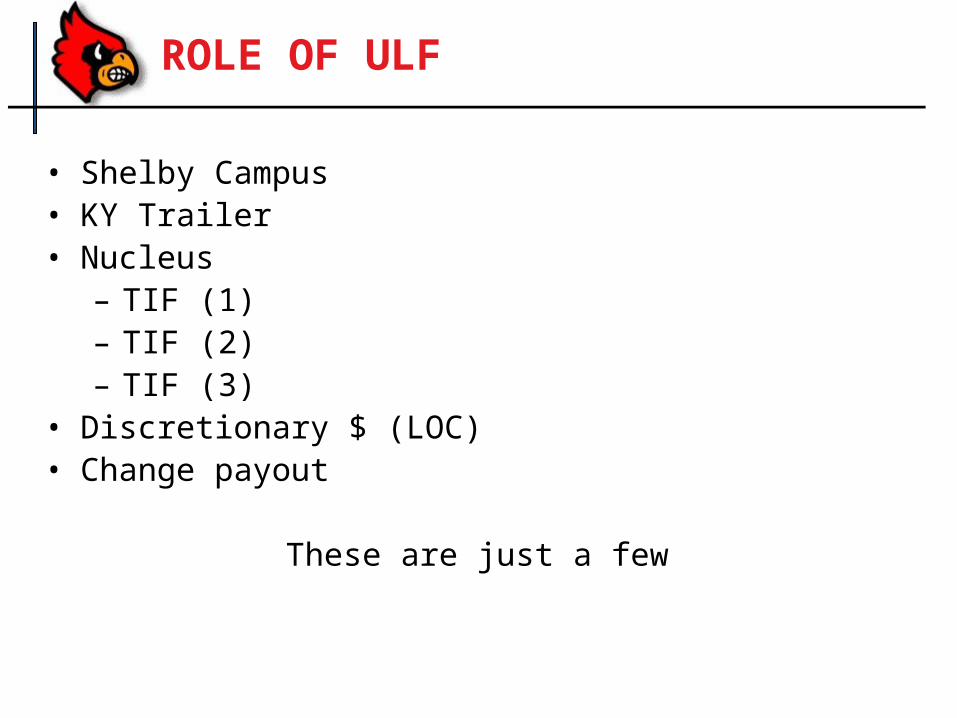
ROLE OF ULF
• Shelby Campus• KY Trailer• Nucleus– TIF (1)– TIF (2)– TIF (3)
• Discretionary $ (LOC)• Change payout
These are just a few
We have more to do!
Thank you!


