Uno strumentoitaliano per la valutazione
del rischio di fratturadel rischio di frattura
Francesca De GiorgioU.O. Medicina Interna
Ospedale S. JacopoASL3 Pistoia
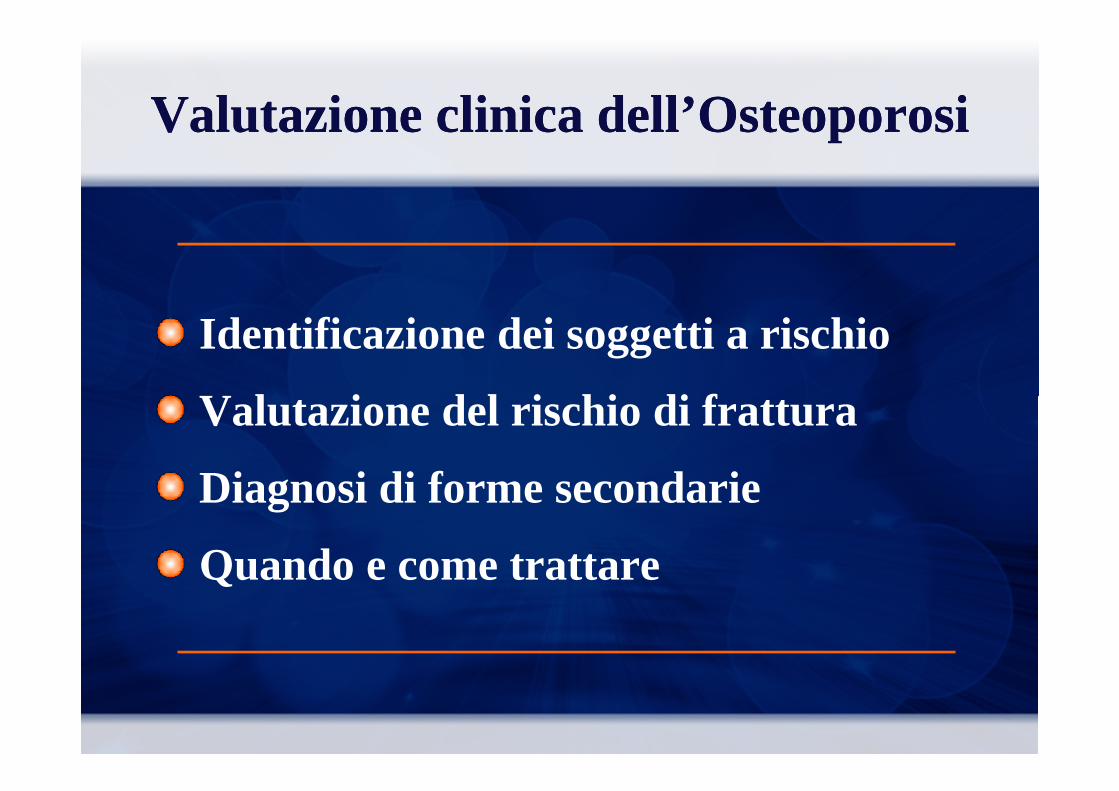
Valutazione clinica dell’OsteoporosiValutazione clinica dell’Osteoporosi
Identificazione dei soggetti a rischio
Valutazione del rischio di fratturaValutazione del rischio di frattura
Diagnosi di forme secondarie
Quando e come trattare

Valutazione del rischio di frattura
Identificare i pazienti a maggior rischioutilizzando strumenti in grado di fornire una stima del rischio
La gestione dell’OsteoporosiLa gestione dell’Osteoporosi
Avviare un trattamento di efficacia coerente con il rischio di frattura
Stili di vita
Farmaci
Migliorare la percezione del rischio da parte di medici e pazienti

Measurement site Fracture site (relative risk)
Wrist Hip Vertebrae
Relationship of bone mass and fractures as assessed by the relative risk of fracture of wrist, hip and vertebrae per 1 SD change in BMD
in different regions, adjusted for age
Relationship of bone mass and fractures as assessed by the relative risk of fracture of wrist, hip and vertebrae per 1 SD change in BMD
in different regions, adjusted for age
Forearm 1.8 1.6 1.6
Femoral neck 1.6 2.6 1.9
Lumbar spine 1.6 1.3 2.0
Eddy et al. Osteoporos Int, 1998
Yea
r fr
actu
re r
isk
(%)
15
20
- 3.5
T score
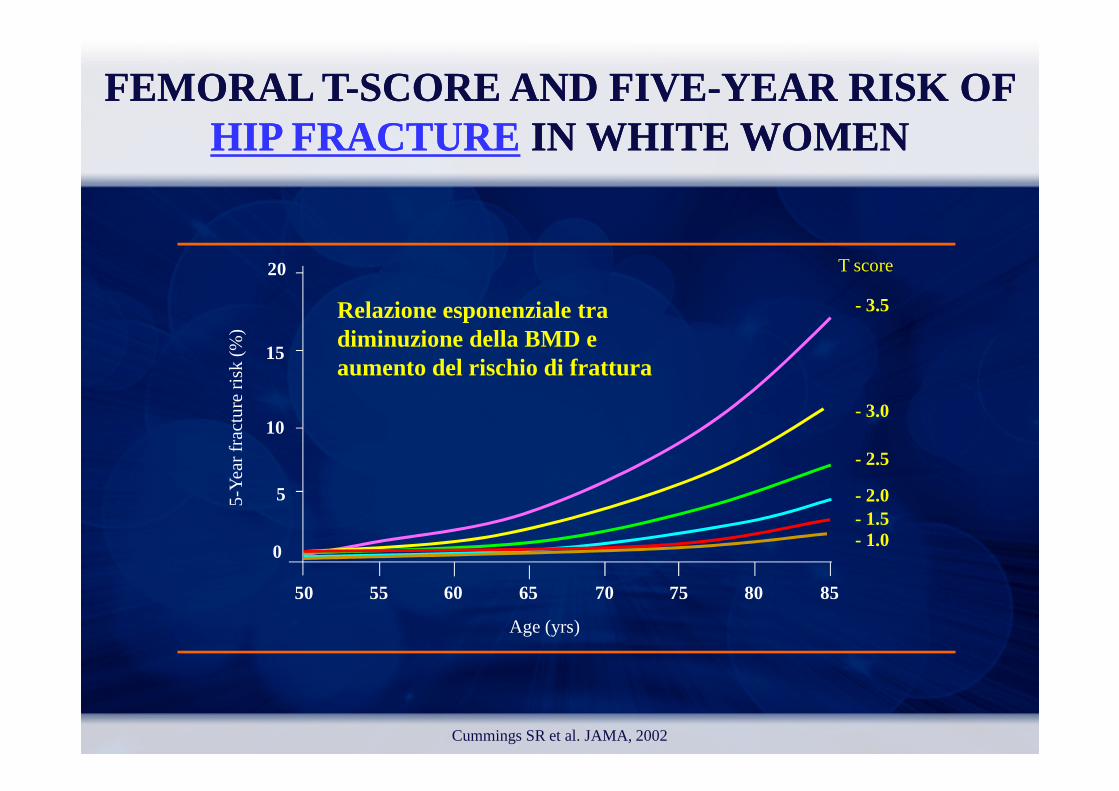
FEMORAL TFEMORAL T --SCORE AND FIVESCORE AND FIVE--YEAR RISK OF YEAR RISK OF HIP FRACTUREHIP FRACTURE IN WHITE WOMEN IN WHITE WOMEN
Relazione esponenziale tra diminuzione della BMD e aumento del rischio di frattura
Cummings SR et al. JAMA, 2002
5-Y
ear
frac
ture
ris
k (%
)
55 60 65 70 75 80 8550
0
5
10
Age (yrs)
- 1.0- 1.5- 2.0
- 2.5
- 3.0

Relazione esponenziale tra diminuzione della BMD e aumento del rischio di frattura
60
Inci
den
za d
i fra
ttu
re (
per
10
00
paz
ien
te-a
nn
i)
50
40
ColonnaRadio
Rischio di Rischio di frattura vertebrale, radialefrattura vertebrale, radiale e e BMDBMD
aumento del rischio di frattura
Miller PD et al. Calcif Tissue Int, 1996
Inci
den
za d
i fra
ttu
re (
per
10
00
paz
ien
te
Densità Minerale Ossea
30
20
10
02 SD 1 SD Mean -1 SD -2 SD
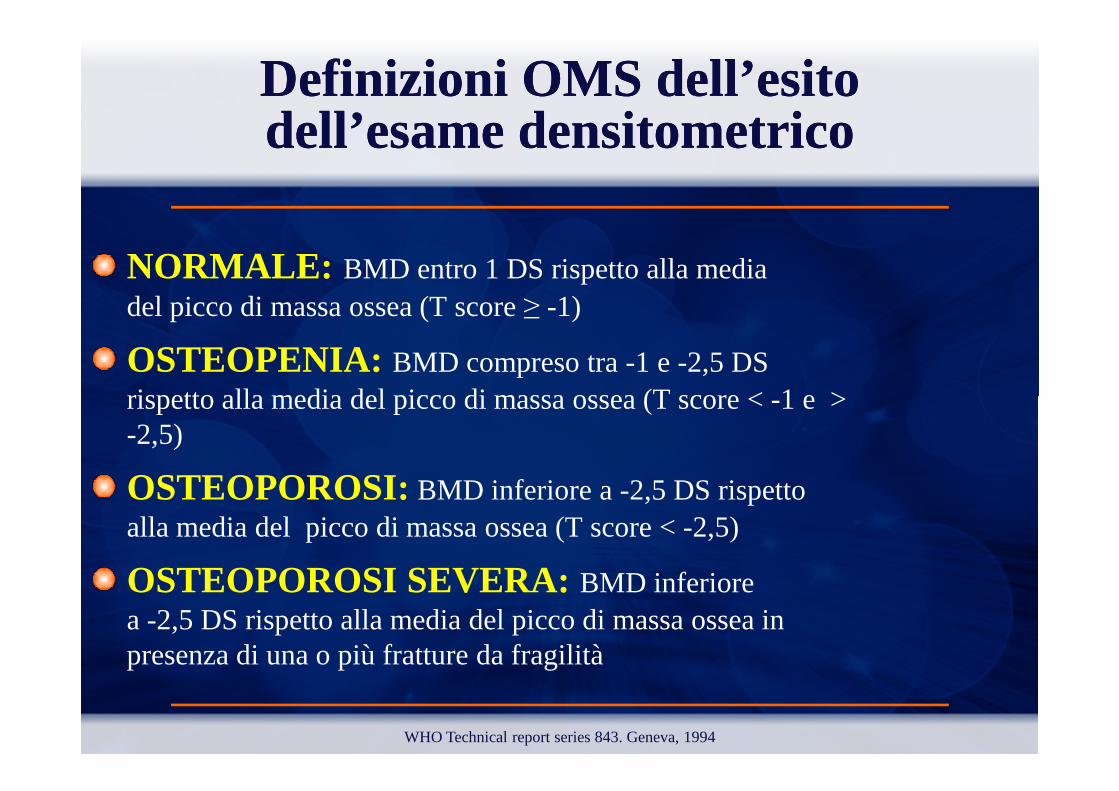
Definizioni OMS dell’esito Definizioni OMS dell’esito dell’esame densitometricodell’esame densitometrico
NORMALE: BMD entro 1 DS rispetto alla media del picco di massa ossea (T score ≥ -1)
OSTEOPENIA: BMD compreso tra -1 e -2,5 DS rispetto alla media del picco di massa ossea (T score < -1 e > rispetto alla media del picco di massa ossea (T score < -1 e > -2,5)
OSTEOPOROSI: BMD inferiore a -2,5 DS rispetto alla media del picco di massa ossea (T score < -2,5)
OSTEOPOROSI SEVERA: BMD inferiore a -2,5 DS rispetto alla media del picco di massa ossea in presenza di una o più fratture da fragilità
WHO Technical report series 843. Geneva, 1994
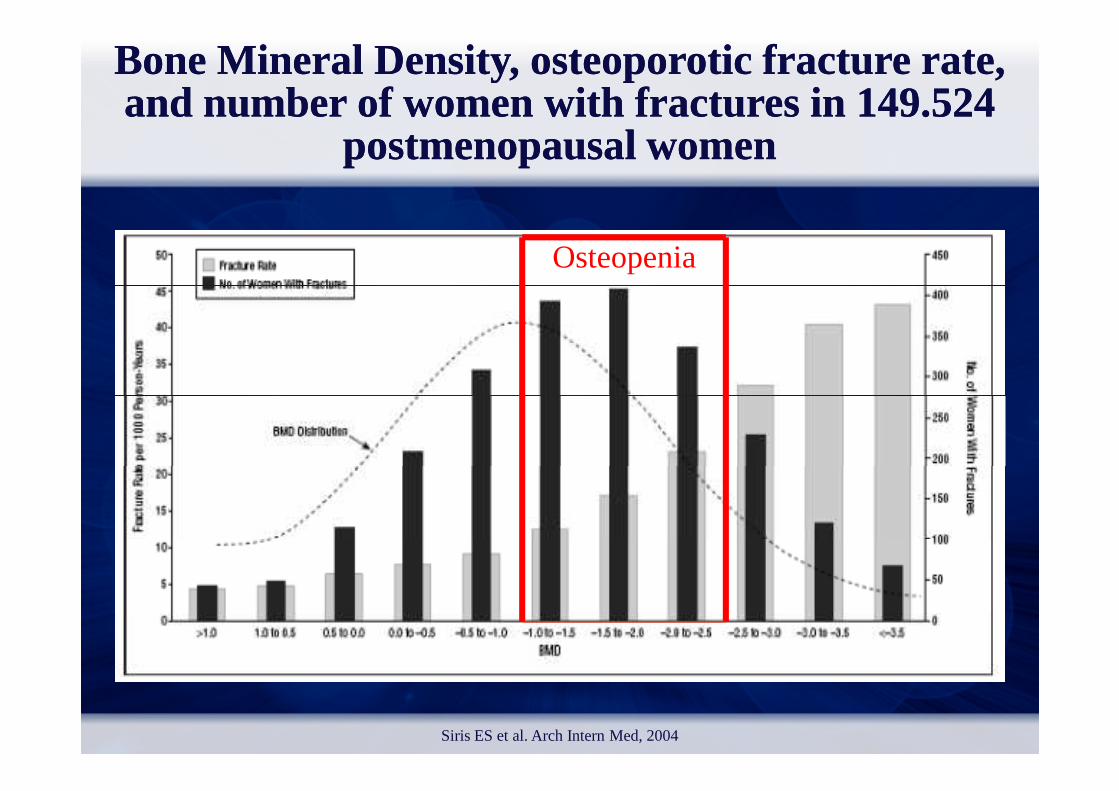
Osteopenia
Bone Bone MineralMineral DensityDensity, , osteoporoticosteoporoticfracturefracture rate, rate, and and numbernumber of of womenwomenwith with fracturesfractures in 149.524 in 149.524
postmenopausalpostmenopausal womenwomen
Siris ES et al. Arch Intern Med, 2004
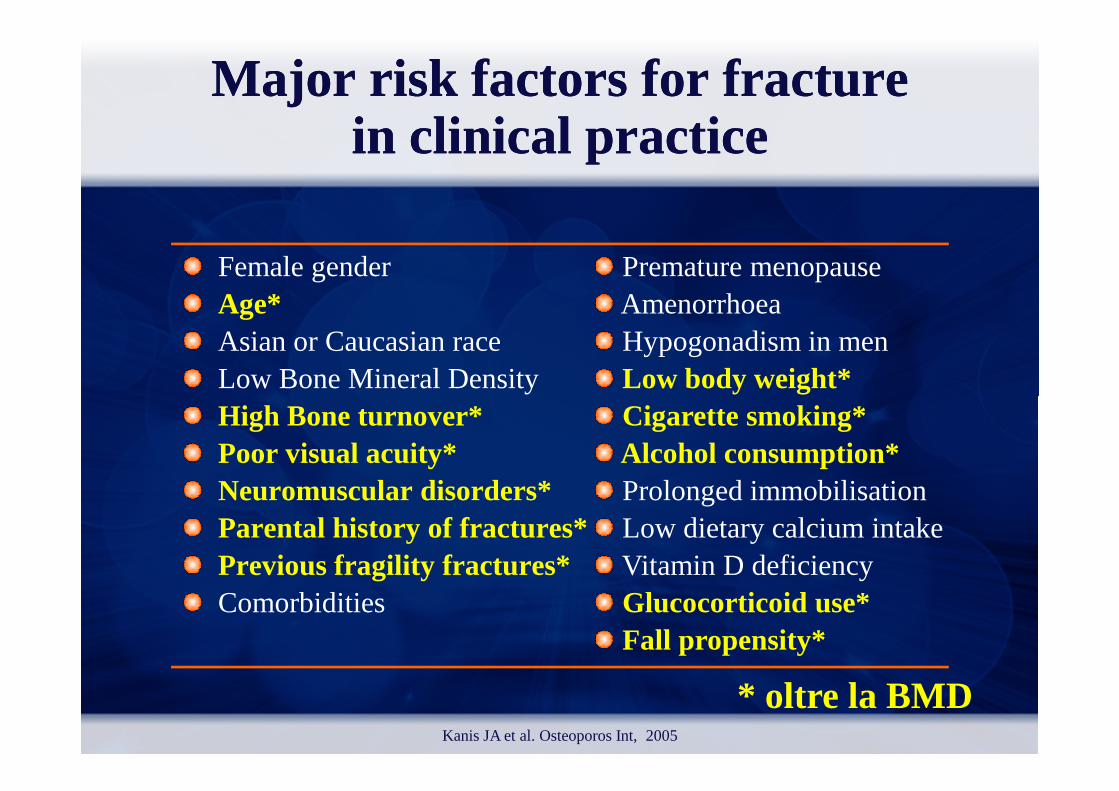
Major Major riskrisk factorsfactors for for fracturefracturein in clinicalclinical practicepractice
Female genderAge*Asian or Caucasian raceLow Bone Mineral Density
Premature menopauseAmenorrhoeaHypogonadism in menLow body weight*
High Bone turnover*Poor visual acuity*Neuromuscular disorders*Parental history of fractures*Previous fragility fractures*Comorbidities
Cigarette smoking*Alcohol consumption*Prolonged immobilisationLow dietary calcium intakeVitamin D deficiencyGlucocorticoid use*Fall propensity*
* oltre la BMDKanis JA et al. Osteoporos Int, 2005
World Health Organization
Collaborating Centre for Metabolic Bone Diseases, University of Sheffield, UK
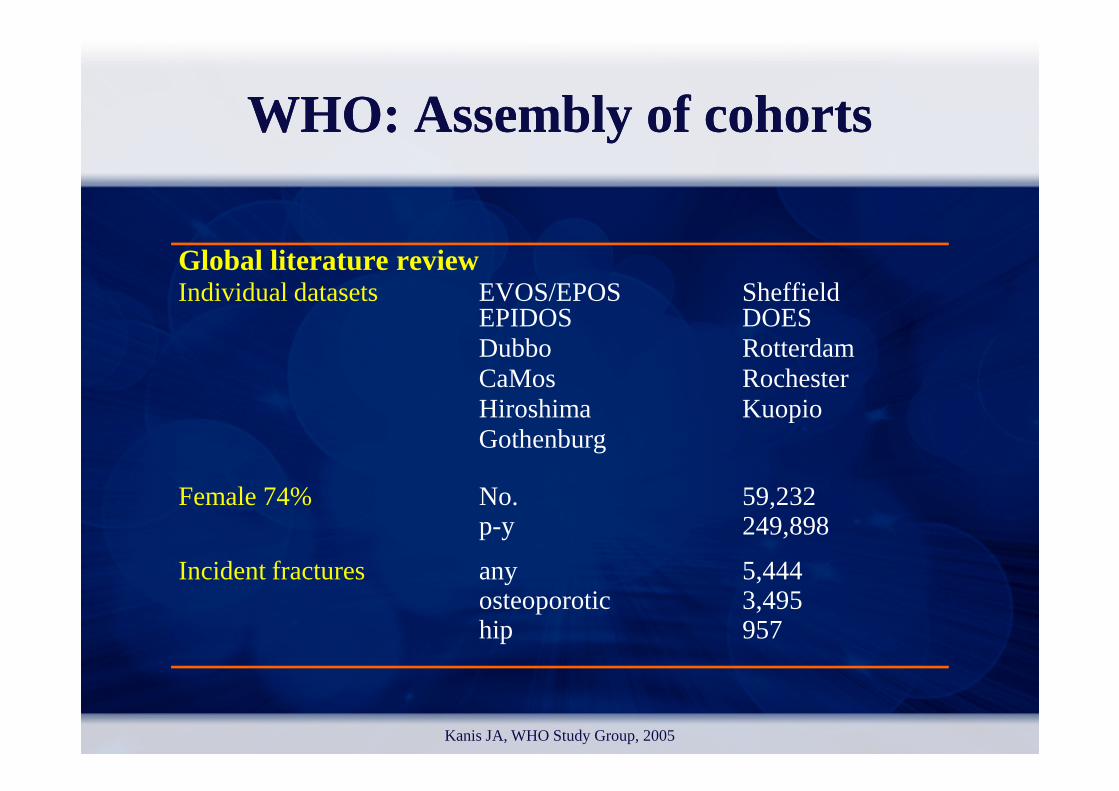
WHO: Assembly of cohortsWHO: Assembly of cohorts
Global literature reviewIndividual datasets EVOS/EPOS Sheffield
EPIDOS DOES Dubbo RotterdamCaMos Rochester Hiroshima KuopioHiroshima KuopioGothenburg
Incident fractures any 5,444osteoporotic 3,495hip 957
Kanis JA, WHO Study Group, 2005
Female 74% No. 59,232p-y 249,898
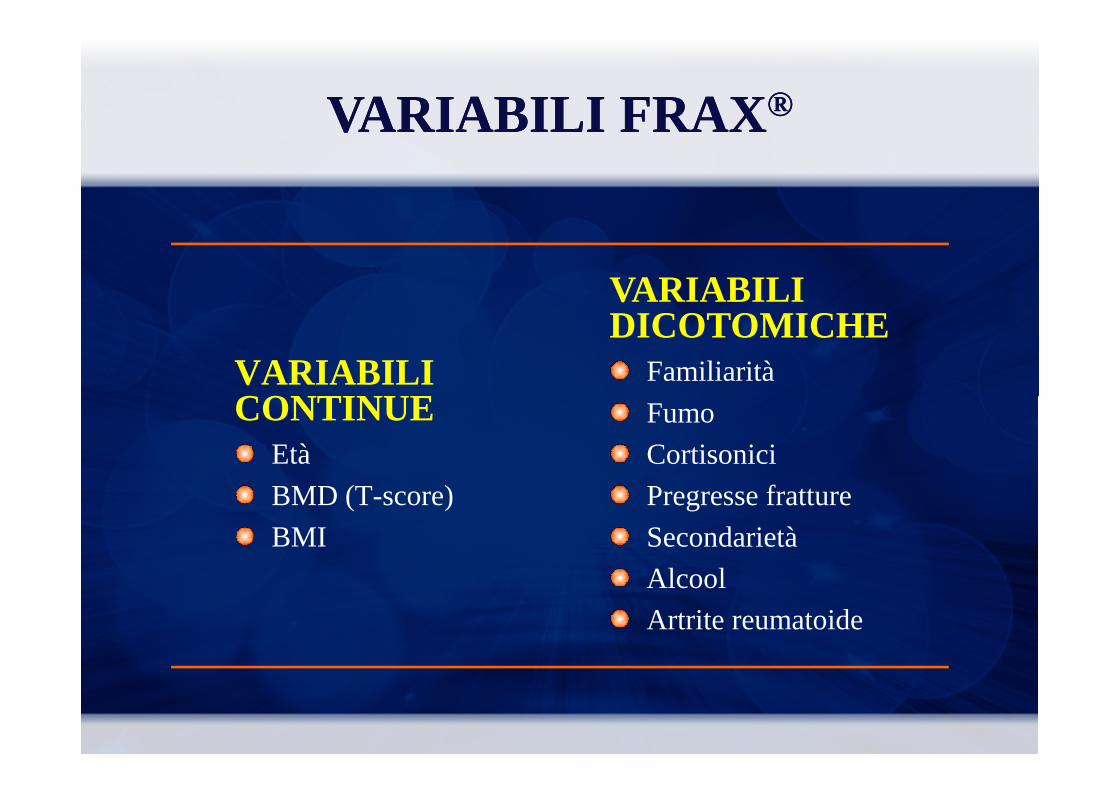
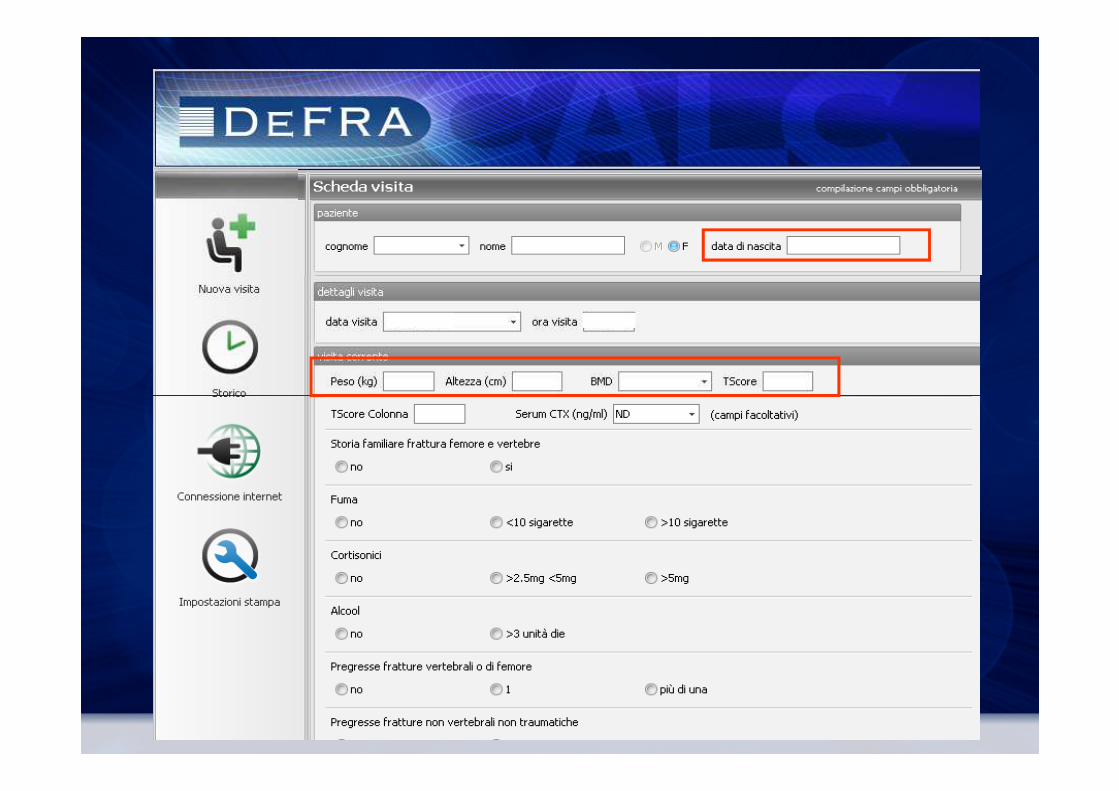
VARIABILI CONTINUE
VARIABILI DICOTOMICHE
Familiarità
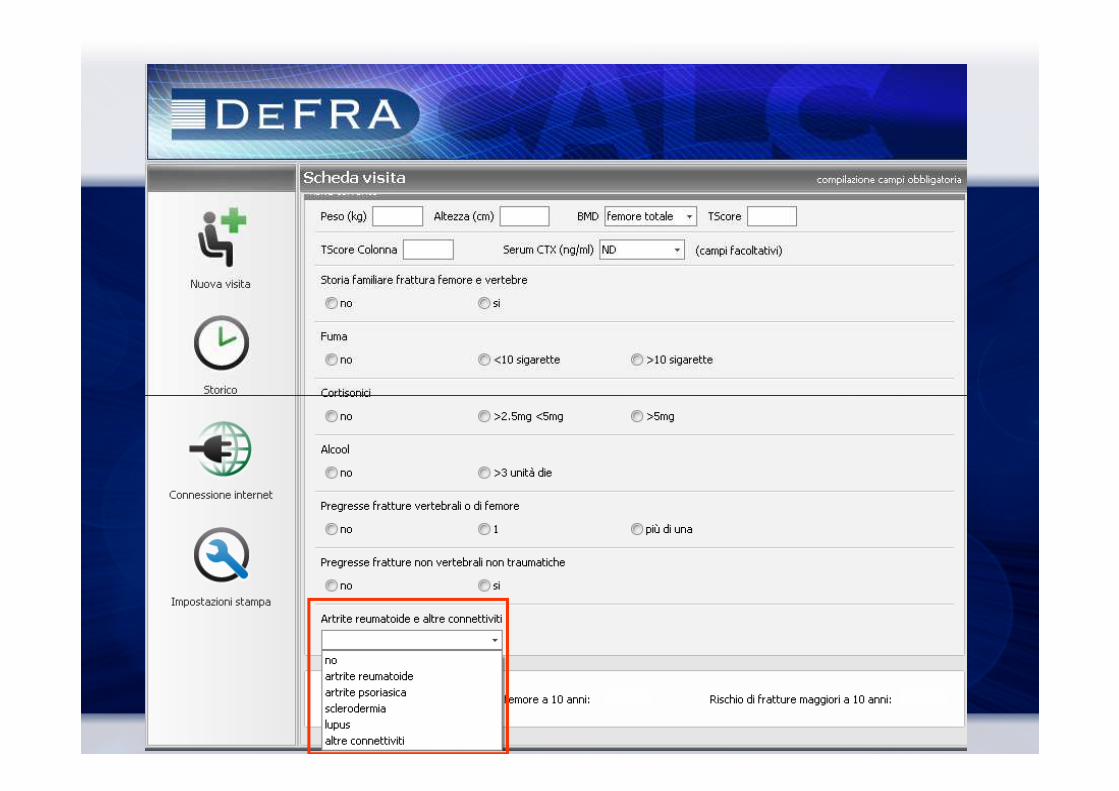
VARIABILI VARIABILI FRAXFRAX®®
CONTINUEEtà
BMD (T-score)
BMI
Fumo
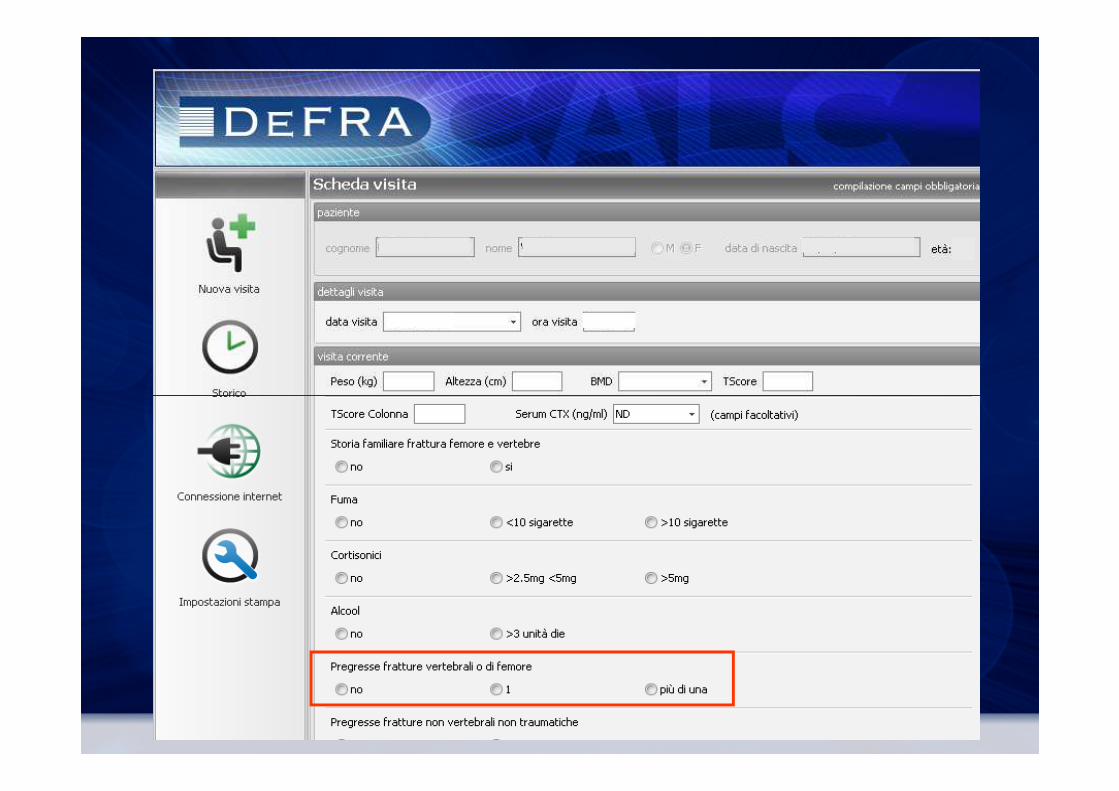
Cortisonici
Pregresse fratture
Secondarietà
Alcool
Artrite reumatoide
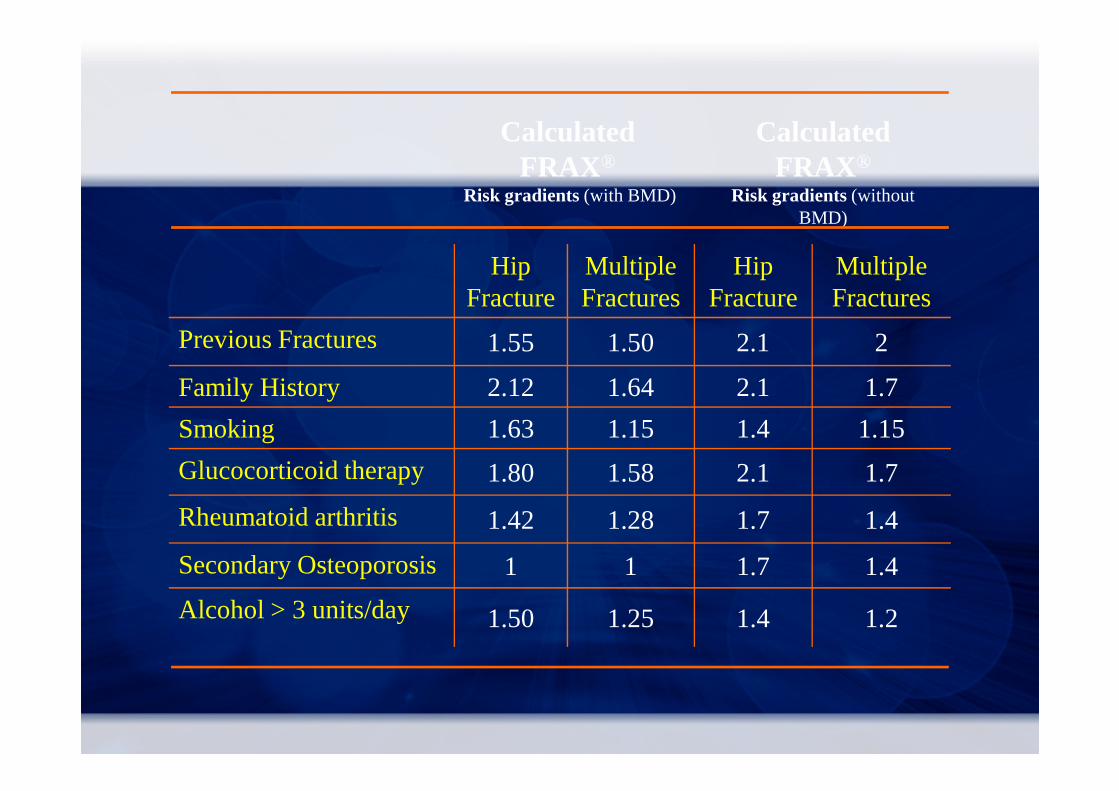
Hip Fracture
MultipleFractures
Hip Fracture
Multiple Fractures
Previous Fractures 1.55 1.50 2.1 2
Family History 2.12 1.64 2.1 1.7
Calculated FRAX®
Risk gradients (with BMD)
Calculated FRAX®
Risk gradients (without BMD)
Family History 2.12 1.64 2.1 1.7
Smoking 1.63 1.15 1.4 1.15
Glucocorticoid therapy 1.80 1.58 2.1 1.7
Rheumatoid arthritis 1.42 1.28 1.7 1.4
Secondary Osteoporosis 1 1 1.7 1.4
Alcohol > 3 units/day 1.50 1.25 1.4 1.2
1
1,5
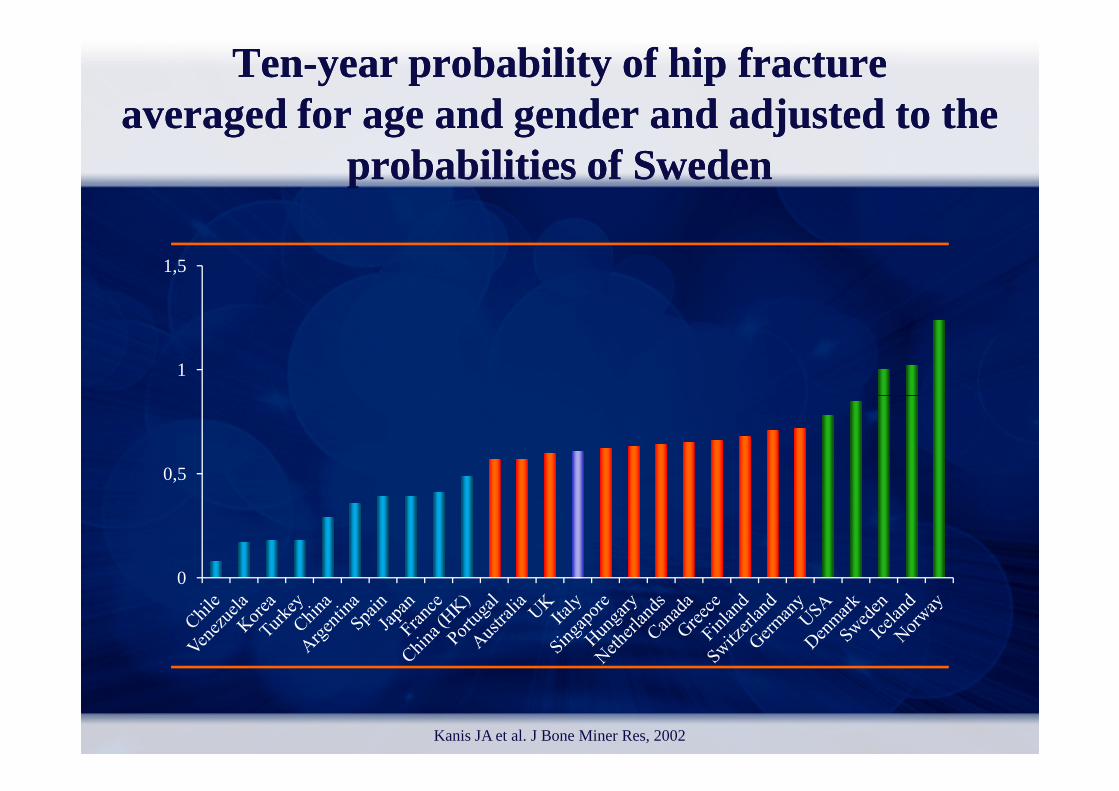
TenTen--yearyear probabilityprobability of hip of hip fracturefractureaveragedaveragedfor for ageage and gender and and gender and adjustedadjusted to the to the
probabilitiesprobabilities of of SwedenSweden
0
0,5
Kanis JA et al. J Bone Miner Res, 2002
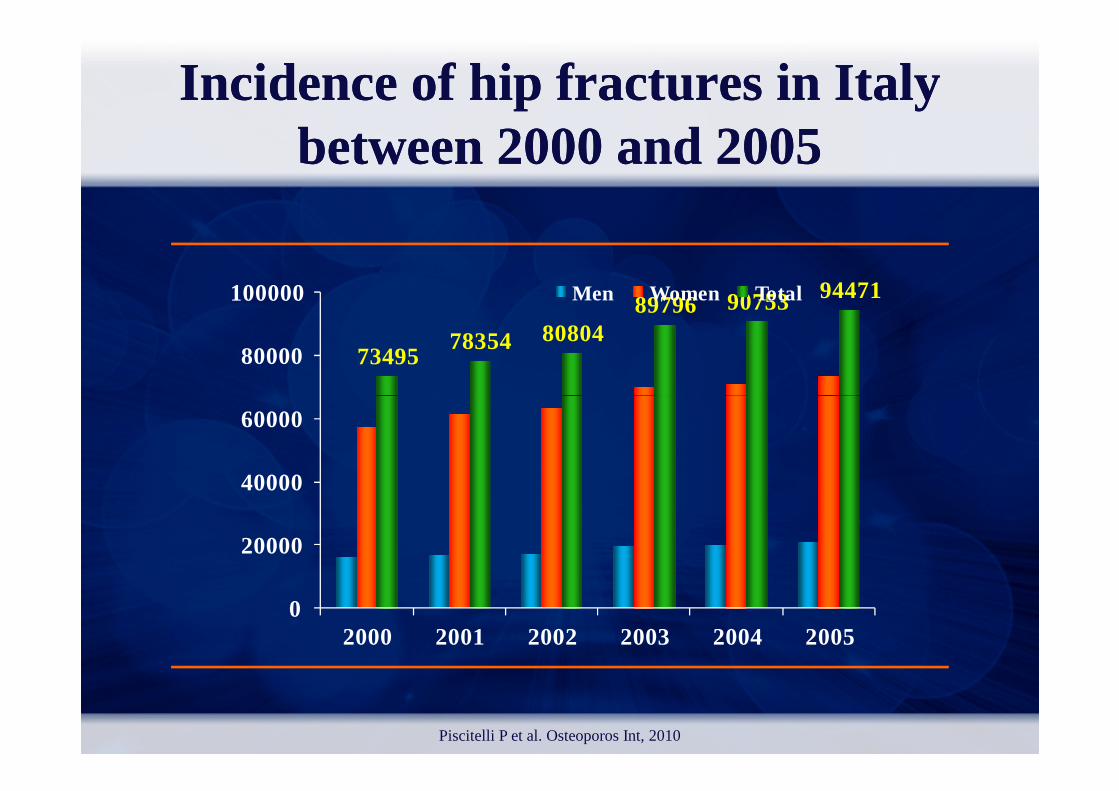
7349578354 80804
89796 90753 94471
80000
100000 Men Women Total
IncidenceIncidenceof hip of hip fracturesfractures in in ItalyItalybetweenbetween2000 and 20052000 and 2005
0
20000
40000
60000
2000 2001 2002 2003 2004 2005
Piscitelli P et al. Osteoporos Int, 2010
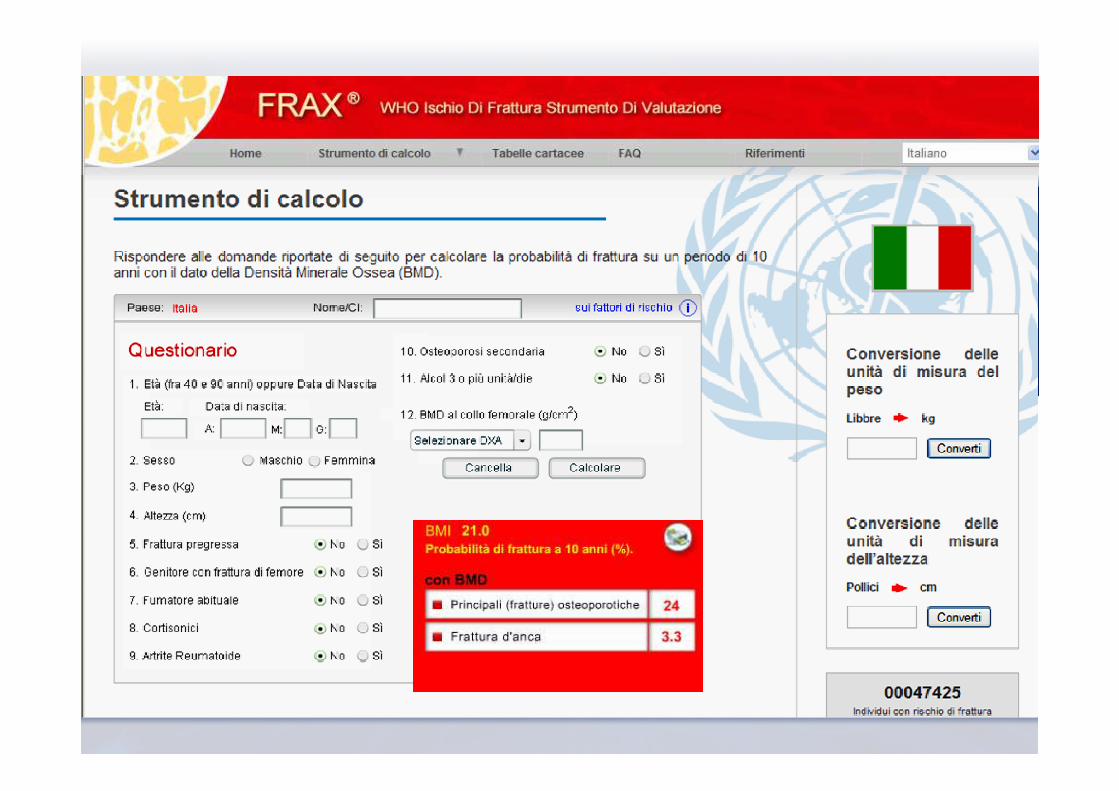
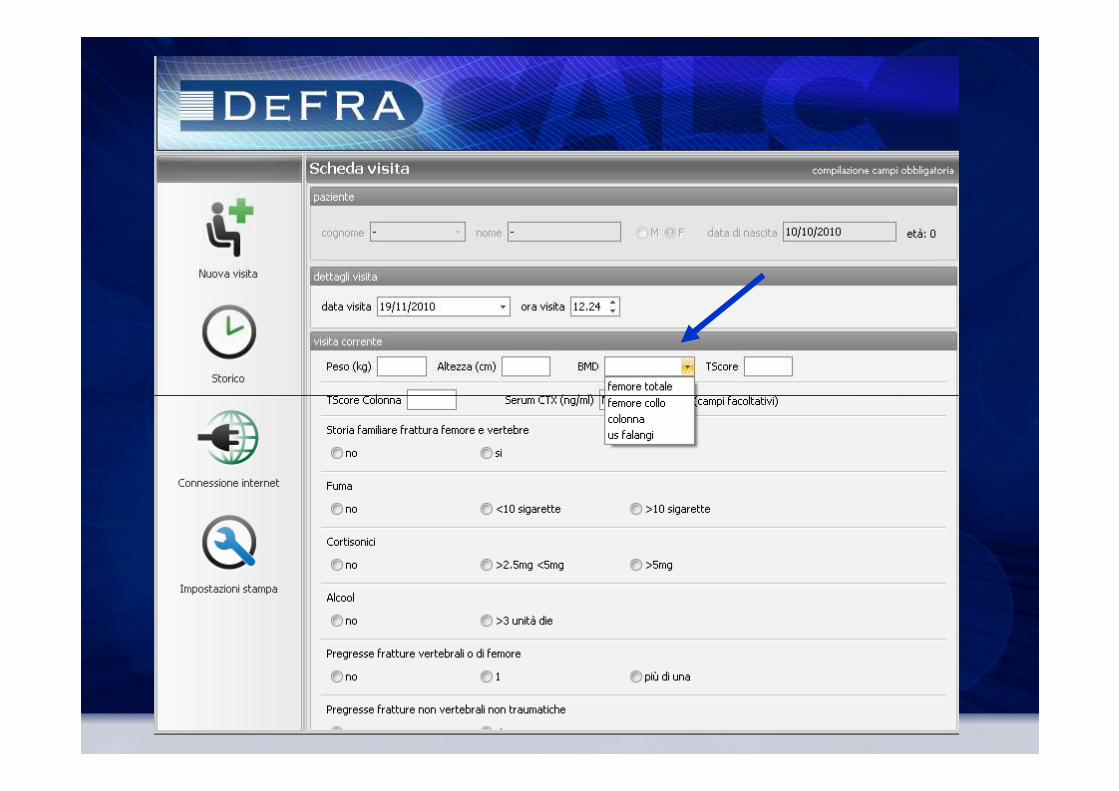
FRAXFRAX
assumere come affidabile il FRAX con le variabili FRAX con le variabili
continue (età, BMD, BMI)
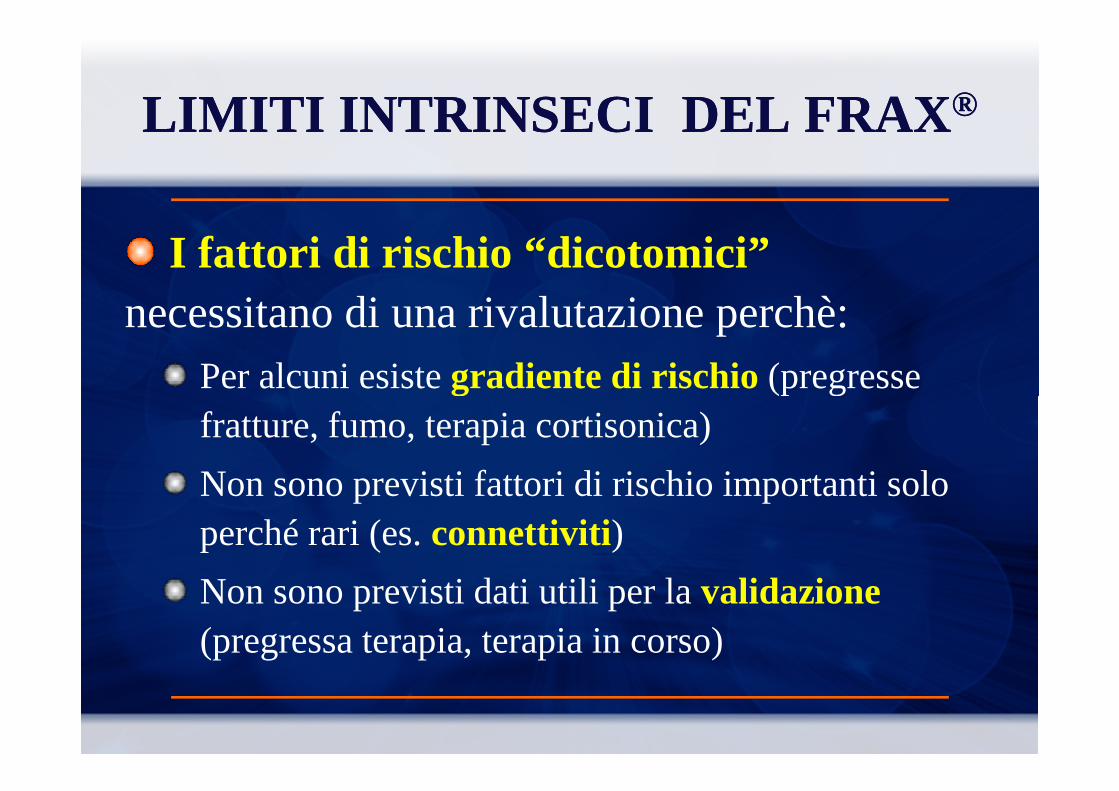
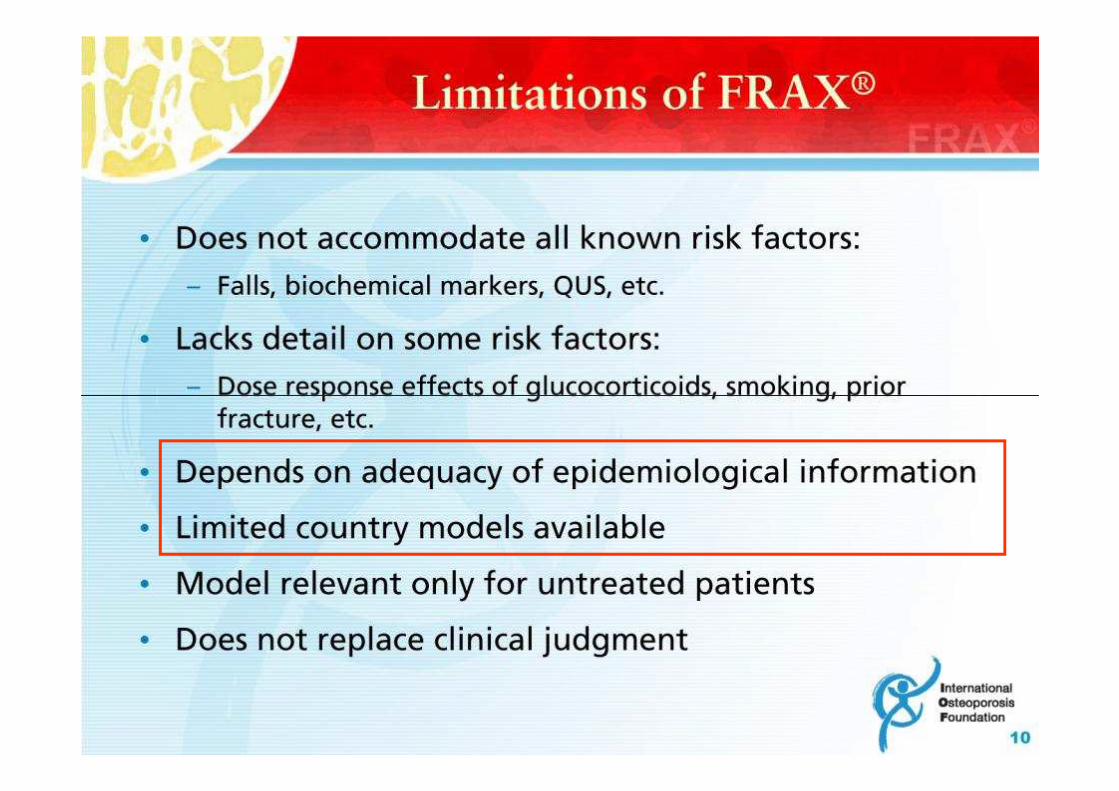
LIMITI INTRINSECI DEL FRAX ®LIMITI INTRINSECI DEL FRAX ®
I fattori di rischio “dicotomici”necessitano di una rivalutazione perchè:
Per alcuni esiste gradiente di rischio (pregresse Per alcuni esiste gradiente di rischio (pregresse fratture, fumo, terapia cortisonica)
Non sono previsti fattori di rischio importanti solo perché rari (es. connettiviti )
Non sono previsti dati utili per la validazione(pregressa terapia, terapia in corso)
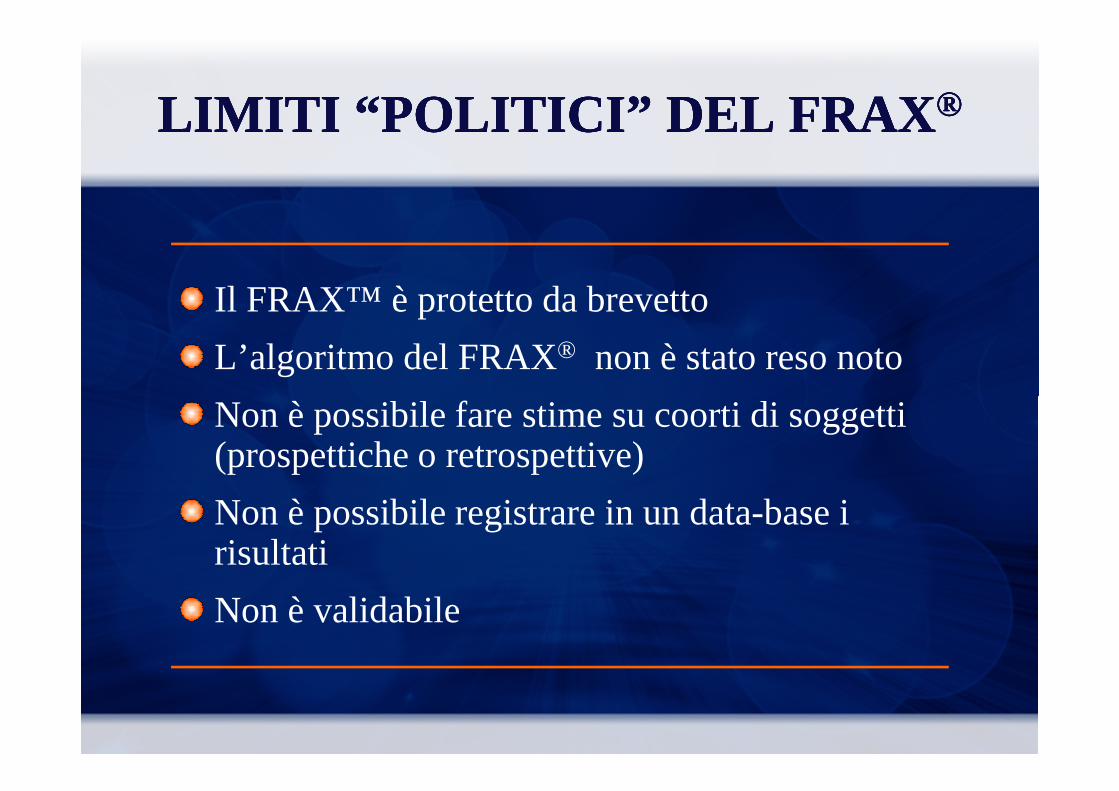
Il FRAX™ è protetto da brevetto
L’algoritmo del FRAX® non è stato reso noto
Non è possibile fare stime su coorti di soggetti
LIMITI “POLITICI” DEL FRAXLIMITI “POLITICI” DEL FRAX ®®LIMITI “POLITICI” DEL FRAXLIMITI “POLITICI” DEL FRAX ®®
Non è possibile fare stime su coorti di soggetti (prospettiche o retrospettive)
Non è possibile registrare in un data-base i risultati
Non è validabile


VARIABILI VARIABILI FRAXFRAX®®
VARIABILI VARIABILI CONTINUECONTINUE
VARIABILI DICOTOMICHE
FamiliaritàFumoCONTINUECONTINUE
EtàEtàBMD (TBMD (T--score)score)BMIBMI
FumoCortisoniciPregresse frattureSecondarietàAlcoolArtrite reumatoide
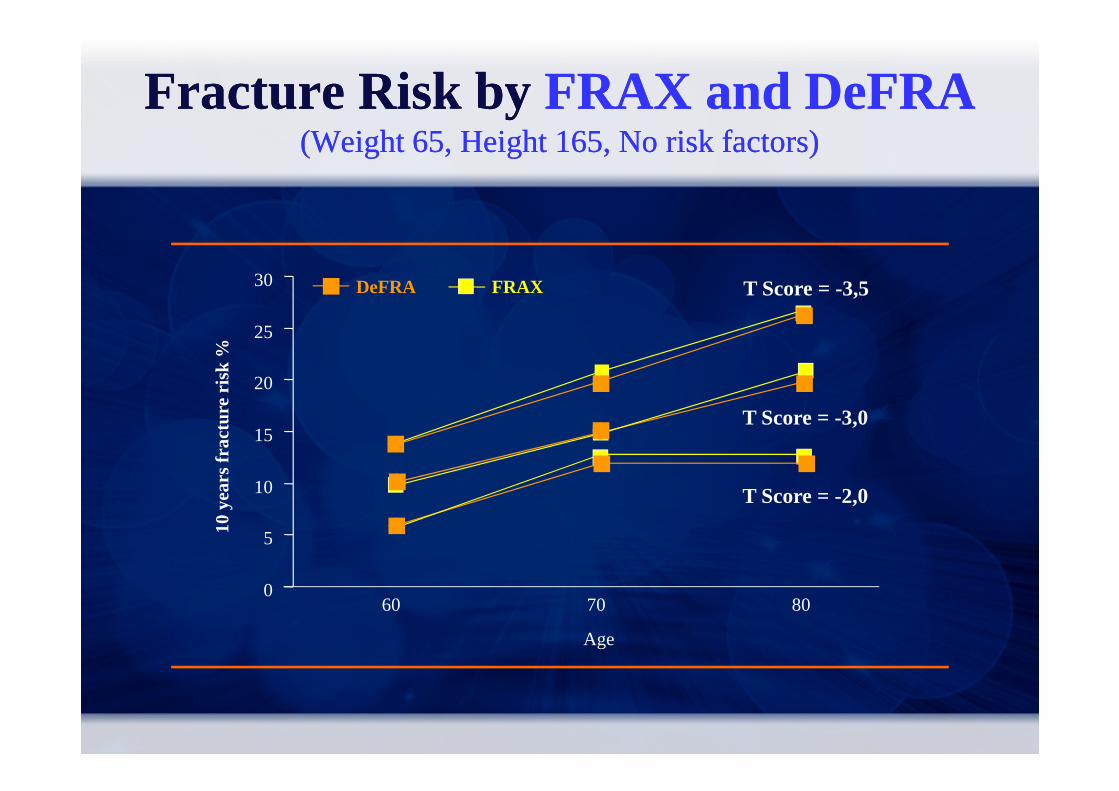
Fracture Risk by FRAX and DeFRA(Weight 65, Height 165, No risk factors)
Fracture Risk by FRAX and DeFRA(Weight 65, Height 165, No risk factors)
T Score = -3,5
20
25
30
10 y
ears
frac
ture
ris
k %
DeFRA FRAX
0
5
10
15
60 70 80
Age
10 y
ears
frac
ture
ris
k %
T Score = -3,0
T Score = -2,0
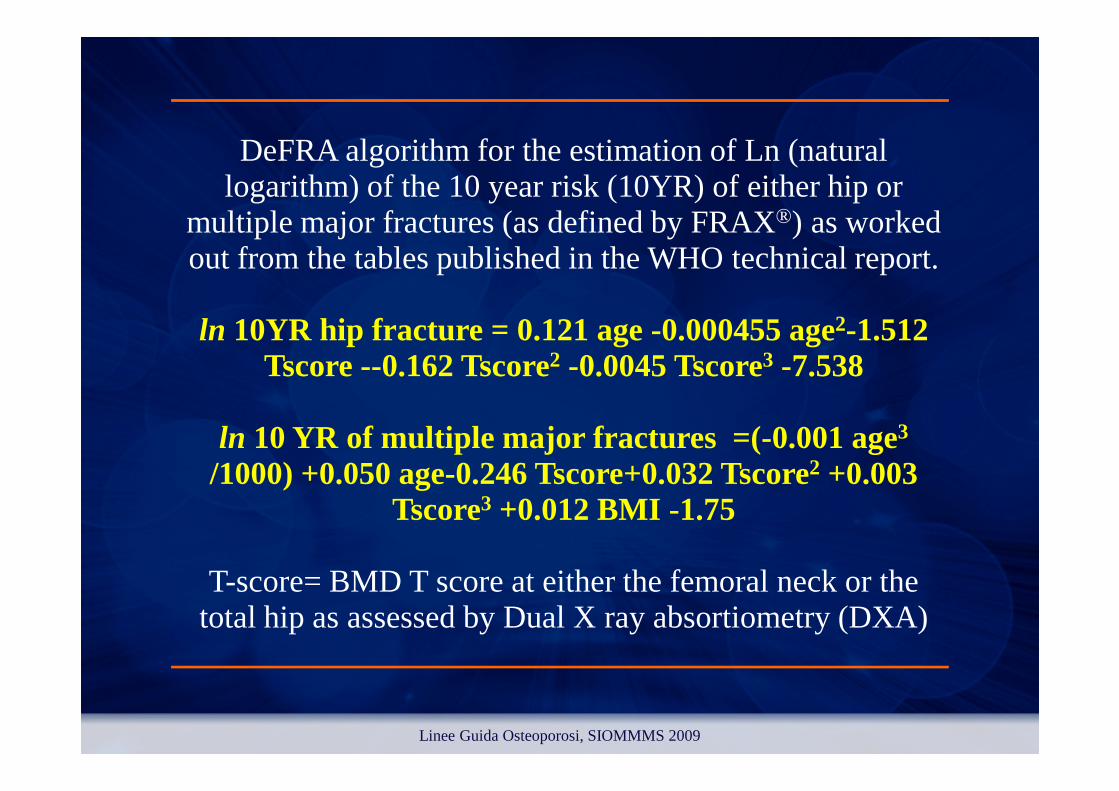
DeFRA algorithm for the estimation of Ln (natural logarithm) of the 10 year risk (10YR) of either hip or
multiple major fractures (as defined by FRAX®) as worked out from the tables published in the WHO technical report.
ln 10YR hip fracture = 0.121 age -0.000455 age2-1.512 Tscore --0.162 Tscore2 -0.0045 Tscore3 -7.538
ln 10 YR of multiple major fractures =(-0.001 age3/1000) +0.050 age-0.246 Tscore+0.032 Tscore2 +0.003
Tscore3 +0.012 BMI -1.75
T-score= BMD T score at either the femoral neck or the total hip as assessed by Dual X ray absortiometry (DXA)
Linee Guida Osteoporosi, SIOMMMS 2009
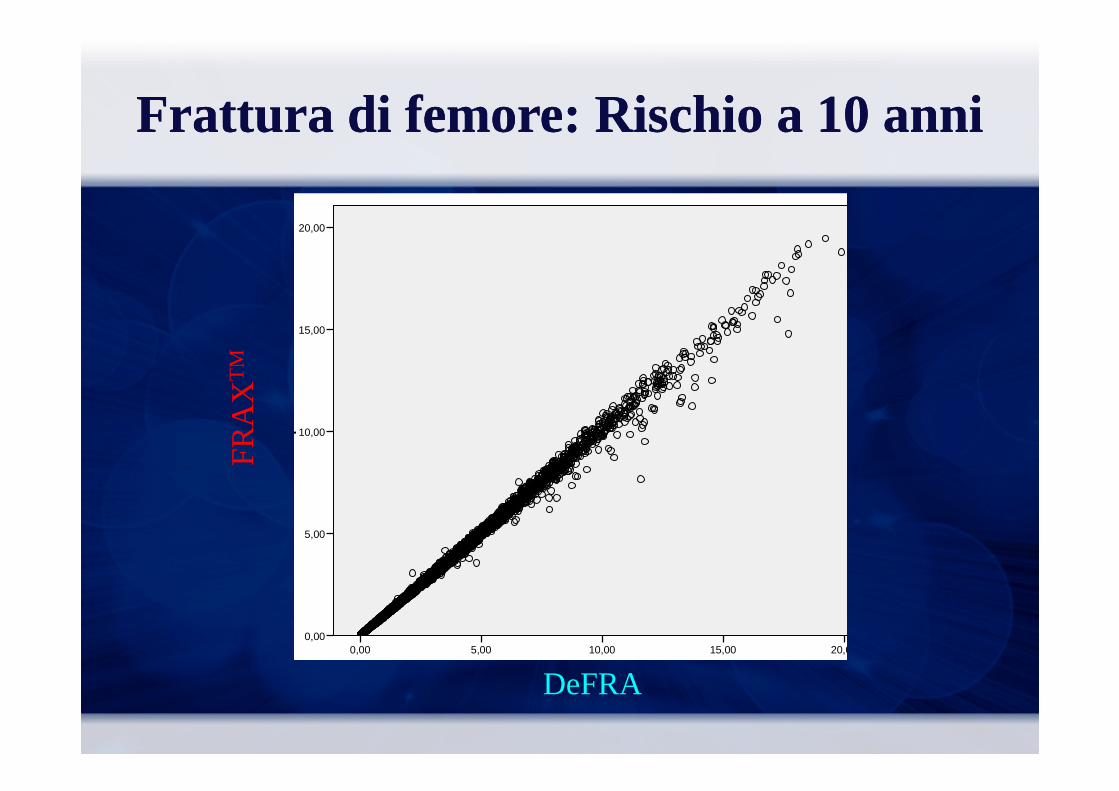
FratturaFrattura di di femorefemore: : RischioRischio a 10 a 10 annianni
FR
AX
Hip
BM
D0C
RF
20,00
15,00
FR
AX
TM
DeFRA Defra2Hip0BMD
20,0015,0010,005,000,00
FR
AX
Hip
BM
D0C
RF
10,00
5,00
0,00
FR
AX

FrattureFratture ClinicheCliniche: : RischioRischio a 10 a 10 annianni
FR
AX
Ost
BM
D0C
RF
40,00
30,00
FR
AX
TM
DEFRA2Ost0BMD40,0030,0020,0010,000,00
FR
AX
Ost
BM
D0C
RF
20,00
10,00
0,00
DeFRA
FR
AX
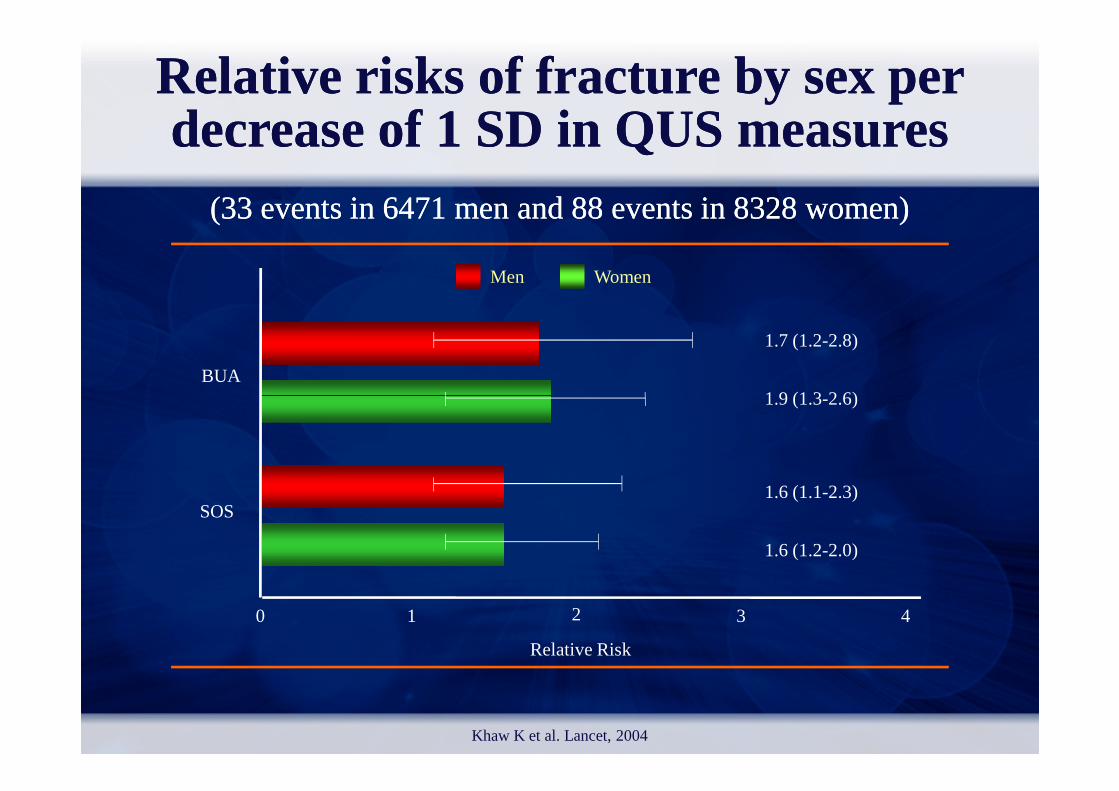
Relative Relative risksrisks of of fracturefracture by sex per by sex per decreasedecreaseof 1 SD in QUS of 1 SD in QUS measuresmeasures
((33 33 eventsevents in 6471 men and 88 in 6471 men and 88 eventsevents in 8328 in 8328 womenwomen))
Men Women
BUA
1.7 (1.2-2.8)
1.9 (1.3-2.6)
Khaw K et al. Lancet, 2004
SOS
Relative Risk
1.9 (1.3-2.6)
1.6 (1.1-2.3)
1.6 (1.2-2.0)
1 2 3 40

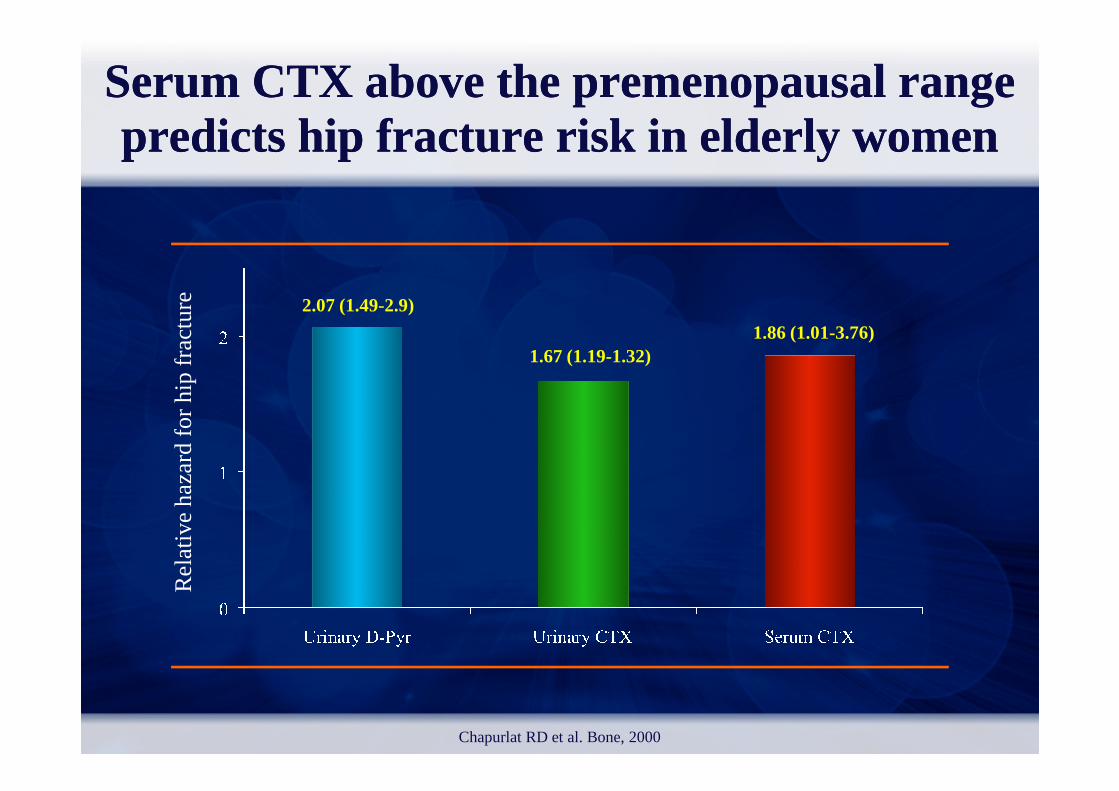
SerumCTX above the premenopausal rangepredicts hip fracture risk in elderly women
SerumCTX above the premenopausal rangepredicts hip fracture risk in elderly women
2.07 (1.49-2.9)
1.67 (1.19-1.32)1.86 (1.01-3.76)
Re
lativ
e h
aza
rd fo
r hi
p fr
act
ure
Re
lativ
e h
aza
rd fo
r hi
p fr
act
ure
Chapurlat RD et al. Bone, 2000

VARIABILI VARIABILI FRAXFRAX®®
VARIABILI
VARIABILI DICOTOMICHE
FamiliaritàVARIABILICONTINUE
EtàBMD (T-score)BMI
FamiliaritàFumoCortisoniciPregresse frattureSecondarietàAlcoolArtrite reumatoide
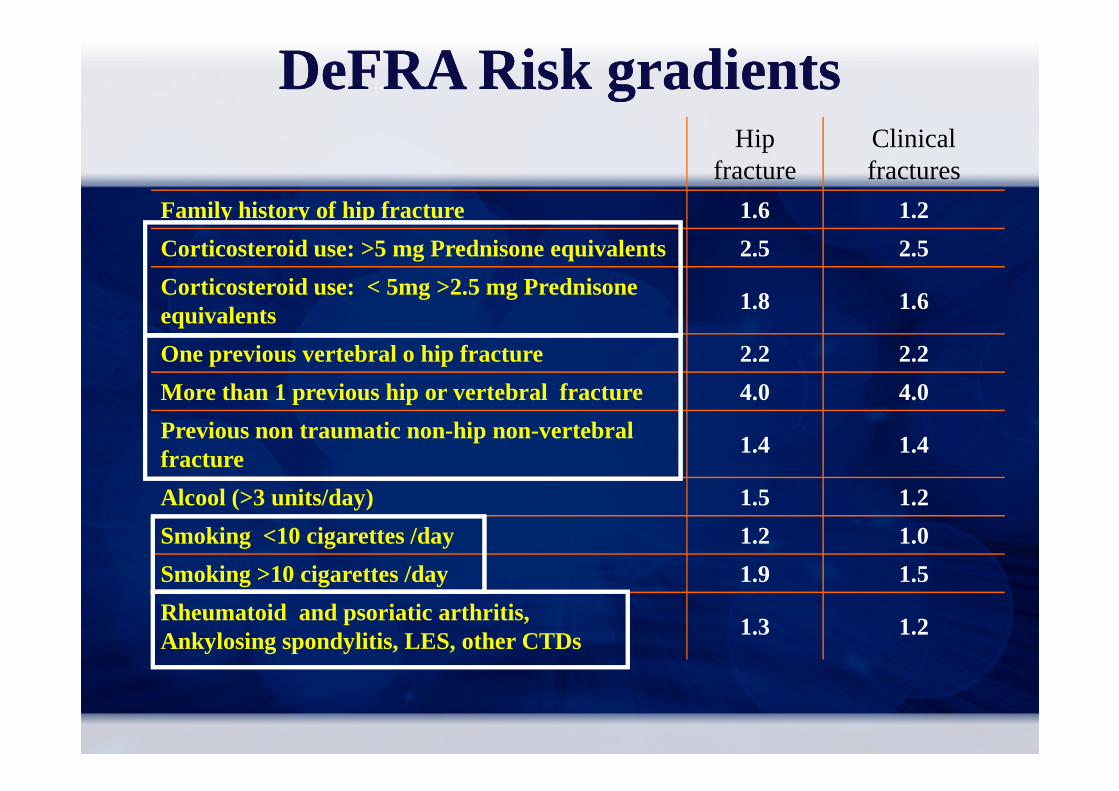
Hip fracture
Clinical fractures
Family history of hip fracture 1.6 1.2
Corticosteroid use: >5 mg Prednisone equivalents 2.5 2.5
Corticosteroid use: < 5mg >2.5 mg Prednisone equivalents
1.8 1.6
One previous vertebral o hip fracture 2.2 2.2
More than 1 previous hip or vertebral fracture 4.0 4.0
DeFRADeFRARisk gradientsRisk gradients
More than 1 previous hip or vertebral fracture 4.0 4.0
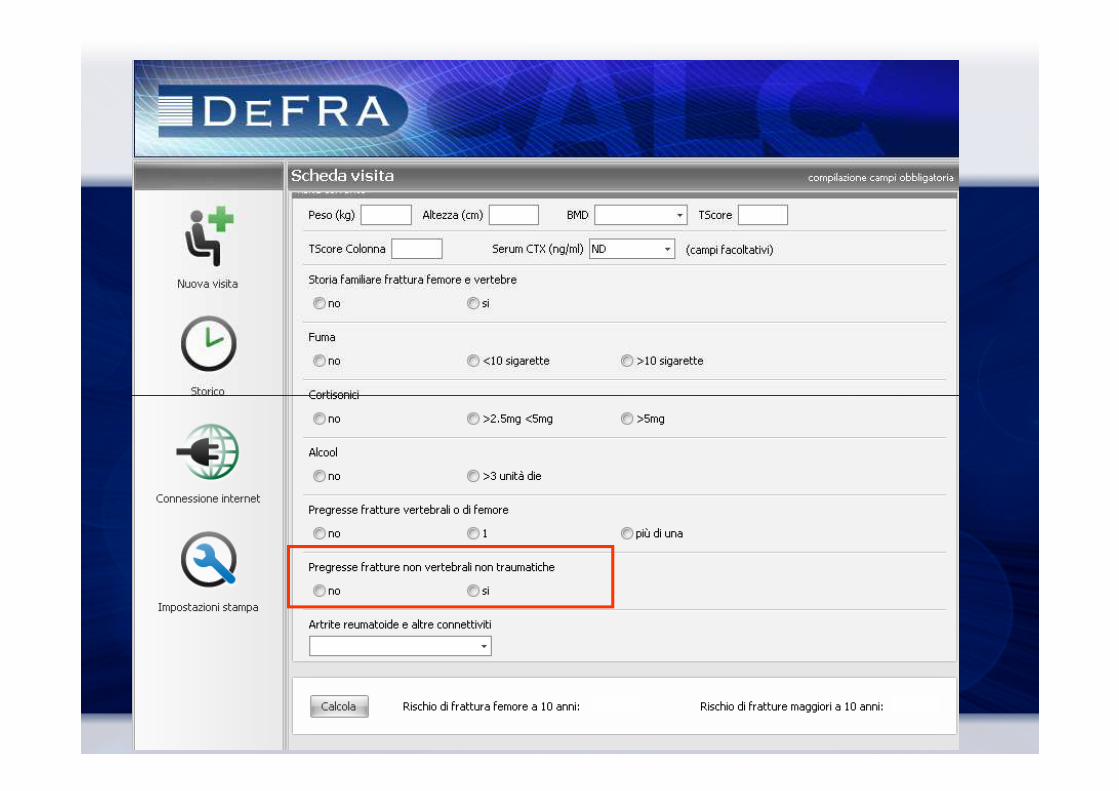
Previous non traumatic non-hip non-vertebral fracture
1.4 1.4
Alcool (>3 units/day) 1.5 1.2
Smoking <10 cigarettes /day 1.2 1.0
Smoking >10 cigarettes /day 1.9 1.5
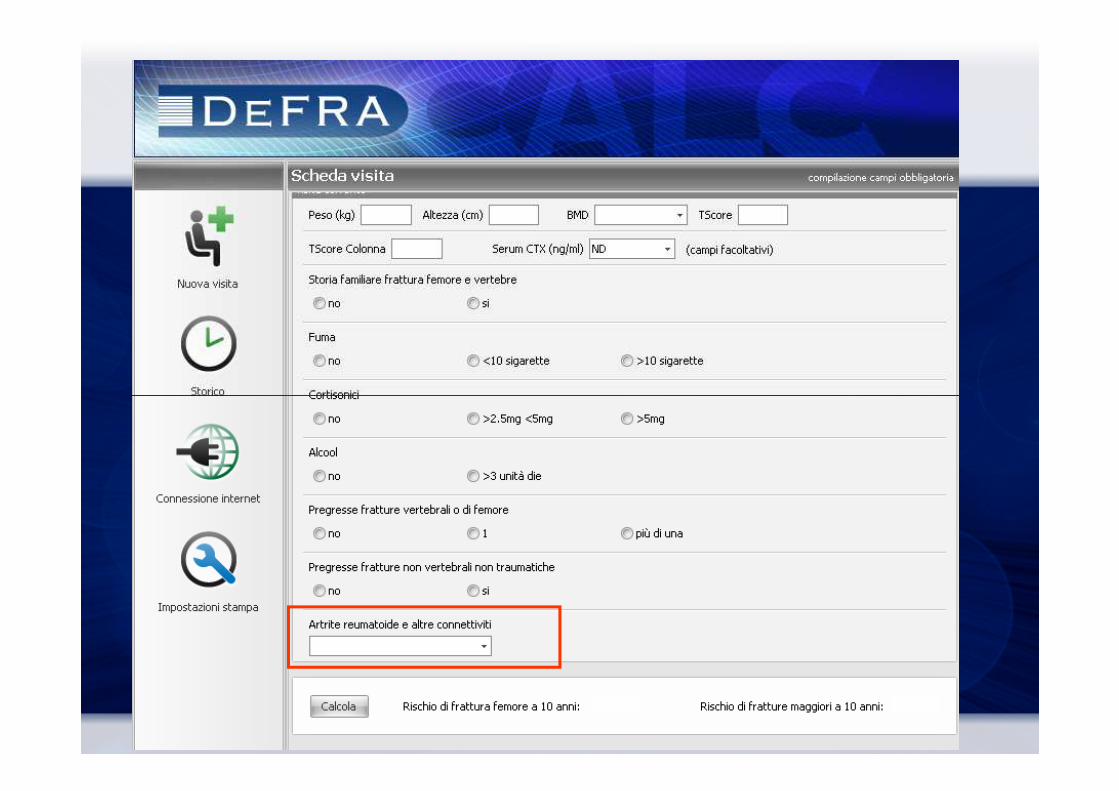
Rheumatoid and psoriatic arthritis, Ankylosing spondylitis, LES, other CTDs
1.3 1.2

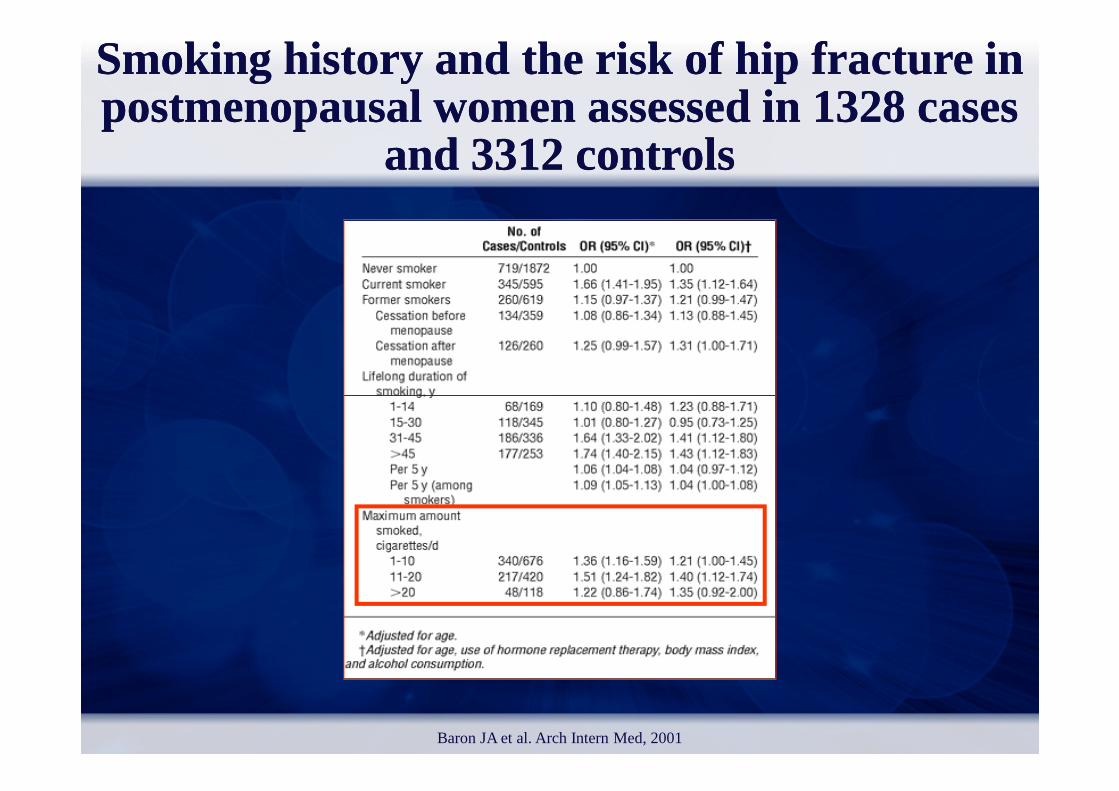
Smoking history and the risk of hip fracture in postmenopausal women assessed in 1328 cases
and 3312 controls
Smoking history and the risk of hip fracture in postmenopausal women assessed in 1328 cases
and 3312 controls
Baron JA et al. Arch Intern Med, 2001

Fracture Risk by FRAX and DeFRAaccording with smoking habits
(T score =-3.0; weight 65; height 165)
Fracture Risk by FRAX and DeFRAaccording with smoking habits
(T score =-3.0; weight 65; height 165)
20
25
0
5
10
15
FRAX-DeFRA no
Sm
FRAX-SmDeFRA Sm <10DeFRA Sm >10
10
yrs
Fx
risk


Incidenceof vertebral fractures in patientsreceivingGlucocorticoids comparedto non
users accordingto baseline BMD
Incidenceof vertebral fractures in patientsreceivingGlucocorticoids comparedto non
users accordingto baseline BMD
GCs GCsGCs
GCs GCs
Van Staa TP et al. Arthritis Rheum, 2003
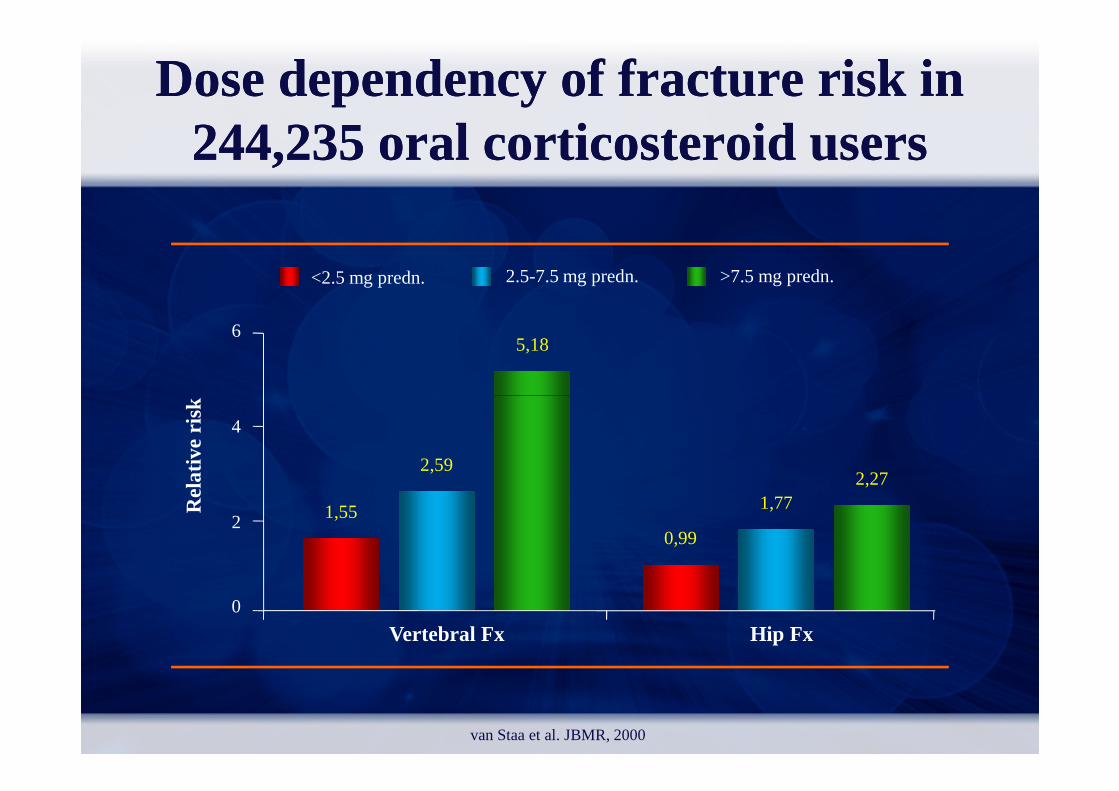
Dose dependency of fracture risk in Dose dependency of fracture risk in 244,235 oral corticosteroid users244,235 oral corticosteroid users
5,186
<2.5 mg predn. 2.5-7.5 mg predn. >7.5 mg predn.
van Staa et al. JBMR, 2000
1,55
0,99
1,772,27
2,59
0
2
4
Vertebral Fx Hip Fx
Rel
ativ
e ris
k

Fracture Risk by FRAX and DeFRAaccording with Glucocorticoid therapy
(T score =-3.0; weight 65; height 165)
Fracture Risk by FRAX and DeFRAaccording with Glucocorticoid therapy
(T score =-3.0; weight 65; height 165)
30
40
0
10
20
FRAX-DeFRA no
GLC
FRAX-GLCDeFRA GLC <5
mg
DeFRA GLC >5
mg
10
yrs
Fx
risk
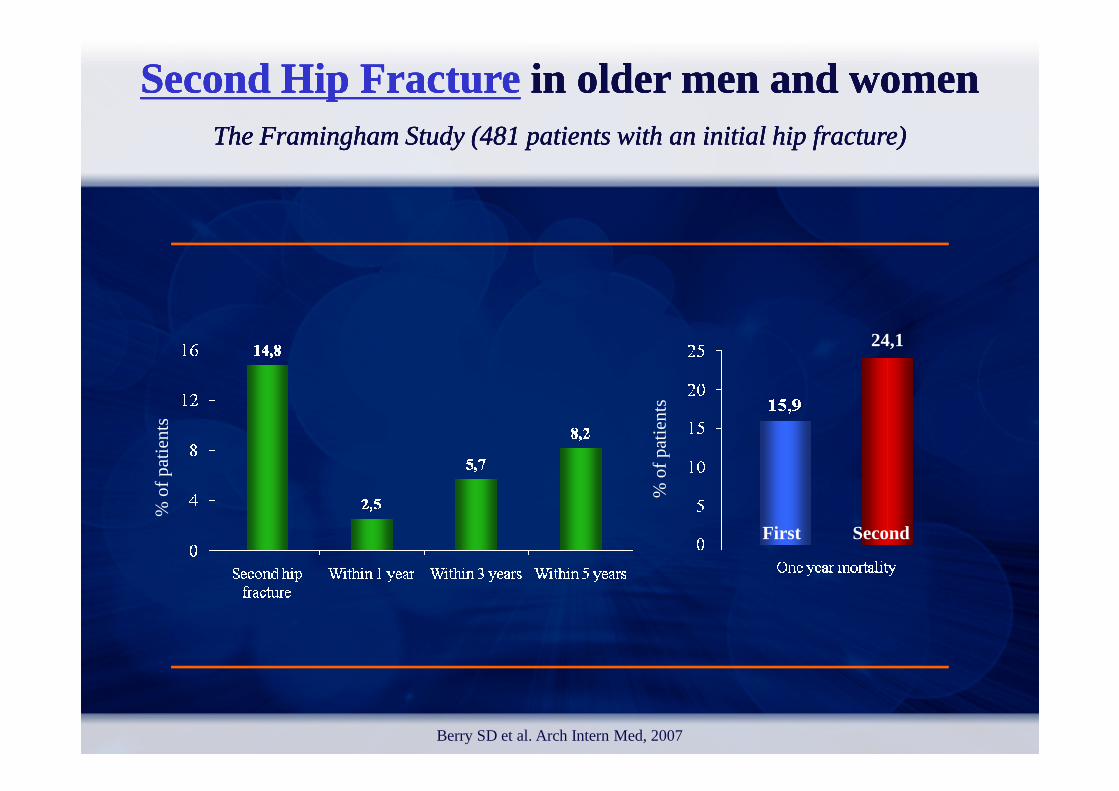
Second Hip FractureSecond Hip Fracturein older men and womenin older men and womenThe Framingham Study (481 patients with an initial hip fracture)The Framingham Study (481 patients with an initial hip fracture)
Second Hip FractureSecond Hip Fracturein older men and womenin older men and womenThe Framingham Study (481 patients with an initial hip fracture)The Framingham Study (481 patients with an initial hip fracture)
24,1
Berry SD et al. Arch Intern Med, 2007
% o
f pat
ien
ts
% o
f pat
ien
ts
First Second
10
15
inci
den
tfrac
ture
sin
cid
entfr
actu
res
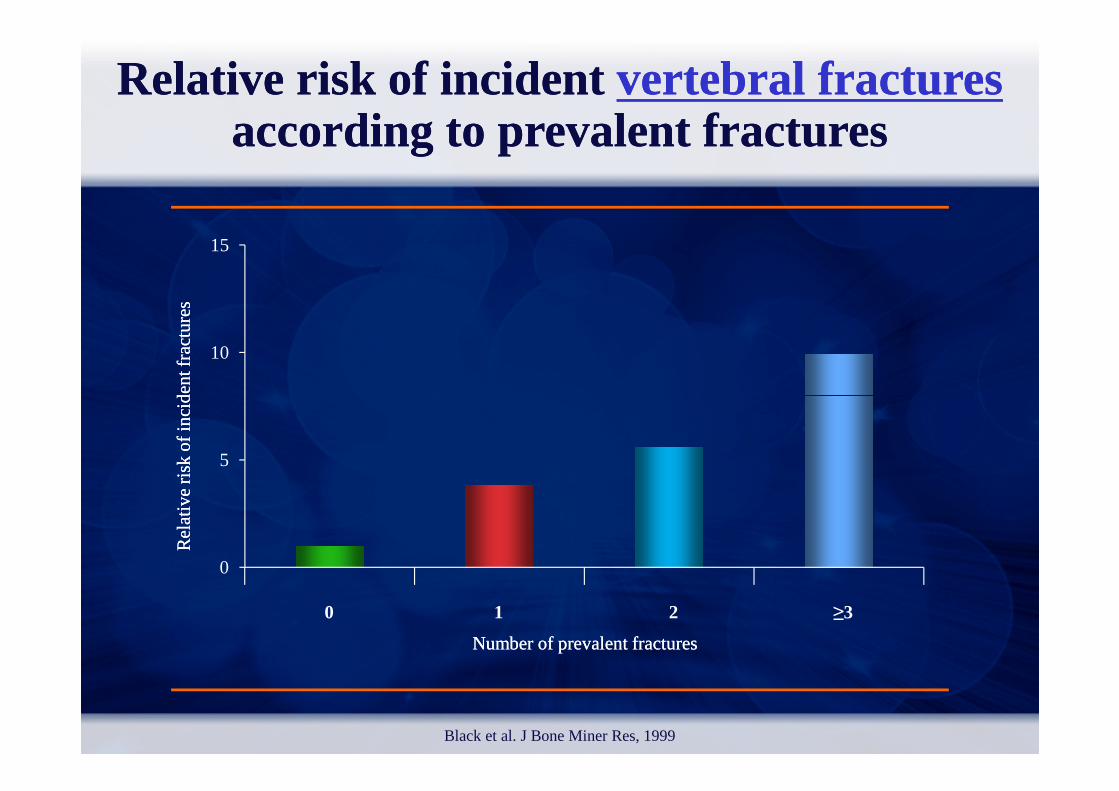
Relative risk of incident Relative risk of incident vertebral fracturesvertebral fracturesaccording to prevalent fracturesaccording to prevalent fractures
0
5
0 1 2 3Black et al. J Bone Miner Res, 1999
Number of prevalent fracturesNumber of prevalent fractures
Rel
ativ
e ri
sko
f inci
den
tR
elat
ive
risk
of in
cid
ent
≥3210

Hip
Vertebral
RiskRisk of of subsequentsubsequentfracturesfractures in in peri/peri/postmenopausalpostmenopausal womenwomenwith with prevalentprevalent
vertebralvertebral fracturesfractures
Klotzbuecher et al. J Bone Min Res, 2000
All (nonspine)
0 2 4 6 8
Pooled
Wrist
Relative Risk
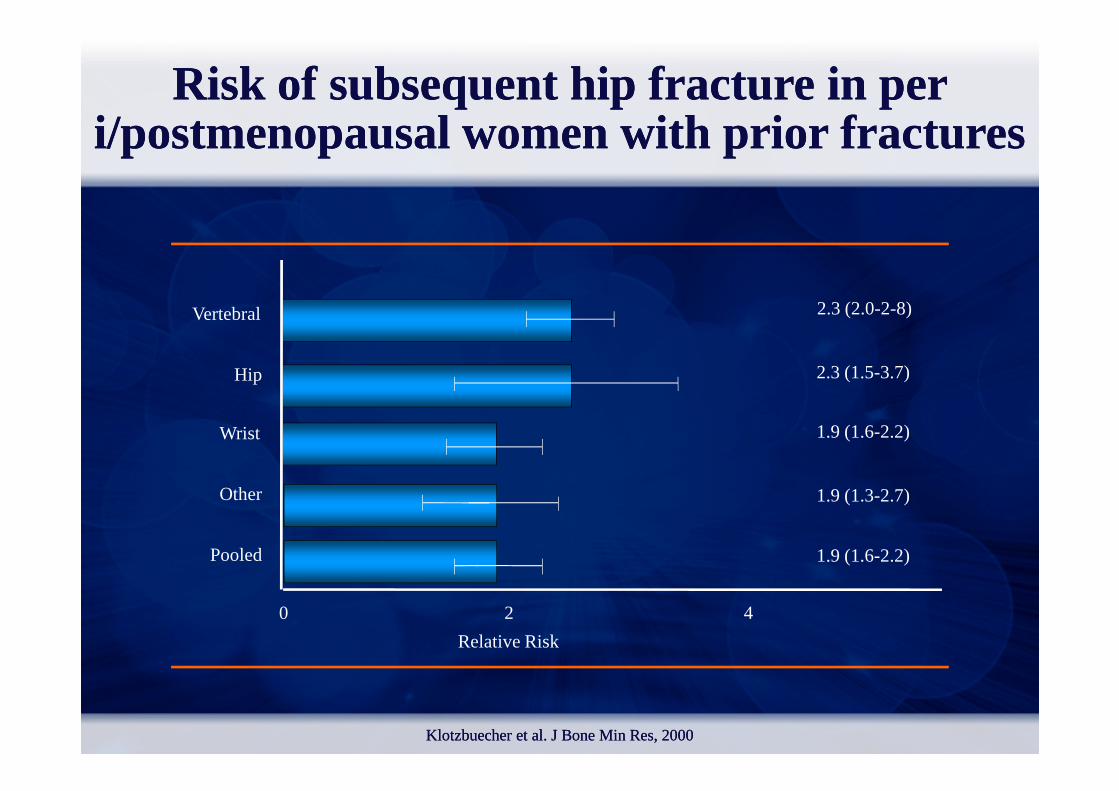
Risk of subsequent hip fracture in per Risk of subsequent hip fracture in per i/postmenopausal women with prior fracturesi/postmenopausal women with prior fractures
Hip
Vertebral 2.3 (2.0-2-8)
2.3 (1.5-3.7)
KlotzbuecherKlotzbuecher et al. et al. JJ Bone Bone MinMin Res, 2000Res, 2000
0 2 4
Pooled
Other
Wrist
Relative Risk
1.9 (1.6-2.2)
1.9 (1.3-2.7)
1.9 (1.6-2.2)
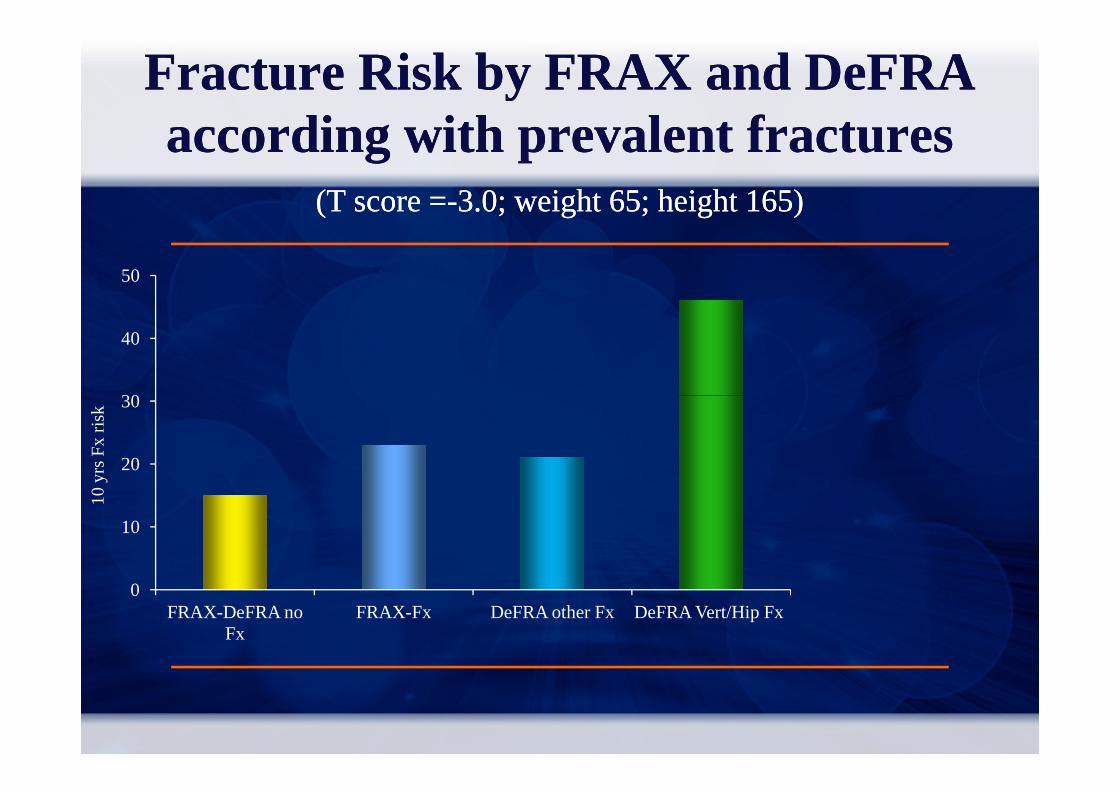
Fracture Risk by FRAX and Fracture Risk by FRAX and DeFRADeFRAaccording with prevalent fracturesaccording with prevalent fractures
(T score =(T score =--3.0; weight 65; height 165) 3.0; weight 65; height 165)
30
40
50
0
10
20
30
FRAX-DeFRA no Fx
FRAX-Fx DeFRA other Fx DeFRA Vert/Hip Fx
10
yrs
Fx
risk
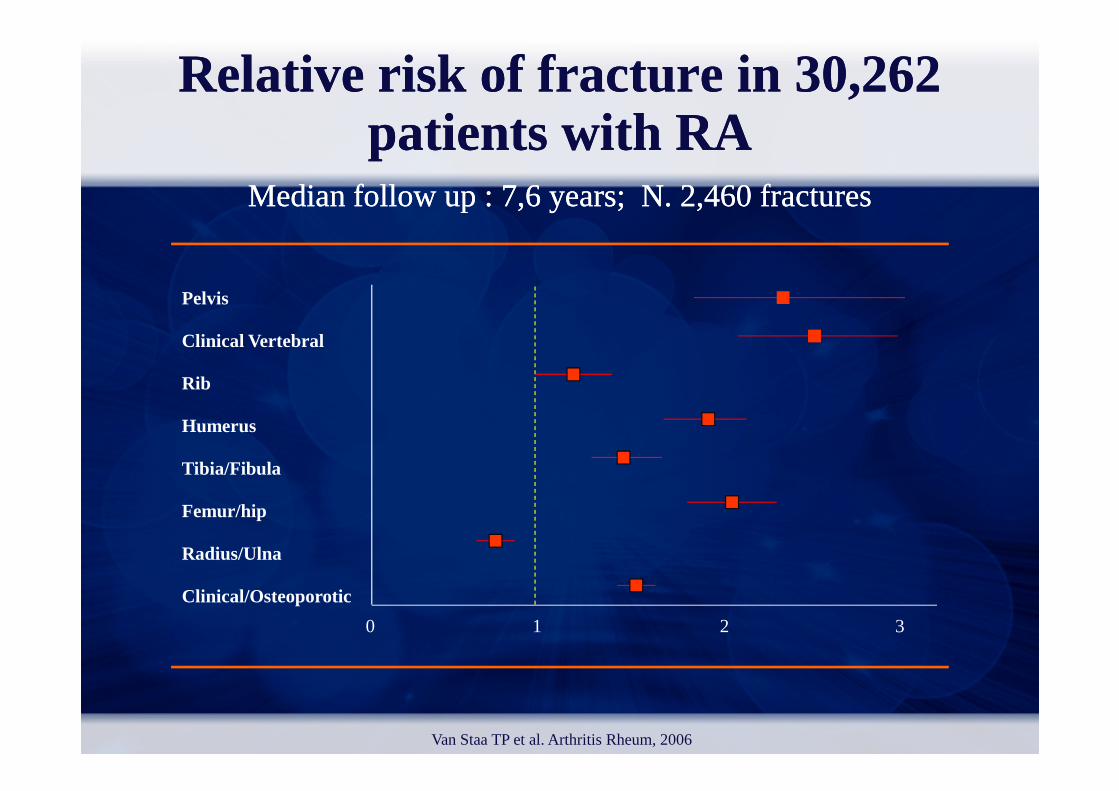
Relative Relative riskrisk of of fracturefracture in 30,262in 30,262patientspatients with RAwith RA
MedianMedian followfollow up : 7,6 up : 7,6 yearsyears; N. 2,460 ; N. 2,460 fracturesfractures
Pelvis
Clinical Vertebral
Rib
Van Staa TP et al. Arthritis Rheum, 2006
Humerus
Tibia/Fibula
Femur/hip
Radius/Ulna
Clinical/Osteoporotic
0 1 2 3
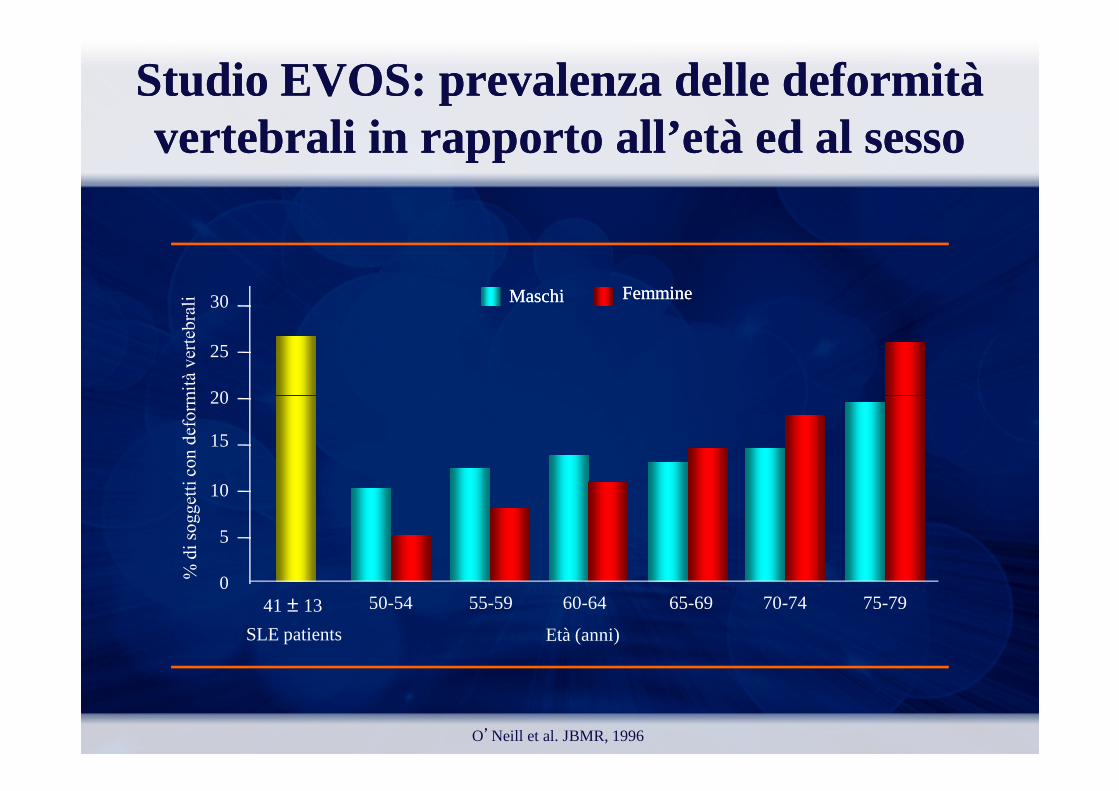
FemmineFemmine30
25
20
MaschiMaschi
Studio EVOS: prevalenza delle deformità Studio EVOS: prevalenza delle deformità vertebrali in rapporto all’età ed al sessovertebrali in rapporto all’età ed al sesso
O’Neill et al. JBMR, 1996
41 ± 13
SLE patients Età (anni)
50-54 55-59 60-64 65-69 70-74 75-79
20
15
10
5
0

3836
35
40
45
50
Prevalence of fractures in 159 Prevalence of fractures in 159 SSCSSCand 235 and 235 ARAR patientspatients
% o
f F
frac
ture
s
0
5
10
15
20
25
30
SSc RA
Yuen SY et al. J Rheumatol, 2008
% o
f F
frac
ture
s


Major Major riskrisk factorsfactors for for fracturefracturein in clinicalclinical practicepractice
Female genderAge*Asian or Caucasian raceLow Bone Mineral Density
Premature menopauseAmenorrhoeaHypogonadism in menLow body weight*Low Bone Mineral Density
High Bone turnover*Poor visual acuity*Neuromuscular disorders*Parental history of fractures*Previous fragility fractures*Comorbidities
Low body weight*Cigarette smoking*Alcohol consumption*Prolonged immobilisationLow dietary calcium intakeVitamin D deficiencyGlucocorticoid use*Fall propensity*
* Over and above BMD
Kanis JA et al. Osteoporos Int, 2005

FallFall--relatedrelated factorsfactors and and riskrisk of hip of hip fracturefracture EPIDOS EPIDOS prospectiveprospectivestudystudy
((7575 7575 womenwomen agedaged 75 or 75 or olderolder))
Femoral neck BMD
Fall-risk status
Lower quartiles Highest quartile
Dargent-Molina P et al. Lancet, 1996
Femoral neck BMD
Lower quartiles of risk
Highest quartile of risk
(Hip fracture rate per 1000 person-year)
5.4
11.3
11.3
28.5
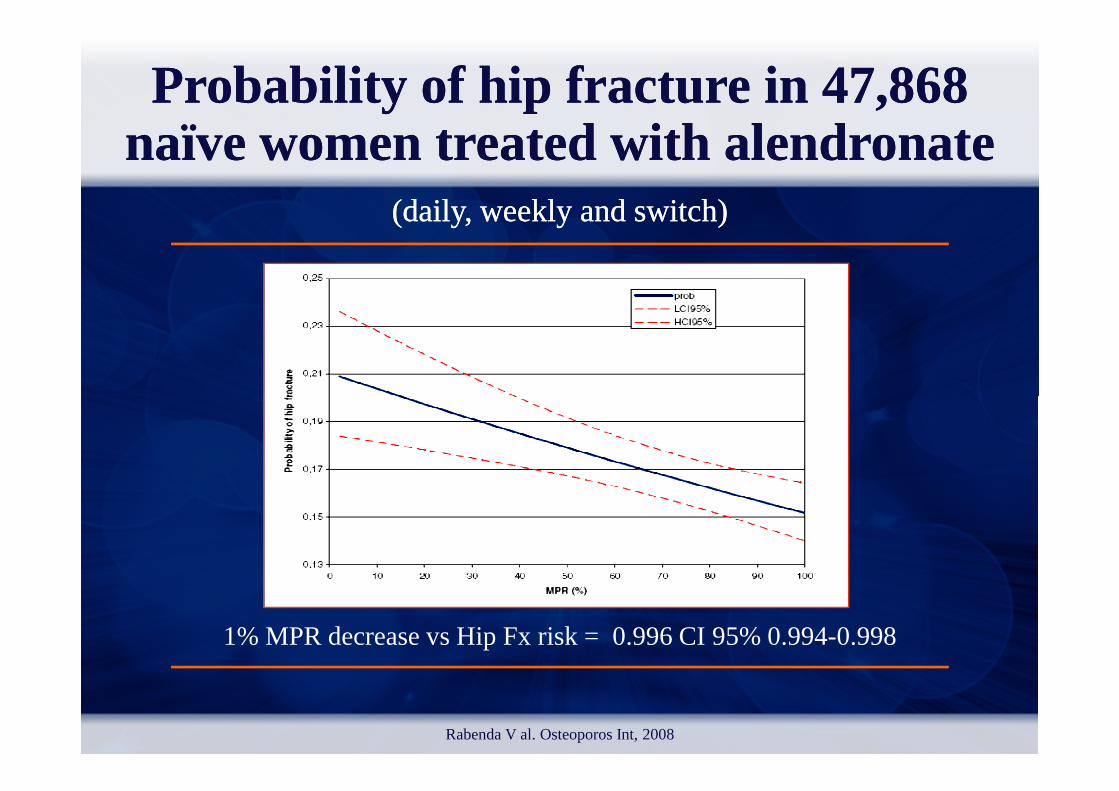
Probability of hip fracture in 47,868 Probability of hip fracture in 47,868 nanaïve women treated with alendronate ïve women treated with alendronate
(daily, weekly and switch)(daily, weekly and switch)
Rabenda V al. Osteoporos Int, 2008
1% MPR decrease vs Hip Fx risk = 0.996 CI 95% 0.994-0.998
%
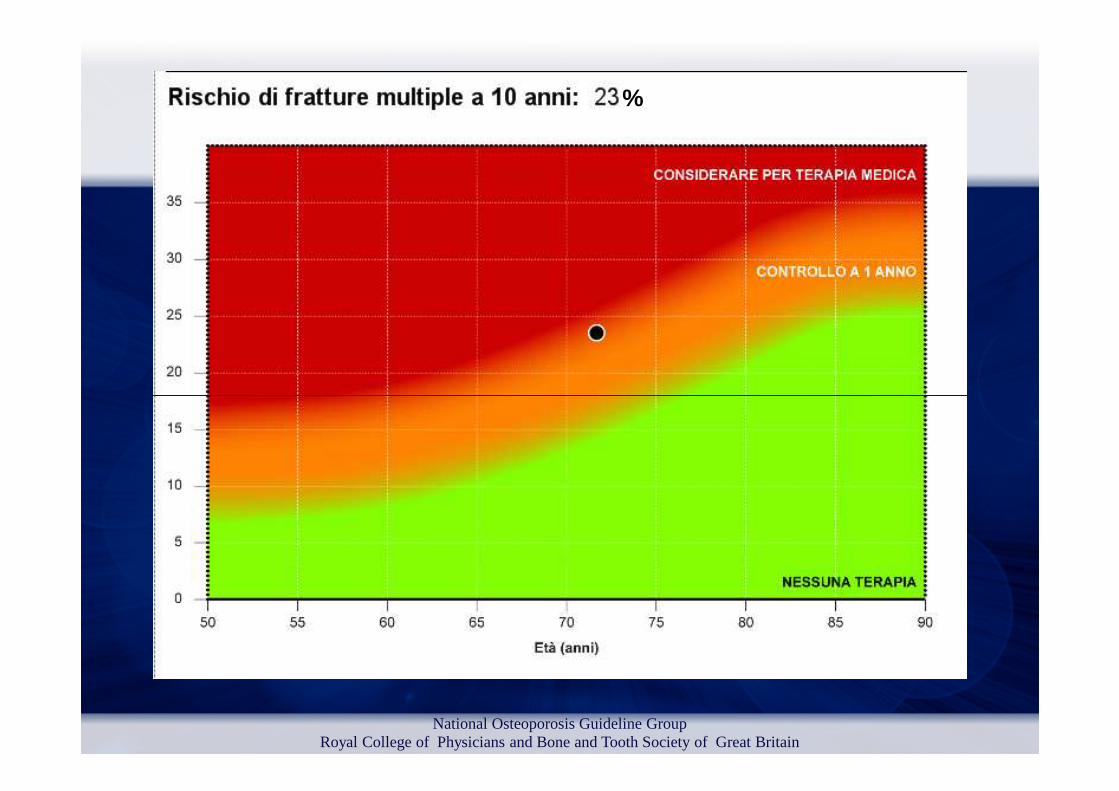
National Osteoporosis Guideline GroupRoyal College of Physicians and Bone and Tooth Society of Great Britain

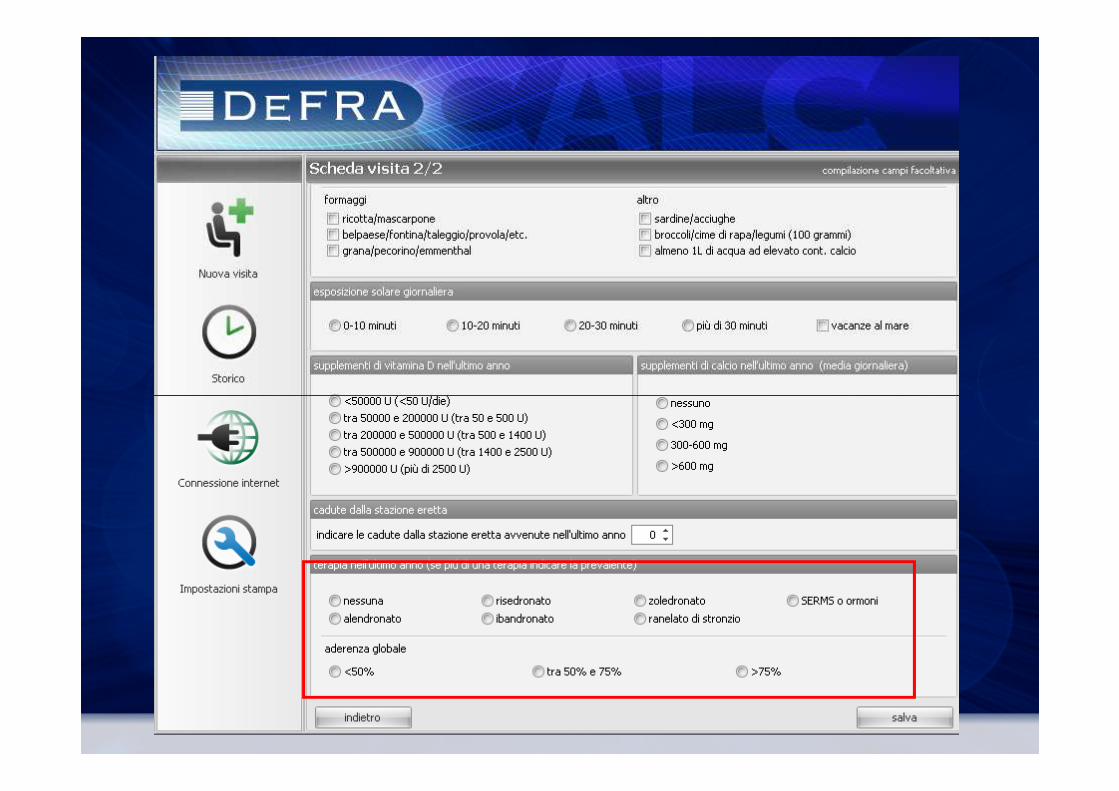
DeFRA, 2010
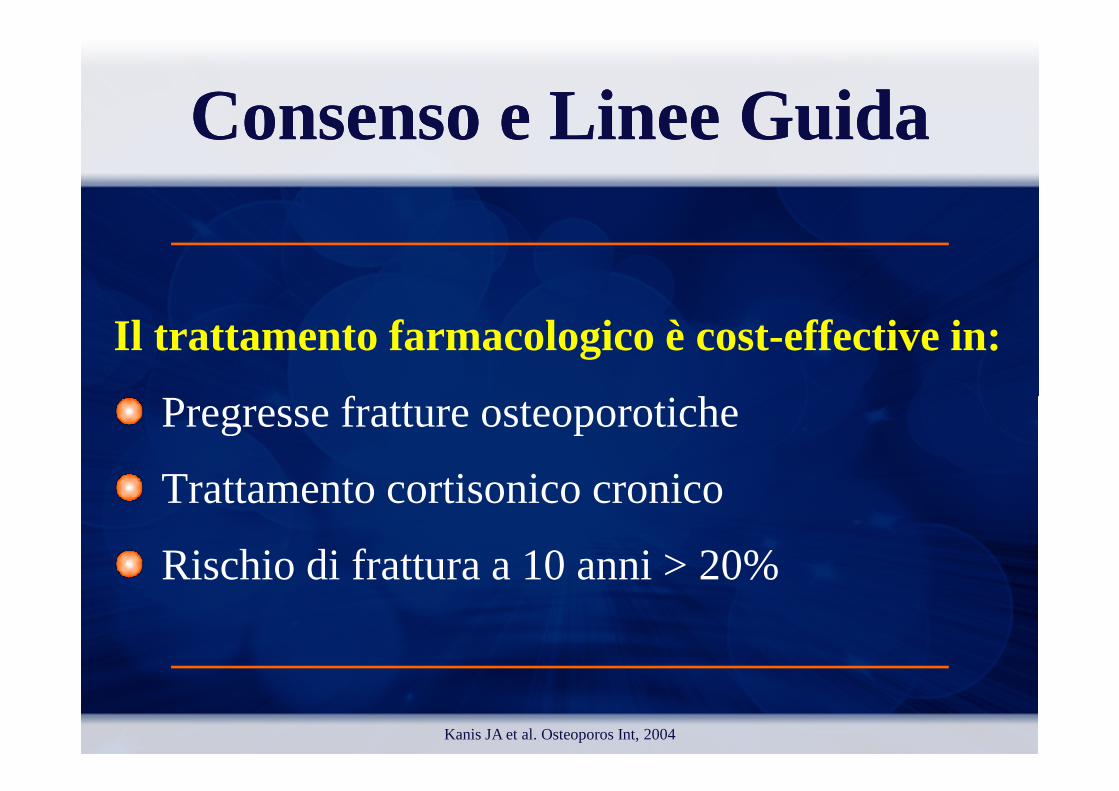
Consenso e Linee GuidaConsenso e Linee Guida
Il trattamento farmacologico è cost-effective in:
Pregresse fratture osteoporotiche Pregresse fratture osteoporotiche
Trattamento cortisonico cronico
Rischio di frattura a 10 anni > 20%
Kanis JA et al. Osteoporos Int, 2004
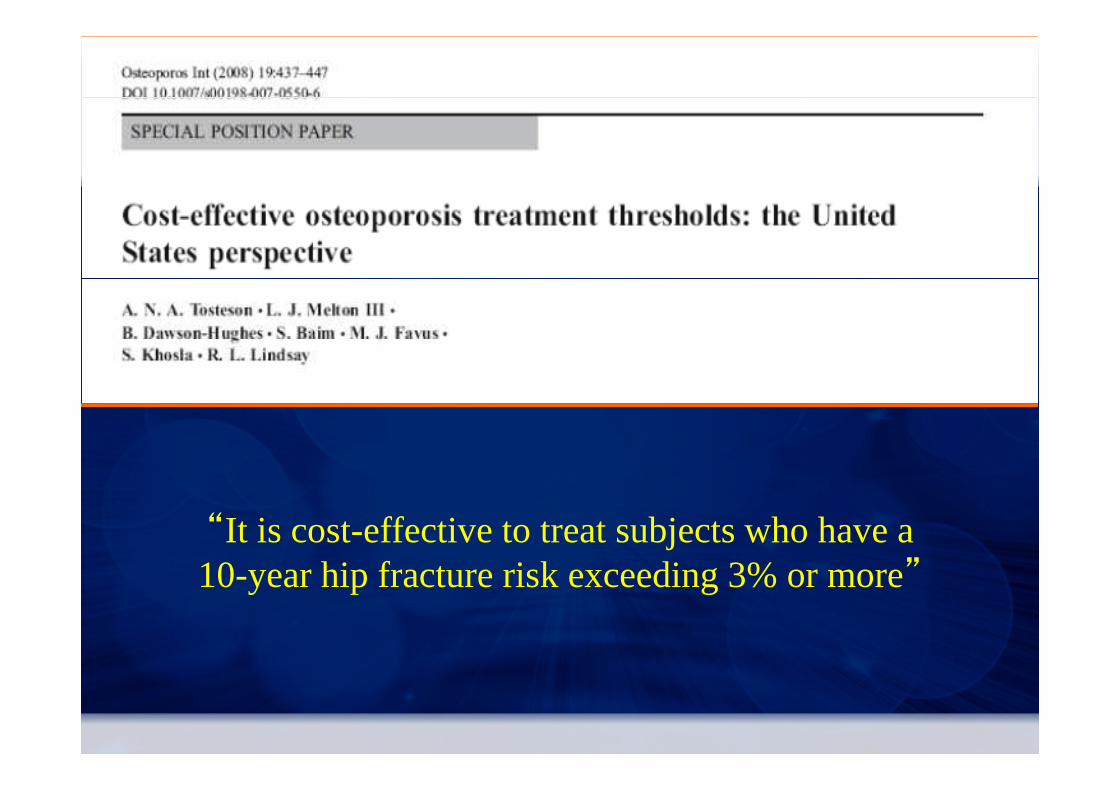
“It is cost-effective to treat subjects who have a 10-year hip fracture risk exceeding 3% or more”

Grazie
Uno strumentoitaliano per la valutazione
del rischio di fratturadel rischio di frattura
Francesca De Giorgio
U.O. Medicina 2ASL3 Pistoia


