
Urban Geography: overview
Lecture Notes

System of cities with various levels
Few cities at top level
Increasing number of settlements at each
lower levelLarger cities provide more services than
smaller towns
– exists at regional, national, and global
scales
Urban Hierarchy
Number of Business Types by Population
of Colorado Cities (1899)
Graph from Kuby, HGIA

Urban Geography – Urban Systems

Ranking of Census MSAs (Metropolitan Statistical Areas) of U.S., 2005
MSAs with populations over 2 million (right)
24 more MSAs have pops between 1 and 2 million
47 more (1 in CO) between 500,000 and 1 million
74 more (2 in CO) between 250,000 and 500,000
169 more (3 in CO) bet. 100,000 and 250,000

Rank-size Rule
• Rank Size Rule– Nth largest city of a national
system will be 1/n the size of the largest city.
– Example - US is close to this model - mot a good model for newly urbanized countries ie LDC

Primate City
• One dominate city in a country or region.
• There is usually not an obvious second city
• Example - Paris France - 8.7 million next city Marseille - 1.2 million

Mexico Primate City
• Mexico is an excellent example of a Primate City model.
• Mexico City is dominate city in Mexico
QuickTime™ and aTIFF (Uncompressed) decompressor
are needed to see this picture.

Paris historical site and growth

Nested hexagonal
market areaspredicted by Central Place
Theory
Central Place Theory
Spatial model of settlements (central places) for a nested hierarchy of market areas

Central Place Theory
• Geographic assumptions (Christaller, 1930s)- featureless landscape on infinite plane- uniform population distribution
• Behavioral (economic) assumptions- consumers shop at closest place possible- consumers do not go beyond the range of the good- market areas equal or exceed threshold of good
• Hexagonal market areas are most efficient
- non-overlapping circles leave areas unserved- higher-order central places also provide lower-order functions

Central Place Theory in action on a flat, featureless plain (e.g., Northern Germany)
… and in a landscape with
“locational biases”
introduced by physical features

Connectivity of Urban Systems
Spain’s national urban system
National metropolises have greater connectivity than regional metropolises or small cities

Top Ten Cities,1950 (estimated from various sources)City Pop (in millions) Lat Long
New York, USA 12.3 40 N 74 WLondon, UK 8.7 52 N 0Tokyo, Japan 6.9 35 N 135 EParis, France 5.4 49 N 2 EMoscow, USSR 5.4 56 N 37 EShanghai, China 5.3 31 N 121 EEssen (Ruhr), Germany 5.3 51 N 7 EBuenos Aires, Argentina 5.0 34 S 58 WChicago, USA 4.9 41 N 87 WCalcutta (Kolkata), India 4.4 22 N 88 E
Plot these cities to see where the world’s ten largest cities were located in 1950. Symbolize each
with a circle .
World Urban System
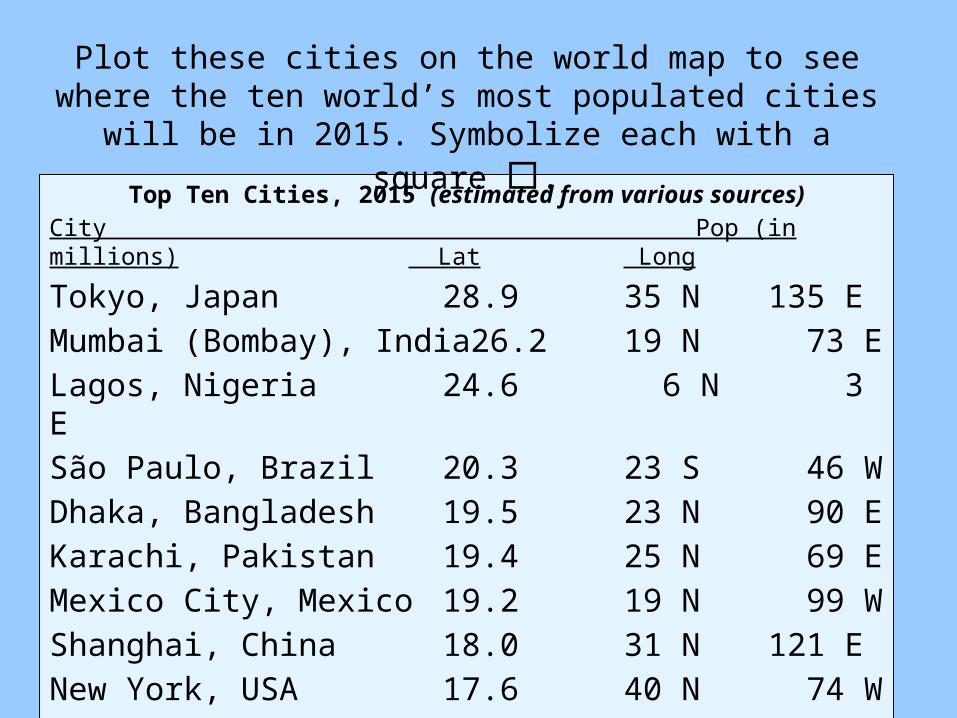
Top Ten Cities, 2015 (estimated from various sources)City Pop (in millions) Lat Long
Tokyo, Japan 28.9 35 N 135 EMumbai (Bombay), India26.2 19 N 73 ELagos, Nigeria 24.6 6 N 3 ESão Paulo, Brazil 20.3 23 S 46 WDhaka, Bangladesh 19.5 23 N 90 EKarachi, Pakistan 19.4 25 N 69 EMexico City, Mexico 19.2 19 N 99 WShanghai, China 18.0 31 N 121 ENew York, USA 17.6 40 N 74 WKolkata (Calcutta), India17.3 22 N 88 E
Plot these cities on the world map to see where the ten world’s most populated cities will be in 2015.
Symbolize each with a square .

Place an X on each city as it is named on the following 12 lists. Each list identifies the top 5 cities as ranked according to its provision of certain services (Taylor 2005).
As cities are named more than once, just keep adding more X’s.
Banking $London
New YorkTokyo
Hong KongSingapore

Producer Services $London
New YorkHong Kong
ParisTokyo

Management New YorkLondonParis
MadridStockholm

Law London
New YorkFrankfurt
Hong KongWashington DC

Insurance London
New YorkHong KongLos Angeles
Paris

Advertising New YorkLondon
Hong KongTorontoSydney

Media ♫
LondonNew York
ParisLos Angeles
Milan

Architecture/Engineering
London
New YorkBeijing
SingaporeShanghai

United Nations
Agencies GenevaBrussels
Addis AbabaCairo
Bangkok

National Diplomatic
Missions Washington DC
New YorkLondonTokyoParis
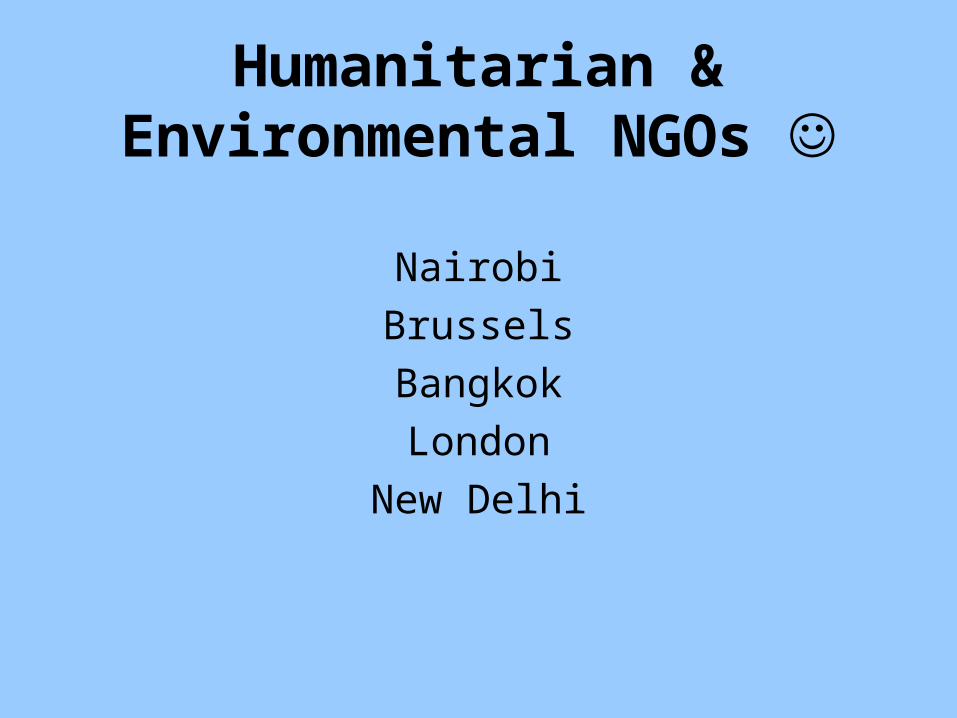
Humanitarian & Environmental NGOs
NairobiBrusselsBangkokLondon
New Delhi

Scientific Research London
Los AngelesSan Francisco
BostonBasel
GenevaNew York

“World cities are not simply the world’s largest … cities. Rather, they are the control centers for the global economy, places where critical decision making and interaction take place with regard to global economic, cultural, and political issues” (Knox and Marston 2001, p. 426).
“WORLD CITIES”
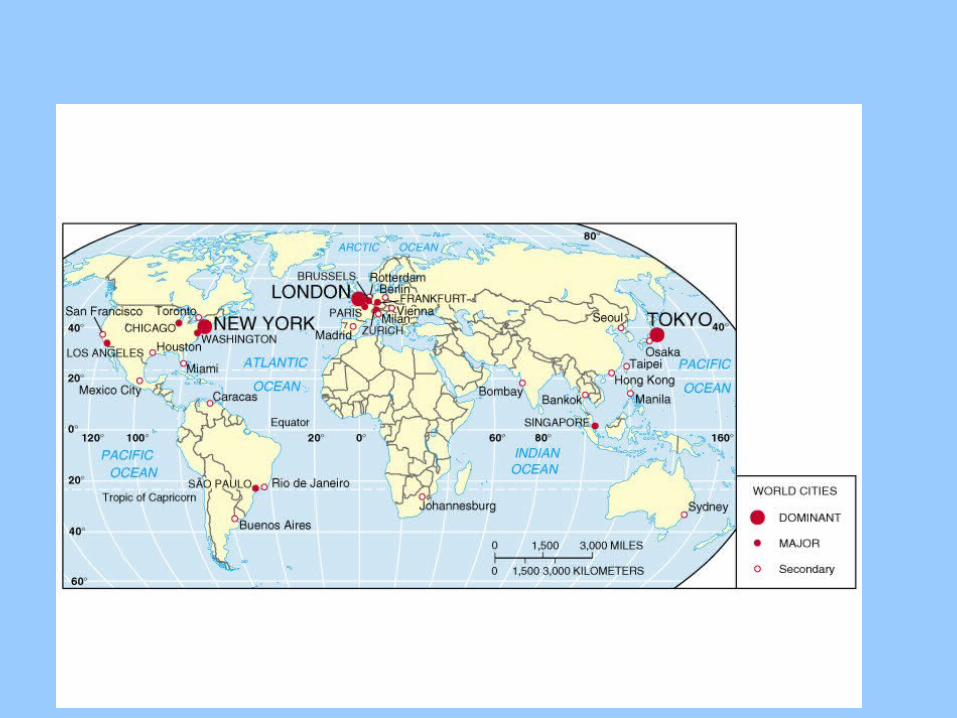


Functional specialization in a national urban system: Cities specialize in certain functions; more significant centers serve a wider array of functions (Knox and Marston 2001).

Spatial Models of Urban Land Use (Ch. 10)
Sketch the layout of land uses of a town
or city you know well

Newest settlers in city use older housing near city center (migrants to
industrial jobs)
Previous groups move outward to higher-
income areas as they assimilate
Concentric Ring Model1920s (Burgess) – land-use
pattern follows concentric rings around city center
(CBD)

Concentric Zone Model

1939 (Hoyt) - Land uses in pie-shaped wedges radiating from CBD
High-income areas along fashionable boulevards, waterfronts, or high ground
Industry along river or rails
Low-income near industry
Middle-income between low and high sectors
Sector Model

Hoyt Sector Model

Post WW2 - Early days of suburbanization
Downtown CBD not only core of busiiness land use
Other nuclei develop - special retail districts, office parks, light manufacturing in city
Metro areas develop “suburban downtowns” (called “edge cities”)
Multiple-Nuclei Model

Multiple Nuclei Model

Transportation and urban growth

Philadelphia's Edge Cities
“Edge cities” - suburban nodes: high-rise offices, shopping, entertainment, hotels - designed for auto
travel -Located along freeways or beltways

Galactic City or Edge City Model

Urban sprawl – contemporary problemLow-density “leapfrog” developments beyond urban edge
Lack of coordinated planning between jurisdictionsConsequence of car-dependent urban growth

Contemporary urban trends
Infill development (opposite of sprawl)

“New Urbanism”
Prospect Town, Longmont
Contemporary urban trends

Gentrification and Downtown
Revitalization
Contemporary urban trends

Applicability of classic land use models
Rings, sectors, and multiple nuclei are still seen, but overall pattern is complex
Family status tends to be distributed concentrically
Socioeconomic status tends to be radial
Ethnic status tends to be clustered

Geography and GIS
Essential tools in urban & regional planning

Source: October 2006: http://centerwest.org/futures/frtrng/

Source: October 2006: http://centerwest.org/futures/frtrng/

Source: October 2006: http://centerwest.org/futures/frtrng/

Geographic Investigation Process
Level 1 Questions - What? Where? When?Level 2 -Pattern IdentificationLevel 3
Questions- Why? How? BrainstormField Investigation
Level 4 So What? What if?
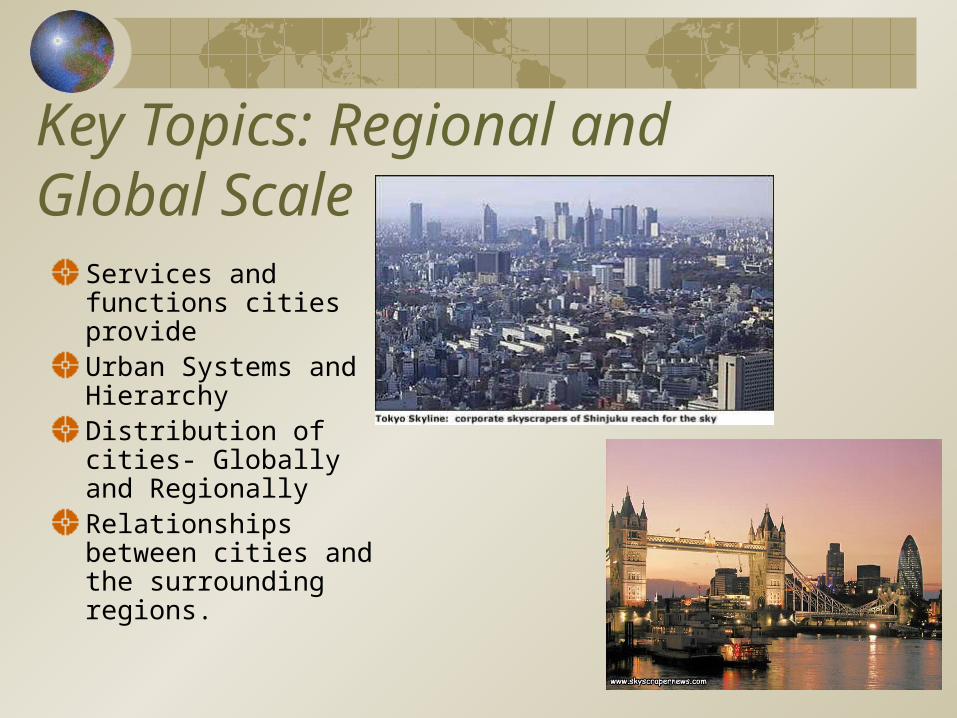
Key Topics: Regional and Global Scale
Services and functions cities provideUrban Systems and HierarchyDistribution of cities- Globally and Regionally Relationships between cities and the surrounding regions.

Earth at Night

Key Topics: Regional and Global Scale
Rural to Urban Migration
Core (HDC) compared to Periphery (LDC) urbanization
Globalization, population, megacities
Sao Paulo Brazil-http://www.csuhayward.edu/alumni_friends/public_affairs/international/brazil/skyline.jpg
<- Lagos Nigeria - http://www.payer.de/kommkulturen/kultur11111.gif

Percent Urban
Knox and Marston - http://wps.prenhall.com/wps/media/objects/814/834298/Urbanpop_percent_tot.GIF

Urban Growth Rate- Patterns
Knox and Marston - http://wps.prenhall.com/wps/media/objects/814/834298/urbanpop_average_annual.GIF

Key Concepts - Local ScaleInternal Structures of Cities and Cultural LandscapeAreas of spatial pattern focus
Land useEthnic segregationTransportationUneven developmentEnvironmental impactsLiving conditionsArchitecture
Use a variety of regions as case studies

Urban LandscapesHong Kong
Shang Hai China
Jakarta Indonesia
London
Rio De Janeiro- Brazil
Orange County, CA
http://www.payer.de/kommkulturen/kultur112.htm

Sample US Models
Bid - Rent
Concentric Zone
Edge Cities
Multiple Nuclei

Systems of Urban SettlementsThree Classes:
–Special-function cities–Transportation Centers–Central Places
Help us to explain distribution patterns, size and functional hierarchies of the city system
See- Cities in our Lives Cornell Notes

Urban Land Use Models

Metropolitan Statistical Areas

NOT USED SUMMER 2008Add in here GIS example – coffee house to show how location of individual businesses can utilize GIS


