
U.S. employment situation: September 2013
Release date: October 22, 2013
November gain of 321,000 jobs
confirms the strength of the recovery
U.S. employment situation: November 2014 December 5, 2014

November 2014 employment summary
• Total non-farm employment increased by 321,000 jobs in November. Revisions in previous months mean that this was the ninth consecutive
month of monthly additions surpassing 200,000 jobs.
- This was the third-highest one-month net change seen throughout the recovery so far, boosted by growth across subsectors, even in more
stalled industries such as manufacturing and finance.
• Unemployment remained steady at 5.8 percent; despite persistently low labor force participation (62.8 percent) and an increase in quits
countering strong job gains.
- Total unemployment declined to 11.4 percent, a drop of 10 basis points, as the number of marginally detached workers slowly falls.
- Unemployment for college and high-school grads remained stable, but labor force participation for both groups is at record lows with little sign
of increase.
• The office-using industries (PBS, financial activities and information) registered their second-highest monthly growth during the recovery, which
was only slightly less than their peak in early 2013. In turn, this resulted in office-using subsectors comprising slightly more than one-third of total
non-farm jobs in November.
• While consumer confidence fell to 88.7 points from 94.1 in October, it is still well above the recovery average and near normal during the previous
cycle.
• From a geographic perspective, Texas and the Sunbelt are the definite leaders, with markets consistently reporting 3.5 percent or greater year-
on-year employment growth. While most major markets are now in the 2.0+ percent range (with the notable exceptions of Chicago and
Philadelphia), they have yet to keep up with Austin, Dallas, Denver, Houston, Raleigh-Durham and South Florida in percentage terms, among
other high-growth areas.
• Improvements in the labor market have finally had a significant effect on the office sector. Over the course of 2014, occupancy growth has
surpassed 38.0 million square feet (highest in more than five years), pushing vacancy below 16.0 percent and placing upward pressure on rents
across markets. Similarly, increasing consumer spending is driving more than 51.2 million square feet of industrial absorption year-to-date.

321,000 jobs were added in November, while revisions push up
YTD growth to 2.6 million 22
0,00
0
121,
000
120,
000
360,
000
226,
000
243,
000
96,0
00
110,
000
88,0
00
106,
000
122,
000
221,
000
183,
000
164,
000 19
6,00
0
360,
000
226,
000
243,
000
96,0
00
110,
000
88,0
00
160,
000
150,
000
161,
000
225,
000
203,
000
214,
000
197,
000
280,
000
141,
000
203,
000
199,
000
201,
000
149,
000
202,
000
164,
000
237,
000 27
4,00
0
84,0
00
144,
000
222,
000
201,
000
304,
000
202,
000
267,
000
243,
000
203,
000
271,
000
243,
000
321,
000
0
50,000
100,000
150,000
200,000
250,000
300,000
350,000
400,000
Oct
-10
Dec
-11
Feb
-11
Apr
-11
Jun-
11
Aug
-11
Oct
-11
Dec
-11
Feb
-12
Apr
-12
Jun-
12
Aug
-12
Oct
-12
Dec
-12
Feb
-13
Apr
-13
Jun-
13
Aug
-13
Oct
-13
Dec
-13
Feb
-14
Apr
-14
Jun-
14
Aug
-14
Oct
-14
1-m
onth
net
cha
nge
Source: JLL Research, Bureau of Labor Statistics
3

Unemployment remains stable at 5.8 percent as quits rise due
to an increase in worker confidence
0.0%
2.0%
4.0%
6.0%
8.0%
10.0%
12.0%
-1,000.0
-800.0
-600.0
-400.0
-200.0
0.0
200.0
400.0
600.0
2003 2004 2005 2006 2007 2008 2009 2010 2011 2012 2013 2014
Une
mpl
oym
ent
rate
(%
)
1-m
onth
net
cha
nge
(tho
usan
ds)
Monthly employment change Unemployment rate
Source: JLL Research, Bureau of Labor Statistics
4
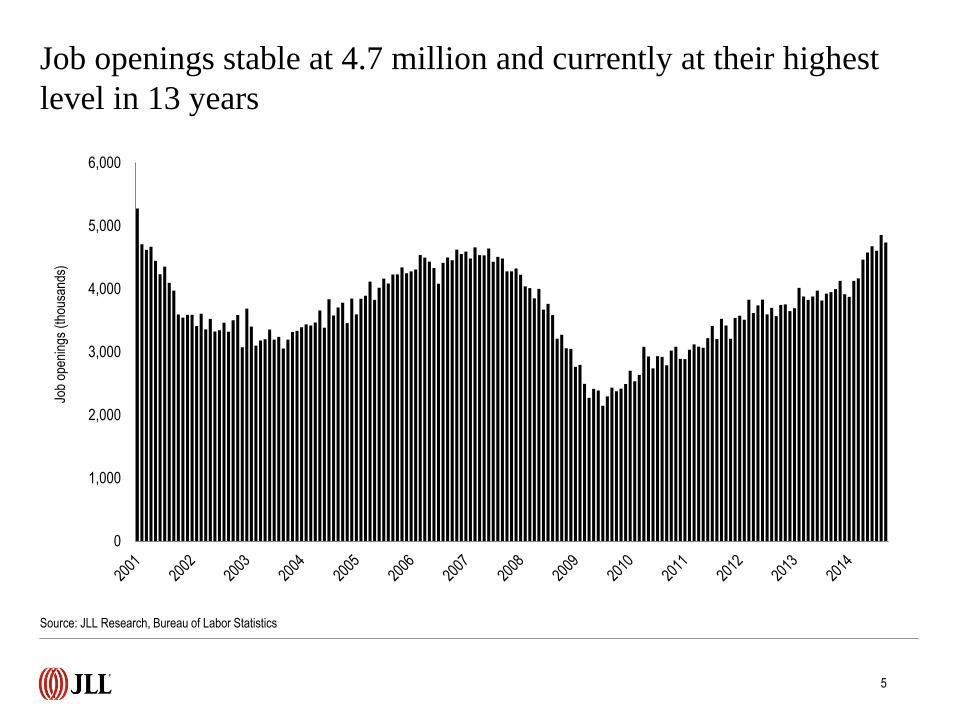
Job openings stable at 4.7 million and currently at their highest
level in 13 years
Source: JLL Research, Bureau of Labor Statistics
5
0
1,000
2,000
3,000
4,000
5,000
6,000
Job
open
ings
(th
ousa
nds)

0.0
1.4
2.5
3.0
4.0
7.0
11.0
15.0
16.7
17.0
20.0
20.0
22.7
28.0
32.0
37.2
38.0
50.2
86.0
-40 -20 0 20 40 60 80 100
Mining and logging
Utilities
Wholesale trade
Motor vehicles and parts
Information
Government
Nondurable goods
Other services
Transportation and warehousing
Durable goods
Financial activities
Construction
Temporary help services
Manufacturing
Leisure and hospitality
Health care and social assistance
Education and health services
Retail trade
Professional and business services
1-month net change (thousands)
Growth across the board contributed to gains in November, led
by a resurgence in office-using jobs, retail and manufacturing
Source: JLL Research, Bureau of Labor Statistics
6
PBS
Retail trade
Education and health
All other subsectors
Top three
subsectors
responsible for
54.3 percent of
monthly
growth.

2.0
3.2
13.0
37.4
44.0
68.0
68.0
106.8
114.0
142.5
158.0
171.0
213.0
233.6
290.0
364.9
377.0
429.0
696.0
0 200 400 600 800
Information
Utilities
Nondurable goods
Motor vehicles and parts
Mining and logging
Other services
Government
Wholesale trade
Financial activities
Transportation and warehousing
Durable goods
Manufacturing
Construction
Temporary help services
Retail trade
Health care and social assistance
Leisure and hospitality
Education and health services
Professional and business services
12-month net change (thousands)
PBS
Education and health
Leisure and hospitality
Retail trade
Manufacturing
Financial activities
All other jobs
PBS regained its position as the leader in annual growth; core
subsector share of gains remains around three-quarters
Source: JLL Research, Bureau of Labor Statistics
7
Core subsectors added 76.0 percent
of all jobs over the past 12 months.

-1,000
-800
-600
-400
-200
0
200
400
2008 2009 2010 2011 2012 2013 2014
Change in '000s jobs
Boosts in state and local government hiring are slowly pushing
up public sector two-year growth figures
Private sector hiring up 5.2
million since November 2012
Public sector hiring up 44,000
workers since October 2012
Source: JLL Research, Bureau of Labor Statistics
8

0
2
4
6
8
10
12
Une
mpl
oym
ent (
%)
Bachelor's degree and higher High school graduates, no college
As with overall unemployment, both white-collar and high-
school-graduate unemployment stable
3.2%
5.6%
Source: JLL Research, Bureau of Labor Statistics
9
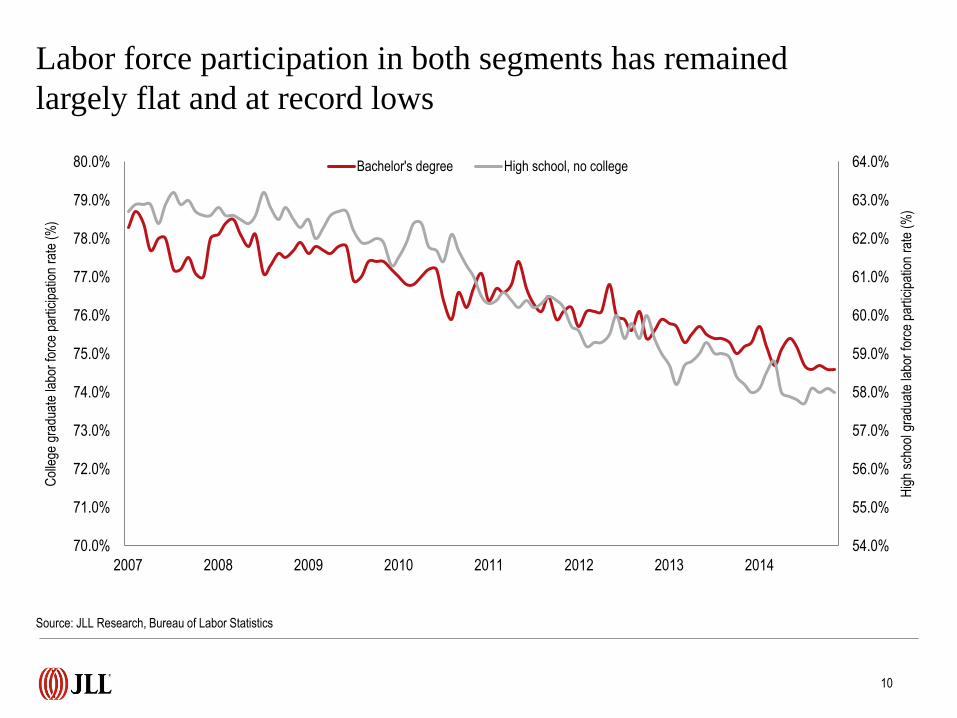
Labor force participation in both segments has remained
largely flat and at record lows
Source: JLL Research, Bureau of Labor Statistics
10
54.0%
55.0%
56.0%
57.0%
58.0%
59.0%
60.0%
61.0%
62.0%
63.0%
64.0%
70.0%
71.0%
72.0%
73.0%
74.0%
75.0%
76.0%
77.0%
78.0%
79.0%
80.0%
2007 2008 2009 2010 2011 2012 2013 2014
Hig
h sc
hool
gra
duat
e la
bor
forc
e pa
rtic
ipat
ion
rate
(%
)
Col
lege
gra
duat
e la
bor
forc
e pa
rtic
ipat
ion
rate
(%
)
Bachelor's degree High school, no college

For the first time during the recovery, service-providing growth
has surpassed 200,000 jobs for three consecutive months
-1,000.0
-800.0
-600.0
-400.0
-200.0
0.0
200.0
400.0
600.0
2008 2009 2010 2011 2012 2013 2014
1-m
onth
net
cha
nge
(tho
usan
ds)
Goods-producing Service-providing
Source: JLL Research, Bureau of Labor Statistics
11
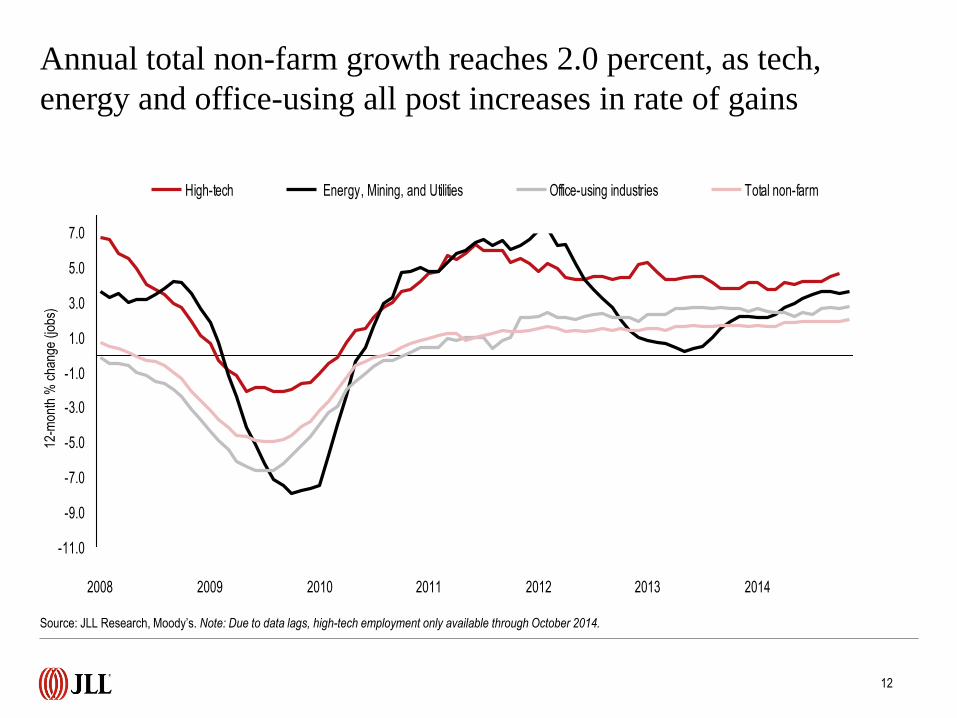
Annual total non-farm growth reaches 2.0 percent, as tech,
energy and office-using all post increases in rate of gains
-11.0
-9.0
-7.0
-5.0
-3.0
-1.0
1.0
3.0
5.0
7.0
2008 2009 2010 2011 2012 2013 2014
High-tech Energy, Mining, and Utilities Office-using industries Total non-farm
Source: JLL Research, Moody’s. Note: Due to data lags, high-tech employment only available through October 2014.
12
12-m
onth
% c
hang
e (jo
bs)
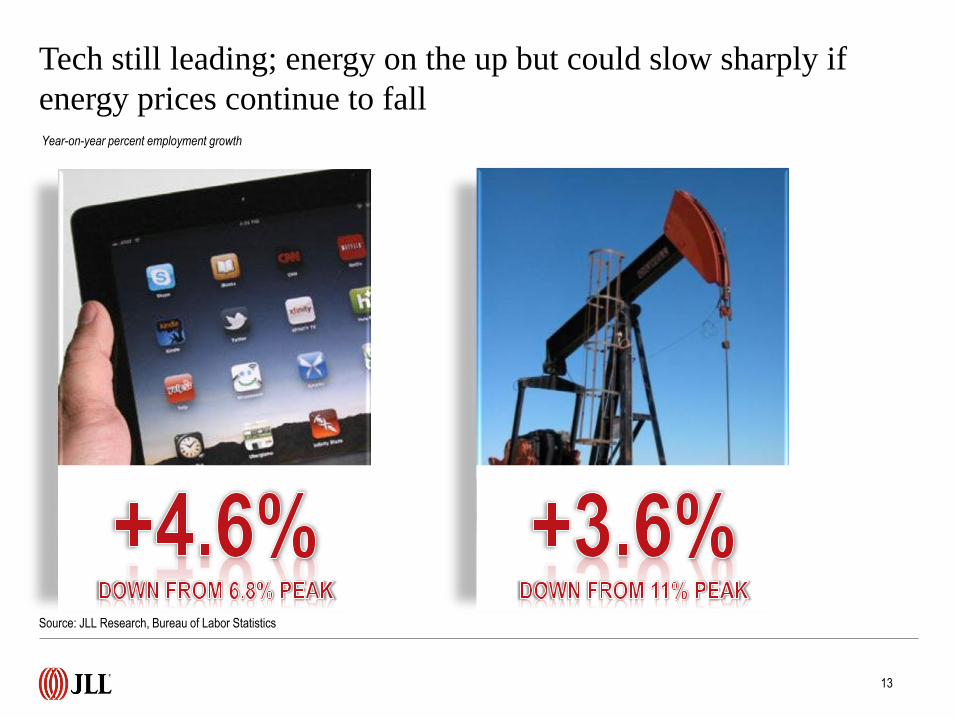
Tech still leading; energy on the up but could slow sharply if
energy prices continue to fall Year-on-year percent employment growth
Source: JLL Research, Bureau of Labor Statistics
13

Unemployment insurance claims nudge upward slightly and
currently rest right below 300,000 per week on average
Source: JLL Research, U.S. Department of Labor
14
200,000
250,000
300,000
350,000
400,000
450,000
500,000
550,000
600,000
650,000
700,000
Cla
ims
Initial claims 4-week moving average

0%
2%
4%
6%
8%
10%
12%
0
10
20
30
40
50
60
70
80
90
100
2008 2009 2010 2011 2012 2013 2014
Une
mpl
oym
ent
rate
(%
)
Con
sum
er c
onfid
ence
inde
x
Consumer confidence index
Unemployment rate
Consumer confidence falls to 88.7 points after a rapid increase
to 94.1 in October, but still remains near recovery highs
Source: JLL Research, Conference Board, Bureau of Labor Statistics
15
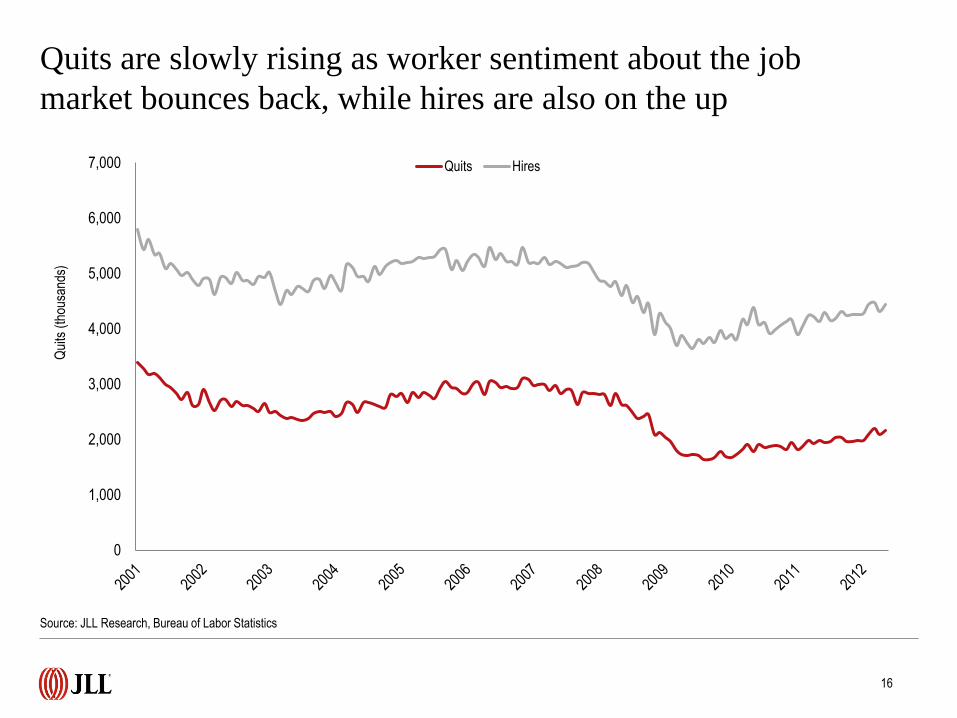
Quits are slowly rising as worker sentiment about the job
market bounces back, while hires are also on the up
Source: JLL Research, Bureau of Labor Statistics
16
0
1,000
2,000
3,000
4,000
5,000
6,000
7,000
Qui
ts (
thou
sand
s)
Quits Hires
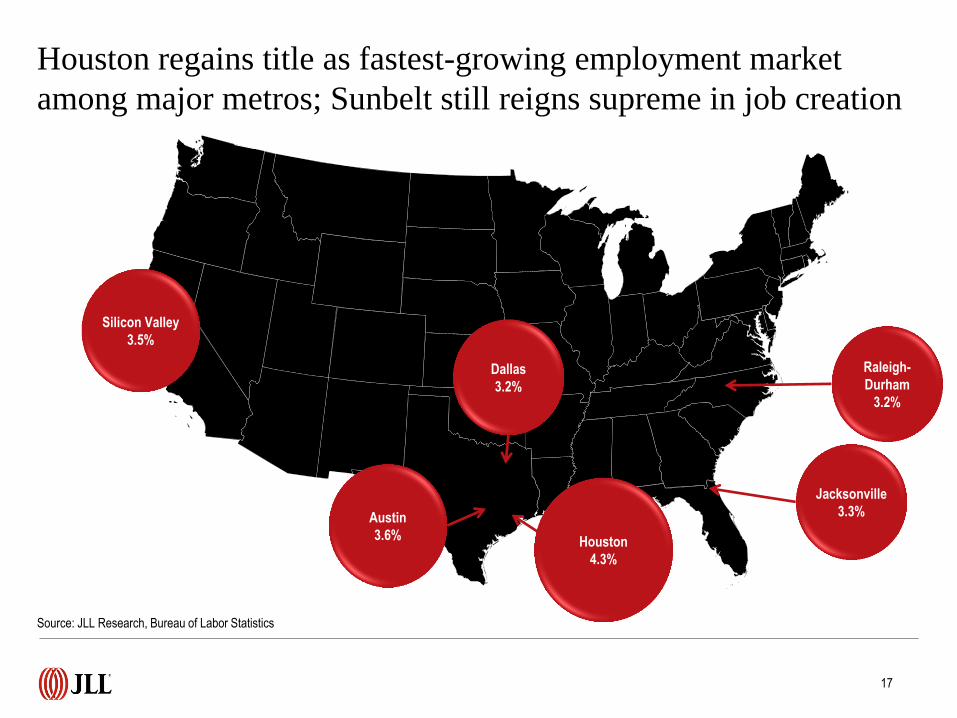
Houston regains title as fastest-growing employment market
among major metros; Sunbelt still reigns supreme in job creation
Source: JLL Research, Bureau of Labor Statistics
17
Dallas
3.2%
Houston
4.3%
Austin
3.6%
Jacksonville
3.3%
Raleigh-
Durham
3.2%
Silicon Valley
3.5%

Some East Coast and Midwestern markets are still posting
job growth below 0.5 percent year-on-year, however
18
Source: JLL Research, Bureau of Labor Statistics
Detroit
0.3%
Washington,
DC
0.3%
New Jersey
0.1%
Kansas City
0.5%
Columbus
-0.7%
Hampton
Roads
0.5%

The labor force participation rate stayed flat a near-recovery
low of 62.8 percent, contributing to declines in unemployment
Source: JLL Research, Bureau of Labor Statistics
19
60.0%
61.0%
62.0%
63.0%
64.0%
65.0%
66.0%
67.0%
2008 2009 2010 2011 2012 2013 2014
Labo
r fo
rce
part
icip
atio
n ra
te (
%)
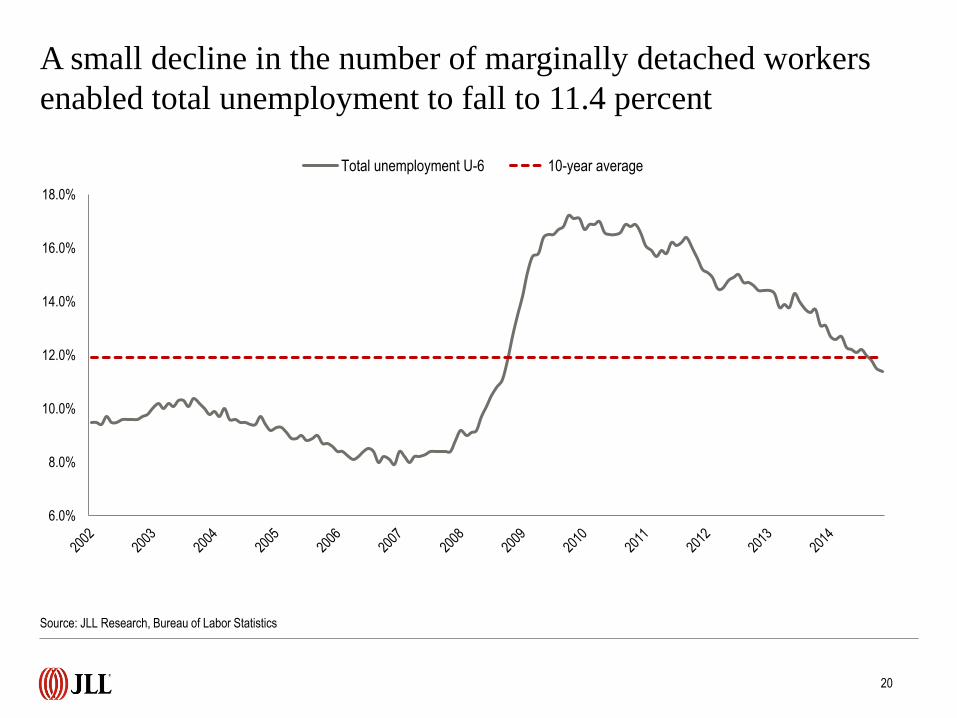
A small decline in the number of marginally detached workers
enabled total unemployment to fall to 11.4 percent
6.0%
8.0%
10.0%
12.0%
14.0%
16.0%
18.0%
Total unemployment U-6 10-year average
Source: JLL Research, Bureau of Labor Statistics
20

Jumps in PBS and financial activities hiring meant that
office-using industries accounted for one-third of new jobs
Source: JLL Research, Bureau of Labor Statistics
21
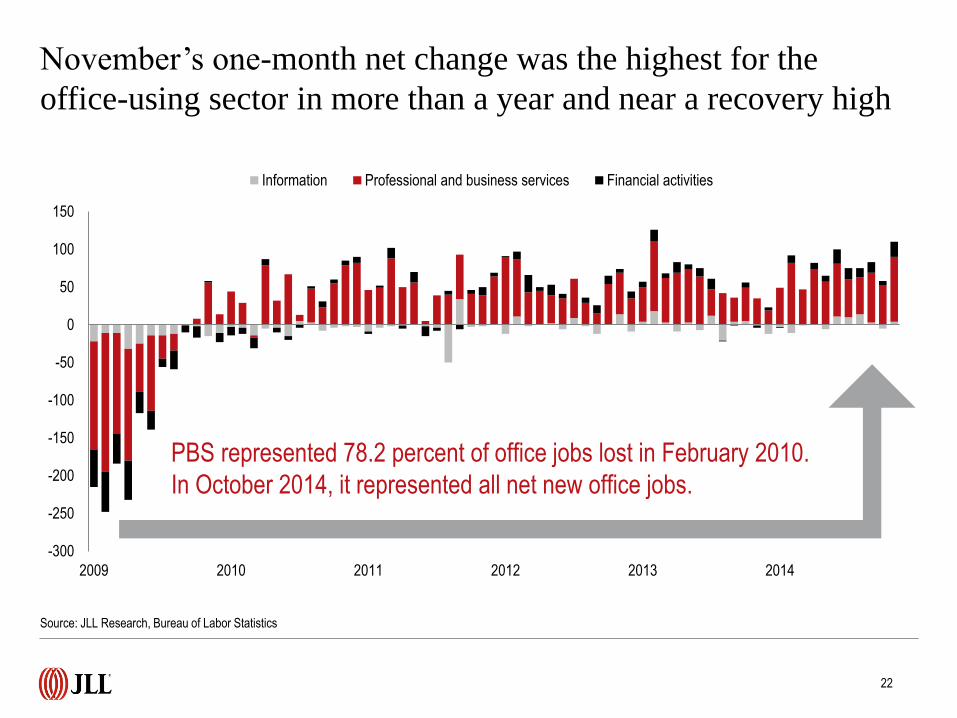
November’s one-month net change was the highest for the
office-using sector in more than a year and near a recovery high
-300
-250
-200
-150
-100
-50
0
50
100
150
2009 2010 2011 2012 2013 2014
Information Professional and business services Financial activities
PBS represented 78.2 percent of office jobs lost in February 2010.
In October 2014, it represented all net new office jobs.
Source: JLL Research, Bureau of Labor Statistics
22

Temporary help services is still on its way to 3.0 million jobs,
but rate of growth slightly slower and more stable
1,000.0
1,500.0
2,000.0
2,500.0
3,000.0
3,500.0
-100.0
-80.0
-60.0
-40.0
-20.0
0.0
20.0
40.0
60.0
80.0
2009 2010 2011 2012 2013 2014
Mon
thly
net
cha
nge
in jo
bs (
ths)
Temporary employment monthly net change Temporary employment
Temporary em
ployment (ths)
Source: JLL Research, Bureau of Labor Statistics
23
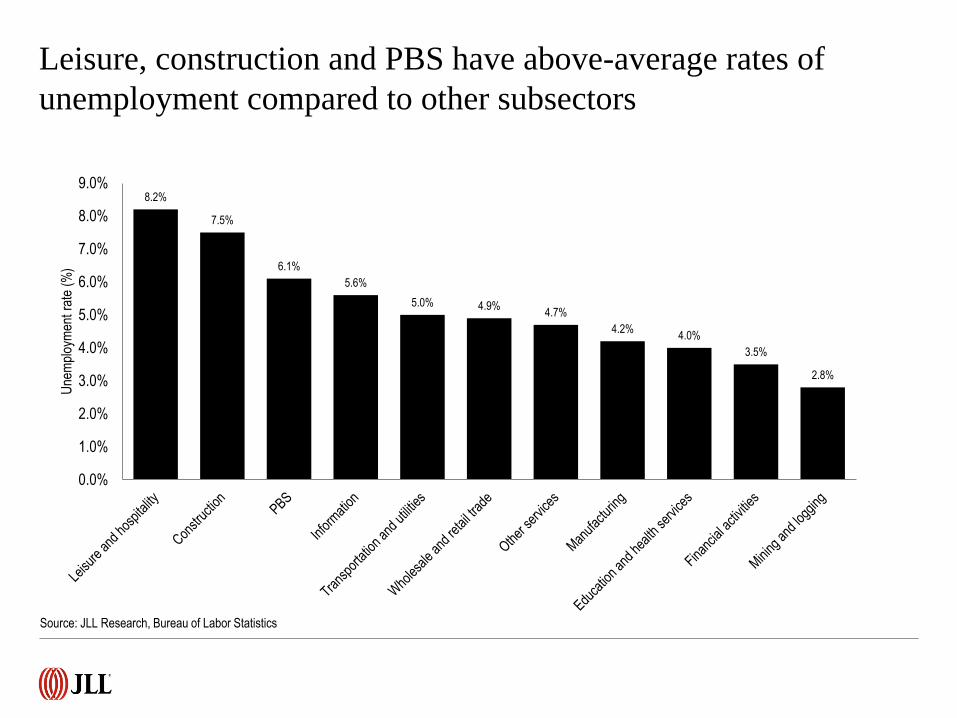
Leisure, construction and PBS have above-average rates of
unemployment compared to other subsectors
8.2%
7.5%
6.1%
5.6%
5.0% 4.9% 4.7%
4.2% 4.0%
3.5%
2.8%
0.0%
1.0%
2.0%
3.0%
4.0%
5.0%
6.0%
7.0%
8.0%
9.0%
Une
mpl
oym
ent
rate
(%
)
Source: JLL Research, Bureau of Labor Statistics

©2014 JLL Research IP, Inc. All rights reserved. All information contained herein is from sources deemed reliable; however, no representation or warranty is made to the accuracy thereof.
For more information, please contact:
Ben Breslau
Managing Director - Americas Research
John Sikaitis
Managing Director - Office and Local Markets Research
Phil Ryan
Research Analyst
Or, find more employment, business and real
estate research at jll.com.
>>> Click here to check it out.


