Using Data to Tell the Child Support Story
Denise Okamoto COUNTY OF ORANGE
DEPARTMENT OF CHILD SUPPORT SERVICES
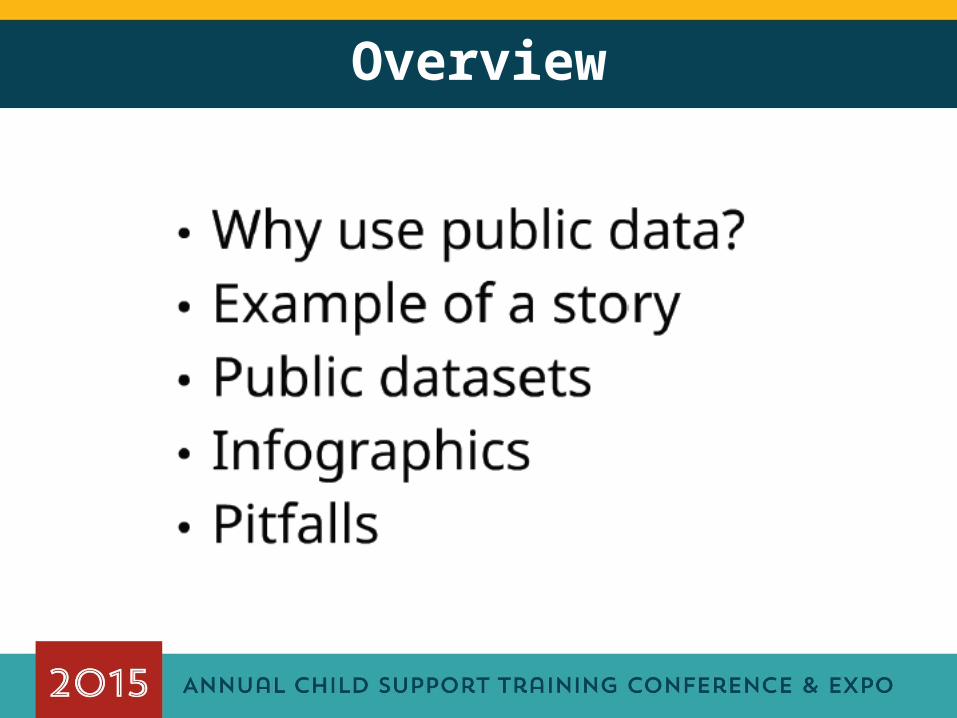
Overview
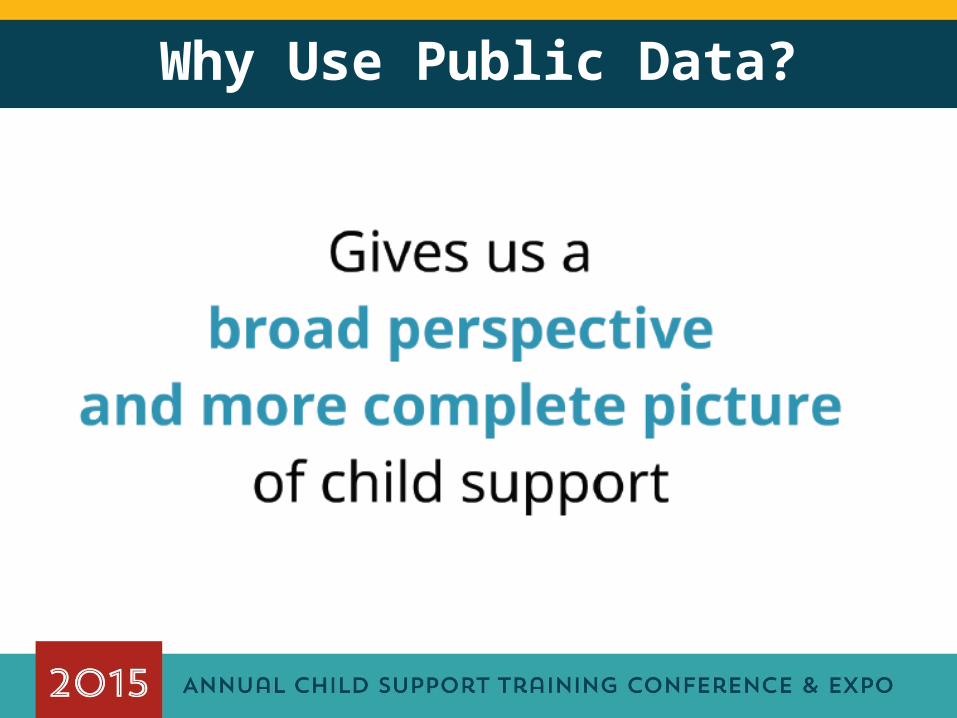
Why Use Public Data?
Public Datasets
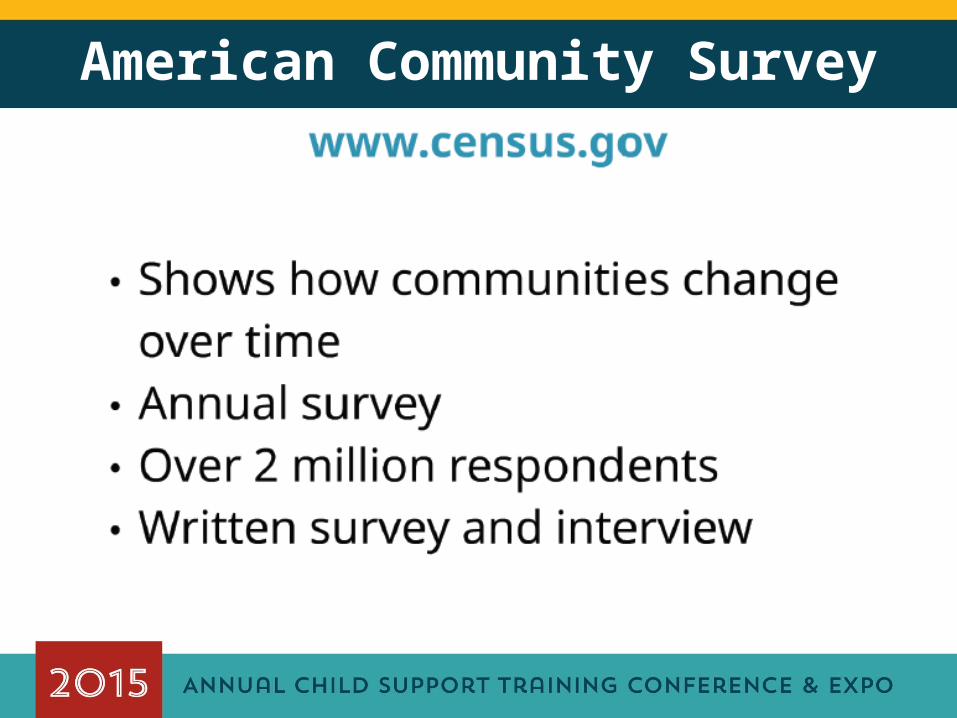
American Community Survey
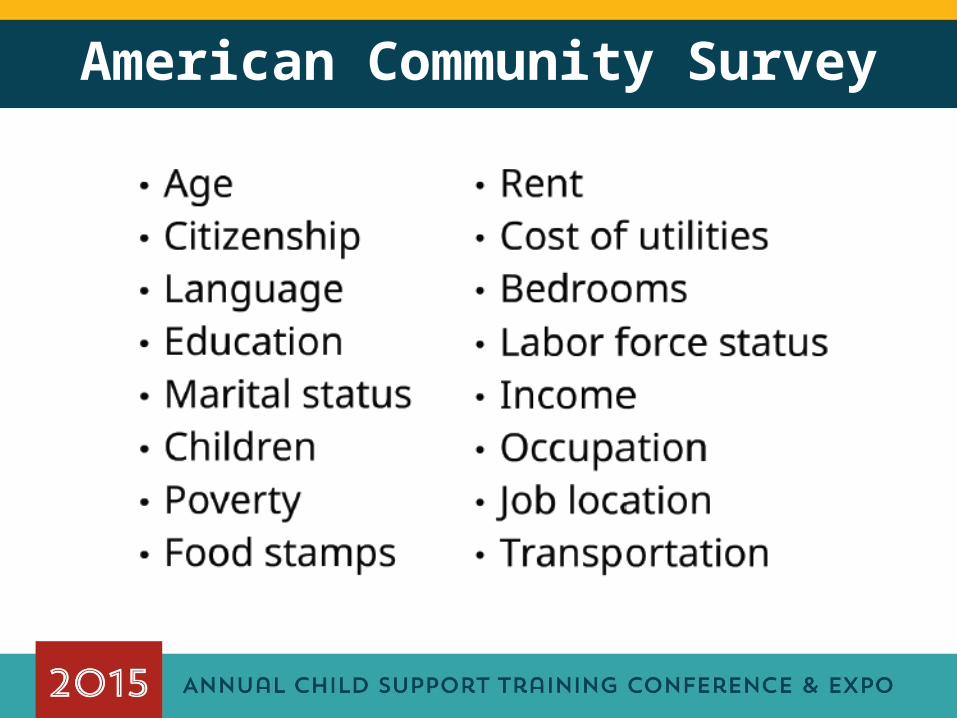
American Community Survey
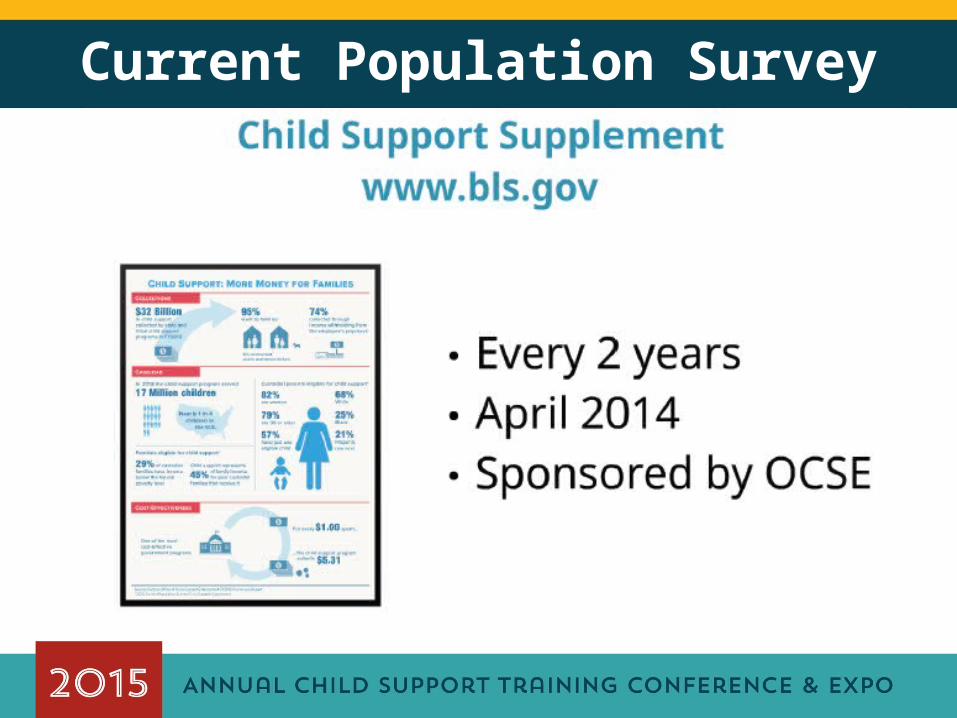
Current Population Survey
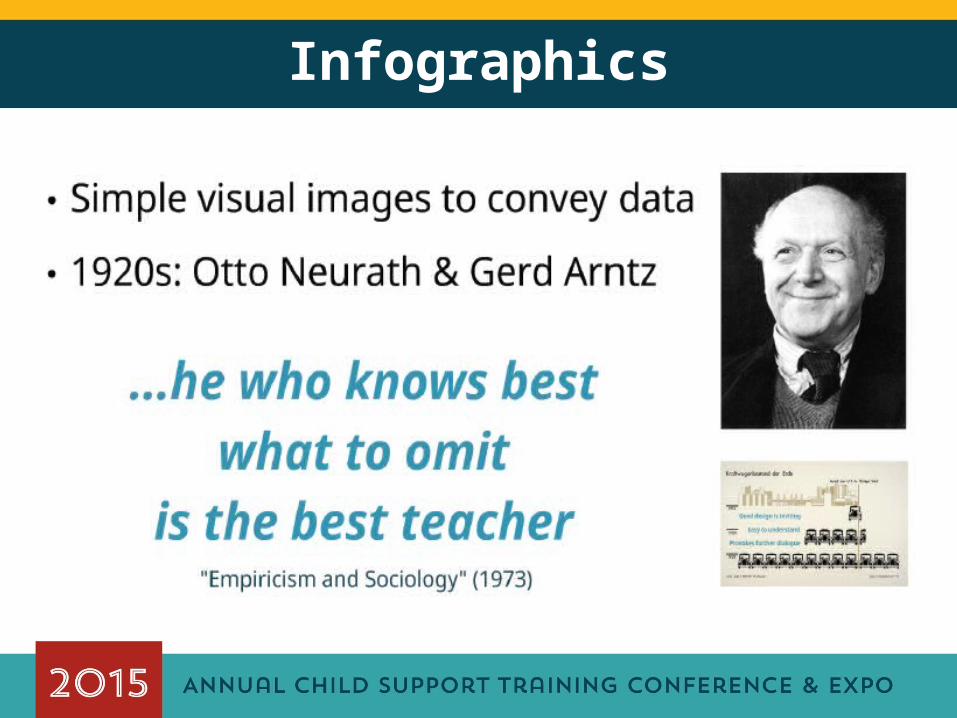
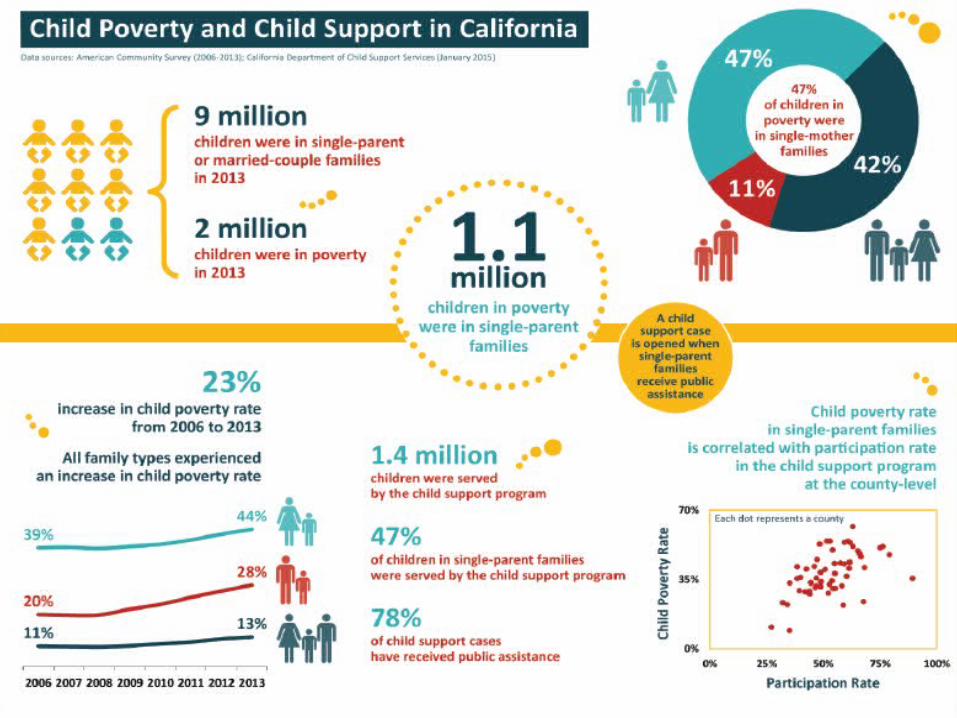
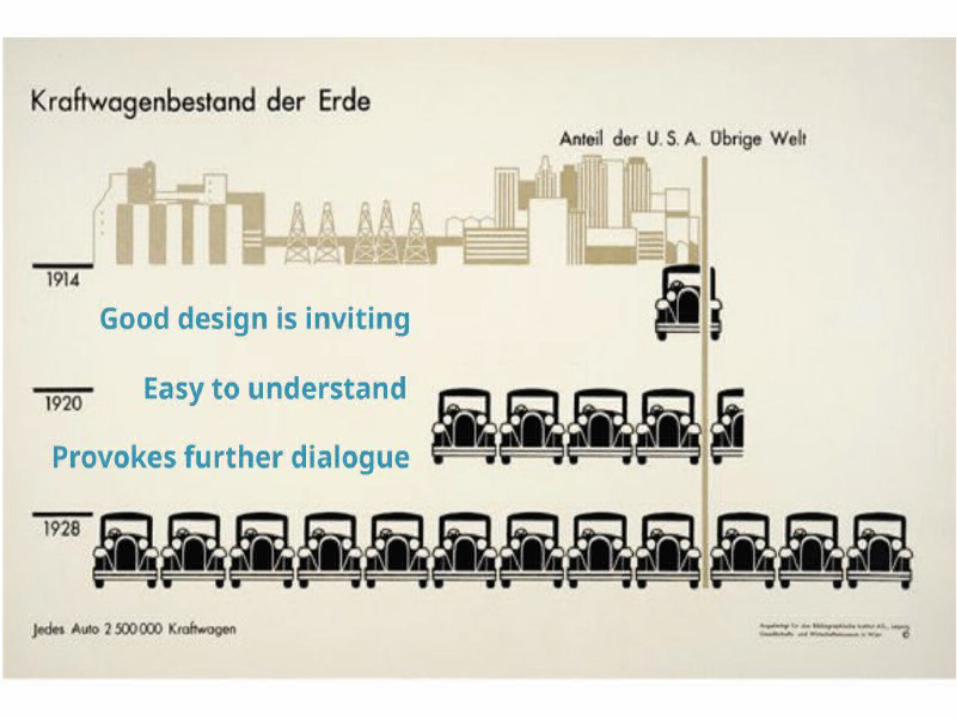
Infographics
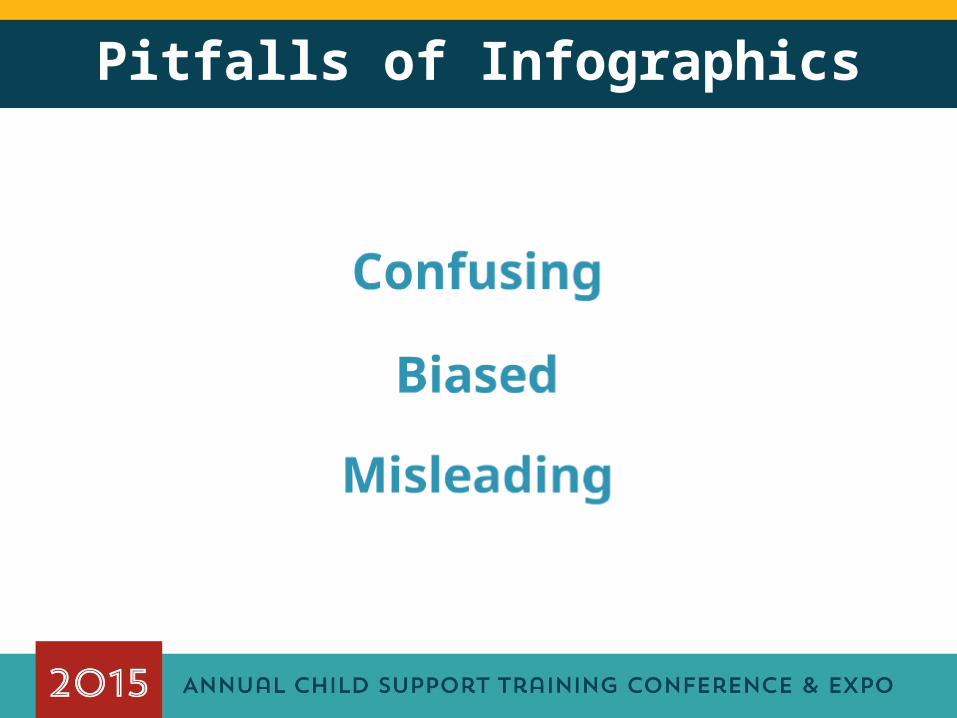
Pitfalls of Infographics
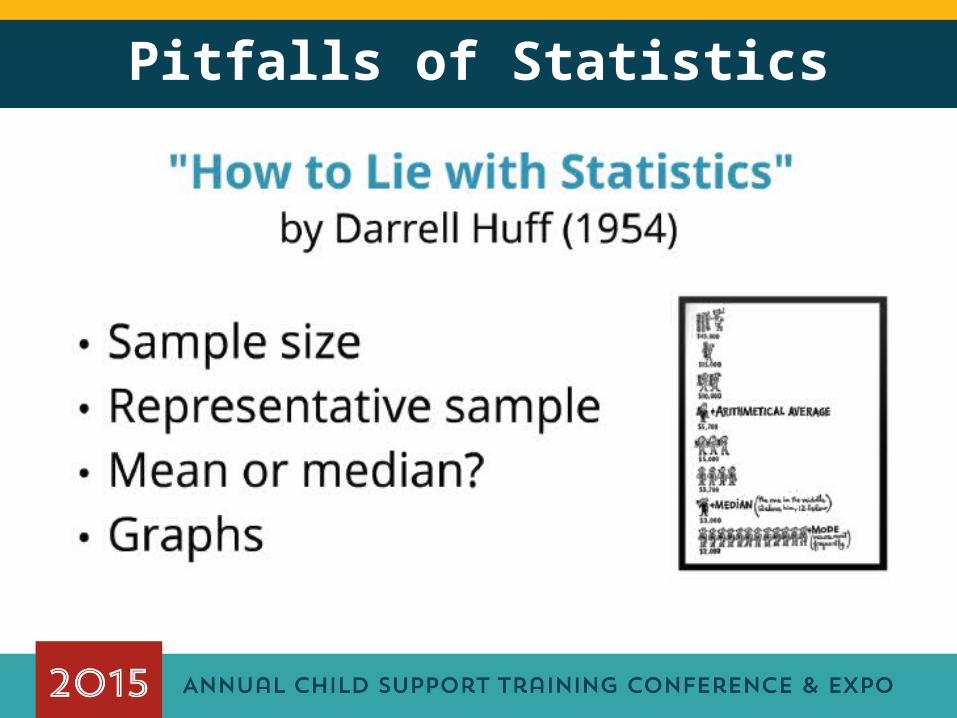
Pitfalls of Statistics
Take Aways
Using Data to Tell the Child Support Story
Ben Rutherford
Departmental Analyst
Kern DCSS
GISX
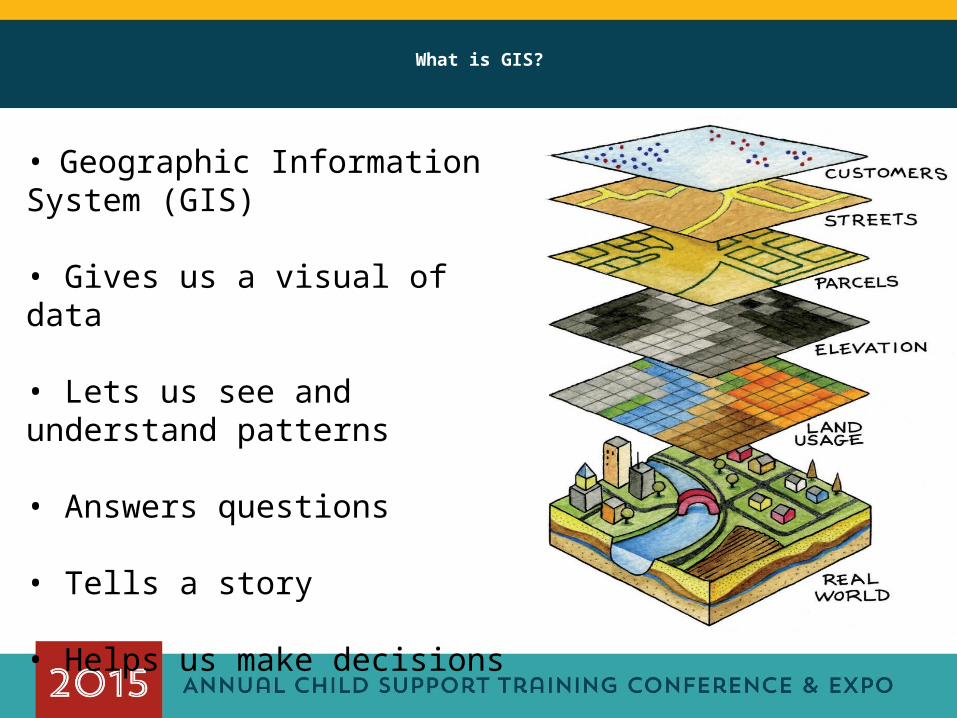
What is GIS?
• Geographic Information System (GIS)
• Gives us a visual of data
• Lets us see and understand patterns
• Answers questions
• Tells a story
• Helps us make decisions
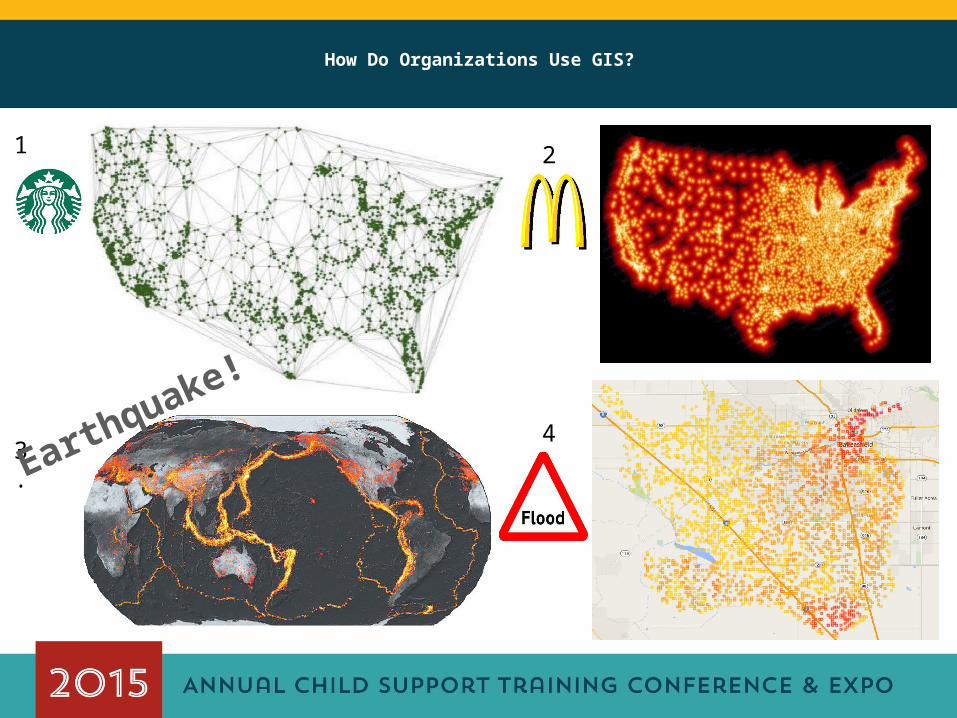
How Do Organizations Use GIS?
1. 2.
3.4.
Earthquake!
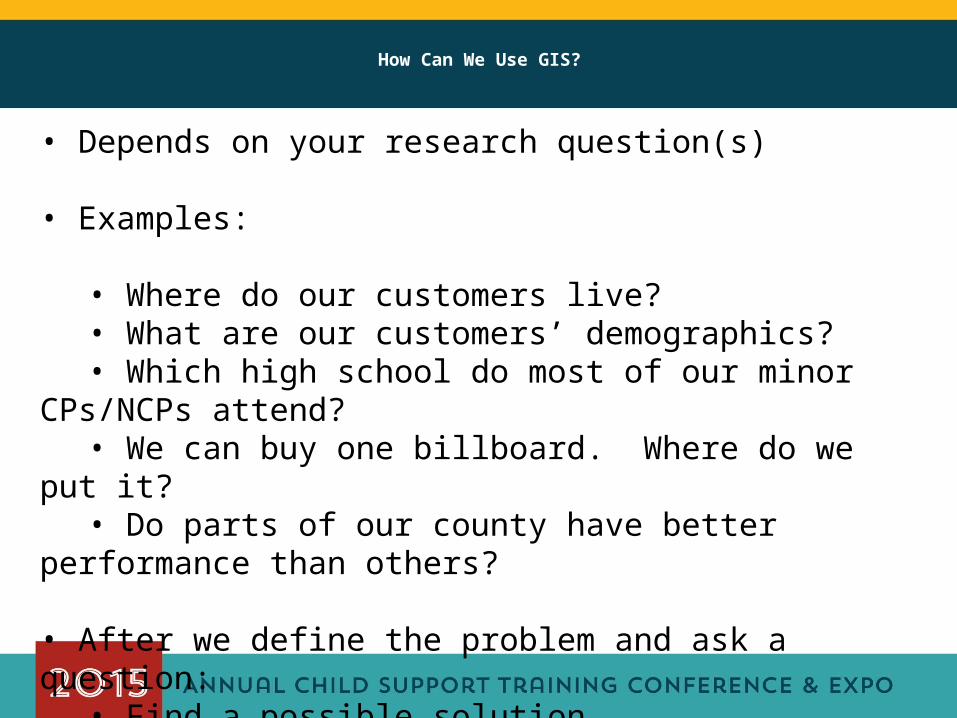
How Can We Use GIS?
• Depends on your research question(s)
• Examples:
• Where do our customers live?• What are our customers’ demographics?• Which high school do most of our minor CPs/NCPs
attend?• We can buy one billboard. Where do we put it?• Do parts of our county have better performance than
others?
• After we define the problem and ask a question:• Find a possible solution• Make a decision
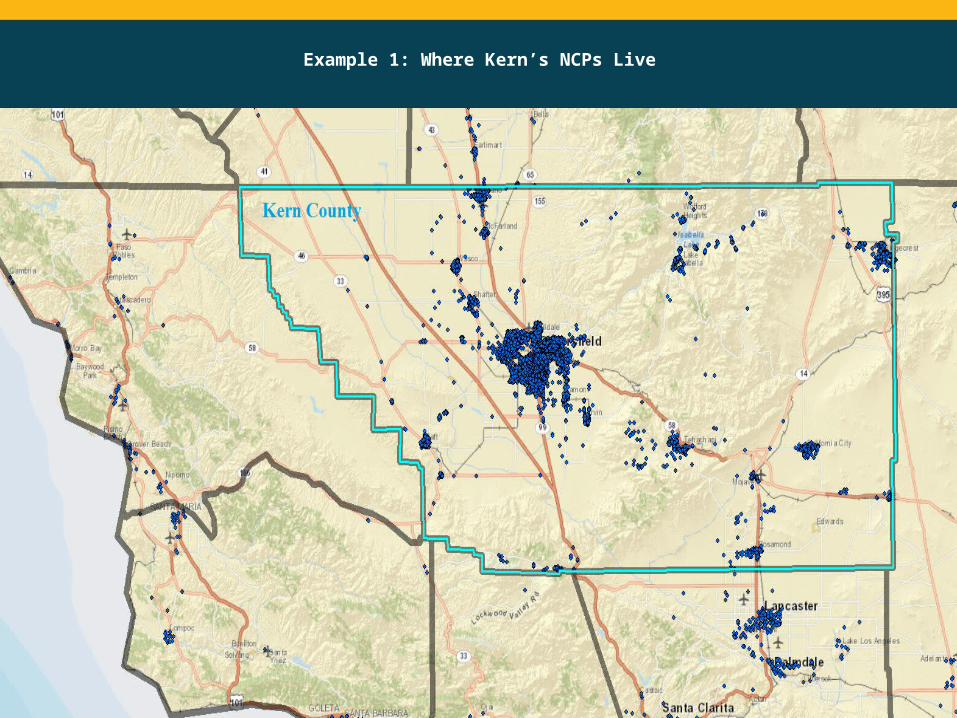
Example 1: Where Kern’s NCPs Live
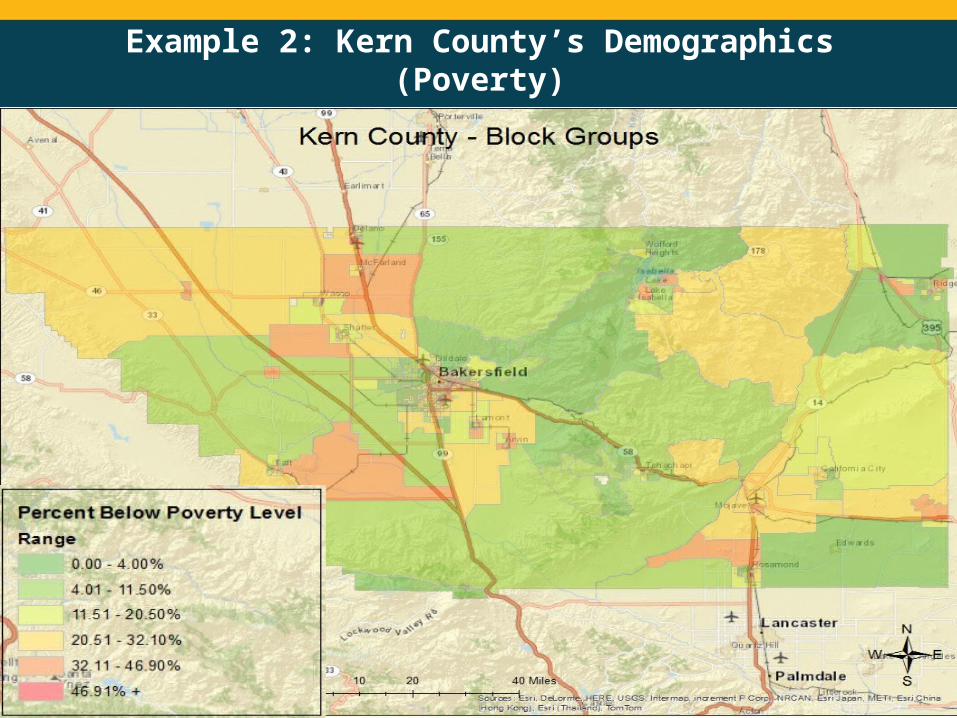
Example 2: Kern County’s Demographics (Poverty)
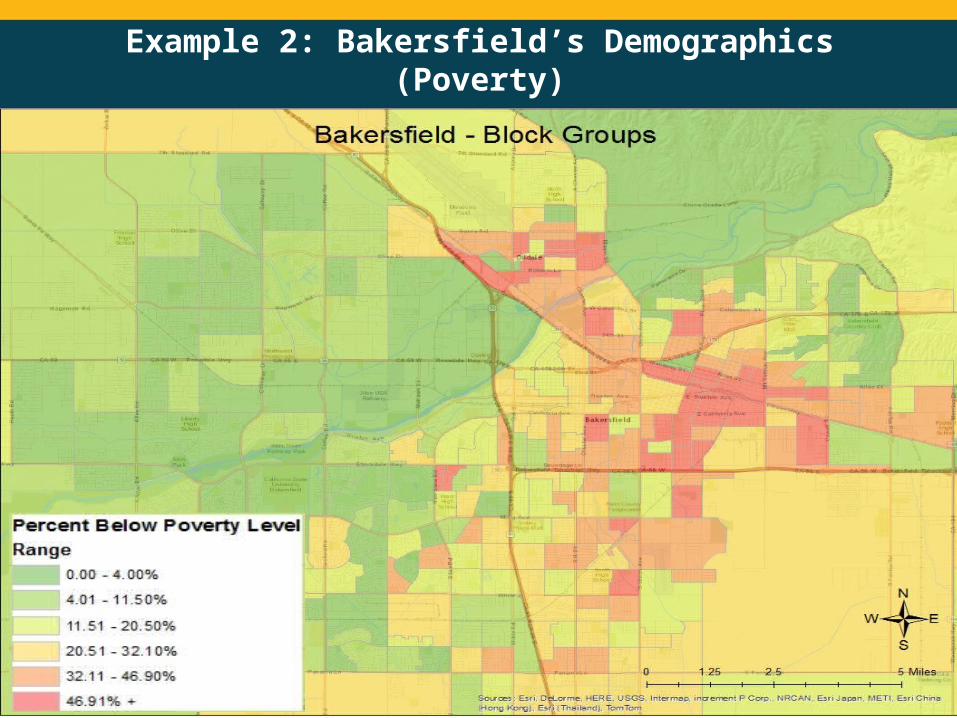
Example 2: Bakersfield’s Demographics (Poverty)
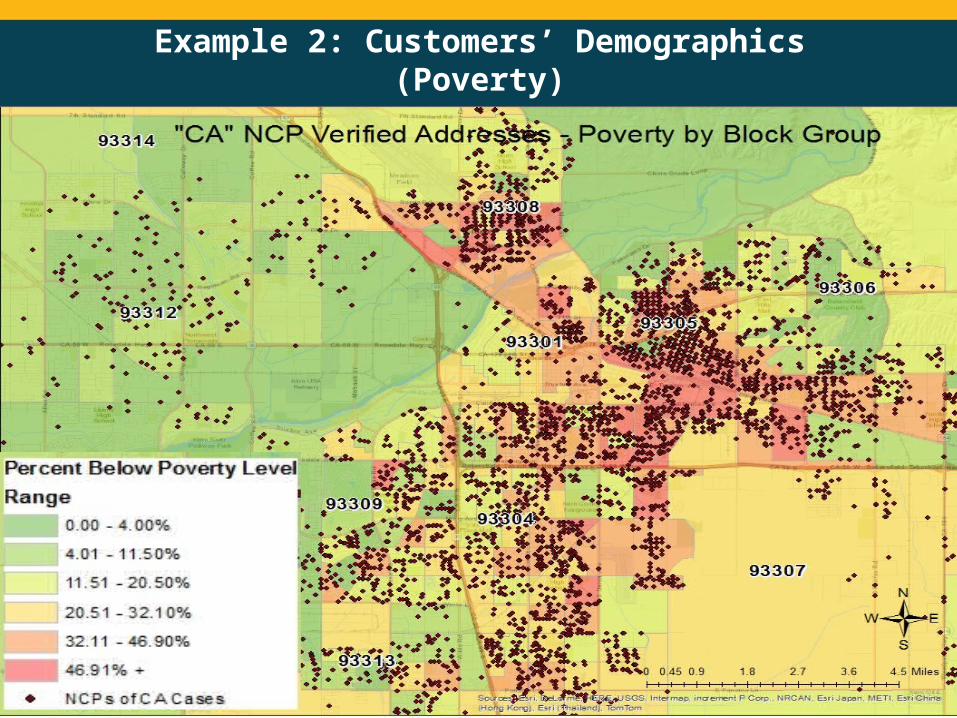
Example 2: Customers’ Demographics (Poverty)
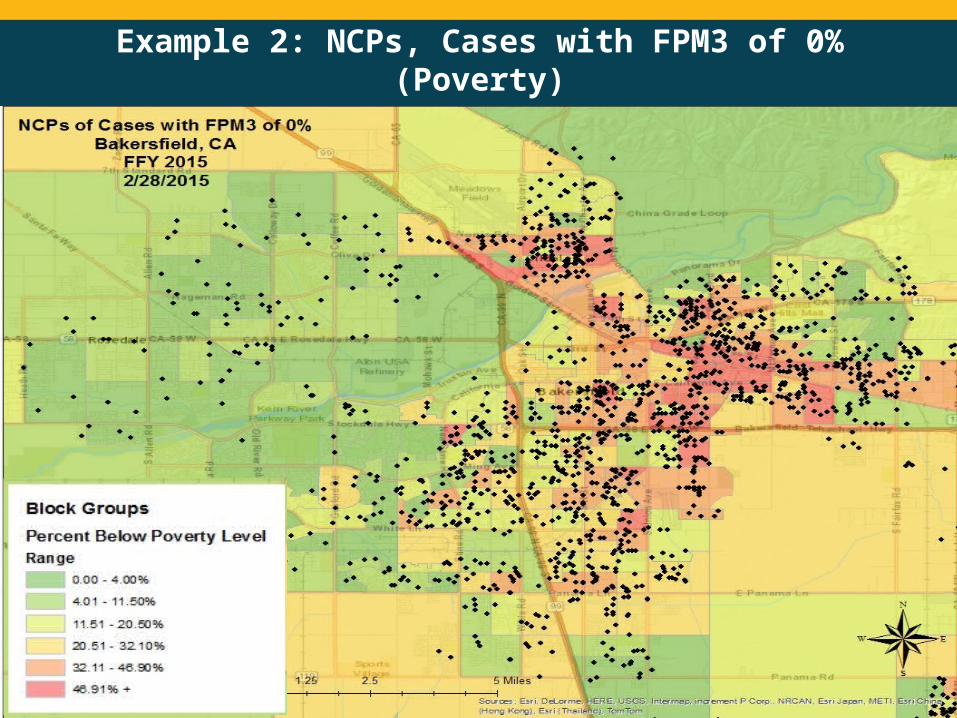
Example 2: NCPs, Cases with FPM3 of 0% (Poverty)
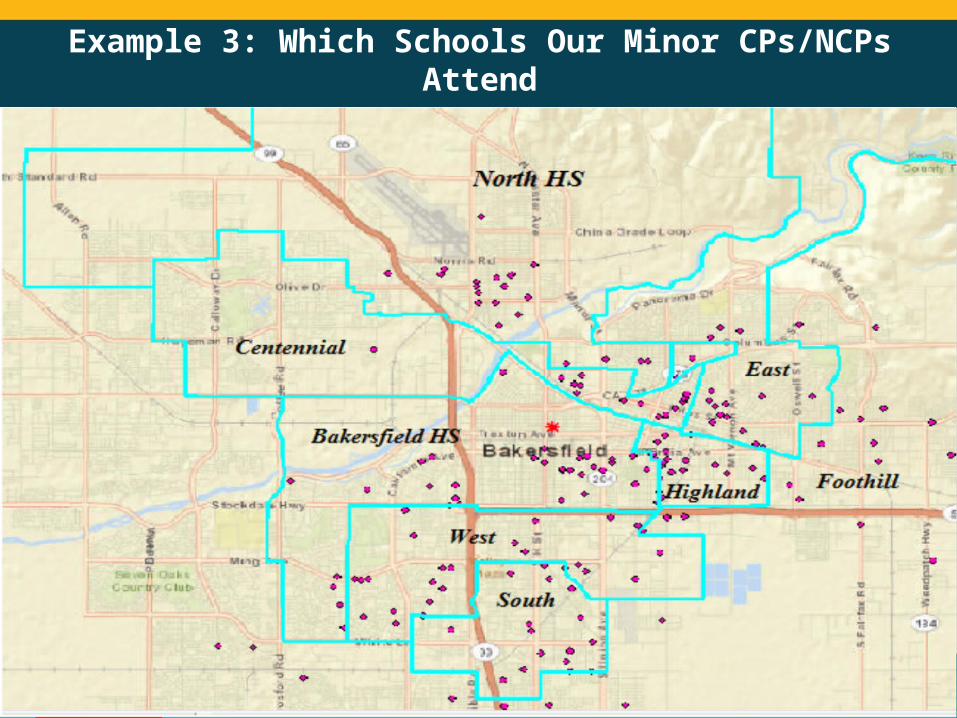
Example 3: Which Schools Our Minor CPs/NCPs Attend
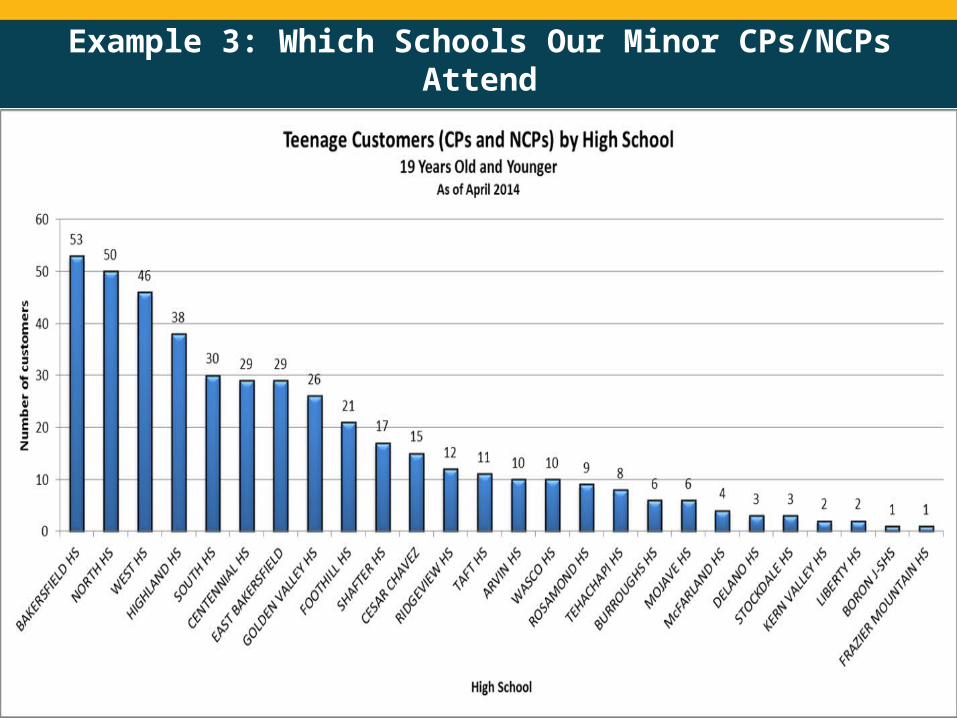
Example 3: Which Schools Our Minor CPs/NCPs Attend
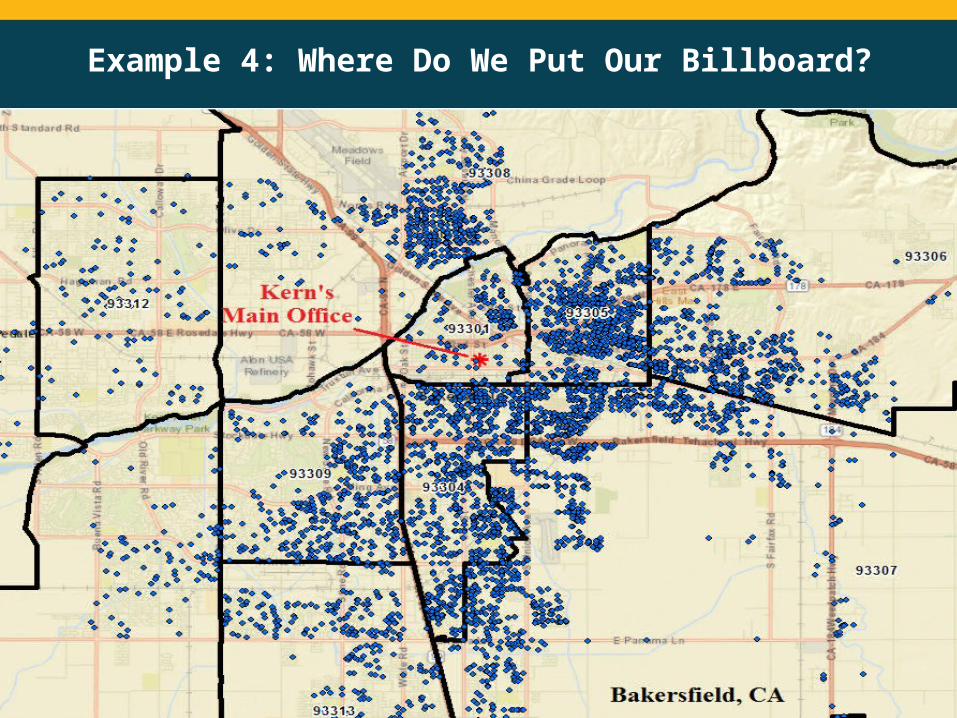
Example 4: Where Do We Put Our Billboard?
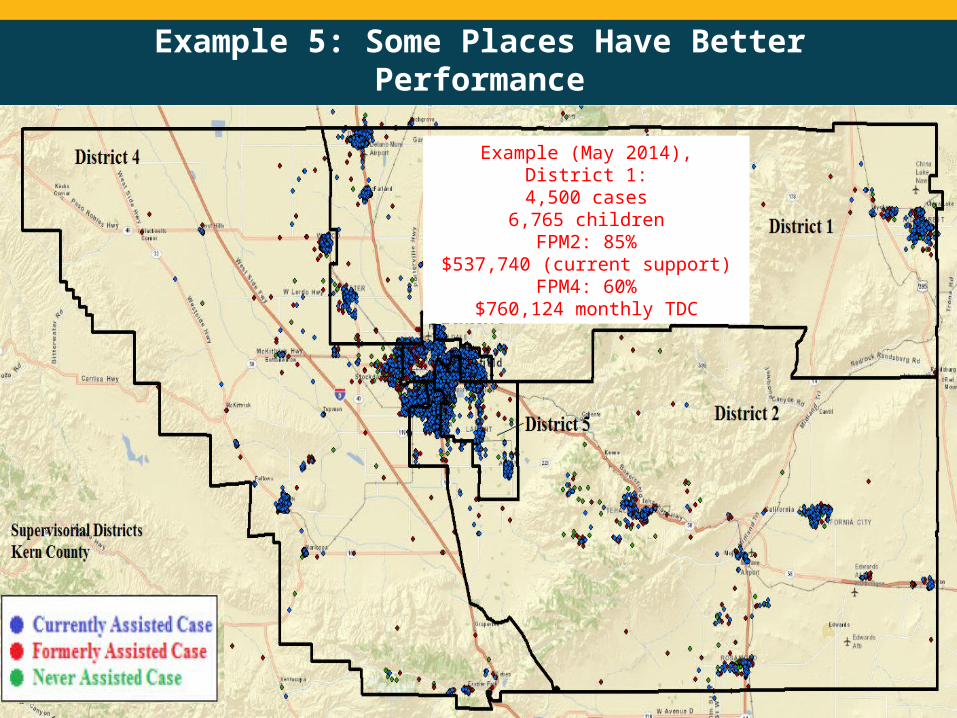
Example 5: Some Places Have Better Performance
Example (May 2014), District 1:4,500 cases
6,765 childrenFPM2: 85%
$537,740 (current support)FPM4: 60%
$760,124 monthly TDC


![Order Child Support Guidelines Amendments to Child Support ... · Use of the Child Support Guidelines As a Rebuttable Presumption [No changes.] 3. ... child support award only when](https://cdn.vdocuments.net/doc/165x107/5fda9d8a0c3f33644e6c74bd/order-child-support-guidelines-amendments-to-child-support-use-of-the-child.jpg)

