
Vacant and Abandoned Property Neighborhood Revitalization Study
Prepared by:
300 Montgomery Street, Suite 203
Alexandria, VA 22314
Tel: 703.739.0965
Fax: 703.739.0979
Prepared for:
Louisville Metro Government
Mayor Greg Fischer
Metro Hall, 4th Floor
527 West Jefferson Street
Louisville, KY 40202

VAP Neighborhood Revitalization Study
TABLE OF CONTENTS
Table of Contents EXECUTIVE SUMMARY .............................................................................................................................. ES-1 A. Executive Summary1. Introduction ................................................................................................................................................................... ES-1 2. Vacant and Abandoned Property and Underlying Factors ............................................................................... ES-1 3. Demographics and Economic Trends ....................................................................................................................... ES-1 4. Housing Characteristics and Conditions .................................................................................................................. ES-3 5. Housing Affordability ................................................................................................................................................. ES-3 6. Neighborhood Marketability ................................................................................................................................... ES-4 7. Return on Public Investment ....................................................................................................................................... ES-4 8. Early Intervention and Long-term Recommendations ........................................................................................... ES-7
Section 1: STUDY OVERVIEW STUDY OVERVIEW .................................................................................................................................. 1-1 A.1. Introduction ..................................................................................................................................................................... 1-1 2. Comprehensive Approach to Neighborhood Revitalization ................................................................................. 1-1 3. Objectives of the VAP Study ...................................................................................................................................... 1-2 4. Key Strategy Elements ................................................................................................................................................. 1-2 5. Methodology and Approach ...................................................................................................................................... 1-2 6. VAP Study Review Process .......................................................................................................................................... 1-4 7. Report Contents ............................................................................................................................................................. 1-4
Section 2: KEY IMPLEMENTATION RECOMMENDATIONS KEY IMPLEMENTATION RECOMMENDATIONS ...................................................................................... 2-1 A.1.1 Element 1 - Organizational Structure and Administrative Actions ................................................................... 2-1 1.2 Element 2 - Comprehensive Neighborhood Revitalization, Planning and Capacity Building..................... 2-4 1.3 Element 3 - Legislative Initiatives ......................................................................................................................... 2-11 1.4 Element 4 - Housing Rehabilitation, Construction, Demolition and Catalyst Development ....................... 2-11 1.5 Element 5 - Funding ............................................................................................................................................... 2-14
VAP EARLY INTERVENTION AND LONG-TERM IMPLEMENTATION MATRIX ...................................... 2-15 B.
Section 3: DEMOGRAPAHIC AND ECONOMIC TRENDS A. DEMOGRAPHIC TRENDS AND CHARACTERISTICS ................................................................................ 3-1 1. Introduction and Methodology ................................................................................................................................... 3-1 2. Population and Household Trends ............................................................................................................................. 3-2 3. Implications ..................................................................................................................................................................... 3-4
B. ECONOMIC BASE TRENDS ..................................................................................................................... 3-5 1. Employment Trends ....................................................................................................................................................... 3-5 2. Establishment Trends ..................................................................................................................................................... 3-6 3. Implications ..................................................................................................................................................................... 3-7

VAP Neighborhood Revitalization Study
TABLE OF CONTENTS
Section 4: HOUSING CHARACTERISTICS AND CONDITIONS ................................................................................. 4-1 A. HOUSING CHARACTERISTICS AND CONDITIONS1. Housing Profile .............................................................................................................................................................. 4-1 2. Housing Condition Analysis ......................................................................................................................................... 4-4 3. Assessed Value Analysis .............................................................................................................................................. 4-8 ................................................................................................ 4-10 B. HOUSING AFFORDABILITY ANALYSIS 1. Methodology .............................................................................................................................................................. 4-10 2. Affordability Analysis ............................................................................................................................................... 4-11 3. Implications .................................................................................................................................................................. 4-15 ............... 4-16 C. HISTORIC PRESERVATION AND PROBLEMS OF VACANT AND ABANDONED PROPERTIES1. Introduction .................................................................................................................................................................. 4-16 2. Existing Local Policies ................................................................................................................................................ 4-16 3. Best Practices and Recommendations .................................................................................................................... 4-18 4. Implications .................................................................................................................................................................. 4-20
Section 5: THE VACANT AND ABANDONED PROPERTY PROBLEMS ..................................................................... 5-1 A. THE VACANT AND ABANDONED PROPERTY PROBLEMS1. Characterization of the Louisville VAP Problem ..................................................................................................... 5-1 2. Identification of Marketable Areas and Real Estate Assets ................................................................................. 5-2 3. Need for Administrative, Legal and Legislative Initiatives ................................................................................... 5-3 4. Implications ..................................................................................................................................................................... 5-4
Section 6: NEIGHBORHOOD MARKETABILITY ANALYSIS A. NEIGHBORHOOD MARKETABILITY ANALYSIS ...................................................................................... 6-1
1. Introduction ..................................................................................................................................................................... 6-1
2. Marketability Factors ................................................................................................................................................... 6-3
3. Neighborhood Marketability Findings ...................................................................................................................... 6-6
B. REAL ESTATE MARKET ACTIVITY ......................................................................................................... 6-11
1. Residential Development Trends ............................................................................................................................. 6-11
2. Residential Sales Analysis ........................................................................................................................................ 6-13
3. Residential Sales Price Analysis .............................................................................................................................. 6-14
4. Demolitions .................................................................................................................................................................. 6-17
5. Multi-Family Rental Analysis .................................................................................................................................... 6-17
C. PUBLIC INVESTMENT STRATEGY AND TARGETING AREAS FOR REVITALIZATION ............................ 6-20
1. Introduction .................................................................................................................................................................. 6-20
2. Targeting Ares of Marketability ............................................................................................................................. 6-20
3. Methodology .............................................................................................................................................................. 6-21
4. Potential Revitalization Areas................................................................................................................................. 6-23
5. Implications .................................................................................................................................................................. 6-24

VAP Neighborhood Revitalization Study
TABLE OF CONTENTS
Section 7: RETURN ON PUBLIC INVESTMENT MODEL A. PUBLIC RETURN ON INVESTMENT MODEL ............................................................................................ 7-1
1. Introduction ..................................................................................................................................................................... 7-1
2. Methodology and Approach ...................................................................................................................................... 7-1
................................................................................. 7-4 B. PUBLIC INTERVENTION METHODS AND METRICS1. Code Enforcement Inspections, Maintenance & Judicial Measures ..................................................................... 7-4
2. Pre-Development Activities ......................................................................................................................................... 7-5
.................................................................................... 7-7 C. MEASURING PUBLIC RETURN ON INVESTMENT1. Tax Base and Revenue Sources ................................................................................................................................. 7-7
2. Economic Development.............................................................................................................................................. 7-11
3. Private Sector Leverage ........................................................................................................................................... 7-11
.......................................................................................... 7-12 D. PUBLIC RETURN ON INVESTMENT MODEL1. Purpose and Need..................................................................................................................................................... 7-12
2. Locational Differences ............................................................................................................................................... 7-12
3. Baseline Maintenance Scenario .............................................................................................................................. 7-12
4. Intervention Scenario ............................................................................................................................................... 7-12
5. ROI Model Scenario Assumptions ........................................................................................................................... 7-13 6. ROI Model Results ...................................................................................................................................................... 7-14 7. Implications .................................................................................................................................................................. 7-17
........ 7-20 E. MEASURING REVITALIZATION – “Reducing the Impact of Vacant and Abandoned Properties”1. Methodology .............................................................................................................................................................. 7-20
2. Cost Saving Benefits of VAP Reduction ................................................................................................................. 7-20
3. VAP Inventory Reduction .......................................................................................................................................... 7-21 4. Implications .................................................................................................................................................................. 7-22
APPENDIX SECTION

Page | ES-1
VAP Neighborhood Revitalization Study
EXECUTIVE SUMMARY
A. EXECUTIVE SUMMARY
1. Introduction
In November 2012, RKG Associates, Inc. and their
teaming partners APD Urban Planning &
Management, LLC were hired by Louisville Metro
Government to develop a series of recommendations
to address the city’s vacant and abandoned
properties (VAPs) and mitigate their associated
impacts.
The RKG Team took a comprehensive perspective,
recognizing that neighborhood revitalization, in
addition to the reduction of vacant and abandoned
properties, is necessary to reduce the occurrence of
this issue in the future. To develop a set of actionable
strategies, the RKG Team utilized a methodology to:
• Assess demographic, economic and housing
conditions, including field inspections in West
Louisville neighborhoods;
• Conduct interviews and outreach with local
community organizations, nonprofit and for profit
developers, and Metro Government officials and
staff;
• Develop an analysis of real estate marketability
to identify where intervention might be most
effective; and
• Assess the return on investment that Metro
Government could reasonably expect to receive
for the costs associated with addressing the vacant
and abandoned property problem over 20 years.
The resulting report outlines a series of early
intervention and long-term strategies and the relevant
data analysis to support those strategies, and offers
a comprehensive approach to addressing the vacant
and abandoned property problem.
2. Vacant and Abandoned Property and
Underlying Factors
At the end of 2012, approximately 6,000 vacant
properties were identified by Louisville Metro
Government. Of those, more than 1,100 properties
are thought to be abandoned – properties that Metro
Government has actively maintained and have been
identified as being vacant by a Metro code
enforcement officer for at least a year. The vacant
and abandoned property problem has complex
origins dating back generations in some cases. The
isolation of some urban neighborhoods, oftentimes
shaped by the construction of the region’s interstate
highway network through Louisville’s urban core, has
resulted in disjointed neighborhoods, many of them
historic residential enclaves and home to Louisville’s
immigrant and African-American populations.
Since the late 1960s, and more recently since the start
of the so-called “Great Recession” in December 2007,
Louisville Metro Government has experienced a
proliferation of property tax foreclosures, mortgage
foreclosures, and corresponding neighborhood blight
conditions. While this problem has been most acute in
certain urban neighborhoods, there is evidence that
the problem is spreading beyond these inner core
neighborhoods into more suburban neighborhoods.
3. Demographics and Economic Trends
To better understand conditions on the ground, the
RKG Team assessed socioeconomic, employment and
business establishment trends in Louisville. This helped
inform the Team’s understanding of the economy and
livelihood of Louisville’s residents, as well as the
underlying factors that contribute to the vacant and
abandoned property problem.
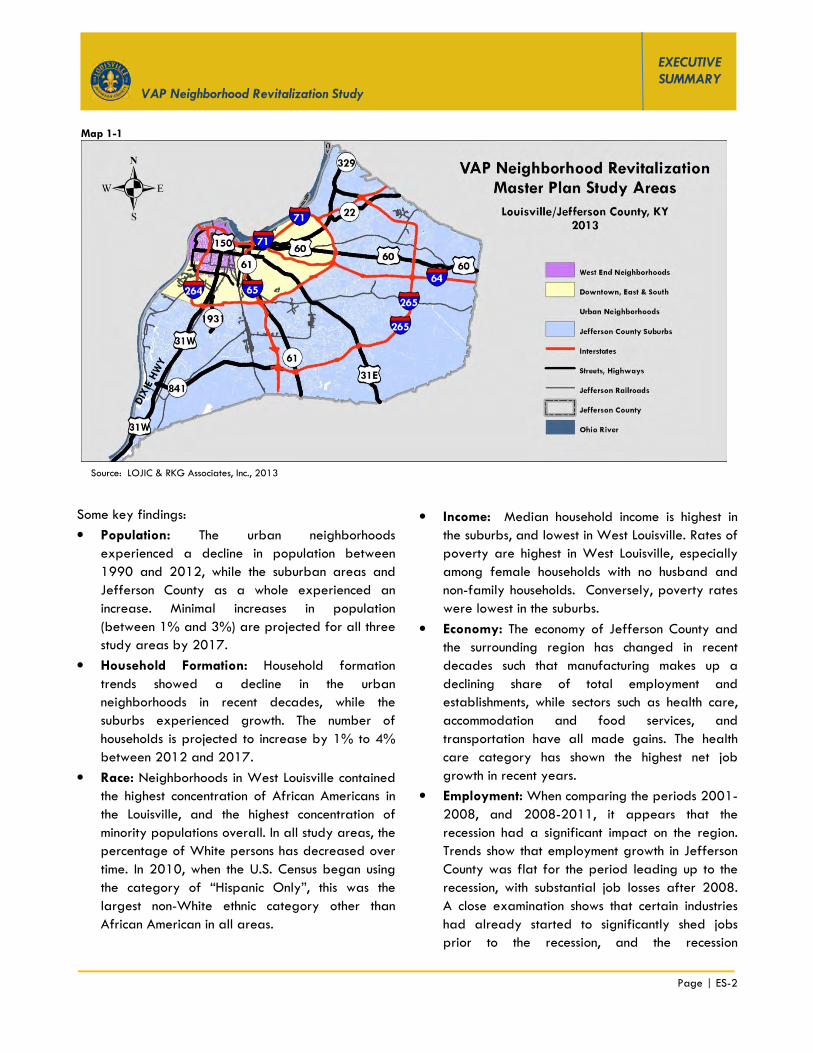
For this report, the Metro Louisville area was divided
into three study areas: West Louisville neighborhoods,
the Downtown, East and South Urban neighborhoods
and the Jefferson County suburbs (Map 1-1).
Page | ES-2
VAP Neighborhood Revitalization Study
EXECUTIVE SUMMARY
Some key findings:
• Population: The urban neighborhoods
experienced a decline in population between
1990 and 2012, while the suburban areas and
Jefferson County as a whole experienced an
increase. Minimal increases in population
(between 1% and 3%) are projected for all three
study areas by 2017.
• Household Formation: Household formation
trends showed a decline in the urban
neighborhoods in recent decades, while the
suburbs experienced growth. The number of
households is projected to increase by 1% to 4%
between 2012 and 2017.
• Race: Neighborhoods in West Louisville contained
the highest concentration of African Americans in
the Louisville, and the highest concentration of
minority populations overall. In all study areas, the
percentage of White persons has decreased over
time. In 2010, when the U.S. Census began using
the category of “Hispanic Only”, this was the
largest non-White ethnic category other than
African American in all areas.
• Income: Median household income is highest in
the suburbs, and lowest in West Louisville. Rates of
poverty are highest in West Louisville, especially
among female households with no husband and
non-family households. Conversely, poverty rates
were lowest in the suburbs.
• Economy: The economy of Jefferson County and
the surrounding region has changed in recent
decades such that manufacturing makes up a
declining share of total employment and
establishments, while sectors such as health care,
accommodation and food services, and
transportation have all made gains. The health
care category has shown the highest net job
growth in recent years.
• Employment: When comparing the periods 2001-
2008, and 2008-2011, it appears that the
recession had a significant impact on the region.
Trends show that employment growth in Jefferson
County was flat for the period leading up to the
recession, with substantial job losses after 2008.
A close examination shows that certain industries
had already started to significantly shed jobs
prior to the recession, and the recession
Source: LOJIC & RKG Associates, Inc., 2013
Map 1-1
Page | ES-3
VAP Neighborhood Revitalization Study
EXECUTIVE SUMMARY
accelerated this trend while slowing or reversing
growth in other industries.
Compared to the Commonwealth of Kentucky as a
whole, Jefferson County experienced flat growth
leading up to the recession. A significant finding is
that the net job loss in Louisville constitutes 88% of
the statewide net job losses between 2001 and
2011.
4. Housing Characteristics and Conditions
Age of Housing Stock: The housing stock in Jefferson
County is predominantly made up of owner-occupied
single-family detached units. The largest
concentration of new housing units was found in the
suburban areas. As expected, units are oldest in the
urban neighborhoods, particularly West Louisville,
where 45% of housing units were built prior to 1939.
Historic preservation best practices can be added to
current Metro Government policy to help ensure the
historic fabric of neighborhoods needing revitalization
remains intact. Some of the best practices used in
other communities include cataloguing historic
properties, establishing design guidelines for
redevelopment and incorporating adaptive reuse into
affordable housing initiatives.
Ownership: Owner-occupied houses are found in the
greatest proportion in the suburbs, while the majority
of units in West Louisville are rented. The other urban
neighborhoods show a slight majority of owner-
occupied units. The decline in homeownership in the
West Louisville neighborhoods between 1990 and
2012 has affected neighborhood stability, as
properties have fallen into disrepair due to deferred
maintenance. If this trend continues, neighborhoods
throughout the Metro area will experience further
instability, decreased investment, and a reduction in
the supply of quality units for ownership. In
combination, these effects will reduce the opportunity
to increase the population of long-term residents.
Property Condition: A block-level condition analysis
was performed in West Louisville using a rating scale
devised by the RKG Team to determine the degree of
blight on a block-by-block basis. The analysis
revealed that approximately 35% of all blocks in
West Louisville are “stable,” or require little or no
intervention to remain viable. An additional 35% are
considered on the verge of decline and showing signs
of disinvestment, and could either tip into further
decline or start to improve. Approximately 30% of
the blocks require active intervention to become
stable. With the exception of the Hallmark and
Russell neighborhoods, the most blight occurs towards
the east side of the neighborhoods with blocks
exhibiting more stable conditions moving westward
towards the river.
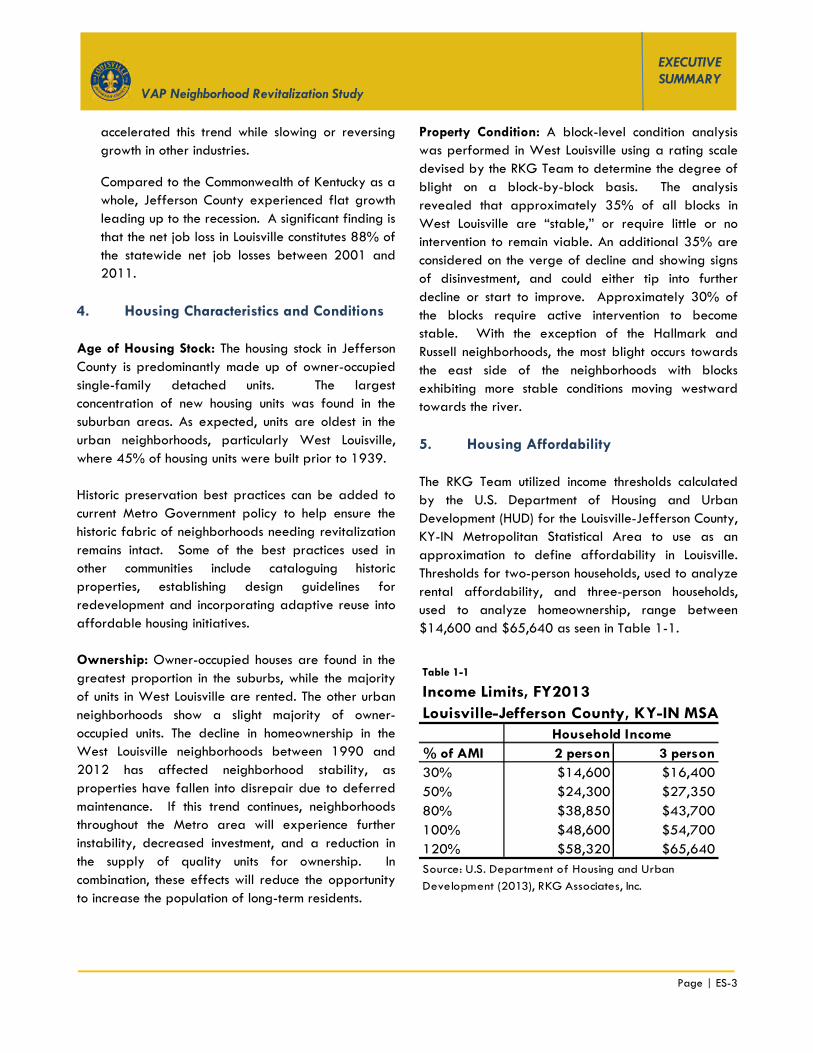
5. Housing Affordability
The RKG Team utilized income thresholds calculated
by the U.S. Department of Housing and Urban
Development (HUD) for the Louisville-Jefferson County,
KY-IN Metropolitan Statistical Area to use as an
approximation to define affordability in Louisville.
Thresholds for two-person households, used to analyze
rental affordability, and three-person households,
used to analyze homeownership, range between
$14,600 and $65,640 as seen in Table 1-1.
Table 1-1
Income Limits, FY2013
Louisville-Jefferson County, KY-IN MSA
% of AMI 2 person 3 person
30% $14,600 $16,400
50% $24,300 $27,350
80% $38,850 $43,700
100% $48,600 $54,700
120% $58,320 $65,640
Household Income
Source: U.S. Department of Housing and Urban
Development (2013), RKG Associates, Inc.

Page | ES-4
VAP Neighborhood Revitalization Study
EXECUTIVE SUMMARY
The analysis found that the urban areas of Louisville
generally do not have enough affordable housing to
support the demand of those making between 51%
and 100% of area median income (AMI). To find
homeownership opportunities, these households will
choose from the existing supply of homes that are
affordable to those at lower income thresholds, which
indicates a mismatch between housing demand and
the available supply.
Furthermore, these households will consume the best
conditioned units from the lower affordability
threshold, leaving only those units that have a number
of quality and condition issues. The negative
marketability of these units has led to high incidences
of vacancy and abandonment.
The suburbs were found to have a greater mix in the
supply of affordable homeownership options. There is
an oversupply of housing affordable to those making
between 50% and 80% of AMI. However, the
undersupply of units affordable to those making
between 80% and 100% of AMI most likely reduces
this oversupply as households in this income range
consider units below their ideal price range in order to
find a home.
The recent increase in multi-family development in
Louisville may help to decrease gaps between the
supply and demand of affordable units for those at or
above 50% of AMI, but not necessarily for the portion
of the population most in need (i.e., those making less
than 50% of AMI).
6. Neighborhood Marketability
The RKG Team devised a neighborhood marketability
analysis to determine where future investment by
Metro Government might have the most impact on
alleviating problems associated with vacant and
abandoned properties. A system of weighted scores
was applied to a variety of property factors relevant
to the preferences of investors, developers, and future
home buyers or renters.
The marketability of the suburban areas transitions
from high positive scores to moderately positive and
slightly negative scores when moving from east to
west. Suburban parcels closest to the urban areas in
the northwestern parts of Jefferson County were
generally less positive than those further out in the
suburbs. The same was true for the Downtown, East
and South Urban Neighborhoods, where the areas
with the greatest number of positive factors are
concentrated east of the downtown. West Louisville
exhibited a different pattern defined by the presence
of the interstate highway and railroad right-of-way.
Parcels closest to these major transportation corridors
showed the greatest negative scores and the highest
marketability was observed on the western side along
the riverfront. The southern sections of West Louisville
also had concentrations of parcels with positive
marketability.
7. Return on Public Investment
A model was developed to illustrate the possible
return through revenues that Metro Government might
see on the costs associated with addressing the issues
related to vacant and abandoned properties. Two
scenarios were reviewed: (1) a Baseline Maintenance
Approach with minimal additional actions taken by
Metro Government beyond the current level of
activity, and (2) an Intervention Approach, or a more
aggressive level of activity that increases the actions
of Louisville Metro Government substantially beyond
the current level. The Intervention Approach assumes
that by the end of a three year ramp-up period,
Metro Government’s capacity to undertake
comprehensive revitalization increases with the
creation of a new implementation organization with all
the powers, authorities and financial capabilities to
lead the effort. Accordingly, the level of intervention
increases in all activities including code enforcement
inspections and property maintenance, demolitions,
judicial foreclosures, new housing construction and all
manner of neighborhood revitalization.
The ROI model calculates a return on the public
investment after the end of Year 20 to account for the

Page | ES-5
VAP Neighborhood Revitalization Study
EXECUTIVE SUMMARY
fact that neighborhood revitalization can take several
years to plan, fund and implement. The ROI
calculation compares the City’s measurable
expenditures against its returns, in the form of
increased tax revenues over the 20-year projection
period. While financial returns may be modest, the
stabilization of neighborhoods and the preservation of
public health and safety are immeasurable and should
not be overlooked. Finally, the ROI model is applied
to three separate geographic areas of
Louisville/Jefferson County. A comparative analysis
of West Louisville, Downtown, East and South Urban
neighborhoods and Jefferson County suburbs
illustrates how changes in ROI can vary by location.
7.1 ROI Comparative Analysis
The results of the ROI model indicate that the highest
returns on investment can be achieved in the West
Louisville neighborhoods (4.5% in the Baseline
Maintenance approach, and 27.3% in the Intervention
approach). These results are largely due to two
reasons. First, the West Louisville area has a much
higher concentration of distressed properties, which is
lowering property values and makes property
acquisitions more affordable. Secondly, the West
Louisville area maintains higher property tax rates,
which return more revenues to the bottom line (tax
rates differ in some areas of the county depending on
the services provided – e.g., sanitation, street lights,
fire protection).
The Baseline Maintenance approach, overall, does not
produce suitable returns on the public investment, nor
does it produce enough tangible results on the ground
to make a real impact in the most distressed
neighborhoods. It is not until public dollars are used to
grow the tax base or grow employment that revenue
begins to flow back to local government. While the
current program of code enforcement, foreclosures,
demolitions and property maintenance are essential
elements of Metro Government’s response to the
vacant and abandoned property problem, they are
not sufficient in and of themselves to reverse the trend
of decline. However, they are effective at reducing
the incidence of blight and reducing crime, which is
already a problem in some neighborhoods.
On average, the Intervention approach produces 20-
year returns that are 5 to 6 times greater than the
Baseline Maintenance approach, with the largest
spread occurring in the West Louisville neighborhoods
(22.7% spread).
Impact of Borrowing on ROI
One of the factors that increases the government’s ROI
is the ability to reduce its upfront investment in such
things as infrastructure, housing subsidies, land and
building acquisition and other capital expenses. Given
the size and scope of this effort, it is unlikely that
Metro Government will be able to “pay-as-you-go,”
and only complete those activities for which there are
existing funds, when outlays are currently $5+ million.
Any substantial expansion of revitalization activities
would drive the annual cost well above $10 million a
year. However, with the use of the City’s bonding
capacity, or the bonding capacity of a redevelopment
entity with special taxing authority, those same capital
outlays could be reduced substantially.
The ability to finance major capital investments is a
critical element of “right-sizing” the City’s response to
meet the size of the challenge. Currently, much of the
money used for housing and neighborhood
revitalization comes from federal sources, which are
diminishing over time. If one assumes that the
revitalization of the West Louisville neighborhoods
might cost a billion dollars over a 20-year period, at
a 4:1 leverage ratio, Metro Government might have
to invest as much as $250 million. If that investment
was spread out in equal annual installments and the
City was able to borrow those funds each year on a
“pay as you go” basis, in Year 21 the investment
would require annual debt service payments in excess
of $18 million. While this is an extreme investment
scenario, it speaks to the financial limitations of the
“pay-as-you-go” approach, particularly under a more
comprehensive revitalization scenario.

Page | ES-6
VAP Neighborhood Revitalization Study
EXECUTIVE SUMMARY
7.2 Increasing Return on the Public Investment
In order to increase its financial return on public
investment, Metro Government must do the following:
� Increase Public, Private, and Non-profit
Partnerships – The ability to attract non-public
money to revitalization areas will have a greater
impact on financial return than any other single
action. This will require Metro Government to work
in close partnership with its private and non-profit
development partners to carry out activities in
targeted areas. In order to accomplish this, Metro
Government must carefully select the locations and
methods used to revitalize different areas. This
may require a change in approach and a
commitment to direct public dollars in a more
targeted way, rather than spreading limited funds
through many different areas and having very
little impact.
� Increase Organizational and Financial Capacity –
In order to leverage greater amounts of non-
public money, Metro Government must be
prepared to make larger and more strategic
investments where they are needed to unlock
“Other People’s Money.”
This will require Metro Government to become
more of an equal partner and in some cases a
“deal-maker,” when appropriate. Committing
financial resources that are both significant and
sustainable and utilizing the City’s borrowing
power are critical elements. Urban revitalization
requires public action to mitigate risk and remove
structural problems that could not be removed if
not for the government’s involvement. In Louisville,
the private real estate market is not strong enough
in some neighborhoods to justify the investment
risk without public intervention.
� Strategic Actions in Targeted Areas – This
approach concentrates Metro Government’s
planning, organizational, funding and
implementation efforts in areas that are ready for
revitalization. This means that the City is working
in areas with an established revitalization strategy
and is working in partnership with others that have
the capacity to implement change. This also
includes residents, who should be actively
engaged in the planning process leading up to
implementation.
7.3 Implications
The ROI model illustrates a couple of important factors
that must be considered as Metro Government moves
forward with its revitalization initiatives. First, how can
it maximize the benefits derived from current and
future public investments in neighborhood
revitalization? In order to have a measurable impact
on declining neighborhoods and to improve conditions,
the City must work closely in concert with other
development interests and community residents.
Where the City makes investments in the future may
be as important as the types of investments it makes.
Dedicating tens of millions of public dollars into the
most severely challenged areas may not produce the
best results, despite the high level of need in those
areas. Dedicating and targeting resources in areas
where they can have a “catalytic” effect and spin-off
other development must be part of the strategy.
The traditional method of “pay-as-you-go” will
probably not have a significant impact in some of the
City’s most economically challenged neighborhoods.
The scale of the investment needs to increase to meet
the size of the problem, and currently that is not
possible given the limited resources. Finally, if Metro
Government wants to maximize the return on its
investment to combat the vacant and abandoned
property problem, it needs to pursue strategies that
will stabilize and grow the tax base. The current
approach of code enforcement, property
maintenance, demolitions and foreclosures is essential
but will not produce the measurable financial results
that Metro Government desires. This can only be
achieved through comprehensive neighborhood
revitalization efforts, with Metro Government
providing the strategic vision and investment in areas

Page | ES-7
VAP Neighborhood Revitalization Study
EXECUTIVE SUMMARY
that will attract federal, private and nonprofit
investment.
The Cost of Doing Nothing
Louisville Metro Government’s ability to make long-
term funding commitments to neighborhood
revitalization will depend on several factors. Number
one, what level of public and political support will
there be for these initiatives in the face of other
competing public priorities and financial commitments?
Secondly, what costs will be incurred by Metro
Government in the future, irrespective of any
additional funding commitments? In other words, what
would be the cost to local taxpayers for taking no
additional action, if that were possible.
Currently, Metro Government is spending several
million dollars annually to fund a variety of code
enforcement, demolition, and foreclosure and
property maintenance activities on more than 6,000
vacant properties throughout the Metro Louisville
area. In addition, the Department of Community
Services & Revitalization spends another $11 million
annually to fund community development, housing and
neighborhood revitalization activities, primarily with
the use of federal HUD entitlement money.1
Over time, continued neighborhood decline will
extract a cost from the community, either through
direct budget appropriations or through the erosion of
property values, increased crime and a multitude of
social problems. With nearly $11 billion in urban
residential assessed value located within the I-264
loop, just a 1% decline in values results in a loss of
$110 million in assessed value. A decline in real
property values of 1% would translate into a
potential loss of over $1.4 million in annual tax
revenues to local government.2 If this amount was
used to retire municipal bond debt, it could support a
20-year bond issuance of nearly $30 million. With
several neighborhoods in West Louisville experiencing
1 E-mail from Robin Grammer, Executive Administrator, LMG Community Services & Revitalization, July 3, 2013. 2 Estimated assessed value loss taxed at a rate of $1.2921 per $100 in assessed value at current tax rates for Metro Louisville ($0.1255), Urban Service District ($0.3666), School District ($0.70) and Fire District ($0.10).
assessed value losses of between 4% and 17% in
2013, the stakes are high and costs are being
incurred on both sides of the municipal ledger
regardless of annual budget decisions.
8. Early Intervention and Long-Term
Recommendations
Despite current conditions in the local economy, real
estate and financial markets, the problem of vacant
and abandoned properties is symptomatic of a much
larger problem. At the core of this issue is the steady
erosion of many urban and some suburban
neighborhoods. Future Metro initiatives to combat the
vacant and abandoned property problem must
approach it from a larger context and devise
strategies to revitalize the City’s declining
neighborhoods.
Through discussions with internal and external
stakeholders, Early Intervention (24-36 months) and
Long-term (Years 4-10) Recommendations were
developed. The Early Intervention Recommendations
are specifically designed to address the most pressing
and viable near-term opportunities for local
government, with the understanding that the city
cannot and should not be the sole solution to the
problem, but must help direct and organize the effort.
It sets the stage for more complex, longer-term
strategies that will require a significant commitment of
planning, financial resources, and political support.
The recommendations are organized into five main
elements including:
� Element 1: Organizational Structure and
Administrative Action
� Element 2: Comprehensive Neighborhood
Revitalization, Planning, Capacity Building
� Element 3: Legislative Initiatives
� Element 4: Housing Rehab, Construction,
Demolition, Catalyst Projects
� Element 5: Funding

Page | ES-8
VAP Neighborhood Revitalization Study
EXECUTIVE SUMMARY
A summary of the recommended action items follows,
with the full recommendations provided in Section 2 of
this study.
8.1 Element 1 - Organizational Structure and
Administrative Actions
In order to address the full range of issues related to
VAP neighborhood revitalization, Metro Government
must create an organization with the full-time staff
resources and the powers and authorities required to
respond to the current problem in its size, scale and
complexity. This organization, “LouisvilleNOW”, is a
long-term recommendation to incorporate the actions
of the three major authorities tackling the vacant and
abandoned property issue: the Urban Renewal
Commission, the Landbank Authority and the Vacant
Property Review Commission. In the interim, hiring a
VAP coordinator to facilitate the activities of the three
entities listed above is first step in transitioning to a
single, permanent organization.
EARLY INTERVENTION RECOMMENDATIONS
RECOMMENDATION 1: Draft a Memorandum of Agreement
(MOA) between the existing Urban Renewal Commission,
Landbank Authority and Vacant Property Review Commission
to formally define the roles and functions in addressing the
VAP problem and neighborhood revitalization needs
RECOMMENDATION 2: Establish enhanced role and
responsibilities of the Landbank Authority, Inc.
RECOMMENDATION 3: Establish role and responsibility of
planning, housing, and neighborhood development
RECOMMENDATION 4: Improve methods for tracking
vacant, abandoned and foreclosed properties in high risk
neighborhoods
LONG-TERM RECOMMENDATIONS
RECOMMENDATION 5: Establish LouisvilleNOW as a
combined Urban Renewal Authority combining the Landbank
Authority, Vacant Property Review Commission and the
existing Urban Renewal Commission to lead urban
redevelopment activities in high risk neighborhoods
RECOMMENDATION 6: Establish an integrated role and
mission for the Landbank Authority, Inc., within the context of
a combined urban renewal authority
8.2 Element 2 - Comprehensive Neighborhood
Revitalization, Planning and Capacity
Building
Comprehensive Neighborhood Revitalization Planning
includes the assessment of existing conditions and
development of action plans that address several
critical developments elements rather than focusing
solely on one element of the neighborhood
redevelopment process. Although it is evident that
vacant and abandoned properties are a primary
contributor to blight and disinvestment, the foundation
of sustainable neighborhood planning requires
strategies that address housing stabilization through
code enforcement and demolition, future zoning and
land use, infrastructure, crime prevention, economic
development, and most importantly human capacity
development. Capacity building is a necessary
component of comprehensive revitalization planning
and strategies, as resident stakeholders must have the
skills needed to sustain successful redevelopment
strategies in their neighborhoods.

Page | ES-9
VAP Neighborhood Revitalization Study
EXECUTIVE SUMMARY
EARLY INTERVENTION RECOMMENDATIONS
RECOMMENDATION #7: Initiate public outreach to
revitalization, development and lending community
RECOMMENDATION #8: Identify Priority Project Areas
(PPAs)
RECOMMENDATION #9: Identify neighborhood
revitalization strategy areas to guide public and private
investment decisions
RECOMMENDATION #10: Establish a formal process for
evaluating specific target locations within Priority Project
Areas
RECOMMENDATION #11: Improve the capacity of local
housing partners to respond to revitalization needs
RECOMMENDATION #12: Introduce and market metro
program to sell or dispose publically-owned properties not
critical to redevelopment
RECOMMENDATION #13: Improve the grassroots capacity
of neighborhood associations to undertake community-based
action
LONG-TERM RECOMMENDATIONS
RECOMMENDATION 14: Plan Model Block Developments to
encourage public/private investment
RECOMMENDATION 15: Establish a core project
management team consisting of Metro Government staff
critical to redevelopment
RECOMMENDATION 16: Establish training program for local
development partners to expand capacity
RECOMMENDATION 17: Work with political representatives,
civic leadership, and business community to create local
champions
8.3 Element 3 - Legislative Initiatives
In its current capacity, the Landbank Authority does
not have the powers most useful to addressing the
vacant and abandoned property problem. Even if a
consolidated organization with the Urban Renewal
Commission and Vacant Property Review Commission
is not formed, legislative action will be needed to
enhance the powers of the Landbank Authority. These
enhancements would be targeted changes approved
through state enabling legislation.
EARLY INTERVENTION RECOMMENDATIONS
RECOMMENDATION 18: Pursue legislative changes to
enhance the powers of the Landbank Authority
8.4 Strategy Element 4 - Housing Rehabilitation,
Construction, Demolition and Catalyst
Development
A primary goal of neighborhood revitalization is to
preserve and protect the architectural and historical
character of the targeted neighborhoods. The
recommended approach to housing rehab and the use
of new infill construction is one that combines elements
of code enforcement, rehab design standards, and
preservation or neighborhood conservation.
Combining these features will help protect the unique
character of revitalization neighborhoods.
EARLY INTERVENTION RECOMMENDATIONS
RECOMMENDATION 20: Establish process and qualifications
for developer participation
RECOMMENDATION 21: Establish rehab standards,
construction practices, and design standards
RECOMMENDATION 22: Undertake a selective housing
demolition program to reduce blight and crime and create
redevelopment opportunities
LONG-TERM RECOMMENDATIONS
RECOMMENDATION 23: Establish re-qualification
procedures for annual developer participation
RECOMMENDATION 24: Create a program to encourage
joint ventures between non-profit and for-profit developers on
urban redevelopment projects
RECOMMENDATION 25: Establish regulatory framework to
guide redevelopment and reinvestment
RECOMMENDATION 26: Create annual work plan for priority
project areas
RECOMMENDATION 27: Package select projects within
priority project development areas
RECOMMENDATION 28: Establish marketing and branding
strategy to build on neighborhood assets to attract new
investment
RECOMMENDATION 29: Establish real estate asset
management capability

Page | ES-10
VAP Neighborhood Revitalization Study
EXECUTIVE SUMMARY
8.5 Element 5 - Funding
The level of resources required to address the VAP
problem will depend on the size and complexity of
Metro Government’s role, but at the high end could
require hundreds of millions of dollars. During the first
two to three years, with the exception of funding a
new VAP Coordinator position to begin organizing the
initiative and setting short- and long-term priorities for
Metro Government, much of the project-based
activities will be funded through existing budgets and
by shifting department responsibilities where possible.
Once major project initiatives have been identified,
larger funding sources will be required.
Over the long-term, Metro Government needs to
explore financial strategies that will support the
larger public investments required to have a
significant impact. Such strategies will need to
consider utilizing Metro’s bonding capacity, or the
bonding capacity of a new redevelopment entity, to
finance new project initiatives.
The RKG team also recommends interested parties
explore the possibility of expanding Kentucky TIF
statutes to include smaller scale, residential or mixed
used redevelopment and whether or not TIFs could be
successfully used for neighborhood revitalization in
Kentucky.
EARLY INTERVENTION RECOMMENDATIONS
RECOMMENDATION 30: Identify funding policies and sources
for VAP housing revitalization funding
RECOMMENDATION 31: Identify sources for development
subsidies including CDBG, HOME, NSP, etc.
RECOMMENDATION 32: Attract long-term financing to
priority project areas
RECOMMENDATION 33: Establish innovative funding
techniques to finance major economic development and
neighborhood redevelopment projects and administrative
expenses
LONG-TERM RECOMMENDATIONS
RECOMMENDATION 34: Identify sources for VAP housing
revitalization funding
RECOMMENDATION 35: Create development subsidy support
based on leveraging public/private sector investment
RECOMMENDATION 36: Work with local lenders, private
mortgage insurance companies, and secondary market to
increase private sector participation
RECOMMENDATION 37: Capitalize a LouisvilleNOW
development fund that is self-sustaining to fund larger
redevelopment projects
RECOMMENDATION 38: Explore the options for potential
new ways to process delinquent tax liens

Page | 1-1
VAP Neighborhood Revitalization Study
Section
1
A. STUDY OVERVIEW
1. Introduction
Louisville Metro Government’s vacant and abandoned
property problem has complex origins dating back
generations in some cases. The isolation of certain
urban neighborhoods, often shaped by the
construction of the region’s interstate highway
network, have resulted in disjointed neighborhoods;
many of them historic residential enclaves and home to
the city’s immigrant and African-American populations.
The level of poverty, crime, and industrial
encroachment and blight conditions varies; and while
this problem has been most acute in certain urban
neighborhoods located east, west and south of the
Downtown area, there is evidence that the problem is
spreading beyond these inner core neighborhoods into
more suburban neighborhoods.
Since the late 1960s, and more recently since the start
of the so-called “Great Recession” in December 2007,
Louisville Metro Government has experienced a
steady erosion of its real estate tax base due to a
proliferation of tax foreclosures, mortgage
foreclosures, elevated tax lien sales and
corresponding neighborhood blight conditions.
Furthermore, in early 2013, Jefferson County’s
Property Valuation Administrator announced that
assessed property values in several West
Louisville neighborhoods would be adjusted
downward to reflect the poor market
fundamentals in that area of the city.
More than 1,100 properties were identified as
abandoned by Metro Government at the end of
2012, and approximately 6,000 properties are
thought to be vacant. Recognizing that a new
approach was needed to address this growing
problem, Louisville Metro Government hired RKG
Associates, Inc. and their teaming partners APD Urban
Planning & Management, LLC to develop an early
intervention and long-term strategy to address vacant
and abandoned properties and mitigate their
associated impacts on the city’s neighborhoods.
An important part of the approach developed by the
RKG Team is an objective, fact-based process to make
decisions on where to target public investment and
programmatic resources, designate special districts,
start neighborhood planning, and direct federal
funding. These efforts focus on areas in transition,
which are identified by the RKG Team through an
analysis of parcel marketability based on the factors
that influence developers, homebuyers and renters.
A primary goal of the early intervention and long-
term strategies is to build partnerships with area non-
profits and development organizations and make
strategic investments that produce an investment
response from other important development players.
Because private investment money often flows to
where public dollars are being spent, usually in the
form of federal grants, loans, financial subsidies, and
infrastructure improvements, building upon the initial
actions of Metro Government can lead to a lasting
change that addresses the issues related to vacant
and abandoned properties and revitalizes the city’s
neighborhoods.
2. Comprehensive Approach to
Neighborhood Revitalization
Despite current conditions in the local economy, real
estate and financial markets, the number of vacant
and abandoned properties is symptomatic of a much
larger problem.
While Louisville’s vacant and abandoned properties
have had deleterious effects on the local tax base
and resulted in increased municipal expenditures,
declining housing conditions, and increased blight, they
are just one contributor to the larger problem of
declining neighborhoods. Accordingly, future Metro
Government initiatives to combat this problem must
approach the problem in its larger context and devise
strategies to revitalize the city’s declining
neighborhoods, many of them located in its urban
core.

Page | 1-2
VAP Neighborhood Revitalization Study
Section
1 3. Objectives of the VAP Study
On November 27, 2012, the RKG Team met with
Metro Government staff to review the VAP Study
research approach and to conduct an early project
goal setting session. The top three ranked objectives
included: (1) removal of blighted properties and
public safety hazards, (2) return properties to
productive use and (3) stabilize neighborhoods.
Although Metro Government is already working to
combat these problems and meet these public goals, a
more effective approach requires a higher level of
coordination and an overall vision and strategy.
4. Key Strategy Elements
On March 19, 2013, RKG Associates, Inc. conducted a
half-day workshop with Metro staff to review the
draft Early Intervention Strategy. The discussion
focused on five key elements related to the role of
Metro Government and its future response to the
vacant and abandoned property problem, as well as
the challenges of urban revitalization.
The following goals were set for the VAP Study:
� To provide leadership to all residents, housing
organizations and developers, and to seek
community consensus around its major elements.
� To communicate the results of the VAP Study to
investors/speculators, non-profit and private
developers, and future homeowners in order to
shape future decision-making.
� To provide planning, programmatic initiatives, and
funding to direct investor and development
activity into priority revitalization areas.
� To devise a strategy for stabilizing declining
areas and stimulating investment in “transitional
areas” before they fall into decline.
� To put in place the organizational structure and
administrative and legislative policies required for
successful implementation.
5. Methodology and Approach
The RKG Team took a comprehensive approach to
developing an early intervention strategy and long-
term strategy that addresses the vacant and
abandoned property problem. In order to do so, RKG
analyzed existing conditions, developed an
assessment of property marketability and created a
model illustrating return on investment. This research
and analysis was used to ensure that the early
intervention and long-term recommendations not only
reduce the number of vacant and abandoned
properties, but also facilitate neighborhood
revitalization.
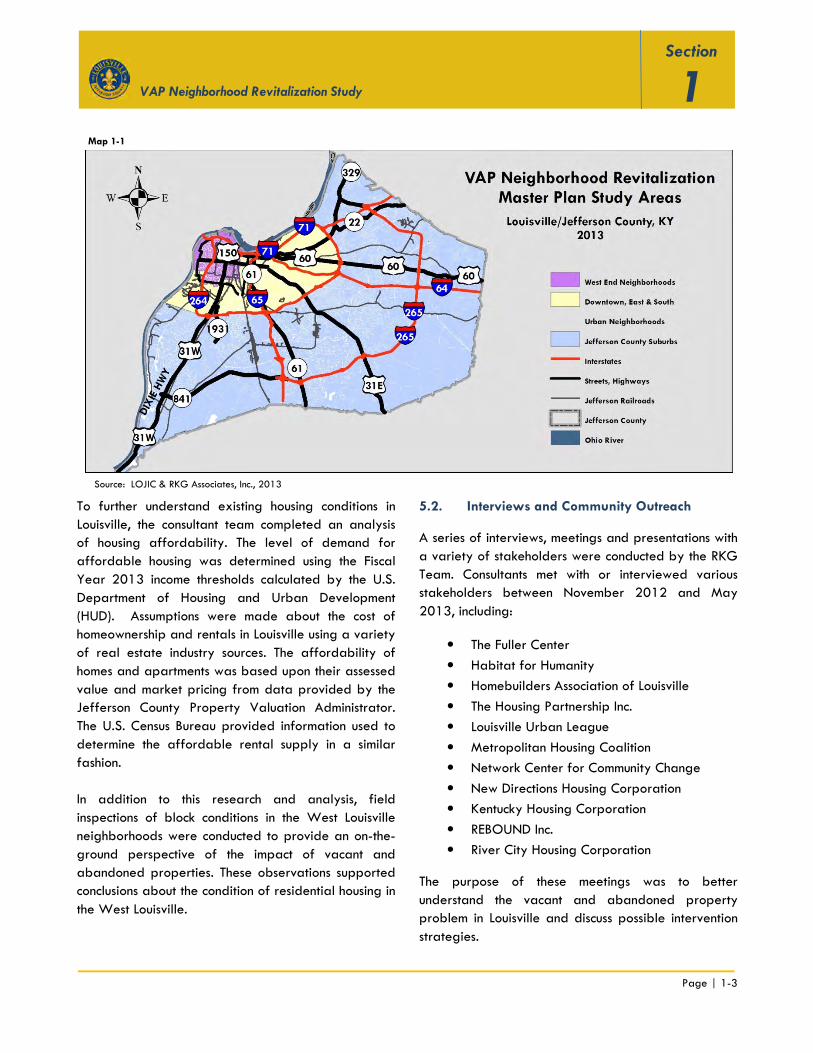
For this report, the consultant team divided the Metro
Louisville area into three areas: the West Louisville
neighborhoods, the Downtown, East & South Urban
neighborhoods and the Jefferson County suburbs. As
seen in Map 2-1, the West Louisville and Downtown,
East & South Urban neighborhoods make up all of
what was formerly Louisville, Kentucky. The remaining
area of the county is considered largely suburban and
is referred to as the Jefferson County suburbs.
5.1. Existing Conditions Analysis
Existing demographic and economic conditions in
Jefferson County were analyzed using data from the
U.S. Census Bureau. This provided insight into the
socioeconomic makeup of the three areas of Metro
Louisville and the trends in employment and business
establishment that impact the economy of the county
and the livelihood of its residents. Evaluation of this
data also provided a background to better
understand the underlying factors, such as the
concentration of poverty, which contributes to the
vacant and abandoned property problem.
Page | 1-3
VAP Neighborhood Revitalization Study
Section
1
To further understand existing housing conditions in
Louisville, the consultant team completed an analysis
of housing affordability. The level of demand for
affordable housing was determined using the Fiscal
Year 2013 income thresholds calculated by the U.S.
Department of Housing and Urban Development
(HUD). Assumptions were made about the cost of
homeownership and rentals in Louisville using a variety
of real estate industry sources. The affordability of
homes and apartments was based upon their assessed
value and market pricing from data provided by the
Jefferson County Property Valuation Administrator.
The U.S. Census Bureau provided information used to
determine the affordable rental supply in a similar
fashion.
In addition to this research and analysis, field
inspections of block conditions in the West Louisville
neighborhoods were conducted to provide an on-the-
ground perspective of the impact of vacant and
abandoned properties. These observations supported
conclusions about the condition of residential housing in
the West Louisville.
5.2. Interviews and Community Outreach
A series of interviews, meetings and presentations with
a variety of stakeholders were conducted by the RKG
Team. Consultants met with or interviewed various
stakeholders between November 2012 and May
2013, including:
• The Fuller Center
• Habitat for Humanity
• Homebuilders Association of Louisville
• The Housing Partnership Inc.
• Louisville Urban League
• Metropolitan Housing Coalition
• Network Center for Community Change
• New Directions Housing Corporation
• Kentucky Housing Corporation
• REBOUND Inc.
• River City Housing Corporation
The purpose of these meetings was to better
understand the vacant and abandoned property
problem in Louisville and discuss possible intervention
strategies.
Source: LOJIC & RKG Associates, Inc., 2013
Map 1-1

Page | 1-4
VAP Neighborhood Revitalization Study
Section
1 5.3. Marketability and Real Estate Analysis
The RKG Team developed an analysis of the
marketability of parcels in Jefferson County. The
purpose of this analysis was to identify the locations of
the most marketable parcels to developers, investors
and homebuyers/renters. Each parcel was assigned a
score based on a range of marketability from
negative (less marketable) to positive (highly
marketable). By pairing the location of each parcel
and its marketability score, this analysis helped to
identify where intervention might be most effective.
The metrics for marketability were developed using
data from a variety of sources including the U.S.
Census Bureau, the Jefferson County Property
Valuation Administrator and the Louisville/Jefferson
County Information Consortium (LOJIC). A full
discussion of the sources and methodology of this
analysis can be found in Section 6 of this report.
In addition to marketability, residential development
and sales activity were analyzed by year and
geographic area to learn more about real estate
market conditions. Data sets from the Jefferson County
Property Valuation Administrator were the primary
source for this portion of the analysis. To better
understand the multi-family market, data from the real
estate data reporting firm REIS was also analyzed.
5.4. Return on Investment Analysis
The return on investment analysis illustrates the
potential financial return Metro Government could
expect to receive based on the level of investment
made to address the problem over a 20-year period.
A financial model was developed that utilized data
from real estate industry sources, the Commonwealth
of Kentucky, Louisville Metro Government and the
Jefferson County Property Valuation Administrator to
create assumptions about expenditures related to
either a baseline maintenance or intervention (more
aggressive) level of activity. A presentation of the
return on investment results is contained in Section 7 of
this report.
6. VAP Study Review Process
Over the course of the project and development of the
VAP Study, senior leadership within Metro
Government (the “VAP Steering Committee”) played a
role in reviewing and guiding the development of the
plan’s recommendations and supporting analysis.
After an initial draft of the strategies was developed,
a review process that involved the Steering
Committee, the housing community and other
interested parties was completed. On May 22, 2013,
a meeting with the VAP Steering Committee was held
to review the long-term recommendations, with a
follow-up conference call on June 6, 2013.
Also on June 6, 2013, the RKG Team presented the
draft study for review to Metro Council Members Kelly
Downard and Attica Scott of the Ad-hoc Committee on
Vacant Properties. Following this meeting, the RKG
Team gave a presentation to the Homebuilders
Association of Louisville on June 10, 2013 to gauge
developer buy-in and response to the draft strategies.
7. Study Contents
This report is a culmination of research, analysis and
discussions with stakeholders. It describes existing
conditions and presents a set of recommendations,
both near- and long-term, to address the problem and
promote neighborhood revitalization. The VAP
Neighborhood Revitalization Study includes the
following sections:
ES: Executive Summary
Section 1: Study Overview
Section 2: Early Intervention and Long-Term
Recommendations
Section 3: Demographics and Economic Base Analysis
Section 4: Housing Characteristics and Conditions
Section 5: VAP Problem and Underlying Factors
Section 6: Neighborhood Marketability
Analysis
Section 7: Economic Analysis and Public Return on
Investment Analysis
Appendix

Page | 2-1
VAP Neighborhood Revitalization Study
Section
2
A. KEY EARLY INTERVENTION AND
LONG-TERM
RECOMMENDATIONS
The following section contains a detailed description
of several key recommendations over the next ten
years designed to address and reduce the impacts of
the vacant and abandoned properties in Louisville.
The Early Intervention Recommendations are proposed
over the next 36 months and are specifically designed
to address the most pressing and viable near-term
opportunities for local government, with the
understanding that Metro Government cannot and
should not be the sole solution to the problem, but must
help direct and organize the effort. The
recommendations are designed to position Metro
Government and its revitalization partners to take
collective actions that are strategic in nature, highly
coordinated, and set the stage for more complex,
longer-term strategies that will require a significant
commitment of planning, financial resources, and
political support. For a complete presentation of
early intervention and long-term recommendations,
see the implementation matrices at the end of Section
2.
The VAP neighborhood revitalization recommendations
are organized into the following five main elements:
� Element 1: Organizational Structure and
Administrative Action
� Element 2: Comprehensive Neighborhood
Revitalization, Planning, Capacity Building
� Element 3: Legislative Initiatives
� Element 4: Housing Rehab, Construction,
Demolition, Catalyst Projects
� Element 5: Funding
1.1. Element 1 - Organizational Structure and
Administrative Actions
Organizational Leader
The following roles were identified as appropriate for
Metro Government; keeping in mind that any strategy
that does not utilize Metro’s role to leverage other
public, private and nonprofit investment would be
viewed as unsuccessful.
� Set Strategic Vision and Priorities – Setting
and communicating Metro’s VAP vision is
something that can direct the efforts of all
parties in a more targeted way.
� Convene Key Revitalization Players – Metro
should identify and convene the key players
inside and outside of government (e.g., Metro
departments, nonprofit organizations, private
developers, etc.) at all levels to address the
VAP problem in a more comprehensive
neighborhood revitalization approach.
� Facilitate Local Initiatives - Metro should
identify and facilitate the various competing
interests (e.g., Metro departments, nonprofit
organizations, private developers, etc.) and
provide strategic direction and support for
key implementation partners.
� Set Revitalization Standards/Coordinate
Efforts – The efforts of all parties should be
coordinated to maximize their impact and
effectiveness. This includes the work of Metro
departments, nonprofit organizations, lending
institutions, private developers/builders and
other players. Metro can also set standards
for revitalization through its planning and
regulatory efforts.
� Community Outreach and Capacity Building –
The capacity of local neighborhood
associations to understand and assist in
revitalization is important, but largely
underdeveloped in many of Louisville’s
neighborhoods. Metro should increase its
neighborhood presence, where necessary, to
provide support and capacity building to
neighborhood associations and residents.
Page | 2-2
VAP Neighborhood Revitalization Study
Section
2 Development Partner and Funding Source
� Lender/Public Subsidies – Urban revitalization
often requires public investments to improve
infrastructure, provide amenities and/or
subsidize development activity. While not the
primary source of funding, Metro should be
prepared to play a greater financial role,
particularly to advance local revitalization
priorities or when no other funding source
exists.
� Land Assemblage and Title Clearance –
Assembling land for larger scale urban
redevelopment projects is time-consuming,
expensive and requires a patient investor.
For these reasons, this role has traditionally
fallen on the public sector, although not
exclusively. However, the ability to obtain
clear and marketable title through a Land
Bank is an essential and uniquely public role.
� Redeveloper/Deal-Maker – Being able to
reshape the direction and outcome of a
project area often requires involvement in the
deal. Most complex urban redevelopment
projects occur as public/private partnerships,
with both parties assuming and sharing in the
investment and development risk.
Organization to Lead Louisville Metro’s VAP Neighborhood
Revitalization Initiative
In order to address the full range of issues related to
VAP neighborhood revitalization, Metro Government
must create an organization with the technical
expertise, full-time staff resources, and the powers
and authorities required to respond to the current
problem – in its size, scale and complexity. Currently,
Metro Government responsibility for VAP issues falls
on several local government departments including:
(1) Community Services and Revitalization, (2) Codes
& Regulations, (3) Economic Growth and Innovation
and (4) the Mayor’s Office/VAP Director. Indirectly,
the Landbank Authority, the Urban Renewal
Commission and the Housing Authority are engaged in
housing and redevelopment issues; some of them VAP
related. Metro department staff dedicate a
relatively small portion of their time to VAP issues, in
addition to their other department responsibilities.
Given the magnitude of Metro’s VAP problem, the
municipal response does not appear to be sufficient to
address the problem as it exists today. There are
several areas where the response needs adjustment
and this can be done through the deployment of
existing department resources in the short-term, but
requires a more aggressive organizational response in
the long-term.
In the short-term, Metro Government should take a
more focused leadership role in addressing the VAP
problem, and more broadly, neighborhood
revitalization. In order to accomplish this, a lead
coordinator is necessary to begin organizing,
deploying and coordinating the government’s
response on a daily basis. This study recognizes that it
may take 12 to 36 months to “ramp-up” Metro’s
response, establish project and programmatic
priorities and allocate additional resources to the
address the problem. However, the RKG Team does
not believe this “ramp-up” strategy is sufficient on its
own to address the problem and Metro Government
must be prepared to take more aggressive actions.
In addition, Metro should begin to deploy its municipal
powers and authority in a way that is more effective
and responsive to the challenges facing the City. The
major elements of Element 1 (Organizational Structure
and Administrative Actions) include:
EARLY INTERVENTION RECOMMENDATIONS
1. Identify Full-time VAP Coordinator
A senior level professional is necessary to lead the
Metro response and coordinate the activities of other
department officials, non-profit organizations and
private development partners. Initially, it may be
appropriate to house the “VAP Coordinator” in the
Department of Community Services and Revitalization,
as the department largely responsible for Metro’s
urban revitalization activities. The VAP Coordinator
will work closely with existing Metro staff, across

Page | 2-3
VAP Neighborhood Revitalization Study
Section
2 departments, to carry out a more coordinated
response. The primary responsibilities of this position
include the following:
� Coordinate Metro Government VAP
Leadership Team in the Areas of:
− neighborhood planning, revitalization,
and federal funding programs, and
projects;
− Code enforcement and abatement;
− Judicial foreclosures & escheatments;
− Economic development;
− Municipal tax liens;
− Demolition;
− Landbank Authority activities;
− Urban Renewal Commission activities;
− Historic preservation and property
review;
− Police, Fire & EMT Services;
− Public Works activities;
− Planning and Design;
− VAPStat;
− County Sheriff;
− County Clerk; and
− Neighborhood outreach and
communication.
� Set Metro’s VAP Program & Project Priorities
− Work with strategic housing, development
and revitalization partners to identify
geographic public investment areas;
− Work with others to identify key Metro
project and program initiatives; and
− Develop joint initiatives with non-profit
and for-profit partners.
2. Assess Internal Organizational Structure
Given the number of departments involved in the VAP
effort, Metro Government should conduct an internal
assessment of its organizational structure and identify
whether it is best positioned to meet the vacant and
abandoned property challenges. Attention should be
paid to where functions are housed, organizational
alignment, how efficiencies can be achieved, the
process by which initiatives are introduced, decisions
are made, and what roles different departments and
staff play in doing so.
3. Establish a High-Level Memorandum of Agreement
(MOA) Between Existing Urban Renewal Commission,
Landbank Authority and the Vacant Property Review
Commission
Under Kentucky’s enabling legislation, none of these
entities possess all the powers and authorities to
adequately respond to the VAP problem on their own,
thus a MOA is necessary to enhance Metro
Government’s response. The new VAP Coordinator
would be responsible for providing staff support and
leadership to all three boards.
LONG-TERM RECOMMENDATIONS
4. Create “LouisvilleNOW” as a Joint Urban
Renewal/Landbank/Vacant Property Review Commission
Authority
Metro Government should pursue the opportunity to
merge and fully integrate the Urban Renewal
Commission, Landbank Authority, and Vacant Property
Review Commission into a single entity with a separate
board of directors. In order to create a combined
authority, a formal legal opinion from the Jefferson
County Attorney’s Office is required to identify
potential legislative changes for consideration by the
Key Urban Renewal Authority powers:
• Acquire, sell and develop real estate assets,
• Generate revenue through the issuance of revenue bond,
• Using special taxing powers, including the creation of tax
increment financing districts and other special assessment districts,
• Participate in real estate development deals, and
• Blight removal through eminent domain powers.
Key Landbank Powers:
• Land acquisition, holding and disposition,
• Title clearance and marketable title, and
• The ability to accept the donation of real estate assets.
Vacant Property Review Commission:
• “Spot” condemnation
• Triple tax program

Page | 2-4
VAP Neighborhood Revitalization Study
Section
2 Kentucky General Assembly, as well as resolve the
issue around the fact that the Landbank Authority has
representation from the local school district and the
Commonwealth of Kentucky, whereas the Urban
Renewal Commission and Vacant Property Review
Commission do not.
This entity would require full-time, dedicated staff that
would have the ability to design and lead major
project initiatives that can be implemented in
combination with public, private, and non-profit
partners. Metro Government currently lacks the full-
time staff capability to be an equal public sector
development partner in more complex, larger scale
initiatives. Key technical skills include: high level real
estate development, finance, construction & project
management, public deal-making expertise, together
with property appraisals, property maintenance,
acquisition, and legal research. Organizational
flexibility is also necessary to be able to structure and
negotiate development deals with development
interests without local politics taking precedence.
ACTION STEPS (Next 36 Months):
Metro Government currently plays all the roles
outlined at the beginning of this section, but not
consistently and not always at a high enough level to
produce significant and lasting results. RKG
recommends the following action steps be considered
to define Metro’s role in this area.
� Take immediate action to promote the results
of the VAP study to all housing and
neighborhood revitalization partners.
� Draft a Memorandum of Agreement (MOA)
between the existing Urban Renewal
Commission (URC), the Landbank Authority
(LBA) and Vacant Property Review
Commission (VPRC) to formally define the
roles and functions of both organizations in
addressing the VAP problem and urban
redevelopment opportunities in general.
� In the short-term, hire a full-time VAP
coordinator to lead and coordinate the
activities of the URC, LBA and VPRC with
additional staff support from the Department
of Community Services and Revitalization.
ACTION STEPS (Year 4-10):
� Establish "LouisvilleNOW" redevelopment
authority to address the needs of urban
blight, property vacancy and abandonment
and economic development in Louisville's
urban neighborhoods.
� Appoint a 5-person board of directors to
create and incorporate the urban renewal
authority and expand the board to 11
members after Year 1 with broader
community membership.
� Hire a director and professional staff to
manage the day-to-day operations of
LouisvilleNOW and the Landbank Authority.
� Prepare a development plan to guide
renewal authority actions per KRS 99.030.
� Incorporate the Landbank Authority, Inc. and
Vacant Property Review Commission boards
into a single consolidated LouisvilleNOW
renewal authority board of directors.
1.2. Element 2 - Comprehensive Neighborhood
Revitalization, Planning and Capacity
Building
Comprehensive neighborhood revitalization planning
includes the assessment of existing conditions and
development of action plans that address several
critical developments elements rather than focusing
solely on one element of the neighborhood
redevelopment process. Although it is evident that
vacant and abandoned properties are a primary
contributor to blight and disinvestment, the foundation
of sustainable neighborhood planning requires
strategies that address housing stabilization through
code enforcement and demolition, future zoning and
land use, infrastructure, crime, economic development,
and most importantly human capacity development.
Capacity Building is a necessary component of
comprehensive revitalization planning and strategies,
as resident stakeholders must have the skills needed to

Page | 2-5
VAP Neighborhood Revitalization Study
Section
2 sustain successful redevelopment strategies in their
neighborhoods.
EARLY INTERVENTION RECOMMENDATIONS
5. Adopt Programs to Dispose of Vacant Lots not Critical to
Future Revitalization Efforts
A number of vacant and abandoned properties are
either too small, oddly configured or poorly located
and may never become part of a larger
redevelopment initiative. In such cases, properties
owned or controlled by Metro Government should be
disposed of to reduce long-term property
maintenance expenses and to support local non-profits
or CHDOs. There are a number of best practices from
other cities, but all land disposition programs must be
marketed and promoted to interested groups or
individuals. Some possible initiatives include:
� Formalize and ramp up the “Lot Next Door”
Program – vacant lots are sold or gifted to next
door neighbors desiring larger side or rear yards
or land for off-street parking, garages or lawns.
� Neighborhood Harvest Program – vacant lots are
sold or donated to non-profit groups interested in
creating and managing urban gardens and
farming programs in neighborhoods without access
to fresh produce, also known as “food deserts.” It
might be helpful to provide soil and ground water
testing services to address concerns about
potential soil contamination or illegal dumping of
toxic substances.
� Urban Reforesting/Regreening Program – vacant
properties are sold and deeded to non-profit
groups interested in urban reforesting or
neighborhood greening programs. Alternatively,
the City retains contiguous parcels to create
wooded lots, either for permanent use or as a
transition use until redevelopment occurs.
� CDC Capacity Building Program – Proactively
work with local housing development
organizations to ensure that vacant parcels or
homes are sold or gifted to establish CDCs or
other housing organizations interested in building
or renovating existing housing units. Property
inventory and site control are very difficult for
small non-profit housing providers and such a
program will help build local capacity at the
neighborhood level.
6. Identify Priority Project Areas Considering Neighborhood
Marketability
There are two primary approaches to reinvestment
when applying the marketability analysis described in
Section 6. First, policy and programmatic initiatives
might focus on “transitional” areas, or those areas that
are becoming less stable over time. These are areas
where the marketability is neutral (0=yellow), slightly
negative (pink), or slightly positive (light green) (see
Maps 6-1, 6-2 and 6-3 in Section 6). These parcels
are either positioned to become stronger residential
areas with the right targeted investments or they could
slide further into decline without reinvestment.
Targeting transitional areas for revitalization offers
advantages by: (1) reducing public investment risk; (2)
increasing the ability to attract private investment
partners; (3) increasing the ability to market
new/rehabbed homes to new residents; and (4)
potentially reducing public subsidies needed to attract
private investment.
The alternative approach to urban revitalization
focuses on areas with the greatest concentration of
negative marketability scores, or those areas with the
most profound social, economic, and housing needs.
These areas are generally seen as less desirable by
private investors, developers, homebuyers, and
renters. However, this approach offers an opportunity
to create the greatest change to a “high need” area.
Such neighborhoods exhibit concentrations of blight,
crime, and other factors that create investment
obstacles and make revitalization more costly and
riskier. Historically, Metro Government has taken this
approach to urban revitalization with mixed results.
In assessing neighborhood revitalization areas, it is
important to know a neighborhood’s life cycle since
each stage requires a different type of strategy to
achieve an effective outcome. For example, assuming
that short term outcomes are a priority in a tipping

Page | 2-6
VAP Neighborhood Revitalization Study
Section
2 point neighborhood, the intervention strategy should
include cleanup/fix up programs to immediately
address early signs of blight and encourage private
sector reinvestment. However, if the intervention
strategy involves a neighborhood with wide spread
disinvestment, the initial intervention strategy may
require increased code enforcement and demolition of
vacant buildings as a means of stabilizing the
neighborhood and setting the stage for long range
planning to guide how reinvestment should occur.
RKG’s neighborhood marketability analysis was
designed to identify general areas where targeted
policy and investments can take place to improve
housing and neighborhood conditions in Louisville. The
analysis should be used in combination with the
decision making matrix discussed in the following
recommendation to begin addressing the vacant and
abandoned property problem that is limiting
neighborhood potential throughout Metro Louisville.
Understanding which areas are most marketable to
investors and future homebuyers/renters is an
important element to determine where to target
reinvestment efforts. The strongest strategy for
addressing these issues involves a combination of
analyses and a broad understanding of the existing
environment.
7. Utilize Decision Making Matrix (DMM) for Selecting
Priority Project Areas
As suggested earlier, dispersed reinvestment efforts
will not significantly impact the real estate market
without concentrated efforts by Metro Government to
correct market failures and fill in development “holes”
in the neighborhood. Strategic investments should be
made in areas that will produce an investment
response from other important development players –
private investment money often flows to where public
dollars are being spent, usually in the form of federal
grants, loans, financial subsidies, and infrastructure
improvements.
An objective, fact-based decision-making process is
necessary to make decisions on where to target public
investment and programmatic resources, designate
special districts, start neighborhood planning, and
direct federal funding. This process can help reduce
the possibility of interest groups trying to subjectively
influence the decision-making process and can
prepare neighborhoods for future revitalization.
The consultants identified a range of evaluation
criteria that could be used to inform a decision-making
matrix, including many of the factors that are
considered when project initiatives are viewed within
the context of implementation.
The decision-making matrix is not designed to assess a
good or bad project, but should be used as a tool to
assist in making a determination about where to
target public interventions, also called Priority Project
Areas. Priority Project Areas, or PPAs, are
revitalization areas, usually smaller than
neighborhoods, that have both the need and potential
for revitalization. Within each PPA, specific project
activities (e.g., new housing development and
rehabilitation, crime prevention, commercial
redevelopment, housing subsidies, etc.) are identified
to take place. These project activities may be
concentrated in several blocks or a single property
depending the opportunity.
The decision-making matrix, or DMM, accomplishes the
following objectives:
� Establishes a structured process for review and assessment of short-term projects
� Creates a framework for making objective
decisions
� Diminishes influences exerted by special
interest groups
� Promotes “implementation readiness” in non-
selected areas
� Targets public investment where it can be most
effective
� Targets programmatic resources
� Designates special districts
� Directs neighborhood planning efforts
� Directs federal funding
� Directs Metro Government response

Page | 2-7
VAP Neighborhood Revitalization Study
Section
2
The use of the decision-making matrix is based on the
assumption that successful neighborhood
redevelopment initiatives have characteristics that are
fundamental to their success. Generally these
characteristics have three basic segments:
1. Neighborhood Project Area Characteristics – The
area exhibits existing conditions that serve as a
foundation for development.
2. Characteristics for Future Development - Existing
conditions or resources needed for urban
redevelopment are present.
3. Market Characteristics - Existing characteristics
can be promoted as part of a campaign to retain
existing residents and attract new residents to the
area.
The decision-making matrix creates a framework for
making objective decisions on which projects can be
initiated in the short-term and long-term and the
range of pre-development assistance needed for
implementation. Potential Priority Project Areas should
be ranked on a scale of 1 – 10 for each evaluation
criteria, with a score of 10 indicating the highest
potential for housing development and/or
neighborhood revitalization opportunities and a score
of 1 indicating the lowest potential. If desired, Metro
Government could consider weighting various criteria
and perhaps give preferences for funding and
implementation readiness.
Determining PPAs within a neighborhood requires a
more detailed analysis of the area. The detailed
analysis includes a thorough assessment process that
takes into consideration each of the key reinvestment
elements that are most critical to developers when
they are making decisions as to whether or not to get
involved in a neighborhood revitalization initiative.
Figure 2-1 contains the proposed evaluation criteria
for Louisville Metro Government in the selection of
PPAs. The evaluation factors are general in nature
and can be refined as the City sees fit to meet its
needs.
For initial consideration, a series of potential Priority
Project Areas have been listed in this report in Section
6. These areas include both those identified by the
Department of Community Services and Revitalization
based on existing activity; as well as those identified
by the consultant team as a result of the neighborhood
marketability analysis.
NEIGHBORHOOD PROJECT AREA CHARACTERISTICS PPA 1 PPA 2 PPA 3 PPA 4 PPA5
Area has a Current Revitalization or Small Area Plan
Proximity to Public Transit
Proximity to Community Facilities, Shopping and Other Institutions
Concentration of Poverty
Existence of Active Community Organizations with Capacity
Incidence of Crime Activity
Subtotal - Neighborhood Project Area Characteristics
DEVELOPMENT POTENTIAL CHARACTERISTICS
Vacant Housing Stock Potential for Rehabilitation
Availability and Control of Land Resources for Development
Current Homeownship Rate
Quality of Existing Infrastructure
Compatibility of Existing Zoning & Land Uses
Subtotal - Development Potential Characteristics
MARKET CHARACTERISTICS
Current or Proposed Public, Private or Nonprofit Sector Initiatives
Project Area has the Ability to Attract Development Interest
Dedicated Funding Available for Program Activities
Stability of Real Estate Values within Past 2 Years
Subtotal - Market Characteristics
Total - All Evaluation Criteria
Louisville Metro Neighborhood Revitalization Decision-Making Matrix

Page | 2-8
VAP Neighborhood Revitalization Study
Section
2
Figure 2-1: DECISION-MAKING MATRIX EVALUATION CRITERION
Neighborhood Project Area Characteristics • Area Has a Current Revitalization or Small Area Plan: PPAs that are part of a small area or neighborhood
planning effort should receive priority. Existing plans indicate that the area is already part of a revitalization effort.
• Proximity to Public Transit: Areas that are within a quarter mile (1/4 mile) of public transportation indicate that they are within a reasonable walking distance for riders to access transit and are considered an asset.
• Proximity to Community Facilities, Shopping and Other Institutions: Areas within one to two miles of amenities such as parks, libraries, churches, schools, and retail centers are attractive to residents and potential homebuyers or renters and assets to a PPA.
• Concentration of Poverty: When comparing potential PPAs, those that have lower concentrations of poverty may have fewer challenges to overcome for revitalization. Particularly high concentrations of poverty may be a disincentive for investors and developers.
• Existence of Active Community Organizations with Capacity: Are there community organizations already working or willing to work in the area that may be potential partners? These organizations include community development corporations and for-profit or non-profit developers, among others.
• Incidence of Crime Activity: This is a comparative measure across the potential PPAs. Higher crime rates, especially violent crime, can impact the perception of the area and act as a potential deterrent for developers and homebuyers or renters.
Development Potential Characteristics • Vacant Housing Stock Potential for Rehabilitation: Existing vacant housing units that are available for
rehabilitation are an asset to a PPA. A moderate quantity of these properties within a PPA can help to catalyze a revitalization effort.
• Availability and Control of Land Resources for Development: Concentrations of identified abandoned properties, or those owned by Louisville Metro Government or the Landbank Authority. These represent resources that can be packaged and sold in a timely manner due to governmental control or knowledge of availability. Similar to vacant housing stock, these land resources can help catalyze a revitalization project within a PPA.
• Current Homeownership Rate: Census derived metric. Comparatively higher rates of homeownership will be an asset for those PPAs and attractive to developers and homebuyers as it contributes to area stability.
• Quality of Existing Infrastructure: Infrastructure includes streets, sidewalks, parks/recreation facilities, and water and sewer systems. Is the existing infrastructure in good shape? Does it have the capacity to accommodate additional development? Areas with sound infrastructure may be better positioned for revitalization.
• Compatibility of Existing Zoning & Land Uses: Are there existing land uses, such as industrial buildings or railroads, that may deter residential development and impact current and future plans? Are the existing zoning regulations consistent with revitalization plans? If multi-family units are most needed, does the area have the proper zoning? Those PPAs that require rezoning changes may slow the revitalization process.
Market Characteristics • Current or Proposed Public, Private or Non-Profit Sector Initiatives: PPAs in which entities are already active
and have existing initiatives from which to build upon will score higher than those that do not.
• Project Area has the Ability to Attract Development Interest: PPAs with lower perceptions of crime or other negative factors, existing incentives for development and Louisville Metro owned land and buildings available for purchase will be more attractive to developers than those that do not have these factors.
• Dedicated Funding Available for Program Activities: Areas that are already receiving funding or are designated as target areas for CDBG/HOME and other funds or have attracted investments from the Louisville Metro Housing Authority, HOPE VI or other funds should receive higher priority.
• Stability of Real Estate Values in the Past 2 Years: Have the real estate values been stable in the neighborhood and area in and around the area? A consultation with the Jefferson County Property Valuation Administrator will provide insight into sales activity and planned changes in value for these areas.

Page | 2-9
VAP Neighborhood Revitalization Study
Section
2 Process for Evaluating Potential PPAs
CSR should organize a small committee process to
evaluate the revitalization potential of different
neighborhoods. While the final decision on where the
City invests its revitalization dollars should remain in
Metro Hall, it is recommended that trusted
revitalization partners (both for-profit and non-profit)
be invited to participate in the evaluation process.
The evaluation should also include some outreach to
each neighborhood under consideration in order to
gather grassroots input and a local perspective. This
process should involve the following steps:
� Assemble evaluation team
� Collect quantitative and qualitative data for
areas under consideration
� Conduct outreach to representatives of
communities being considered
� Organize local leadership
� Consult on community needs and potential
opportunities
� Conduct quantitative and qualitative
evaluation of proposed PPA criterion
� Make recommendations on Top 3 PPAs
� Meet with local representatives to review
evaluation results and prepare for next steps
8. Undertake Revitalization Efforts in the Shawnee
Neighborhood as a Pilot Revitalization Initiative
The Shawnee neighborhood is suggested to be used
as a first example of the “Priority Project Area”
approach, which will utilize many of the strategies
found in this report and show what the potential results
and impacts are. The Department of Community
Services & Revitalization has recently completed a
Neighborhood Revitalization Strategy Area (NRSA)
Plan for Shawnee, which will target housing
rehabilitation and economic development activities in
the neighborhood. The activities supported by the
NRSA funding allocation ($2 million over 5 years) will
then be leveraged by a range of activities that
involve the coordinated efforts of multiple Metro
Departments, including:
� Homeowner Rehabilitation
� Economic Development
� Code Enforcement & Nuisance Abatement
� Streetscape Improvements
� Public Improvements and Infrastructure
� Public Safety
� Dedicated Metro Staffing
� Targeted outreach for other CSR programs
(e.g., Weatherization Assistance Program,
financial management workshops, etc.)
LONG-TERM RECOMMENDATIONS
Public/Private Development Partnerships
Long term sustainable comprehensive neighborhood
planning requires public/private partnerships and
consistent local government support. These elements
are necessary to build long-term resident stakeholder
capacity. Although there is an obvious desire and
need to “get something started” as soon as possible,
there is also a responsibility to establish a
reinvestment environment that recognizes the value of
partnerships, local champions, and establishing a
regulatory environment that will guide future
development. Building resident capacity is necessary
to sustain any change taking place within and around
their environment.
Establishment of a policy and regulatory framework
for neighborhood revitalization is one of the most
important components to ensure private sector
investment. The private sector needs to be reassured
that the public sector has created a framework
conducive to and for investment. This framework
should include this VAP study, neighborhood
revitalization plans, historic preservation or
neighborhood conservation policies, land use, zoning
and other regulatory policies that encourage vibrant,
mixed-use development with density allowances.
9. Manage Neighborhood Revitalization Strategy Areas to
Encourage Public/ Private Investment
Implementing revitalization strategies in
neighborhoods that have experienced years of
disinvestment is viewed as a very risky investment by
private sector developers. However, it is difficult, if
not impossible, to achieve long term gains without
“setting the stage” for reinvestment. Setting the stage

Page | 2-10
VAP Neighborhood Revitalization Study
Section
2 for private sector investment occurs through public
sector leadership providing key predevelopment
services such as land assembly, zoning and land use,
urban planning and visioning, and design assistance
that reinforces architecture and design inherent to the
neighborhood. Often a set of design standards or a
pattern book is created to provide guidance to
contractors and developers engaged in building
renovations. Such standards create a coherent design
vocabulary for an area that complements the historic
building stock, but are not so prescriptive as to
become an obstacle to revitalization.
10. Establish Training Workshop for Local Development
Partners to Expand Capacity
Regardless of the location in which neighborhood
revitalization occurs, the first developers to begin
implementing the revitalization process are generally
nonprofit developers. Training and capacity building
are an important part of any organization’s growth
and ability to provide the highest possible quality of
service. Access to local, regional, and national support
is key to the nonprofit professional growth but often
the organization’s limited or restricted budget
constraints reduces accessibility to the necessary
training.
Local government funding and support are often the
only access many nonprofit developers have for
quality training and capacity building. Cities across
the country are increasingly recognizing the
importance of providing this capacity building training
and are now making this training a condition of public
sector funding support.
ACTION PLAN (Next 36 Months):
� Use the neighborhood marketability analysis
to identify potential areas for consideration
as future PPAs.
� Adopt use of the Decision Making Matrix to
identify where to target public investment and
programmatic resources, designate special
districts, begin neighborhood planning, and
direct federal funding.
� Identify up to three Priority Project Areas and
begin designing project initiatives in each
area in coordination with private/nonprofit
partners and local residents.
� Evaluate revitalization potential for the
Priority Project Areas and select three areas
requiring small area or neighborhood
revitalization plans.
� Initiate neighborhood planning and capacity
building efforts and begin project planning
with partners.
� Prepare land acquisition and assemblage
strategy in each Priority Project Area.
� Begin targeting resources to address top
revitalization needs.
� Begin project implementation.
ACTION PLAN (Years 4-10):
� Provide predevelopment services such as
rezoning, architectural services, land
assembly, and financial incentives designed to
encourage private sector participation by
banks, mortgage lenders and private
developers.
� Establish a Project Management Team
consisting of Metro Government department
heads critical to redevelopment.
� Establish a training workshop for local
nonprofit development partners to expand
capacity.
� Work with political representatives, civic
leadership, and the business community to
create local champions.

Page | 2-11
VAP Neighborhood Revitalization Study
Section
2 1.3. Element 3 - Legislative Initiatives
EARLY INTERVENTION RECOMMENDATIONS
11. Pursue Legislative Changes to Enhance the Powers of the
Landbank Authority
There are a number of legislative priorities related to
the expansion of powers granted to land banks under
Kentucky statutes. Metro Government should seek
changes in the state enabling legislation to allow the
Landbank Authority to have more flexibility to
acquire, hold, assemble properties, clear title, and
repackage real estate for redevelopment.
ACTION PLAN (Next 36 Months):
� Pursue changes to enhance the powers of the Landbank Authority to include:
− Allowing for the clearance of clouded title
to make properties marketable for sale
and financing;
− Removal of limits on timely disposition of
property to allow for longer landholding
period;
− Removal of limits on land assemblage for
only public parks or public purposes;
− Removal of limits on Landbank activities
by local government (i.e., Landbank may
not dispose of property without receiving
approval of board members);
− Removal of restrictions on the Landbank to
acquire property for investment purposes;
� Pass a local foreclosure registry ordinance to track homes that have become vacant due to foreclosure.
1.4. Element 4 - Housing Rehabilitation,
Construction, Demolition and Catalyst
Development
A primary goal of neighborhood revitalization is to
preserve and protect the architectural and historical
character of the targeted neighborhoods. The
recommended approach to housing rehab and new
infill construction is one that combines elements of code
enforcement, rehab design standards, and
preservation or neighborhood conservation. Combining
these features will help in protecting the unique
character of revitalization neighborhoods. The project
approach should include several key elements:
� Encourage architectural sensitivity and rehab
standards as part of the overall approach to
both minor and major rehabilitation.
� Provide housing counseling that prepares
families and individuals to transition from
rental to owner-occupancy.
� Create financial incentives that encourage
investor-owners to reinvest in their property
without having to pass the cost of reinvestment
on to lower income tenants.
� Link identification of code violations with
financial incentives and technical assistance to
encourage reinvestment.
� Market vacant and abandoned homes to
moderate/middle income homebuyers to
facilitate mixed income households moving
into PPAs.
EARLY INTERVENTION RECOMMENDATIONS
12. Establish Rehabilitation and Design Standards and
Construction Specifications for Publicly Subsidized Housing
Projects
The consultants observed several instances where new
housing development was out of scale and character
with adjacent properties. Metro Government should
establish standards for rehab and redevelopment,
which will allow for more consistency in finished
standards and ensure that new/infill construction does
not disrupt the fabric of the local community. Where

Page | 2-12
VAP Neighborhood Revitalization Study
Section
2 the Department of Community Services and
Revitalization is providing resources to enable the
rehab activity, there is a greater ability to establish
and enforce standards around building, construction
and architecture, as well as green/sustainability
practices.
The purchase of a Metro-owned property by a for-
profit entity, a nonprofit organization, or a
prospective homebuyer should be closely monitored,
especially for those projects receiving public funding
or other subsidies. This could include the preparation
of plans and construction specifications on the basis of
guidelines and specifications that meet the criteria
established by Metro Government. The use of a
nonprofit development corporation is often a key
element in the early intervention of neighborhood
redevelopment because of their willingness to take on
more risk than most for-profit builders and
developers. The rehabilitation process should include
the preparation of detailed work write-ups and
construction specifications to guide all rehab projects.
The use of design standards for all renovations should
also be considered as part of any work. The City’s
willingness or interest in setting such standards should
be driven, in part, by the community’s desire to see its
character preserved.
13. Establish Criteria for Targeting and Evaluating Housing
Demolition Candidates.
Neighborhoods that show clear signs of blight caused
by vacant and abandoned housing require a very
deliberate stabilization strategy before it can be
successfully marketed to investors, builders,
developers, or new homebuyers. More importantly,
stabilizing a neighborhood is critical to existing
homeowners or investor-owners making a decision to
invest in their own property.
Wholesale demolition is not encouraged since the best
way to protect a neighborhood’s history and culture is
through the rehabilitation of its existing housing stock.
However, an existing conditions assessment of a
building to determine the feasibility of rehabilitation is
an essential part of making sure good housing stock is
saved for future redevelopment. It is just as useful to
determine the housing stock that cannot be feasibly
renovated or restored; and recommend these
structures for demolition as part of the initial strategy
to stabilize the neighborhood.
Criteria should be established for targeting and
evaluating housing demolition candidates based on
the following criteria:
� Threat to public health, safety, and welfare;
� Contributing to neighborhood blight;
� Potential crime threat;
� Located in a Project Priority Area;
� Has unpaid tax and abatement liens;
� Going through municipal foreclosure;
� Not a contributing structure to an established
historic district; and
� Property has redevelopment value as part of
a larger (re)development project.
14. Prepare Request for Qualifications to Solicit Key Housing
Development and Redevelopment Partners
Metro Government should prepare a Request for
Qualifications to solicit key housing development
partners. This RFQ should include guidelines around
production capacity, counseling capacity, access to
funding, marketing, sales, property management,
etc. Through interviewing a number of qualified
housing developers, Metro Government can determine
the proposed project approach and the level of
project related assistance and subsidies needed.
LONG-TERM RECOMMENDATIONS
15. Establish Process and Requalification Procedures for
Annual Developer Participation
Building the capacity of community-based, non-profit
development corporations is an important part of the
long-term strategy for neighborhood redevelopment.
Capacity building should be provided in the following
areas:
� Homebuyer pre/post purchase counseling
� Assemblage of property for development
� Affordable in-fill new construction
� Renovation of vacant houses

Page | 2-13
VAP Neighborhood Revitalization Study
Section
2 � Economic development projects
� Repair of occupied houses
Although local government/private sector intentions
are for the good of the community, their roles are
often misunderstood by local residents, and generally
linked to past experiences. An effective CDC can act
as an intermediary to help translate programs and
strategies into terms and conditions that residents can
understand and believe.
16. Establish Regulatory and Site Planning Framework to
Guide Neighborhood Redevelopment and Reinvestment
Many of the neighborhoods experiencing high
concentrations of vacant and abandoned houses have
a number of historically significant buildings. However,
many of these buildings are showing signs of years of
deferred maintenance and neglect. While Louisville
has an impressive collection of architecturally
significant buildings throughout its urban core
neighborhoods, a number of these homes are being
lost to demolition. In addition to a deteriorating older
housing stock, new development is often constructed
without consideration of the architecture and design of
the surrounding existing homes.
Because a large number of occupied homes needing
minor to major rehabilitation are located in
neighborhoods with fairly high numbers of vacant
buildings, there are opportunities to create a “Model
Block” neighborhood redevelopment initiative that
features investment in occupied homes needing
moderate repairs and the rehabilitation of vacant
homes need major rehabilitation. The objective of a
Model Block Project would be to demonstrate the
application of this initiative to other neighborhoods
throughout Louisville.
The model block project approaches urban
revitalization on a block or street level and plans the
activities in much the same way as a master
developer. Metro Government, through
LouisvilleNOW, would prepare the site plans and
assemble land as necessary. The renewal authority
would provide construction drawings, establish housing
rehabilitation and design standards, solicit builders
and developers and provide subsidies where
necessary to achieve the revitalization goals and to
attract private money.
ACTION PLAN (Next 36 Months):
� Establish process and qualifications for
developer participation.
� Prepare Request for Qualifications to solicit
key housing development and redevelopment
partners. RFQ to include qualification
guidelines (e.g. production capacity,
counseling capacity, access to funding, market,
sales, property management experience).
� Establish rehab standards, construction
practices, and design standards.
� Undertake a selective housing demolition
program to reduce blight and crime and
create redevelopment opportunities.
ACTION PLAN (Years 4-10):
� Establish process and re-qualifications
procedures for annual developer
participation.
� Create a program to encourage joint ventures
between non-profit and for-profit developers
on urban redevelopment projects.
� Design and adopt a Pattern Book to be used
by any developer accepting public funding
for redevelopment.
� Review the potential to adopt a
Neighborhood Conservation Zoning Overlay
to reinforce planned neighborhood
growth/redevelopment.
� Establish marketing and branding strategy to
build neighborhood assets to attract new
investment.
� Prepare scope of work to manage Landbank
assets during holding period prior to
development, including grass cutting,
winterizing, boarding, and stabilizing.

Page | 2-14
VAP Neighborhood Revitalization Study
Section
2 1.5. Element 5 - Funding
The level of resources required to address the VAP
problem will depend on the size and complexity of
Metro Government’s role, but at the high end could
require hundreds of millions of dollars. During the first
18 months, Metro Government will be expected to fill
the VAP Coordinator position, and perhaps an
assistant, to begin organizing the initiative and setting
short- and long-term priorities. During the first two to
three years, much of the project-based activities will
be funded through existing budgets and by shifting
department responsibilities where possible until major
project initiatives have been identified. Once these
major initiatives have been identified, larger funding
sources will be required.
Over the long-term, Metro Government needs to
explore financial strategies that will support the
larger public investments required to have a
significant impact. Such strategies will have to
consider utilizing Metro’s bonding capacity, or the
bonding capacity of a new redevelopment entity to
finance new project initiatives. It is estimated that
between $200 and $300 million in public resources
may be required to leverage an additional $300
million to $1.5 billion in private, foundation and other
financial commitments over the next 20 years to
revitalize some of Louisville’s most challenged
neighborhoods.
Many cities use tax increment financing (TIF) as part of
their redevelopment strategies, especially for large
economic development projects. Kentucky cities,
including Louisville, have also used TIFs for economic
development projects, but Kentucky law restricts TIF to
only certain types of projects. Further, TIF in Kentucky
may be less attractive and effective than in other
states because Kentucky generally has lower state
and local property taxes as compared to other
states. We recommend interested parties explore the
possibility of expanding Kentucky TIF statutes to
include smaller scale, residential or mixed used
redevelopment and whether or not TIFs could be
successfully used for neighborhood revitalization in
Kentucky.
EARLY INTERVENTION RECOMMENDATIONS
17. Secure Potential and Existing Funding Sources to Direct
Toward Implementation Activities, Including Resource Re-
allocation and Identifying New Funding Opportunities.
Urban revitalization often requires public investments
to improve infrastructure, provide amenities, and/or
subsidize development activity. While not the primary
source of funding, Metro should be prepared to play
a financial role, particularly to advance its
revitalization priorities or when no other funding
source exists.
18. Determine the Types of Assistance and Development
Subsidies Provided by Metro Government
In order to entice early revitalization activity in
declining neighborhoods, Metro Government will need
to provide a number of financial incentives; some of
them direct and other indirect, to future revitalization
partners. This will be necessary to reduce
development risk and to remove barriers that could
stop or slow redevelopment.
LONG-TERM RECOMMENDATIONS
The Cost of Doing Nothing
Louisville Metro Government’s ability to make long-
term funding commitments to neighborhood
revitalization will depend on several factors. Number
one, what level of public and political support will
there be for these initiatives in the face of other
competing public priorities and financial commitments?
Secondly, what costs will be incurred by Metro
Government in the future, irrespective of any
additional funding commitments? In other words, what
would be the cost to local taxpayers for taking no
additional action, if that were possible.
Currently, Metro Government is spending several
million dollars annually to fund a variety of code
enforcement, demolition, and foreclosure and
property maintenance activities on more than 6,000
vacant properties throughout Louisville. In addition,

Page | 2-15
VAP Neighborhood Revitalization Study
Section
2 the Department of Community Services &
Revitalization spends another $11 million annually to
fund community development, housing and
neighborhood revitalization activities, primarily with
the use of federal HUD entitlement money.1
Over time, continued neighborhood decline will
extract a cost from the community, either through
direct budget appropriations or through the erosion of
property values, increased crime and a multitude of
social problems. With nearly $11 billion in urban
residential assessed value located within the I-264
loop, just a 1% decline in values results in a loss of
$110 million in assessed value. A decline in real
property values of 1% would translate into a
potential loss of over $1.4 million in annual tax
revenues to local government.2 If this amount was
used to retire municipal bond debt, it could support a
20-year bond issuance of nearly $30 million. With
several neighborhoods in West Louisville experiencing
assessed value losses of between 4% and 17% in
2013, the stakes are high and costs are being
incurred on both sides of the municipal ledger
regardless of annual budget decisions.
ACTION PLAN (Next 36 Months):
� Establish internal policies for investing public
dollars in Priority Project Areas.
� Identify range of project activities to be
undertaken (e.g., public, private, and non-
profit) in each Priority Project Area.
� Establish project tasks for each area and
present planning initiatives to the Urban
Renewal Commission and Landbank Authority
for review.
� Present proposed work plan to Mayor and
Metro Council.
� Identify and secure potential and existing
funding sources to direct toward early
intervention activities.
1 E-mail from Robin Grammer, Executive Administrator, LMG Community Services & Revitalization, July 3, 2013. 2 Estimated assessed value loss taxed at a rate of $1.2921 per $100 in assessed value at current tax rates for Metro Louisville ($0.1255), Urban Service District ($0.3666), School District ($0.70) and Fire District ($0.10).
ACTION PLAN (Years 4-10):
� Create development subsidy support based
on leveraging public/private sector
investment.
� Capitalize a LouisvilleNOW development
fund that is self-sustaining to fund larger
redevelopment projects.
B. VAP EARLY INTERVENTION AND
LONG-TERM IMPLEMENTATION
MATRIX
The following VAP Early Intervention and Long-term
Implementation Matrixes contain a series of strategic
objectives and the actions necessary to implement a
variety of revitalization strategies. The implementation
matrix identifies the agencies or organizations
responsible for implementation of the above action
items, the relative timing of each action, and a rough
estimate of cost. The cost estimates are “order of
magnitude” estimates for planning purposes only.

LOUISVILLE METRO GOVERNMENT VAP EARLY INTERVENTION RECOMMENDATIONS AND ACTION PLAN Estimated
Short-Term Recommendations (Years 1-3) 1 2 3 Cost
Recommendation #1: Draft a Memorandum of Agreement (MOA) between the existing Urban Renewal Commission, Landbank Authority and Vacant Property Review Commission to formally define the roles
and functions in addressing the VAP problem and Neighborhood Revitalization Needs
Action 1: Establish functional roles, responsibilities and policies for each entity in carrying out coordinated urban revitalization and redevelopment Under $25,000
a. Determine renewable funding sources for Landbank to acquire property in Priority Project Areas (PPAs)
b. Establish property acquisition and building demolition goals, policies and procedures including criteria for disposition and development
c. Establish process, policies and procedures for management/marketing of Landbank assets during holding period
d. Evaluate the need and potential to establish a combined Urban Renewal/Landbank Authority
Action 2: Work with key Metro departments to prepare redevelopment master plans and implementation strategies for up to three comprehensive redevelopment initiatives in Priority Project Areas CSR,EGI
VPRC
$250,000 to
$500,000Action 3: Hire a VAP coordinator to lead Metro Government's VAP response and serve as staff support to the Landbank Authority, Urban Renewal Commission and Vacant Property Review Commission CSR $100,000 to
$250,000a. Ramp up to a full staff that has skill sets to conduct property appraisals, property maintenance, acquisition, legal research
Action 4: Expand current VAP Steering Committee into VAP Leadership Team with broader department involvement MO $100,000 to
$250,000a. Begin preparing coordinated annual work plans for key Metro departments for years 1-2 and 2-5
Recommendation #2: Establish Enhanced Role and Responsibilities of the Landbank Authority, Inc.
Action 1: See Recommendation #1, Action 1
Action 2: Select property appraisers, property maintenance, acquisition agent, and real estate attorney to support property acquisition program LB,CSR,CR $25,000 to $100,000
Action 3: Increase Landbank Authority legal staff capabilities to handle larger volumes of property research and title clearance LB,GC,CSR $100,000 to
$250,000Recommendation #3: Establish Role and Responsibility of Planning, Housing, and Neighborhood Development
Action 1: Review regulatory framework of Priority Project Areas to ensure zoning and land use will support VAP initiative PDS,CSR Nominal
Action 2: Establish project management criteria incl. design standards, construction practices, draw procedures, and warranties PDS,CSR Under $25,000
Recommendation #4: Improve Methods for Tracking Vacant, Abandoned and Foreclosed Properties in High Risk Neighborhoods
Action 1: Pass a local foreclosure registry ordinance to track homes that have become vacant due to foreclosure and update list annually MC,CR Under $25,000
Action 2: Improve data tracking and reporting between Departments involved in VAP, foreclosures, code abatement liens and demolitions - explore potential for a real-time property database that
consolidates information from different departments and allows for timely coordination, communication, implementation and project management
CC,CS,CSR,CR,MTS,
PVA,AOC
$25,000 to $100,000
Action 3: Organize grassroots neighborhood block committees to document the existence of poor condition and vacant properties on a quarterly basis CSR $25,000 to $100,000
Action 4: Develop new metrics to assess Metro performance CSR,EGI,CR Under $25,000
a. Number of homes and vacant lots redeveloped in each PPA
b. Impact of the VAP intervention including return-on-investment (ROI)
c. Temporary and permanent employment created
d. Additional public and private partnerships created
e. Reduction in Metro Government property maintenance & other expenditures
Page | 2-16
ELEMENT 1: ORGANIZATIONAL STRUCTURE AND ADMINISTRATIVE ACTIONS
CSR,VLT,MC,URC,GC,
LB,VPRC,URC
Implementation LeadImplementation Timing (Years)
Public Implementation Lead - Legend
AOC - Administrative Office of the Courts CC - County Clerk CR - Codes & Regs CS - County Sheriff CSR - Community Services & Revitalization EGI- Economic Growth & Innovation Task Initiated
GC - General Counsel/County Attorney LB - Landbank Authority LN - LouisvilleNOW MC - Metro Council MO - Mayor's Office MTS - Metro Technology Services
PC - Planning Commission PDS - Planning & Design Services PWA - Public Works and Assets URC - Urban Renewal Commission VLT - VAP Leadership Team VPRC - Vacant Property Review Commission Task Implemented
* the Innovation Delivery Team will assist lead agencies

LOUISVILLE METRO GOVERNMENT VAP EARLY INTERVENTION RECOMMENDATIONS AND ACTION PLAN Estimated
Short-Term Recommendations (Years 1-3) 1 2 3 Cost
Recommendation #1: Initiate Public Outreach to Revitalization, Development and Lending Community
Action 1: Take immediate action to promote the results of the Early Intervention Strategy and overall VAP vision to all housing and neighborhood revitalization partners CSR Under $25,000
a. Organize a Neighborhood Revitalization Forum to kick-off the release of the VAP Study and Priority Action Plan MO,CSR
Action 2: Convene members of mortgage lending, secondary mortgage market, developers, real estate appraisers to review the City's revitalization strategy in declining neighborhoods and the
challenges of development finance, market appraisals and project marketing and homeowner training
CSR,EGI Nominal
Action 3: Work with partners to define project priorities and identify (5) potential Project Priority Areas (focus area for a coordinated departmental response in targeted blocks) CSR,VLT,EGI Under $25,000
Identify Priority Project Areas (PPAs)
Action 1: Review consultants' block analysis and marketability data for all designated Neighborhood Revitalization Strategy Area Neighborhoods and select five potential Priority Project Areas (PPAs) CSR,EGI Nominal
Action 2: Adopt decision-making matrix criteria for the selection of three PPAs CSR,EGI Nominal
Action 3: Identify range of project activities to be undertaken (e.g., public, private and nonprofit) in each PPA CSR,EGI Under $25,000
Action 4: Prepare land acquisition and assemblage strategy for each Priority Project Area. CSR,EGI Under $25,000
Action 5: Pursue Shawnee area as first neighborhood revitalization model project CSR $1 mil to $5 mil
Recommendation #3: Identify Neighborhood Revitalization Strategy Areas to Guide Public and Private Investment Decisions
Action 1: Expand or create new Neighborhood Revitalization Strategy Area (NRSA) Action Plans for VAP Priority Project Areas (within designated NRSA neighborhoods) CSR Under $25,000
Action 2: Integrate job creation opportunities into redevelopment scenarios, i.e. Metrics should be established for each project based on creation of temporary jobs and permanent jobs CSR,EGI Under $25,000
Action 3: Promote public/private partnership opportunities among developers and interest groups, i.e. Metrics should be established regarding the number of additional public and private partnerships
created
CSR,EGI Under $25,000
Recommendation #4: Establish a Formal Process for Evaluating Specific Target Locations within VAP Priority Project Areas
Action 1: Adopt Decision-Making Matrix approach with pre-development criteria that takes into consideration housing conditions, ability to obtain site control, existing zoning, existing stability factors and
infrastructure conditions
CSR,EGI,PDS,PWA Under $25,000
Action 2: Assess development project's ability to succeed on the basis of market conditions, market demand, and competitive position CSR,EGI Under $25,000
Action 3: Establish economic development metrics based on selected development project's ability to create jobs, increase human capacity, and quality of life improvements, e.g. reduction in code
enforcement complaints, reduction in crime
CSR,EGI Nominal
Recommendation #5: Improve the Capacity of Local Housing Partners to Respond to Revitalization Needs
Action 1: Meet with individual private and non-profit sector developers to review VAP Strategy, potential NRSA areas, and potential programmatic initiatives to pursue CSR Under $25,000
Action 2: Work with individual non-profit housing groups to help define their capacity and project interests related to future housing development, rehabilitation and larger scale revitalization initiatives CSR Under $25,000
Recommendation #6: Introduce and Market Metro Program to Sell or Dispose Publically-owned VAP Properties not Critical to Redevelopment
Action 1: Adopt "The Lot Next Door" Proagrm to sell or deed lots to adjacent homeowners interested in utilizing VAP lots CSR,LB Under $25,000
Action 2: Adopt "Neighborhood Harvest Program" to support nonprofiorganizations interested in urban agriculture CSR,LB Under $25,000
Action 3: Adopt an "Urban Reforesting/Regreening Progrm" to support the regreening of urban VAP properties CSR,LB Under $25,000
Action 4: Adopt "CDC/CHDO Capacity Building Program" to provide VAP properties to active housing organizations CSR,LB Under $25,000
Recommendation #6: Improve the Grassroots Capacity of Neighborhood Associations to Undertake Community-based Action
Action 1: Create a Neighborhood Association Round Table Forum (or utilize existing similar platform) in West Louisville to identify revitalization needs and organize grassroots community initiatives CSR Under $25,000
Action 2: Initiate a grassroots capacity building initiative to strengthened the effectiveness of neighborhood associations and local non-profit community development corporations CSR $25,000 to $100,000
Page | 2-17
ELEMENT 2: COMPREHENSIVE NEIGHBORHOOD REVITALIZATION, PLANNING AND CAPACITY BUILDING
Recommendation #2:
Implementation LeadImplementation Timing (Years)
Public Implementation Lead - Legend
AOC - Administrative Office of the Courts CC - County Clerk CR - Codes & Regs CS - County Sheriff CSR - Community Services & Revitalization EGI- Economic Growth & Innovation Task Initiated
GC - General Counsel/County Attorney LB - Landbank Authority LN - LouisvilleNOW MC - Metro Council MO - Mayor's Office MTS - Metro Technology Services
PC - Planning Commission PDS - Planning & Design Services PWA - Public Works and Assets URC - Urban Renewal Commission VLT - VAP Leadership Team VPRC - Vacant Property Review Commission Task Implemented
* the Innovation Delivery Team will assist lead agencies

LOUISVILLE METRO GOVERNMENT VAP EARLY INTERVENTION RECOMMENDATIONS AND ACTION PLAN Estimated
Short-Term Recommendations (Years 1-3) 1 2 3 Cost
Recommendation #1: Structure Landbank Legislative Framework to Expedite Property Assemblage in VAP Priority Project Areas
Action 1: Amend Landbank statute to remove limit on land assemblage for only public parks or public purposes GC,LB,CSR,VLT Under $25,000
Action 2: Amend the Landbank statute to remove, or substantially ease, the current limits on timely disposition of property GC,LB,CSR,VLT Under $25,000
Action 3: Amend the Landbank statute to remove the limit on the Landbank activities by local government (i.e., Landbank may not dispose of property within boundaries of local government without
receiving approval of board member)
GC,LB,CSR,VLT Under $25,000
Action 4: Amend Landbank statute to allow for the clearance of clouded title GC,LB,CSR,VLT Under $25,000
Action 5: Amend Landbank statute to remove restrictions on Landbanks to acquire property for "investment purposes" only GC,LB,CSR,VLT Under $25,000
Action 6: Amend Landbank statute to allow for the capture of 50% of real estate taxes for 5 years after the sale of Landbank properties GC,LB,CSR,VLT
Recommendation #1: Establish Process and Qualifications for Developer Participation
Action 1: Determine target blocks based on block analysis data, current/proposed redevelopment projects, and ability to secure site control CSR,EGI Under $25,000
Action 2: Prepare Memorandum of Understanding that outlines roles, responsibilities and minimum qualifications for developer participation CSR,EGI Nominal
Action 3: Prepare Request for Qualifications to solicit key housing development partners. RFQ to include qualification guidelines (e.g. production capacity, counseling capacity, access to funding, market,
sales, property management experience)
CSR $25,000 to $100,000
Action 4: Select 3 to 5 qualified housing developers to participate in interview sessions to determine their proposed project approach and the level of project-related assistance needed CSR $25,000 to $100,000
Recommendation #2: Establish Rehab Standards, Construction Practices, and Design Standards
Action 1: Incorporate existing or prepare new rehab standards and construction specifications for VAP housing development CSR,PDS Under $25,000
Action 2: Establish design standards that build on the architectural character of the priority project area neighborhoods CSR,PDS Under $25,000
Action 3. Establish site plan guidelines that reinforce existing development patterns and encourage green building CSR,PDS Under $25,000
Recommendation #3: Undertake a Selective Housing Demolition Program to Reduce Blight and Crime and Create Redevelopment Opportunities
Action 1: Establish criteria for targeting and evaluating housing demolition candidates based on the following criteria: (1) threat to public health, safety & welfare, (2) contributing to neighborhood
blight, (3) potential crime threat, (4) located in Project Priority Area, (4) vacant & abandoned and/or has unpaid tax and abatement liens, (5) going through municipal foreclosure, (6) not a
contributing structure to established historic district, and (7) property has redevelopment value as part of larger (re)development project
CSR,PDS,CR Under $25,000
Action 2: Prepare demolition target list based on above criteria and begin property research CSR,CR Under $25,000
Action 3: Take appropriate actions to demolish structures in order to remove threats or acquire properties for inclusion in Landbank inventory CSR,CR $1 mil to $5 mil
Recommendation #1 Identify Funding Policies and Sources for VAP Housing Revitalization Funding
Action 1: Establish internal policies for investing public dollars in Project Priority Areas VLT,CSR,OMB Nominal
Action 2: Present proposed work plan to Mayor and City Council with VAP Leadership Team's recommendations VLT,CSR,OMB Nominal
Action 3: Identify funding sources to direct toward early intervention activities (resource re-allocation) VLT,CSR,OMB Nominal
Action 4: Review entitlement program funding to determine set aside for VAP Housing Revitalization Funding CSR Nominal
Action 5: Review housing development opportunities to determine if LIHTC are applicable funding source for selected priority development areas CSR Nominal
Action 6: Establish lending pool of local bank, foundations, and national funding sources to leverage public funding CSR Under $25,000
Action 7: Lay groundwork to identify new funding sources for property acquisition and redevelopment (e.g., TIF, bonds, new fees, etc.) VLT,CSR,OMB Nominal
Recommendation #2: Identify Sources for Development Subsidies Including CDBG, HOME, NSP, etc.
Action 1: Establish subsidy amounts per project on the basis of development objectives CSR,EGI Nominal
Action 2: Consider other forms of subsidies to reduce project development risk, including construction interest payments CSR,EGI Nominal
Action 3: Determine whether development subsides will be recaptured CSR,EGI Nominal
Action 4: Establish affordability period for each form of development subsidy used CSR,EGI Nominal
Action 5: Determine assistance to homebuyers to encourage homeownership CSR,EGI Nominal
Action 6: Determine assistance to small investors to encourage rehab of existing vacant buildings for rental CSR,EGI Nominal
Recommendation #3: Attract Long-Term Financing to Priority Project Areas
Action 1: Convene local lenders to familiarize them with overall goals and objectives of project CSR,EGI Under $25,000
Action 2: On the basis of a risk sharing strategy, secure commitments for long-term financing for qualified builders/developers CSR Nominal
Action 3: Establish Memorandum of Understanding with preferred Priority Project Area lenders CSR Nominal
Recommendation #4 Establish innovative funding techniques to finance major economic development and neighborhood redevelopment projects and administrative expenses
Page | 2-18
ELEMENT 5: FUNDING
ELEMENT 3: LEGISLATIVE INITIATIVES
ELEMENT 4: HOUSING REHABILITATION, CONSTRUCTION, DEMOLITION AND CATALYST PROJECTS
Implementation Timing (Years)Implementation Lead
Public Implementation Lead - Legend
AOC - Administrative Office of the Courts CC - County Clerk CR - Codes & Regs CS - County Sheriff CSR - Community Services & Revitalization EGI- Economic Growth & Innovation Task Initiated
GC - General Counsel/County Attorney LB - Landbank Authority LN - LouisvilleNOW MC - Metro Council MO - Mayor's Office MTS - Metro Technology Services
PC - Planning Commission PDS - Planning & Design Services PWA - Public Works and Assets URC - Urban Renewal Commission VLT - VAP Leadership Team VPRC - Vacant Property Review Commission Task Implemented
* the Innovation Delivery Team will assist lead agencies

LOUISVILLE METRO GOVERNMENT VAP LONG-TERM RECOMMENDATIONS AND ACTION PLAN Estimated
Long-Term Recommendations (Years 4-10) 4 5 6 7 8 9 10 Cost
ELEMENT 1: ORGANIZATIONAL STRUCTURE AND ADMINISTRATIVE ACTIONS
Recommendation #1: Establish LouisvilleNOW as a combined Urban Renewal Authority combining the Landbank Authority, Vacant Property Review Commission and the
existing Urban Renewal Commission to lead urban redevelopment activities in high risk neighborhoods
Action 1: Establish "LouisvilleNOW" combined redevelopment authority to address the needs of urban blight, property vacancy and abandonment and economic
development in Louisville's neighborhoods
CSR,MC,URC,GC,EGI $250K to $500K
Action 2: Appoint a 5-person board of directors to create and incorporate the urban renewal authority and expand the board to 11 members after Year 5 with
broader community membership
LN,URC,LB,VPRC Nominal
Action 3: Prepare a development plan to guide renewal authority actions per KRS 99.030 LN,CSR,PDS,EGI $250K to $500K
Action 4: Incorporate the Landbank Authority and the Vacant Property Review Commission as part of the LouisvilleNOW urban renewal authority and unify board GC,MC,UC,LB,VPRC Nominal
Action 5: Hire a director and professional staff to manage the day-to-day operations of LouisvilleNOW and Landbank Authority in revitalization priority areas CSR,VLT,EGI $250K to $500K
Recommendation #2:Establish an integrated role and mission for the Landbank Authority, Inc., within the context of a combined urban renewal authority
Action 1: Determine renewable funding sources for Landbank to acquire VAP and other property in Priority Project Areas MC,LB,GC Nominal
Action 2: Establish property acquisition goals, policies and procedures including criteria for disposition and development LB,CSR,EGI Nominal
Action 3: Establish process, policies, and procedures for management of Landbank assets during holding period LB,CSR,GC,EGI,CR Nominal
Action 4: Select property appraisers, property maintenance, acquisition agent, and real estate attorney to support property acquisition program LB,CSR,EGI $100K to $250K
Action 5: Increase Landbank Authority legal staff capabilities to handle larger volumes of property research and title clearance CSR,LB,GC $100K to $250K
ELEMENT 2: COMPREHENSIVE NEIGHBORHOOD REVITALIZATION, PLANNING AND CAPACITY BUILDING
Recommendation #1:Plan Model Block Developments to Encourage Public/Private Investment
Action 1: Prepare detailed schematic site plans and building design to create long range vision for catalytic redevelopment sites LN,CSR,EGI $250K to $500K
Action 2: Retain architect to create series of construction drawings to be used by developers as a means to reinforce long range vision of development sites LN,CSR,EGI $25K to $100K
Action 3: Provide predevelopment services such as rezoning, architectural services, land assembly, market analysis and financial incentives designed to encourage
private sector participation by banks, mortgage lenders and private developers.
LN,CSR,EGI $500 to $1mil
Recommendation #2:Establish a Core Project Management Team Consisting of Metro Govt. Staff Critical to Redevelopment
Action 1: Meet monthly to assess collaborative approaches needed to support PPAs, including strategies to encourage public/private investment LN,CSR,EGI < $25,000
Action 2: Coordinate property acquisition strategy, including long-term Landbanking, through Landbank Acquisition Agent LN,CSR,EGI Nominal
Action 3: Retain VAP Coordinator to work exclusively on coordinating and facilitating all aspects of comprehensive neighborhood redevelopment CSR $25K to $100K
Recommendation #3:Establish Forum for Local Development Partners to Expand Capacity
Action 1: Organize quarterly and annual forums for Priority Project Area-based training that address local challenges LN,CSR,HO < $25,000
Action 2: Create relationships with local chapters of AIA, ULI, and APA as mechanism to introduce private sector best practices to the non-profit development community LN,CSR,HO Nominal
Action 3: Prepare Market Research Reports for key economic development and residential development sectors of PPA as a means to guide market driven reinvestment
decisions
LN,CSR,EGI $100K to $250K
Recommendation #4:Work with Political Representatives, Civic Leadership, and Business Community to Create Local Champions
Action 1: Prepare fact sheets on current neighborhood conditions that include both challenges and strengths CSR < $25,000
Action 2: Establish vision for neighborhood reinvestment and conduct neighborhood-based forums for political representatives, civic leadership, and business community
to inform them of long term reinvestment strategy
CSR,EGI < $25,000
Action 3: Prepare plan of action that prioritizes specific PPAs over a 7-year period, e.g. dedicating a significant share of time, energy, and resources to one
neighborhood annually as a long term strategy
CSR,EGI < $25,000
Action 4: Conduct outreach to local business, church, civic, lending and neighborhood leaders to champion, support and sponsor local revitalization efforts CSR,EGI < $25,000
Page | 2-19
Implementation Timing (Years)Implementation Lead
Public Implementation Lead - Legend
AOC - Administrative Office of the Courts CC - County Clerk CR - Codes & Regs CS - County Sheriff CSR - Community Services & Revitalization EGI- Economic Growth & Innovation Task Initiated
GC - General Counsel/County Attorney LB - Landbank Authority LN - LouisvilleNOW MC - Metro Council MO - Mayor's Office MTS - Metro Technology Services
PC - Planning Commission PDS - Planning & Design Services PWA - Public Works and Assets URC - Urban Renewal Commission VLT - VAP Leadership Team VPRC - Vacant Property Review Commission Task Implemented

LOUISVILLE METRO GOVERNMENT VAP LONG-TERM RECOMMENDATIONS AND ACTION PLAN Estimated
Long-Term Recommendations (Years 4-10) 4 5 6 7 8 9 10 Cost
ELEMENT 4: HOUSING REHABILITATION, CONSTRUCTION, DEMOLITION AND CATALYST PROJECTS
Recommendation #1: Establish Process and Re-Qualifications Procedures for Annual Developer Participation
Action 1: Require the submission of annual audited financial statements to determine fiscal status of participating non-profit developers CSR Nominal
Action 2: Require the submission of annual Plan of Action to ensure proposed work program of participating developer is consistent with overall objectives of Metro CSR Nominal
Action 3: Establish long range metrics for each participating non-profit development partner that includes real estate production goals, sales, rental, quality of services,
and qualifications of staff
CSR Nominal
Action 4: On the basis of an annual review, provide a long range plan of action to increase the capacity of participating developers, e.g. green sustainability
practices, construction oversight, property maintenance practices
CSR < $25,000
Recommendation #2: Create a Program to Encourage Joint Ventures Between Non-Profit and For-Profit Developers on Urban Redevelopment Projects
Action 1: Convene meeting with non-profit and for-profit developers to investigate future joint venture opportunities CSR,EGI < $25,000
Action 2: Require joint ventures on larger revitalization projects utilizing public funds, particularly in urban areas CSR,EGI Nominal
Action 3: Require developers responding to publically-sponsored developer RFPs to submit a joint venture plan as part of their proposal and give preference to
responsible joint ventures
CSR,EGI Nominal
Recommendation #3: Establish Regulatory Framework to Guide Redevelopment and Reinvestment
Action 1: Design and adopt a Pattern Book to be used by any developer accepting public funding for redevelopment CSR,PDS $25K to $100K
Action 2: Review current land use and zoning for priority development areas to determine future zoning/land use requirements CSR,PDS Nominal
Action 3. Consider Neighborhood Conservation Zoning Overlay to reinforce planned neighborhood growth/redevelopment CSR,PDS < $25,000
Create Annual Work Plan for Priority Project Area (PPA)
Action 1: Update inventory of vacant buildings and lots to determine annual inventory of property needed for develop. CSR,CR < $25,000
Action 2: Prepare block analysis for each PPA that includes analysis of before/after streetscape CSR,CR $25K to $100K
A Action Recommendation #5: Package Select Projects within Priority Project Development Areas
Action 1: Use Landbank to assemble property within 1/4 mile radius of priority project development sites CSR,LN,EGI $500 to $1mil
Action 2: Design preferred redevelopment patterns, land uses, and design character as part of solicitation for developers CSR,LN,EGI Nominal
Recommendation #6: Establish Marketing and Branding Strategy to Build on Neighborhood Assets to Attract New Investment
Action 1: Conduct market research to determine profile of new homebuyer and renters most interested in PPAs CSR $25K to $100K
Action 2: Prepare collateral materials and manage PPA marketing & branding campaign CSR $25K to $100K
Recommendation #7: Establish Real Estate Asset Management Capability
Action 1: Prepare scope of work to manage Landbank assets during holding period prior to development, including grass cutting, winterizing, boarding, and stabilizing CSR,LB,LN,CR $250K to $500K
Action 2: Prepare RFP to solicit non-profit developers to provide Asset Management Services CSR,LB,TN < $25,000
Action 3: Create program to train under-employed and un-employed workers to deconstruct vacant buildings that cannot be feasibility renovated CSR < $25,000
Page | 2-20
Implementation Timing (Years)
Recommendation
Implementation Lead
Public Implementation Lead - Legend
AOC - Administrative Office of the Courts CC - County Clerk CR - Codes & Regs CS - County Sheriff CSR - Community Services & Revitalization EGI- Economic Growth & Innovation Task Initiated
GC - General Counsel/County Attorney LB - Landbank Authority LN - LouisvilleNOW MC - Metro Council MO - Mayor's Office MTS - Metro Technology Services
PC - Planning Commission PDS - Planning & Design Services PWA - Public Works and Assets URC - Urban Renewal Commission VLT - VAP Leadership Team VPRC - Vacant Property Review Commission Task Implemented

LOUISVILLE METRO GOVERNMENT VAP LONG-TERM RECOMMENDATIONS AND ACTION PLAN Estimated
Long-Term Recommendations (Years 4-10) 4 5 6 7 8 9 10 Cost
ELEMENT 5: FUNDING
Recommendation #1 Identify Funding Sources for VAP Housing Revitalization
Action 1: Establish a process to rotate the prioritization of federal funding on an annual basis for PPAs CSR Nominal
Action 2: Work with State Housing Finance Agency to set aside allocation of 4% and 9% LIHTC funding for PPAs. Set-aside would be in conjunction with PPAs receiving
prioritization of annual local government allocation
CSR Nominal
Action 3: Work with local lenders to establish consortium of construction & mortgage funding for PPAs CSR,EGI Nominal
Recommendation #2: Create Development Subsidy Support Based on Leveraging Public/Private Sector Investment
Action 1: In collaboration with private sector lending partner - assess level of public sector investment needed CSR,EGI < $25,000
Action 2: Acquire land and subordinate land cost to construction and permanent mortgage as a basis of subsidy CSR,EGI $1mil to $5mil
Action 3: Provide infrastructure funding as means of incentive for private sector investment CSR,EGI $1mil to $5mil
Action 4: Consider redevelopment strategies involving Land Trust as a tool to ensure long term affordability CSR,EGI Nominal
Action 5: Determine 5 year strategy to reduce amount of public sector subsidy needed to induce private sector investment CSR,EGI < $25,000
Recommendation #3: Work with Local Lenders, Private Mortgage Insurance Companies, and Secondary Market to increase Private Sector Participation
Action 1: Mayor convenes local lenders, PMI representatives, Fannie Mae and Freddie Max to review impediment of local lenders to make loans in PPA, e.g.
appraisals, loan to value ratios, perceived underwriting risk
MC,CSR,EGI Nominal
Action 2: With local lender(s) - create series of construction and permanent loan products that tailored to underwriting risks associated with lending in PPAs LB,CSR,HO,EGI >$5mil
Recommendation #4: Capitalize a LouisvilleNOW Development Fund that is Self-Sustaining to Fund Larger Redevelopment Projects
Action 1: Study long-range funding options for urban redevelopment and affordable housing VLT,MC,OMB < $25,000
Recommendation #5: Explore Options for Potential New Ways to Process Delinquent Tax Liens VLT,MC,OMB,GC
Page | 2-21
Implementation Timing (Years)Implementation Lead
Public Implementation Lead - Legend
AOC - Administrative Office of the Courts CC - County Clerk CR - Codes & Regs CS - County Sheriff CSR - Community Services & Revitalization EGI- Economic Growth & Innovation Task Initiated
GC - General Counsel/County Attorney LB - Landbank Authority LN - LouisvilleNOW MC - Metro Council MO - Mayor's Office MTS - Metro Technology Services
PC - Planning Commission PDS - Planning & Design Services PWA - Public Works and Assets URC - Urban Renewal Commission VLT - VAP Leadership Team VPRC - Vacant Property Review Commission Task Implemented

Page | 3-1
VAP Neighborhood Revitalization Study
Section
3
A. DEMOGRAPHIC TRENDS AND
CHARACTERISTICS
1. Introduction and Methodology
1.1. Introduction
The following chapter analyzes demographic trends
and projections in areas such as population,
households, income, education attainment, employment
and economic base data. The data provides insight
into local growth trends as well as projected future
growth patterns. These factors provide the framework
for understanding real estate activity as well as
demographic and economic changes in the city and
county. The consultant team utilized several public and
private data sources to complete the analysis,
including the U.S. Census Bureau and Esri1.
1 Esri is an internationally recognized socioeconomic and market data vendor. They apply a propriety methodology to develop projections based on existing Census data.
1.2. Methodology
Population, household, and income trend data was
collected from the U.S. Census Bureau and Site to Do
Business. Much of the data provided by Site to Do
Business consists of data from the U.S. Census Bureau
provided in a summarized form presented for users in
the real estate industry. Site to Do Business
incorporates projection models developed by Esri,
which RKG Associates uses for this report unless
otherwise noted. In all cases, 1990 data has been
converted to 2000 census geographies. Also, while
2010 Census data was used throughout this section,
the 2010 data for income and educational attainment
reflects Esri estimates based on 2000 Census data.
Data in tables are generally categorized by study
area: West Louisville neighborhoods; Downtown, East
& South Urban neighborhoods; Jefferson County
suburbs; and Louisville-Jefferson County as a whole
(Map 3-1).
Source: LOJIC & RKG Associates, Inc., 2013
Map 3-1

Page | 3-2
VAP Neighborhood Revitalization Study
Section
3 2. Population and Household Trends
2.1. Population Trends
Between 1990 and 2010, the West Louisville
neighborhoods and Downtown, East, and South Urban
neighborhoods experienced a decline in population
(16.3% and 4.4% respectively), while the population
in the Jefferson County suburbs increased by 22.8%.
Louisville-Jefferson County as a whole experienced an
increase in population of 11.5% over the same 20-
year period. Population is projected to increase
between 1% and 3% between 2012 and 2017.
Table 3-1 illustrates population trends and projections
from 1990-2017.
2.2. Household Trends
From 1990 to 2010, there was a 9.6% decrease in
the number of households located in the West
Louisville neighborhoods, while the number of
households in the Downtown, East, and South Urban
neighborhoods decreased by just over 2%.
Conversely, the suburbs increased in number of
households by 13.4% during the same time period.
Similar to estimated and projected population trends,
the number of households was estimated to remain
roughly the same for all study areas in 2012 and is
projected to increase between 1% and 4% between
2012 and 2017 (Appendix Table 3-1).
2.3. Racial Composition of Households
The West Louisville neighborhoods contained the
highest concentration of minority persons, including
African Americans, in the Metro Louisville area. Since
1990, white persons have made up over 70% of the
county’s population. However, in all areas, the
percentage of white persons has decreased over time.
At the county level, white persons made up 81% of
the population in 1990 but by 2010 this had dropped
to 71%. In 2010, when the census began using
category of “Hispanic Only”, the “Hispanic Only”
category was the largest non-White ethnic category
other than African American in all areas (Appendix
Tables 3-2 to 3-5).
2.4. Average Household Size
From 1990 to 2010, all areas experienced a
decrease in average household size (ranging from 4%
to 8%), with an overall decrease for Jefferson County
of approximately 5%. The West Louisville
neighborhoods showed the largest decline in
household size, of about 8%, while the Downtown,
East, and South Urban neighborhoods showed the
smallest decline at 4.1%. This data mirrors national
trends towards smaller household size due to an aging
population and more non-family households. West
Louisville neighborhoods consistently had the largest
average household size, about 2.52 persons per
household, while the Downtown, East, and South Urban
neighborhoods consistently had the smallest average
household size, or about 2.08 persons per household.
Average household size for 2017 is projected to show
no change in any of the study areas or for Jefferson
County as a whole (Appendix Table 3-1).
2.5. Age Distribution of Population
Between 1990 and 2010, the proportion of school
age children remained constant at approximately
20% in Jefferson County. Estimates for 2012 and
projections for 2017 suggest that school age children
will remain at around 19% of the population. Roughly
similar trends in this sizable age group were seen in
all study areas.
West End
Neighborhoods
Downtown,
East, and South
Urban
Neighborhoods
Jefferson
County Suburbs
Jefferson
County
POPULATION
2017 Projection 56,474 184,061 532,318 770,630
2012 Estimate 55,543 179,531 513,628 746,614
2010 Census 55,710 178,948 508,468 741,096
2000 Census 61,135 182,243 452,579 693,604
1990 Census [1] 66,542 187,204 413,970 664,937
GROWTH RATE
1990 - 2010 -16.3% -4.4% 22.8% 11.5%
2012 - 2017 1.7% 2.5% 3.6% 3.2%
2010 - 2012 -0.3% 0.3% 1.0% 0.7%
2000 - 2010 -8.9% -1.8% 12.3% 6.8%
1990 - 2000 -8.1% -2.7% 9.3% 4.3%
AVERAGE ANNUAL GROWTH RATE [2]
1990 - 2010 -0.8% -0.2% 1.1% 0.6%Source: U.S. Census Bureau, ESRI, and RKG Associates, Inc., 2013
[1] 1990 Census data converted to 2000 geographies
[2] Uses census data and estimates
Population Trends and Projections
Comparative Neighborhoods; 1990-2017
Table 3-1

Page | 3-3
VAP Neighborhood Revitalization Study
Section
3 Conversely, the proportion of empty nesters (45-64)
grew from 19.6% in 1990 to 27.3% by 2010 – the
largest age group in Jefferson County. In general, the
percentage of empty nesters in all study areas have
grown similarly during this period of time. However,
in the Downtown, East and South Urban
Neighborhoods, empty nesters made up a smaller
proportion of the area’s population between 2000
and 2010, ranging from 9% to 15%. This is
approximately 10% less than all other areas in
Louisville. Looking forward, estimates for 2012 and
projections for 2017 suggest that the proportion of
empty nesters in all study areas will remain at 2010
levels (Figure 3-1, Appendix Tables 3-6 to 3-9).
2.6. Median Household Income
As discussed in the methodology section, income data
for the study areas was provided by the U.S. Census
Bureau for 1990 and 2000. For 2010, Esri estimated
income data based on 2000 Census data and used
estimates and projections for 2012 and 2017 based
on American Community Survey (ACS) 5-year
estimates. Therefore, as seen in Figure 3-2, there was
a decrease of roughly $7,000 to $10,000 in median
household income between 2010 and 2012 in all
areas. Based on a discussion with an Esri
demographer and a review of their methodology, this
drop can be explained at least partially by a
difference in methodology and the fact that 2000
Census data does not reflect the impact of the
recession, while later ACS data does. Given the
difference in methodology, the analysis of the change
in median income will be between 2000 and 2010.2,3
The entire region experienced a growth in median
income from 1990 to 2010, with the smallest
estimated increase in the West Louisville
neighborhoods of $12,862. All other areas in
Jefferson County saw an estimated increase of at
least $18,993. The median income in West Louisville
was consistently and notably less than all other areas.
In 2012, median income for West Louisville
neighborhoods was estimated to be $20,991.
However, for the Downtown, East, and South Urban
neighborhoods and the suburbs, the median income
was estimated to be notably higher, $36,488 and
$50,268, respectively. All study areas are projected
to show an increase in median income in 2017 from
2012 estimates, with the West Louisville median
income still almost $20,000 less than the surrounding
urban neighborhoods, and nearly $30,000 less than
the suburban neighborhoods and Jefferson County as
a whole (Figure 3-2, Appendix Tables 3-10 to 3-14).
2 Lynn Wombold, ESRI. August, 13, 2013. 3 Esri Demographic Updates: 2012/2017. November 2012.
Source: U.S. Census Bureau and RKG Associates, Inc., 2013
0%
5%
10%
15%
20%
25%
30%
West EndNeighborhoods
Downtown, East& South UrbanNeighborhoods
JeffersonCounty Suburbs
JeffersonCounty
PROJECTED AGE DISTRIBUTION2017
Empty Nesters (45-64) Seniors/Elderly (65+) Early Workforce (25-34)
Figure 3-1
Figure 3-2
Source: U.S. Census Bureau and RKG Associates, Inc., 2013
$0
$10,000
$20,000
$30,000
$40,000
$50,000
$60,000
$70,000
West End Downtown,East, and South
UrbanNeighborhoods
Suburbs JeffersonCounty
MEDIAN INCOME TRENDS1990-2017
1990 Census 2000 Census 2010 Estimate
2012 Estimate 2017 Projection

Page | 3-4
VAP Neighborhood Revitalization Study
Section
3 2.7. Persons Living In Poverty
Between 1990 and 2000, the proportion of
households living in poverty decreased by only about
2% in Jefferson County. The largest concentration of
households living below the federal poverty line, over
30%, was located in the West Louisville
neighborhoods. This represented nearly two times the
concentration of households living in poverty in the
Downtown, East and South Urban neighborhoods and
Jefferson County as a whole and three times the
proportion of the total households living in poverty in
the suburbs. Of the 33% of households living in
poverty in the West Louisville neighborhoods in 2000,
most are either a female householder with no husband
or non- family households. Additionally, these two
household types made up most of the households in
poverty in all areas of Jefferson County during this
time period. (Appendix Tables 3-15 to 3-19).
2.8. Educational Attainment
In 1990 there was a significant disparity between the
three study areas in terms of the percentage of
persons 25 years and older attaining at least a high
school diploma. In fact, in 1990 only 52.9% of West
Louisville residents had attained that level of
education, while 73.6% of Downtown and 77.6% of
suburban residents had at least a high school diploma
or better. However, over the past two and a half
decades, education attainment has risen in all three
areas, with the biggest gains occurring in West
Louisville. In 2010, Esri estimated that 72.5% of West
Louisville residents had at least a high school diploma,
which still lags behind the Downtown (86.5%) and
Jefferson County suburbs (88.7%), but indicates that
the gap is narrowing.
Historically, the West Louisville neighborhoods have
had the lowest percentage of persons with post-
secondary education. In 1990, roughly 8.7% of West
Louisville residents had attained an associate degree
or higher. This percentage had increased to 14.2%
by 2010. During the same year, residents in the
Downtown (40.2%) and Jefferson County suburbs
(35.4%) fared much better with a greater percentage
of persons with more than a high school diploma.
Given the presence of the University of Louisville in the
Downtown study area, it is not surprising that
education attainment would be higher in that location.
However, because of the strong correlation between
education levels and income potential, areas with
higher education attainment and income will often
have resident populations with a greater ability to
pay for homeownership and the regular maintenance
associated with property ownership.
3. Implications
In viewing Louisville’s demographic trends, it becomes
evident that over the past twenty plus years, urban
dwellers left their inner ring neighborhoods for outer
ring suburbs and other parts of Jefferson County.
Declining urban core populations typically result in
increased vacant and/or abandoned properties,
safety concerns, and diminished interest of potential
homebuyers who may be looking for more stable
communities. While there is anecdotal evidence
indicating there was increased interest in downtown
living and residential development during the past
decade, the population data does not bear out this
fact. This is particularly true of the West Louisville
neighborhoods, where population is decreasing and
household incomes are not keeping pace with the
increases being experienced in the Metro Louisville
area as a whole. A large portion of the population
will be in the post-productive years of disposable
income (65 and older), indicating a need for deep
subsidies to make existing housing more affordable
for seniors/elderly populations in all three areas.
Demographic trends indicate several social factors
working in tandem, thus there is a need for a more
comprehensive approach to addressing vacant and
abandoned properties on a long term basis. New infill
construction or major rehab of vacant/abandoned
properties should focus on smaller, more affordable
units as well as amenities like pocket parks and wide
sidewalks to cater to the needs of young families and
seniors. Housing should be built at higher densities
and include smaller units to address decreasing
household size and to decrease infrastructure provision
requirements and costs.

Page | 3-5
VAP Neighborhood Revitalization Study
Section
3 As expected, poverty levels are higher in West
Louisville, the Downtown, East, and South Urban
neighborhoods compared to the suburbs. Currently,
U.S. federal poverty guidelines show a family of four
at $22,350, which means the 2012 median household
income in West Louisville neighborhoods ($20,991) is
below federal poverty guidelines for a family of four.
A successful intervention strategy designed to reduce
poverty levels is critical to a comprehensive approach
to neighborhood revitalization.
In addition to a decline in urban core neighborhoods,
Louisville is experiencing an increase in racial
diversity. The proportion of white persons in the
population in each of the study areas has decreased
over the last 20 years. Also, since their
reclassification, ‘Hispanic Only’ populations make up
almost 3% of the population of the Downtown, East
and South Urban neighborhoods and 5% of the
population in the suburbs as of 2010.
Understanding demographic trends in the context of
how they impact planning and neighborhood
revitalization should be taken into consideration while
implementing the recommendations in Section 2 of this
report. The demographic analysis shows that any VAP
strategy needs to be comprehensive and inclusive of
several socio-economic factors that include aging in
place, workforce housing and affordable housing.
Because of the income range of the existing
population, a component of any strategy could include
the use of Low-Income Housing Tax Credits to
introduce higher density development of affordable
housing options for current lower income households
and aging populations who may now be living in sub-
standard housing.
B. ECONOMIC BASE TRENDS
1. Employment Trends
In recent decades, Louisville has developed an
economy increasingly centered on logistics and health
care services. Since UPS chose Louisville as the primary
air terminal for their operations, and subsequently
expanded, many companies have located nearby,
leveraging a central location that allows air access to
75% of U.S. cities within two hours. Fulfillment
companies and other firms relying on fast, reliable
transportation benefit from location and
agglomeration effects. Health care – Louisville and
Jefferson County’s largest employment sector – has
seen additional gains in employment and new
businesses associated with health care. Manufacturing
is an important sector, and is among the Top 5 sectors
in Jefferson County by total employment, but jobs and
establishments have seen their share of the total
economy decrease over the past decade.
Appendix Table 3-22 details employment trends in
Jefferson County and the Commonwealth of Kentucky
for the period of 2001-2011. Data for 2008 is
separated so that some effects of the recent recession
can be understood in the context of the 10-year trend.
Recent Employment Gains 1.1.
Employment in health care and social assistance,
accommodation and food service, transportation and
warehousing, information, and professional services
increased during the decade. These industry sectors
added a total of 19,865 jobs in Jefferson County
from 2001 to 2011. This contrasts with the 42,281
jobs shed by the top five industry sectors with the
largest net employment losses. Sectors gaining jobs
did not offset the overall net loss of 30,150 jobs
during the decade for all sectors (Figure 3-3).
The health care and social assistance sector comprises
the top job category by total employment, and is
growing. Jobs in health care made up 13.1% of all
jobs in Jefferson County in 2001, 14.9% in 2008, and
16.2% in 2011. This category also posted the largest
net gain in employment for the decade, adding 7,691
jobs. Accommodation and food services, the fourth
largest employment sector, and the sector showing the
most job growth after health care, posted a net gain
of 4,700 jobs from 2001-2011.
The sectors experiencing gains for the decade did so
primarily in the 2001-2008 period prior to the

Page | 3-6
VAP Neighborhood Revitalization Study
Section
3
recession. After 2008, most sectors exhibited job
losses, reflecting the effects of the recession; however,
health care and food services remained stable or
posted modest gains from 2008-2011.
1.2. Recent Employment Declines
According to the U.S. Census Bureau, the number of
jobs in Jefferson County declined by 7.3% from
2001-2011, resulting in 30,150 fewer jobs in 2011
than in 2001. Industries with the largest net declines
include manufacturing, wholesale trade, construction,
and retail trade. These sectors have traditionally been
large employers in many communities, and the five
sectors with the largest loss during the period saw a
combined loss of 42,281 jobs.
The recent recession lasted from approximately late
2007 to the middle of 2009, with national peak
unemployment occurring in October of 2009. Overall,
employment did not decline until after 2008, but some
industries had already begun to show significant shifts
prior to 2008. Between 2001 and 2008, the
manufacturing, retail, wholesale trade, and
construction sectors were already the industries
shedding the most total jobs. The data for the period
2008-2011 shows that the effects of the recession
accelerated job loss trends, with the construction and
manufacturing sectors showing more losses during the
post-recession period than pre-recession.
When compared to the entire Commonwealth of
Kentucky, Jefferson County shows substantial job losses
for the decade. The county showed a 7.3% decrease
in jobs compared to a 2.3% decrease for the state as
a whole (Figure 3-4). A significant finding is that of the
34,293 net job losses in the state between 2001 and
2011, 30,150, or 88%, of these were in Jefferson
County.
2. Establishment Trends
2.1. Establishment Gains
During the 2001-2008 period leading up to the
recession, the number of Jefferson County
establishments increased by only a modest 0.6%. This
contrasts with Kentucky as a whole, where
establishments had increased 3.4% during the same
period. When examining establishment data for the
entire decade 2001-2011, the number of
establishments in the state recovered to pre-recession
levels by the end of the period, increasing by 269
jobs and posting a flat 0.3% increase. This contrasts
with Jefferson County’s 3% decrease (Figure 3-4).
However, some sectors in Jefferson County showed
solid gains and the number of establishments grew in
parallel with employment growth in expanding
sectors. The health care and social assistance,
transportation and warehousing and accommodation
and food services sectors gained 115, 95 and 232
new businesses, respectively, between 2001 and
2011. In a trend similar to employment, the health
care and social assistance, and accommodation and
food services sectors showed increases in
establishments in the post-recession 2008-2011
period – a time when most other industry sectors
showed decreases in establishments. Establishment
data is further detailed in Appendix Table 3-22.
2.2. Establishment Declines
The overall decrease in establishments in Jefferson
County during the period 2001-2011 was 3%, (601
Source: U.S. Census Bureau and RKG Associates, Inc., 2013
Health Care & Social Assistance
Accommodation & Food Svcs
Transportation & Warehousing
Professional, Scientific, Technical…
Information
Admin., Support, other Svcs
Retail Trade
Construction
Wholesale Trade
Manufacturing
LARGEST EMPLOYMENT SHIFTS Net Gains and Losses; 2001-2011
Figure 3-3

Page | 3-7
VAP Neighborhood Revitalization Study
Section
3 businesses) compared to the 7.3% decrease in
employment over the same time period (Figure 3-4).
This indicates that during the recessionary period
companies were more likely to cut payrolls than fold
completely. This may also indicate increasing
automation in certain sectors of the economy, whereby
certain industries have similar output levels as in the
past, yet require far fewer workers.
For the 2001-2011 period, the largest loss of
establishments in Jefferson County occurred in the
construction sector. This finding is not surprising
considering the impact of the recession and housing
foreclosure crisis during the period. When compared
to Jefferson County, establishment changes in Kentucky
as a whole were more moderate. The state showed
more industry sectors gaining establishments, and
those that lost establishments posted lower rates of
loss than Jefferson County. In only 3 industry sectors:
transportation and warehousing, accommodation and
food services, and administration and support services,
did Jefferson County post a higher rate of
establishment growth than Kentucky.
3. Implications
When comparing employment and establishment data
for the 2001-2008 pre-recession period, and the
entire 2001-2011 decade, it appears that Jefferson
County experienced flat growth compared to the
state. The 2001-2008 period was one of economic
growth nationally, yet the county saw a .03%
decrease in jobs, and only a 0.6% increase in
establishments. This contrasts with state gains of 4.9%
and 3.4% respectively. For the 2008-2011 period,
employment and establishment trends indicate that the
recession affected Jefferson County more severely
than the state as a whole.
Examining the trend for the entire 2001-2011
decade, Kentucky shows signs of withstanding the
recession better than Jefferson County, with
employment showing a 2.3% decrease, and
establishments showing a small increase. This contrasts
with a 7.3% decrease in employment, and a 3.0%
decrease in establishments in Jefferson County for the
same timeframe, leading to the conclusion that
Kentucky’s largest metro region has been
underperforming the state as a whole in employment
and establishment growth.
While economic conditions have continued to improve
in the Louisville Metropolitan Area over the past few
years, there are implications to neighborhood
revitalization if the region’s economy struggles. The
most direct effect is on the availability of employment
and the stability of household incomes. As more
people struggle to find employment or drop out of the
labor force, this directly impacts their ability to pay
for housing costs, and in extreme cases, may cause
some people to default on their mortgage or cause
them to not afford local rents. To some degree, the
vacant and abandoned conditions described in this
report are symptomatic of a struggling economy, a
global financial crisis and persistent levels of poverty
in some Louisville neighborhoods.
-7.3%
-2.3%-3.0%
0.3%
-8.0%
-7.0%
-6.0%
-5.0%
-4.0%
-3.0%
-2.0%
-1.0%
0.0%
1.0%
Jefferson County Kentucky
ECONOMIC BASE CHANGE2001-2011
Employment Establishments
Source: U.S. Census Bureau and RKG Associates, Inc., 2013
Figure 3-4

Page | 4-1
VAP Neighborhood Revitalization Study
Section
4
A. HOUSING CHARACTERISTICS AND CONDITIONS
The RKG Team analyzed the housing characteristics and conditions of the West Louisville neighborhoods, Downtown, East & South Urban neighborhoods and the Jefferson County suburbs to provide a context to better understand factors affecting vacant and abandoned properties. An overview of housing information collected from the U.S. Census Bureau, a field-based evaluation of housing conditions, a study of housing affordability and a review of historic preservation techniques and best practices are included in this analysis. To complete the analysis of housing characteristics and conditions, housing data was obtained utilizing publically available sources as well as field observations. Housing unit age, tenure, and occupancy information was compiled using U.S. Census Bureau sources such as the decennial census and current American Community Survey 5-year estimates. Future projections, where available, are presented using data from Esri.1 Housing conditions and housing value are assessed using field observation prepared by the consultant as well as assessment data provided by the Jefferson County Property Valuation Administrator. More detailed information about the methodology used for assessing condition and value are included later in this section.
1. Housing Profile
1.1. Distribution of Housing Units In 2010, the Jefferson County suburban neighborhood study area contained the largest quantity of housing units. Of the approximately 328,000 housing units within the Louisville-Jefferson County boundaries, more
1 Esri is an internationally recognized socioeconomic and market data vendor. They apply a propriety methodology to develop projections based on existing Census data.
than 64% are located in the suburban study area. In contrast, the West Louisville study area accounted for 8.3%, or 27,278 units. However, the West Louisville neighborhoods have the highest concentration of housing units (almost 11 units per acre). The Downtown, East & South Urban neighborhoods (7.4 units per acre) and Jefferson County suburbs (2.8 units per acre) have lower development concentrations (Table 4-1). According to Census data, housing units throughout Jefferson County are predominantly detached single family housing units. However, recent development trends indicate the Louisville-Jefferson County market has experienced a modest diversification of housing types. Between 2005 and 2009, each of the study areas experienced a slight increase in the number of single family attached (i.e. townhouse) units. The West Louisville study area also experienced a noticeable increase in multi-unit structures of 10 or more units during the study period.
1.2. Age of Housing Over 45% of housing units in the West Louisville neighborhoods were built prior to 1939, while the percentage of pre-1939 units built in the Jefferson County suburbs was much lower (3.2%). The majority of housing units in Jefferson County as a whole were built before 1980, most of which were constructed between 1950 and 1979. Less than 3% of the housing units in Jefferson County were built after 2005; the largest concentration of those units occurred in the Jefferson County suburbs. Less than 2% of all units in the West Louisville neighborhoods and Downtown, East & South Urban neighborhoods were built after 2005 (Table 4-1).

Page | 4-2
VAP Neighborhood Revitalization Study
Section
4
Housing Units by Year BuiltComparative Neighborhoods; 2010
Year BuiltWest End
Neighborhoods
Downtown, East & South Urban Neighborhoods
Jefferson County Suburbs
Jefferson County
Total Units 27,278 89,975 210,859 328,1182005 or later 1.0% 0.6% 3.3% 2.3%2000 - 2004 6.5% 1.7% 10.4% 7.7%
1990 - 1999 5.5% 3.8% 14.6% 10.9%
1980 - 1989 2.8% 5.9% 9.4% 7.9%
1970 - 1979 2.9% 8.8% 19.7% 15.3%
1960 - 1969 4.6% 11.7% 18.5% 15.5%
1950 - 1959 12.8% 17.9% 16.7% 16.7%
1940 - 1949 16.5% 15.1% 4.3% 8.3%
1939 or earlier 47.4% 34.5% 3.2% 15.4%
Median Year Structure Built
1942 N/A N/A 1966
Source: U.S. Census Bureau and RKG Associates, Inc., 2013
Table 4-1
1.3. Housing Tenure The West Louisville neighborhoods historically have had the highest vacancy rates within Louisville-Jefferson County. The U.S. Census Bureau defines vacancy as the following: “A housing unit in which no one is living on Census Day, unless its occupants are only temporarily absent. Units temporarily occupied at the time of enumeration by individuals who have a usual home elsewhere are classified as vacant. (Transient quarters, such as hotels,
are housing units only if occupied. Thus, there are no vacant housing units at hotels and the like.) New units not yet occupied are classified as vacant housing units if construction has reached a point where all exterior windows and doors are installed and final usable floors are in place. Vacant units are excluded from the housing unit inventory if they are open to the elements, have a posted "condemned" sign, or are used entirely for nonresidential purposes (except storage of household furniture).”2
Between 1990 and 2012, the housing vacancy rate in West Louisville ranged from 12% to 20% (Figure 4-1). Vacancy was the highest between 2010 and 2012 for all of the study areas, reflecting the impact of the economic downturn on the local housing markets. In 2012, the Jefferson County suburbs had the highest percentage of owner-occupied units (66%), followed by the Downtown, East & South neighborhoods (50.5%). The West Louisville neighborhoods have reached a historically low level of homeownership, falling from 57% in 1990 to slightly above 40% in 2012. This drop in ownership level corresponds with an increase in vacancy in West Louisville. As a result, it is likely that housing tenure and the economic downturn have adversely affected West Louisville. Looking forward, no change is projected in occupied (owner and renter) units in 2017; however, a slight
2 Decennial Management Division Glossary, U.S. Census Bureau (2013). Retrieved August 7, 2013 from http://www.census.gov/dmd/www/glossary.html#V
Source: U.S. Census Bureau and RKG Associates, Inc., 2013
0.0%
10.0%
20.0%
30.0%
40.0%
50.0%
60.0%
70.0%
80.0%
90.0%
100.0%
Occupied Vacant Occupied Vacant Occupied Vacant Occupied Vacant
West End Neighborhoods Downtown, East & South UrbanNeighborhoods
Jefferson County Suburbs Jefferson County
Housing Units by Occupancy, 1990-2012
1990
2000
2010
2012
2017
Figure 4-1

Page | 4-3
VAP Neighborhood Revitalization Study
Section
4
decrease of less than 2% is expected in vacant units for all areas and Jefferson County as a whole. Though the rate of homeownership in the West Louisville neighborhoods is considerably lower than other areas, it is relatively high (approximately 40%) given the number of households in poverty in that part of Louisville.
1.4. Residential Ownership Patterns Given the variation in the proportion of owner-occupied units across Louisville-Jefferson County, an analysis of the patterns of single family homeownership can provide a background to understanding the characteristics of the households in the Metro Louisville area. Specifically, absentee owners have the potential to impact the condition of housing and ultimately affect neighborhood stability when this type of ownership exists in large numbers. Absentee ownership often indicates that a single family unit is used as a rental property. As discussed earlier in this section, the number of owner-occupied units varies between the West Louisville neighborhoods, Downtown, East & South Urban Neighborhoods and the Jefferson County suburbs. Owner-occupied units account for approximately 40% of the total occupied units in the West Louisville neighborhoods (Table 4-2). This suggests a substantial presence of single family rental units in this area. The owners of single family rental units typically act as landlords and provide property maintenance. Unlike
an on-site maintenance team in more traditional rental units, absentee owners/landlords often do not have the capacity to identify and address issues on the property in a timely fashion. Lengthy delays in resolving property issues can lead to a decline in the condition of the property at a quicker pace for absentee owner properties than those that are owner-occupied. An analysis of the Jefferson County Property Valuation Administrator’s property database suggests that when a unit has an absentee owner, it is more likely that the absentee owner lives in Jefferson County (Figure 4-2). This is particularly critical in the
Occupied Units by TenureComparative Neighborhoods: 1990-2017Neighborhood Tenure 1990 2000 2010 2012 2017
Owner 57.1% 52.4% 43.9% 40.2% 40.5% Renter 42.9% 47.6% 56.1% 59.8% 59.5% Owner 56.5% 55.3% 53.5% 50.5% 50.8% Renter 43.5% 44.7% 46.5% 49.5% 49.2% Owner 69.8% 71.0% 68.9% 66.1% 66.6% Renter 30.2% 29.0% 31.1% 33.9% 33.4% Owner 64.5% 64.9% 63.1% 60.2% 60.7% Renter 35.5% 35.1% 36.9% 39.8% 39.3%
Source: U.S. Census Bureau and RKG Associates, Inc., 2013
West End Neighborhoods
Downtown, East & South Urban Neighborhoods
Jefferson County Suburbs
Jefferson County
Table 4-2
0.0%
10.0%
20.0%
30.0%
40.0%
50.0%
60.0%
West EndNeighborhoods
Downtown, East &South Urban
Neighborhoods
Jefferson CountySuburbs
ABSENTEE HOMEOWNER LOCATIONSPercentage of Total Occupied Units
Jefferson County Outside Jefferson County
Figure 4-2
Source: PVA of Jefferson County, KY & RKG Associates, Inc., 2013

Page | 4-4
VAP Neighborhood Revitalization Study
Section
4
West Louisville neighborhoods given the high level of absentee ownership. Owners located regionally might reduce the time it takes to address issues given their proximity to the property. However, this does not eliminate the overall impact an absentee owner can have on property condition. A high concentration of rental units can also impact neighborhood stability. The transient and short-term nature of renters can have an effect on the stability of a community by affecting the level of community involvement and investment in an area. When traditionally owner-occupied housing units are converted to rental properties, this reduces the supply of available units for ownership, thus reducing the opportunity for a community to stabilize through an increase in the population of long-term residents.
2. Housing Condition Analysis
2.1. West Louisville Neighborhood Block Analysis
The purpose of the block analysis was to identify general “intervention” opportunities by location based on neighborhood conditions on the ground. The block analysis focused on the influence that properties in various stages of decline can have on overall neighborhood conditions. It should be noted that this task did not include a detailed parcel-by-parcel condition assessment, but rather the analysis of blocks based on a number of statistical measures that were then field-verified through a windshield survey.
Methodology Using available data sources provided by Louisville Metro Government and the team’s initial field observations, the RKG Team identified large numbers of vacant and abandoned properties in several residential neighborhoods, mostly West Louisville. Typically, having large numbers of vacant, abandoned and deteriorated structures and lots establishes negative perceptions about a neighborhood regardless of the true conditions of the area. The initial field observations of Louisville neighborhoods and communities with high concentrations of vacant and abandoned properties,
combined with a review of available data, plans and studies, aided in the selection of the neighborhoods for the block analysis. These neighborhoods included:
§ California § Chickasaw § Hallmark § Park DuValle § Park Hill
§ Parkland § Portland § Russell § Shawnee
Prior to conducting the block analysis, the team determined that the West Louisville neighborhoods had a higher concentration of vacant, abandoned, deteriorated and dilapidated properties as well as higher concentrations of vacant lots. The field observation helped to determine if there were subcategories of vacant and abandoned properties and to what extent these subcategories should affect the team’s recommendation strategies. A block analysis rating scale was developed to determine the level of blight among vacant and abandoned properties. A block-level windshield survey of the nine West Louisville neighborhoods was conducted with two teams over a two-week period (in November 2012 and January 2013). Stakeholder interviews and document reviews complemented the fieldwork conducted during this period. The team then performed an analysis of the data collected and produced a series of maps supported by photographic examples to illustrate the findings. Block Analysis Rating Scale Rating Description
1 Stable Block, no blighting influences 2 Stable Block, 1 – 2 blighting influences (occupied units
with maintenance/upkeep issues) 3 Blighted but stabilizing factors (1 – 2 vacant buildings
or lots) 4 Blighted Level 1 (occupied buildings needing major
rehabilitation, vacant lots) 5 Blighted Level 2 (vacant buildings needing major
rehabilitation, vacant lots) 6 Demolition candidate (entire block to be razed)

Page | 4-5
VAP Neighborhood Revitalization Study
Section
4
Map 4-1

Page | 4-6
VAP Neighborhood Revitalization Study
Section
4
2.2. Analysis Following the fieldwork, the team mapped the results in GIS. Photographic examples of various block analysis ratings were also created. Analysis included calculating the number of blocks associated with each block rating to identify a general level of stability in the neighborhood. Map 4-1 shows the results of the condition rating analysis for all West Louisville neighborhoods. See Appendix Maps 4-1 to 4-9 for block-level analysis mapping. The second part of the analysis dealt with translating the block analysis data into a series of classifications in terms of the ability to decrease blight, prevent neighborhood deterioration and return vacant and abandoned properties to productive use. The block classifications based on the rating system and analysis are as follows: Stable Blocks = Block Analysis Rating 1 Tipping Point Blocks = Block Analysis Rating 2 Stabilization Blocks = Block Analysis Ratings 3 and 4 Revitalization Blocks = Block Analysis Ratings 5 and 6
Block Classification Descriptions: Stable Blocks Stable blocks are blocks that contained no blighting influences. At least 35% of all blocks surveyed in the West Louisville neighborhoods were identified as
stable blocks. While the majority of the blocks in some of the neighborhoods were stable, all of the West Louisville neighborhoods had blocks in other rating categories (Table 4-3).
Tipping Point Blocks Tipping point blocks are on the verge of decline and show signs of disinvestment, or are in the process of revitalization. Any number of factors could signal that an area is at a tipping point. For example, a growing number of foreclosures in a neighborhood due to inactivity would indicate an increased potential for decline in even the most stable neighborhoods by introducing blighting influences to the area. Increasing rentals could also tip a neighborhood or area toward decline, as renters often do not establish a relationship to a neighborhood or community. On the other hand, increasing rentals in attractive, well-maintained homes can lead to homeownership, thus signaling tipping upwards to a more stable neighborhood. A high number of properties that need maintenance and improvements could signal tipping towards decline, and continued neglect of these blocks can lead to further decline of the neighborhood. Also, visual blight such as code violations can be seen as infectious to other blocks. Approximately 35% of the blocks in the West Louisville neighborhoods were identified as Tipping Point blocks.
Block Analysis RatingsWest End Neighborhoods, by PercentageNeighborhood
1 2 3 4 5 6California 14.6% 31.9% 44.8% 6.0% 2.7% 0.0%Chickasaw 48.1% 44.1% 7.8% 0.0% 0.0% 0.0%Hallmark 52.7% 41.0% 0.0% 6.3% 0.0% 0.0%Park DuValle 69.8% 21.6% 6.9% 1.4% 0.2% 0.0%Park Hill 11.2% 23.4% 29.8% 21.9% 13.8% 0.0%Parkland 8.8% 54.2% 28.4% 3.8% 4.9% 0.0%Portland 20.6% 32.1% 39.0% 4.1% 3.7% 0.5%Russell 21.8% 33.3% 36.1% 0.9% 7.6% 0.3%Shawnee 48.8% 36.3% 13.3% 1.5% 0.0% 0.0%Source: RKG Associates Inc., 2013
Block Rating
Table 4-3

Page | 4-7
VAP Neighborhood Revitalization Study
Section
4
Stabilization Blocks A number of blocks were identified to have a small amount of blighting influences on otherwise stable blocks (Table 4-3). In these instances, it is important to stabilize these neighborhoods or neighborhood blocks to stem the progression of neighborhood decline. Unaddressed blight at this stage could lead to declining property values, thus further deteriorating the block and eventually the neighborhood. Although these are scattered sites throughout West Louisville, addressing these blighting influences represent opportunities for an immediate impact.
Revitalization Blocks Revitalization blocks received a rating of 5 or 6, meaning that there were vacant buildings needing rehabilitation, vacant lots or that the entire block was a demolition candidate. Less 1% of the blocks received a rating of 6.
2.3. Findings
• Two neighborhoods are very stable (over 50% of blocks fell in Block Analysis Rating 1) – Hallmark and Park DuValle – requiring limited scale, scattered site intervention.
• Most West Louisville neighborhoods are Tipping Point or Stabilization neighborhoods.
• Very few blocks (<1%) in each of the West Louisville neighborhoods qualified as demolition candidates – these blocks were located in Portland and Russell.
• Within the Stable and Tipping Point blocks, there may be one to two vacant/abandoned properties that could be demolished (this determination was based on the consultant’s opinion of condition based on an exterior visual assessment).
• With the exception of Hallmark and Russell, the most blight occurs towards the east side of the neighborhoods; blocks exhibit more stable conditions moving westward into the neighborhoods.
2.4. Implications Although the Block Analysis was completed only for the West Louisville neighborhoods, the resulting
classifications (Stable, Tipping Point, Stabilization, Revitalization), are applicable throughout Louisville. Data from the block analysis findings can be used to help identify and prioritize Priority Project Areas. Block analysis data can assist with identification of blocks with the most visual short-term impact, as well as those blocks that have the greatest potential to act as a catalyst for long-term redevelopment and neighborhood stability. Block analysis data can also be utilized in reinvestment decisions concerning the alignment of proposed projects with both current and future catalytic projects. Finally, it must be noted that the level of data analysis conducted for this study is not sufficient to make site specific recommendations on properties to be demolished or redeveloped. For site-specific recommendations, a detailed windshield survey with complete property inspections would need to be conducted. For the most effective use of the findings from the block analysis study, they should be reviewed and considered in relation to other key criteria, such as findings from the demographic analysis and criteria identified in the Decision Making Matrix in Section 2.

Page | 4-8
VAP Neighborhood Revitalization Study
Section
4
3. Assessed Value Analysis
In addition to a block-level analysis, assessed value is another way to better understand the health and condition of the housing stock of an area. Based on an analysis of the average assessed value per square foot of single family homes in Jefferson County, the West Louisville neighborhoods have the lowest average assessed value – $66/SF for homes built since 2006. The Downtown, East & South Urban neighborhoods and the Jefferson County suburbs both have substantially higher average assessed values at $116/SF and $100/SF, respectively, for homes built during the same period of time. As seen in Figure 4-3, West Louisville has consistently lower assessed values per square foot than the other study areas regardless of when the home was built.
3.1. Structure Condition To the extent that the assessed value of a home can be tied to the quality of material used and level of maintenance, conclusions can be made about the condition of a building based on its assessed value. To identify concentrations of single family homes that exhibit signs of disinvestment, a Poor Condition rating was given to homes with an assessed value at 40% or
less of the Jefferson County average assessed value per square foot. Using this definition, substantially more of the single family homes in West Louisville are in Poor Condition than in any other area of focus in Jefferson County – 12,621 out of 17,777 homes built before 2001 (71%) and 411 out of 1,175 units built in 2001 or later (35%). By comparison, less than 7% of the single family homes in the Downtown, East & South Urban neighborhoods (50,666 units) and the suburbs (150,804 units) are in Poor Condition, regardless of build year (Figure 4-4, Appendix Tables 4-1 to 4-3).
3.2. Structure Age Homes built before 2001 exhibited a lower assessed value per square foot in all areas when compared to those built after 2005. An analysis of the number of homes built at least 50 years ago (1963 or earlier) reveals that the urban areas have a substantially larger portion of older homes – 16,370 units (86.5%) in West Louisville and 45,071 units (89.1%) in the Downtown, East & South Urban neighborhoods, than the suburbs (38.1% or 57,269 units). While a negative correlation between age and assessed value holds true in this case, when looking at
Figure 4-4
Source: Jefferson County PVA & RKG Associates, Inc., 2013
0.0%
10.0%
20.0%
30.0%
40.0%
50.0%
60.0%
70.0%
80.0%
West EndNeighborhoods
Downtown, East &South Urban
Neighborhoods
Jefferson CountySuburbs
UNITS IN POOR CONDITIONSingle Family Housing
Pre-2001 2006 - 2012
Figure 4-3
Source: Jefferson County PVA & RKG Associates, Inc., 2013
$26
$83 $81
$66
$116
$100
$-
$20
$40
$60
$80
$100
$120
$140
West EndNeighborhoods
Downtown, East &South Urban
Neighborhoods
Jefferson CountySuburbs
AVERAGE ASSESSED VALUE/SF By Year Built
Pre-2001 2006 - 2012

Page | 4-9
VAP Neighborhood Revitalization Study
Section
4
the three areas in Jefferson County, a notable difference exists between the West Louisville neighborhoods and the Downtown, East & South Urban neighborhoods. Though both areas have similarly high proportions of older housing stock, the homes in the West Louisville are of considerably less value than those in the Downtown, East & South Urban neighborhoods (Appendix Tables 4-1 to 4-3). An analysis of average assessed value per square foot suggests that homes in West Louisville, especially those built before 2001, have not held their value as well as those in the Downtown, East & South Urban neighborhoods or the suburbs. This could be due, in part to a number of factors including deferred maintenance, the high rate of absentee landlords and crime in West Louisville, which is exacerbated by the age of much of the housing stock. These factors have likely contributed to the below average condition of housing in this area more than elsewhere in Jefferson County.
3.3. Implications Home values tend to be lowest in West Louisville and consistently higher across other neighborhoods. The low assessed value of residential property in West Louisville can be explained by a variety of age, condition and occupancy factors, of which the latter two can be affected by the more challenging socioeconomic conditions facing residents in these neighborhoods. The difference between the assessed values of older homes in the urban study areas suggests that older homes in West Louisville are in poorer condition and not as well maintained when compared to similar single family units in the Downtown, East & South Urban neighborhoods. As discussed earlier in this section, a large number of homes in the West Louisville have absentee owners, which can foster an environment that enables a decline in property condition over time. Revitalization efforts could encompass a variety of policies, but improving property maintenance and increasing owner-occupancy of blighted dwellings could be an effective means towards promoting neighborhood stabilization and renewal. As values decline in these areas, it becomes a disincentive and obstacle for investors and
homeowners to obtain financing to purchase or justify home improvements that are not supported by the lower real estate values.

Page | 4-10
VAP Neighborhood Revitalization Study
Section
4
B. HOUSING AFFORDABILITY ANALYSIS
Housing affordability is an indicator of an area’s ability to accommodate a range of households at a variety of socioeconomic levels. A lack of affordable homeownership or rental options may indicate a need to further develop certain types of housing to better accommodate the current population. To assess housing affordability in the three study areas, an evaluation of the housing supply and affordable housing demand for each of these areas was conducted.
1. Methodology
1.1. Income Limits & Affordability Thresholds Fiscal year 2013 Income Thresholds calculated by the U.S. Department of Housing and Urban Development (HUD) for the Louisville-Jefferson County, KY-IN MSA were used as an approximation to define affordability in Jefferson County. Income limits are divided into 3 categories and available in household sizes ranging from one person to eight persons. All income limits are a certain percentage of the area median income (AMI) for a designated household size. According to HUD, 80% of AMI is “Low Income,” 50% of AMI is considered “Very Low Income,” and 30% of AMI “Extremely Low Income.” To gain a full picture of affordability for a range of socioeconomic situations, limits at 100% and 120% of AMI were also calculated by the RKG Team with the assistance of HUD. To establish which HUD household thresholds to use, the average household size for Jefferson County, or approximately 2.35 persons, was taken into account (Appendix Table 3-1). Income limits used for homeownership were based upon three person households and rental unit thresholds were based on two person income limits. Different household sizes were used for the homeownership and rental analysis based on the fact that rental units are typically smaller and have fewer bedrooms than the units purchased by homeowners. Table 4-4 shows a summary of the income limits used to establish the
affordability thresholds for ownership and rental housing. For the analysis, the income at each of the HUD limits was used to create a series of affordability thresholds. The resulting affordability analysis was based on the supply and demand within the following income ranges: 0% to 30% of AMI, 30% to 50% of AMI, 50% to 80% of AMI, 80% to 100% of AMI and 100% to 120% of AMI.
1.2. Housing Demand and Supply Affordable housing demand was measured by the number of households assigned to each income threshold based on household income estimates provided by Esri for 2010 (estimates were based on 2000 Census data). While estimates of 2012 incomes provided by Esri were considered, discussions with Esri regarding differences in estimate methodology between the two years led to the decision to use the 2010 estimates.3 2012 income estimates provided by Esri were based on ACS 5-year estimates and are notably lower than the 2010 estimates. This difference could be due to the alternate methodology and the fact that the ACS data may reflect some post-recession impacts. Therefore, it should be noted that the housing affordability analysis likely overstates current household income levels, which results in greater housing affordability than currently exists.
3 Lynn Wombold, ESRI. Contacted August 13, 2013.
Income Limits, FY2013Louisville-Jefferson County, KY-IN MSA
% of AMI 2 person 3 person30% $14,600 $16,40050% $24,300 $27,35080% $38,850 $43,700100% $48,600 $54,700120% $58,320 $65,640
Household Income
Source: U.S. Department of Housing and Urban Development (2013), RKG Associates, Inc.
Table 4-4

Page | 4-11
VAP Neighborhood Revitalization Study
Section
4
1.3. Homeownership Affordability The number of single family homes or condominiums that households at each income threshold can afford was determined by estimating the maximum mortgage amount a household could pay after covering associated homeownership costs. FHA and conventional loans were both included in the analysis. A conventional loan offers a homebuyer a greater number of homes from which to choose; however, for those who cannot qualify for conventional mortgages, an FHA loan has a lower down payment, making it an appealing option for those seeking affordable housing. Assumptions about down payments, current interest rates, annual mortgage payments, private mortgage insurance, real estate taxes, homeowners insurance and condo fees were included in the analysis to establish the value of homes affordable at each income limit based on information collected from a variety of sources. These assumptions were tailored to the West Louisville neighborhoods, Downtown, East & South Urban neighborhoods and the Jefferson County suburbs when possible.
1.4. Rental Affordability To identify the number of rental units within each rental affordability threshold, the consultant team used data on the number of units and their gross monthly rents at a census block level from the 2011 American Community Survey from the U.S. Census Bureau. Counts were established for those units with gross rents that fell within each category. Given that gross rent was available at a unit level, the consultant estimated that 30% of gross income would go to rent on an annual basis. This percentage was applied to each income limit and then divided by 12 to establish a monthly rent.
1.5. Data Sources In addition to the U.S Department of Housing and Urban Development, which provided the fiscal year 2013 Income Limits, housing supply data for homeownership for Jefferson County came from the Property Valuation Administrator’s property assessment database. For rental unit supply, data was
provided by the 2010 American Community Survey from the U.S. Census Bureau. Data used to estimate demand for ownership and rental housing at the various thresholds of affordability came from 2010 household incomes estimated by Esri. A variety of sources were used to develop the assumptions related to mortgages and associated homeownership costs and to determine the maximum value of an affordable home or condominium at each income limit. HUD provided information on FHA loan requirements such as down payments and income requirements. Conventional and FHA mortgage and mortgage insurance rates came from financial rate aggregator www.bankrate.com and local lenders. Local listings and national insurance clearinghouses provided information about condo fees and homeowners insurance. Tax rates for real property were found through the Jefferson County Property Valuation Administrator.
2. Affordability Analysis
2.1. Ownership Affordability An initial evaluation of the single family units in Jefferson County reveals that almost all of the single family homes in the study areas are affordable to households making 120% the area median income (AMI). While most of the housing stock in Jefferson County is considered affordable by these standards, the number of homes available at all income thresholds does not meet demand, nor does a sufficient level of housing quality exist at all levels of affordability. The type of loan a household chooses does have some effect on the number of units available for homeownership. This is because FHA loans require mortgage insurance due to low down payment requirements. While the down payment requirement of 3.5% may be smaller than in a conventional loan (20%), the associated payments beyond the mortgage consume a larger portion of household income, leading to a smaller mortgage overall. A smaller mortgage will reduce the number of units available to that household, depending on the value of the housing

Page | 4-12
VAP Neighborhood Revitalization Study
Section
4
stock in the market. For households seeking homes affordable at 80% of AMI or less in the Downtown, East & South Urban neighborhoods and the suburbs, there are more single family homes available to those using conventional lending than an there are to those who choose an FHA mortgage, which typically carry slightly higher interests due to the higher risks associated with the borrowers. Alternatively, in West Louisville, this is the case only for households making 30% of the AMI or less (Appendix Tables 4-4 to 4-6). However, the greatest factor in identifying which loan vehicle to use is the availability of the requisite 20% down payment. Given that a 20% down payment has become more and more challenging for households with no purchase history, it is likely the affordability threshold more closely resembles the FHA analysis than the Conventional analysis. This is particularly the case in the urban areas of Metro Louisville where over half of the households make 100% of AMI or less. In Jefferson County as a whole, the households most inclined to seek affordable homeownership options make more than $27,350 (50% of AMI) and up to $54,700 (100% of AMI) in gross income per year. All three study areas have a similar proportion of households in this range (26% to 29%). In the West Louisville and Downtown, East & South Urban neighborhoods, these households can afford homes
valued between $99,982 and $199,965 with an FHA loan and between $128,326 and $256,652 with a conventional loan. In the suburbs, this portion of households can afford homes between $100,848 and $201,695 in value with an FHA loan and $129,804 and $259,607 with a conventional loan (Figure 4-5, Table 4-5, Appendix Tables 4-4 to 4-6). The urban areas of Louisville generally do not have enough affordable housing to support the demand of
Table 4-5
Affordable Home Price by Level of AMI
Percent of AMI 3-Person Household
West End, Downtown, East & South Urban
NeighborhoodsJefferson County
SuburbsFHA LOANVery Low Income 50% $99,982 $100,848Low Income 80% $159,752 $161,135Area Median Income 100% $199,965 $201,695CONVENTIONAL LOANVery Low Income 50% $128,326 $129,804Low Income 80% $205,040 $207,401Area Median Income 100% $256,652 $259,607
Maximum Home Price
Source: U.S. Department of Housing and Urban Development and RKG Associates, Inc., 2013
Source: Jefferson County PVA, KY & RKG Associates, Inc., 2013
Figure 4-5
17.8% 18.9%16.0%
8.8%9.7% 13.6%
0.0%
5.0%
10.0%
15.0%
20.0%
25.0%
30.0%
35.0%
West EndNeighborhoods
Downtown, East &South Urban
Neighborhoods
Jefferson CountySuburbs
HOMEOWNERSHIP AFFORDABILITY Percent of Households, 51%-100% AMI
51%-80% of AMI 81%-100% of AMI

Page | 4-13
VAP Neighborhood Revitalization Study
Section
4
those making between 51% and 100% of AMI. To find homeownership opportunities, these households will choose from the existing supply of homes that are affordable to those at lower income thresholds. These homes are typically at prices below the maximum amount this threshold of households can afford. When the opportunity presents itself, these households may also choose to move to the suburbs where there is an overall surplus of units affordable to households between 51% and 100% of AMI for those using FHA loans. If a household does not choose to move to the suburbs,
a substantial number of the homes that are below the maximum amount the household can afford to buy also received a negative score when analyzed for characteristics that would impact the property’s marketability to homebuyers, renters and developers. Factors that impact marketability, both negative and positive, will be discussed further in Section 6. Receiving a negative marketability score indicates that there were a greater number of negative than positive factors relative to social, land use, land resource and housing associated with the property. The suburbs have a greater mix in the supply of affordable homeownership options. There is an oversupply of affordable housing for those making between 50% and 80% of AMI. However, the undersupply of units affordable for those making between 80% and 100% of AMI will most likely reduce this oversupply as households making between $43,700 and $54,700 annually consider units below their ideal price range in order to find a home (Table 4-6). Condominiums, which have increased in popularity nationally over the last decade, are also options for affordable homeownership in Jefferson County. In all three areas, there is an insufficient supply of affordably-priced condominiums to meet homeownership demand. Similar to single family homes, most condominium units are affordable to households making 120% of AMI or less in all areas of Jefferson County (Appendix Tables 4-4 to 4-6). However, much of the recent condominium development in the downtown has been built to a higher price point and sales have slowed in recent years. In the suburbs, condominiums are generally valued at a level affordable to the portion of population seeking homeownership. However, the Downtown, East & South Urban neighborhoods have a mix of affordability. The largest portion of condominiums are valued at levels affordable to those making 50% of AMI or less, while most of the remaining condominiums are most affordable to those making between 50%
Table 4-4
Ownership Supply and Demand3-Person Household Thresholds
Units HouseholdsSurplus/ Shortage
WEST END NEIGHBORHOODSFHA Loan50% - 80% 575 4,059 (3,484)
80% - 100% 68 1,997 (1,929)0% - 120% 18,917 19,047 (130)
Conventional Loan50% - 80% 193 4,059 (3,866)
80% - 100% 32 1,997 (1,965)0% - 120% 18,926 19,047 (121)
DOWNTOWN AND SOUTH/EAST NEIGHBORHOODSFHA Loan50% - 80% 11,886 15,701 (3,815)
80% - 100% 5,945 8,086 (2,141)0% - 120% 42,167 56,948 (14,781)
Conventional Loan50% - 80% 12,262 15,701 (3,439)
80% - 100% 4,417 8,086 (3,669)0% - 120% 45,686 56,948 (11,262)
JEFFERSON COUNTY SUBURBSFHA Loan50% - 80% 57,648 31,869 25,779
80% - 100% 18,256 27,106 (8,850)0% - 120% 126,250 112,168 14,082
Conventional Loan50% - 80% 44,703 31,869 12,834
80% - 100% 13,710 27,106 (13,396)0% - 120% 137,885 112,168 25,717
Source: RKG Associates, Inc., 2013

Page | 4-14
VAP Neighborhood Revitalization Study
Section
4
and 100% of AMI. In West Louisville, there are only 42 condominium units, most of which are considered affordable to those making 30% of AMI or less, a group that traditionally seeks rental units. Additionally, the overall quality of the condominiums in West Louisville may not be optimal and most received a negative score on marketability (Appendix Tables 4-4 to 4-6).
2.2. Rental Affordability As opposed to ownership, rental affordability is often of greater importance to lower income households. Those making 50% of AMI or less are more likely to seek rental properties than homeownership. This is particularly true in West Louisville and the Downtown, East & South Urban neighborhoods, where the largest proportion of households at this threshold reside. In West Louisville, there are 10,502 households (46%) that are most likely to choose rental options and 23,227 households (28%) in the Downtown, East & South Urban neighborhoods looking for rental units (Figure 4-6).
To analyze rental affordability, the 2-person household AMI thresholds from the U.S. Department of Housing and Urban Development were used. In Jefferson County, a typical renter household seeking
an affordable unit makes $24,300 or less in annual gross income. The monthly rent for this portion of households is $608 or less (Figure 4-7).
Overall, nearly all of the rental units available in all the study areas are affordable for households making 120% or less of AMI. Similar to ownership units, demand and supply of rental units is inconsistent across the range of income thresholds, particularly 50% of AMI or less (Appendix Table 4-7). The greatest demand (based on the number of households at 50% of AMI or less) for rental units is in the urban areas of Jefferson County. However, these areas do not have sufficient supply to meet all of the demand. This is particularly the case for extremely low income households making 30% of AMI or less. In addition, between West Louisville and the Downtown, East & South Urban neighborhoods, only the latter has sufficient affordable rental units to meet the demand of those that make between 30% and 50% of AMI. In contrast, although the Suburbs have the smallest portion of area households in need of affordable rental units (15% or 30,000 households), this area is also the least equipped to handle the demand of those living at an extremely low income level. The suburbs have the greatest gap in supply and demand
30.3%
16.7%
7.8%
15.7%
11.3%
7.2%
0.0%5.0%
10.0%15.0%20.0%25.0%30.0%35.0%40.0%45.0%50.0%
West EndNeighborhoods
Downtown &South/East
Neighborhoods
Jefferson CountySuburbs
RENTAL HOUSING AFFORDABILITYAMI Range; 2-Person Households
To 30% of AMI 31-50% of AMI
Source: Jefferson County PVA, KY & RKG Associates, Inc., 2013
Figure 4-6
$1,216
$971
$608
$365
$0 $500 $1,000 $1,500Ho
useh
old
AMI T
hres
hold
s
MAXIMUM RENT2-Person Households; All Study Areas
30% AMI 50% AMI 80% AMI 100% AMI
Source: Jefferson County PVA, KY & RKG Associates, Inc., 2013
Figure 4-7

Page | 4-15
VAP Neighborhood Revitalization Study
Section
4
for extremely low-income households seeking affordable rental units (Table 4-7).
3. Implications
3.1. Home Ownership For Jefferson County, the excess demand of affordable homeownership options in the urban areas reduces the supply of homes at the lowest income thresholds. The available supply of homes tends to be lower in value and may have a number of factors that lead to negative marketability. An increase in the supply of marketable, moderately priced homes is needed to meet demand for such housing in West Louisville and the Downtown, East & South Urban neighborhoods. To meet this need, organizations such as the Louisville Metro Housing Authority (LMHA), River City Housing and Habitat for Humanity have all completed projects or have projects in progress in West Louisville and the Downtown, East & South Urban neighborhoods. Many of these projects feature mixed income units, which have the potential to meet the demand for homeownership options for households at multiple income thresholds. Efforts to fill the gaps between supply and demand for affordable housing in these
areas have focused on multi-block developments, like the LMHA Sheppard Square project and individual homes spread out over a larger area, like the River City Housing projects. Given the overall undersupply of homes for households making between 51% and 100% of AMI, continued efforts to meet the demand for affordable housing are needed.
3.2. Rental Housing Generally, households with extremely low income or below will have the most difficulty finding affordable rental units in Jefferson County. This might partially explain the substantial amount of single family rental units in West Louisville, where there is a concentration of households seeking affordable rental units at a very low monthly rent. The recent increase in multi-family development in the Louisville Metro Areas may help to decrease gaps between supply and demand of affordable units for those at or above 50% of AMI, but not necessarily for the population most in need.
Rental Housing Supply and Demand2-Person Households
Income Threshold Units HouseholdsSurplus
(Shortage)WEST END NEIGHBORHOODS30% 2,074 6,914 (4,840)50% 3,061 3,588 (527)Total Affordable Units 11,346 18,141 (6,795)DOWNTOWN & SOUTH/EAST NEIGHBORHOODS30% 4,989 13,857 (8,868)50% 10,596 9,370 1,226Total Affordable Units 34,524 52,761 (18,237)JEFFERSON COUNTY SUBURBS30% 2,838 15,590 (12,752)50% 15,041 14,410 631Total Affordable Units 55,481 95,318 (39,837)Source: RKG Associates, Inc., 2013
Table 4-7

Page | 4-16
VAP Neighborhood Revitalization Study
Section
4
C. HISTORIC PRESERVATION AND PROBLEMS OF VACANT AND ABANDONED PROPERTIES
1. Introduction
In a study conducted in 2008 and sponsored by the non-profit Preservation Kentucky, preservation strategies were examined as a means to combat the large number of vacant and abandoned properties across the state of Kentucky and offered solutions for affordable housing. These strategies also defined how preservation can be utilized as a tool for economic development. The study, Preservation in Kentucky, examined preservation as a redevelopment strategy in “urban core Louisville” in greater detail:
“Historic buildings are affordable housing for the poor, elderly, and minorities. A significant portion of Kentucky’s housing stock is 50 years or older and census analysis shows older housing is disproportionately occupied by the poor, elderly and minority populations. This is because older housing provides affordable rents for low-income populations. For this reason, communities should make a major effort to preserve older housing. Designated historic districts have higher increases in property values Properties located in local and National Register historic districts experience larger increases in property values than in unprotected or undesignated neighborhoods. Local historic designations are a vital tool because they provide investors with a greater assurance that their neighborhood is protected from inappropriate changes to architectural details.”4
Map 4-2 (page 4-21) identifies the homes identified as 50 years or older in Jefferson County. High concentrations can be found in the West Louisville neighborhoods and the Downtown, East & South Urban neighborhoods, making the issues of affordability discussed in Preservation in Kentucky particularly relevant. While all of these properties are not likely to be historically significant or contributing structures, they are of an age where the issues of preservation are relevant. This section identifies existing policies established by Louisville Metro Government to utilize historic 4 Gilderbloom, John I., Erin E. House, Matthew J. Hanka. (2008). Preservation in Kentucky. Louisville, KY. Retrieved April 23, 2013, from http://sun.louisville.edu/preservation /PreservationinKentucky201-29-08.pdf.
preservation as a strategy to address vacant and abandoned properties. Also identified are best practices found throughout the country of successful techniques employed by municipalities and other government entities to use preservation as a tool to rebuild declining communities.
2. Existing Local Policies
2.1. Historic Properties and Demolition Using Federal Monies (Section 106)
Louisville Metro Government receives CDBG funds from the federal government with an allocation for demolition. Properties that are identified as contributing historic structures are subject to the requirements of the Section 106 process. This ensures that the potential impacts to historic buildings and/or archaeological resources are evaluated appropriately when using federal dollars. To streamline this process, Metro Government has a Programmatic Agreement with the Kentucky Heritage Council (the State Historic Preservation Office, or SHPO) which allows for determinations of contributing status in consultation with the SHPO and Louisville Metro’s Preservation Professional. If a building is determined to be contributing, a cost analysis is conducted by a Preservation Professional to evaluate the cost of a structure’s rehabilitation versus the cost of property acquisition, demolition or moving costs, and necessary relocation assistance. If the Preservation Professional determines that the rehabilitation cost is prohibitive, the cost analysis is submitted to the SHPO. The SHPO makes the determination either to accept the proposed demolition, or to consult further with Metro Government for alternatives to demolition. Contributing historic properties generally fall into two categories. The first category includes properties that are currently listed in the National Register of Historic Places or located in a Local Preservation District (Landmarks Commission) that are contributing structures or individually listed historic properties. The second category includes properties that are evaluated and determined potentially eligible to be listed in the National Register of Historic Places. These

Page | 4-17
VAP Neighborhood Revitalization Study
Section
4
individually eligible or contributing properties may have architectural or cultural significance that represent a period of time that defines the history of a neighborhood or community. If the property in question is defined by the characteristics referenced in the first category, it is recommended that every effort be made to rehabilitate that property.
Private Demolition Private demolitions (i.e., those not utilizing federal dollars) must also obtain approval. Subsection 150.110 of the Wrecking Ordinance requires a 30-day hold on the issuance of a wrecking permit if a building is eligible or listed in the National Register of Historic Places. This review of the wrecking permit application is conducted by the Landmarks Commission Historic Preservation Professional for buildings over 65 years in age.
2.2. Local Preservation District Like many cities and metro areas, Metro Government utilizes preservation districts as a means to preserve and promote architecturally and culturally significant areas of the Metro area. The local preservation district designation is regulatory, unlike a National Register of Historic Places designation which is primarily honorary. With a local preservation district designation, exterior alterations including demolition must be reviewed by the Architectural Review Committee. As seen in Map 4-3 (page 4-22), preservation districts are located throughout Jefferson County. Local preservation districts provide a means to protect and preserve the architectural and cultural character of a group of structures or neighborhood.
2.3. Individual Local Landmark The Landmarks Commission recognizes individual buildings as part of Louisville Metro Government’s preservation initiative. The individual local landmarks designation is a method of preserving and promoting structures significant to the neighborhood, Metro area and State. Regulations that apply to buildings located in Preservation Districts are similar to those that apply to buildings designated as Local Landmarks.
2.4 Tax Incentives “Tax incentive programs have been an effective tool for creating positive changes in historic areas. Kentucky is one of just 27 states in the country that provides tax incentives at the state level for commercial and residential historic rehabilitation projects.”5 Metro Government should widely promote the use of state historic tax credits. Since the historic preservation tax credit provision of the Governor’s 2005 JOBS for Kentucky Tax Modernization Bill was enacted, 257 commercial and owner-occupied residential projects have been completed. $5 million in funds are allocated to this tax credit, and are fully disbursed each year.6 Raising this cap would allow for more properties to be renovated; particularly by home owners (this is the only tax credit available to them). While homeowners can utilize the state historic tax credits, they cannot take advantage of the federal historic tax credits for appropriate investment in older properties deemed to be historic. The ability to receive both state and federal tax credits should be possible regardless of whether the intended future use is as an owner-occupied or investor-owned property (currently, federal historic tax credits are not available to non-income producing properties). Metro Government does offer an Assessment Moratorium Program that “provides an incentive for making improvements to qualifying residential and commercial buildings in Louisville Metro by providing a 5 year moratorium of some of the local tax assessment that would result from the improvements”. The existing tax moratorium program should continue to be encouraged and enforced. The City could also consider expanding the moratorium program to provide additional incentives with regards to vacant properties in targeted areas.
5 Gilderbloom, John I., Erin E. House, Matthew J. Hanka. (2008) 6 Kentucky Historic Preservation Tax Credit. Retrieved on August 9, 2013 from http://heritage.ky.gov/incentives/kytaxcred/

Page | 4-18
VAP Neighborhood Revitalization Study
Section
4
3. Best Practices and Recommendations
3.1. Proposed System for Sale of Tax-Foreclosed Properties
Recently, more cities find themselves owning dilapidated and abandoned buildings due to unpaid taxes. Many vacant and abandoned buildings can continue to deteriorate until they are seized by the city in a tax foreclosure process. When a tax foreclosure occurs, it is not uncommon for buildings to be auctioned with no regard for the future use of the building. In the case of Troy, New York, the city established a system by which the bidder would submit a ‘purchase proposal’ outlining the intended use of the property owned by the city of Troy. To the city, this was more important than the purchase price. This program enabled 110 city owned, seized properties, sold in 2002, to be redeveloped in historic communities. Similar to Troy, New York’s system, it is recommended that the creation of a conveyance policy for the sale of foreclosed property include provisions to assess the historic and cultural value of a property as a condition of sale.7
3.2. Advocacy and Marketing
Creation of a Catalogue of Home Ownership Opportunities Doing the legwork by identifying available properties for investment can be as simple as photographing the buildings and compiling them into a catalogue for prospective non-profit and for-profit developers. As an example, the Hartford, Connecticut Local Initiatives Support Corporation (LISC) office delivered a product marketing the redevelopment potential of distressed buildings that they acquired. By doing so, LISC was able to take some of the guesswork out of identifying readily developable properties for investors curbing blight in their neighborhoods. LISC’s efforts to build this resource were particularly helpful for area nonprofits:
7 National Trust for Historic Preservation, Rebuilding Community: A Best Practices Toolkit for Historic Preservation and Redevelopment, (Washington D.C.: Laughlin/Winkler, Inc.,2002), p.16.
“The catalogue also encouraged nonprofit groups not engaged in renovating to become involved in rebuilding Hartford’s historic homes. Without the catalogue, nonprofit organizations remain unaware of the number and locations of vacant buildings in Hartford that may be acquired and renovated for homeownership.”8
Heritage Tourism Heritage tourism highlights and promotes historic and cultural resources significant to a community while potentially spurring neighborhood redevelopment and increasing economic development. These assets tell the story of the community and are tangible resources that can be promoted. Heritage tourism includes working with existing historic preservation organizations to develop information on the economic impact of historic preservation. As part of its New Jersey Heritage Tourism Plan, the New Jersey Historic Trust published a report outlining economic impact data and analysis that made a strong case for promoting heritage tourism. The report cited a national market study released in October 2009 stating that “78% of all U.S. leisure travelers participate in cultural and/or heritage activities while traveling, translating to 118.3 million adults each year.”9 These benefits are in addition to the ability to “generate local investment in historic resources,” including job creation, increasing awareness of an area’s significance and building community pride. Within Louisville, NuLu and the Urban Bourbon Trail are examples of heritage tourism that have had a significant impact on the local economy and show how this model can be effective for neighborhood redevelopment. Additionally, lecture series could be developed inviting speakers from successful historic preservation
8 National Trust for Historic Preservation, Rebuilding Community: A Best Practices Toolkit for Historic Preservation and Redevelopment, (Washington D.C.: Laughlin/Winkler, Inc.,2002), 21. 9 New Jersey Heritage Trust, New Jersey Heritage Tourism Plan Economic Impact Data and Analysis.

Page | 4-19
VAP Neighborhood Revitalization Study
Section
4
movements, especially in lower income neighborhoods, to share their strategies and successes.
3.3. Design
Use of Design Guidelines to Direct Appropriate Neighborhood Redevelopment Design guidelines are used to guide rehabilitation practices of existing salvageable properties and the development of infill construction that would replace demolished structures. Design guidelines can be used to preserve and enhance architectural character and overall planning of a neighborhood, while still being flexible enough to maintain affordability for residents. While the Historic Landmarks and Preservation Districts Commission have established design guidelines, they are focused on the retention of original materials, and govern exterior changes to the building envelope, as well as site. The declining urban core neighborhoods of downtown Louisville need guidelines that promote an affordable approach for existing homeowners while maintaining the overall character of the neighborhood. The guidelines should also be outlined in a manner that will not deter potential investors or redevelopment. When the Martin Luther King, Jr. National Historic Site and Preservation District was established in Atlanta, Georgia, affordable and flexible design guidelines were created for residential development. These guidelines were established to make sure home ownership in a preservation district was not cost prohibitive for existing residents. The resulting policies enabled homeowners to continue maintenance on their historic property while containing the cost of the rehabilitation. Nashville, TN has also implemented conservation zoning districts, which are locally designated. Within conservation zoning districts, new construction, additions, demolition and relocation are reviewed by the Metropolitan Historic Zoning Commission. This is a lighter, more flexible designation than the city’s historic preservation zoning, which also requires reviewing exterior alterations such as replacing siding or installing fences.
3.4. Leveraging Public Private Partnerships A lack of dedicated resources to identify funding, work with developers and contractors, and organize volunteers can often be the downside to municipalities establishing a presence in declining neighborhoods. Community development corporations, or CDC’s, partnering with municipalities can lead to successes that both organizations can share. SWAP, Inc., or Stop Wasting Abandoned Properties, a CDC located in Providence, Rhode Island, was formed by concerned community members to help residents rehabilitate vacant houses and construct new homes within their community. SWAP was able to use low-income housing tax credits (LIHTC), HOME and CDBG funds for operating and construction costs. SWAP’s success stems from having staff experienced in all aspects of the development process which makes it less complicated to communicate and work with local government agencies. SWAP also successfully rid their neighborhoods of blight because they concentrated their resources in a small area which had a greater impact.
3.5. Adaptive Reuse and Affordable Housing Louisville’s non-profit community developer New Directions Housing Corporation (NDHC) has greatly contributed to providing affordable housing in declining neighborhoods. Their techniques for adaptive reuse and rehabilitation make them an excellent example to other developers and organizations. NDHC’s implementation of adaptive reuse has led to over 1,000 rental units for families of low to moderate income. Their most recent efforts include adaptive reuse of a friary, three elementary schools and a former hospital providing 200 affordable rental units.
3.6. Financing Strategies for Historic Property Developments
One example of a financing strategy for historic property development is to set aside funding through the Landbank Authority to develop historic properties. Land banks are generally used to take in and hold vacant properties until they can be returned to productive use. A Landbank initiative could be
Page | 4-20
VAP Neighborhood Revitalization Study
Section
4
designed to specifically acquire those blighted, historically significant properties. As a mechanism to assist in controlling blight, the Landbank should consider acquiring vacant buildings that have historic significance and are located in Priority Project Areas. The Landbank Authority could assume the responsibility of preparing a detailed work write-up, cost estimate, and prepare a before/after rendering of the house at no cost to the potential buyer. This could be used as an incentive to encourage the sale and restoration of the house. Another possible financing strategy is to fund and implement a down payment and closing cost assistance program focused solely on the rehabilitation of vacant and abandoned properties that are designated as historic. A program of this type might feature design assistance, preparation of work write-ups and ongoing technical assistance for proper maintenance of historical structures.
4. Implications
Currently, Louisville Metro Government promotes and preserves the aging and historic properties in Jefferson County through Preservation Districts and local landmark designations. Additional efforts to increase awareness about preserving historic properties has the potential to meet both preservation and affordable housing goals given the large amount of aging housing stock in Jefferson County. This is particularly the case in the West Louisville neighborhoods, where the housing stock does not meet all of the demand of lower income households in the area. Increasing the knowledge base of interested developers, investors and homeowners by providing resources on incentives and techniques facilitates participation in preservation and further promotes it as an important element of community revitalization. The best practices described in this discussion demonstrate creative ways to incorporate preservation efforts at the local and state level. They also illustrate that successful preservation efforts
involve the participation of public, private and nonprofit entities and utilize the strengths of each to achieve preservation goals.

Page | 4-21
VAP Neighborhood Revitalization Study
Section
4
Map 4-2

Page | 4-22
VAP Neighborhood Revitalization Study
Section
4
Map 4-3

Page | 5-1
VAP Neighborhood Revitalization Study
Section
5
THE VACANT AND ABANDONED
PROPERTY CHALLENGE
The major issues addressed in this study deal mostly
with the nature and severity of the vacant and
abandoned property problem, its geographic
dispersion, and the underlying housing conditions,
demographic and market factors contributing to the
current conditions. In addition, there are a number of
procedural, statutory and implementation capacity
issues that have an impact on the public, private and
nonprofit sectors’ response to the problem.
1. Characterization of the Louisville VAP
Problem
Key Factors Contributing to Neighborhood 1.1.
Decline
There are a number of key factors contributing to the
vacant and abandoned property problem in the
Metro Louisville area. Some of these are historical
factors related to high concentrations of poverty, poor
housing conditions, crime, limited employment
opportunities, and encroachment from railroad and
industrial land uses. However, in the lead up towards
and since the beginning of the previous recession in
December 2007, Louisville’s urban neighborhoods
have been affected by a number of new factors that
have exacerbated these conditions. Those include:
� Predatory Lending Practices,
� High Mortgage Failure and Foreclosure Rates,
� High Incidence of Tax Lien Sales,
� Large Numbers of Vacant and Abandoned
Properties, and
� Declining Property Values1.
1 In 2013, the Jefferson County Property Valuation Administrator conducted a revaluation of the West Louisville neighborhoods, with property values dropping in some neighborhoods by as much as 17%.
Market and Financial Disincentives 1.2.
The market context in Louisville’s declining
neighborhoods has not been positive for several
years. For example, RKG’s research indicates that
approximately 28% of residential sales in the West
Louisville neighborhoods since 2010 have been “less
than arms-length” sales. The concept of an arm's
length transaction commonly comes into play in the
real estate market. When determining the fair market
value of a property, the price for the property must
be obtained through a potential buyer and seller
operating through an arm's length transaction.
Otherwise, the agreed-upon price will likely differ
from the actual fair market value of the property.
For example, if two strangers are involved in the sale
and purchase of a house, it is likely that the final
agreed-upon price will be close to market value
(assuming that both parties have equal bargaining
power and equal information about the situation). This
is because the seller would want a price that is as high
as possible and the buyer would want a price that is
as low as possible.2
In Louisville’s urban neighborhoods, thousands of
properties have been trading for prices that are
below market value because the owner is under duress
or the property has been foreclosed on. Over time,
this starts to drive down the value of real estate, which
is what is currently happening.
In addition, RKG estimates that as many as 6% of
total home sales in West Louisville are likely arms-
length investor sales, where single-family homes are
trading at approximately 86% of current assessed
values, down from 101% in 2008-2009. At the same
time, declining real estate values may be creating
financial disincentives for certain “actors” (e.g., lending
institutions, investors, etc.) to take affirmative action to
foreclose on under-performing properties, particularly
vacant and abandoned properties.
2 Investopedia website: http://www.investopedia.com/ terms/a/armslength.asp

Page | 5-2
VAP Neighborhood Revitalization Study
Section
5 Existing Capacity and Resources to Support 1.3.
Change
Metro Government’s capacity to respond to the
growing problem of neighborhood blight and
property abandonment is not proportional to the
magnitude of the problem. There are no institutions
(i.e., public, private or nonprofit sectors) engaged at a
sufficient level to stem or correct this problem. In short,
the response to the problem, in all its forms, needs to
have a greater sense of urgency; a substantial
funding commitment and a higher level of coordination
to be effective at stabilizing and improving urban
blight conditions. Currently, there is a lack of full-time
staff dedicated to this problem. Although a number of
Metro staff have responsibilities related to this
problem, most can only dedicate part time to these
issues in addition to their other job responsibilities.
Existing Property Conditions 1.4.
According to RKG’s analysis of average assessed
property values, approximately 35% of single family
homes in West Louisville’s neighborhoods built since
2001 have assessed values per square foot that are
less than 40% of the average assessed value for
similar properties in Louisville-Jefferson County as a
whole. Neighborhoods such as California (70%),
Portland (52%) and Parkland (44%), have
particularly large concentrations of properties that
meet this criterion.
2. Identification of Marketable Areas and
Real Estate Assets
Selection Criteria Characteristics 2.1.
Private individuals, investors and developers will be
drawn to residential areas and neighborhoods of
relative stability in terms of housing conditions, real
estate pricing, crime, the availability of neighborhood
serving retail and public facilities, schools and a
myriad of other factors. Identifying areas of stability
or areas in transition is one approach to addressing
urban decline. Decisions about where to make future
public investments should be mindful of these factors,
especially in neighborhoods where real estate
marketability is very low and blight conditions are
severe. For a complete analysis of neighborhood
marketability, refer to Section 6 – Neighborhood
Marketability Analysis.
Leveraging Public Investments 2.2.
Metro Government should make strategic investments
in areas that will produce an investment response from
other important development players (i.e., for-profit
and nonprofit developers, real estate
investors/speculators, housing service providers, etc.).
This requires an understanding of the ever-changing
vacant and abandoned property problem; a clear
sense of the strategies required to encourage
revitalization and the recognition that vacancy and
abandonment are just symptom of a larger
neighborhood decline problem. Private investment
money typically flows to where public dollars are
being spent, usually in the form of federal grants,
loans, financial subsidies and infrastructure
investments.
Allocation of Public Dollars 2.3.
Public investments and subsidies must be used to
stimulate revitalization in areas where private money
wants to flow. This strategy is not always consistent
with federally funded projects and programs that
direct monies to areas of highest need in order to
benefit the greatest numbers of low and moderate
income households. While this is an appropriate and
reasonable objective, it tends to direct limited public
funds to the least desirable areas with the highest
investment risk and the greatest obstacles to success.
While this is not avoidable in many cases, creative
approaches are necessary to blend public money from
a variety of different sources for a variety of
different needs, with the emphasis on producing
benefits for a more economically diverse population.

Page | 5-3
VAP Neighborhood Revitalization Study
Section
5 3. Need for Administrative, Legal and
Legislative Initiatives
Code Enforcement and Blight Elimination 3.1.
Activities
Metro Government’s code enforcement, abatement,
judicial foreclosure/escheatment, triple taxation, tax
lien sales, and demolition initiatives are designed to
initiate public action against the most persistent cases
of property vacancy and abandonment. While these
activities are intended to resolve “problem”
properties, there is evidence to suggest that some of
these actions may be producing mixed results or
unintended consequences such as delayed
foreclosures, loss of public control and the erosion of
neighborhood character. In addition, enhanced tax
liens and fines on low value properties have the
potential to diminish or eliminate the financial
incentives of investors looking to acquire properties for
resale or redevelopment. Metro Government should
seek a balance between the recapture of back taxes
and the longer-term objective, which is to revitalize
areas and return properties to their full use and
market value.
Redevelopment Powers & Authorities 3.2.
In order to address the vacant and abandoned
property problem, Metro Government must create an
implementation entity with the necessary powers and
legal authorities required to address the full range of
challenges facing the City’s declining neighborhoods.
RKG Associates believes that an Urban Renewal
Authority, combined with the enhanced powers of the
Landbank Authority, Inc. and the Vacant Property
Review Commission would be the best course of action
to lead this effort. These entities are granted
complementary powers under state enabling
legislation to acquire, sell and manage real estate,
clear title, enter into development agreements, sell
revenue bonds, establish tax increment financing
districts, condemn property, undertake “spot”
condemnation and a variety of other actions in
support of this effort. However, none of the entities on
its own possesses all these powers and they will have
to function in partnership to properly address the
problem at all levels.
Title Clearance and Land Assembly 3.3.
The current Landbank Authority should be restructured
and authorized to undertake more aggressive actions
to acquire, hold, assemble properties, clear title and
repackage real estate for redevelopment. These
actions should be undertaken in strategic cooperation
with a newly created urban renewal authority called
“LouisvilleNOW.” This joint authority should work in
partnership with a variety of private and nonprofit
development partners, investors and individual
property owners.
Deed Recordation Requirements 3.4.
Kentucky state statutes do not place time limits within
which the owner of real estate must publically record
a legal deed confirming the owner of record. Not
recording a real estate deed makes it difficult to
identify the legal owner of a property, thus allowing
the owner to avoid responsibility for maintaining the
property.
Zoning and Land Use Amendments 3.5.
West Louisville’s residential neighborhoods are
suffering from severe encroachment from more intense
land uses such as industrial, warehousing, railroad
lines, interstate highway corridors and vacant
commercial buildings that no longer meet the needs of
contemporary businesses. Urban redevelopment is
necessary to address the most severe conditions that
appear to be affecting the “livability” of some
neighborhoods. This problem is most severe in areas
such as: Russell, Portland, California and Parkland.
Actions/Inactions Contributing to Blight 3.6.
Conditions
A combination of factors is leading key actors to take
actions that are contributing to the severity of the
problem.
Lenders
According to some stakeholders interviewed by RKG
Associates, some lenders may not be initiating
foreclosure proceedings and courthouse sales because

Page | 5-4
VAP Neighborhood Revitalization Study
Section
5 the perceived value of some properties is less than the
value of back taxes, abatement liens owed or the
staff and legal expense to initiate action. In some
instances, the bank has already written off the
property in an accounting sense and does not take
action, resulting in the property declining without
maintenance.
Investors/Speculators/Home Buyers
If foreclosed properties are sold at auction for less
than 2/3 of the appraised value of the property, a
one year right-of-redemption is instituted, whereby
the original owner could purchase the property from
the successful bidder for the sale price plus 10%. This
creates a disincentive to purchase properties for
redevelopment, or for purchasers to maintain the
property during this one year period as they do not
have assurances that their investments will be
protected. In addition, buyers of foreclosed
properties do not have time limits to take title to the
property, thereby allowing it to revert back to the
original owner/mortgagor. Should they decide they
do not want the property, it’s often after the original
homeowner has left the property and is unaware that
they still have ownership/maintenance responsibilities.
Homeowners
Anecdotal evidence through stakeholder interviews
suggests that some homeowners may have chosen to
vacate and abandon their homes before foreclosure
proceedings are initiated or evictions are ordered.
This eliminates a potential resolution of the issue
between the homeowner and lender and results in a
premature vacant and abandoned property. In
addition, since the original mortgagor remains the
legal owner, the lender can legally avoid
responsibility for maintaining the property and the
structure declines and remains undetected until code
enforcement officers are alerted.
Tax Liens and Foreclosure Policies 3.7.
The city has been exploring options related to the sale
of tax liens and its impact on vacant and abandoned
properties, including issuing a Request for Information
(RFI) seeking information on alternate models. The city
should continue to evaluate all options available and
pursue policies that do not create or exacerbate
vacant and abandoned properties. The city must
balance its fiscal obligations, limited bonding
authority, and limited public dollars and determine
how they would be best put to use. For example,
would those limited dollars best be spent acquiring
and demolishing vacant and abandoned properties or
buying tax liens? These are the difficult questions
facing policy makers.
4. Implications
This combination of factors are creating the context
for Louisville’s vacant and abandoned property
problem and must be addressed where possible to
start to correct the problem. In some cases, changes to
state enabling legislation will be necessary in order to
give Louisville Metro Government the powers,
authorities and implementation tools it needs to be
successful.

Page | 6-1
VAP Neighborhood Revitalization Study
Section
6
A. NEIGHBORHOOD MARKETABILITY ANALYSIS
1. Introduction
The RKG Team’s approach to understanding the vacant and abandoned property problem in Jefferson County required the creation of a customized property evaluation system based on each respective property’s “marketability” to investors, developers and future occupants. This section provides an overview of the method used to determine neighborhood marketability at a parcel level, the findings of this analysis, and its implications for approaches to implementation.
Purpose and Objectives 1.1.The neighborhood marketability analysis was developed out of a need to provide a “first-cut” method for determining where future investment by Metro Government might have the most impact and greatest effect on mitigating challenges related to vacant and abandoned properties. The RKG Team identified fourteen important and measurable factors that could be considered by developers, homebuyers and investors when buying or renting a home in a given area. However, these are not all of the possible factors to be considered in making real estate investment decisions and the analysis should be considered one tool amongst others to identify potential revitalization target areas.
Methodology 1.2.The term “marketability” in this context refers to the myriad of factors that contribute to an investor, developer or homebuyer/renter’s assessment of a given property or neighborhood based on a number of known variables (highlighted in Table 6-1). In this regard, the analysis attempts to weigh a series of positive and negative factors that help shape a person’s perception of a given area. While it’s very difficult to model human behavior, RKG used a number of known, measurable factors that correlate with “go/no go” real estate investment decisions.
Parcels were assigned a score for each of these factors on a scale of -4 to +4 depending on the factor being evaluated. In cases where the existence of a factor was anticipated to affect the marketability of the surrounding area, a radius was applied to its location. For example, parcels within a one mile radius of a grocery store obtained a score associated with this factor. Every factor received a weight based on its perceived importance to marketability. The sum of these weighted factors was then represented on a GIS-based map to place these total marketability scores in a locational context. Given the availability of data, residential parcels received scores based on all factors. Non-residential parcels were assigned only one factor: percent of average assessed value per square foot. The analysis focused primarily on factors impacting residential parcels due to the prevalence of vacant and abandoned properties in predominantly residential areas of Louisville-Jefferson County.
Data Sources 1.3.Sources of data for this analysis included the Jefferson County Property Valuation Administrator’s assessor’s database, the U.S. Census Bureau, and property inventories from Metro Government. Crime data was provided by the Jefferson County Police Department, public housing data came from the Louisville Metro Housing Authority and the Center for Environmental Policy and Management at the University of Louisville. The Metropolitan Housing Coalition provided foreclosure sales data and poverty data; commercial property and retail locations came from Esri. APD Urban Planning & Management produced the housing condition block rating system.

Page | 6-2
VAP Neighborhood Revitalization Study
Section
6
Table 6-1 Louisville-Jefferson CountyProperty Marketability FactorsHOUSING DISTRESS FACTORS Field Description Weight LAND RESOURCE FACTORS Field Description WeightAssessed Value of Parcels Percentage of Average Value/SF 14 City Owned/Actionable Parcels Parcel Status: 14
Single Family Land BankDuplex/Triplex City AssetCondo/Coop County AssetMobile Home Potential Surplus
Vacant/Abandoned PropertyForeclosure Sales Number of Sales by Zip Code 7 City - Identified Priority Parcels Parcel Status: 3
0 - 49 Priority Foreclosed Property50 - 156 Escheatment157 - 375376 - 635636 - 918
West End Condition Rating Condition Rating 14 Residential Vacant Lots Parcels meeting one of the following criteria: 7Condition Assessment [1] 1: stable block Property Class – Residential Vacant Lots
2: stable block, 1-2 blighting influences Parcels with building size of 400 sqft or less3: blighted but stabilizing factors Parcels without an improvement value4: blighted level 1 5: blighted level 2 6: demolition candidate
Homeowner Status Status 11 Minimum Residential Lot Size Residential Parcels < 4,500 SF 7Optimal: owner in Louisville, KYAcceptable: owner within KYNot Ideal: owner outside KYExempt: properties owned by city/county
Category Total Weight: 46% Category Total Weight: 31%
LAND USE PROXIMITY FACTORSField Description Weight SOCIAL INDICATORS Field Description WeightPublic Facilities/Amenities Close proximity to park, church, public school 1.5 Crime Data Type of Crime 7
Violent CrimeProperty Crime
Commercial/Retail Areas Near bank, grocery store or pharmacy 3 Percent Below Poverty Percentage Range 3Industrial/Railroad Areas Close proximity to industrial area/railroad line or R.O.W. 1.5 Public Housing Housing Program 7
Public HousingSection 8 (Vouchers & Project Based)
Category Total Weight: 6% Category Total Weight: 17%Source: RKG Associates, Inc., 2013

Page | 6-3
VAP Neighborhood Revitalization Study
Section
6
2. Marketability Factors
Factors for assessing the marketability of parcels fall into one of four categories closely related to the key factors contributing to neighborhood decline. These categories include: (a) housing distress, (b) land resources, (c) land use proximity, and (d) social indicators (Table 6-1). An expanded version of this table including the scores associated with each factor can be found in Appendix Tables 6-1 and 6-2. While similar in nature, the block condition ratings described in Section 4 differ from the Marketability Analysis results in the following ways. First, the block analysis only took into account one factor: the general physical condition of the residential block as observed from a windshield survey. The marketability analysis includes the results of the block analysis, but also accounts for thirteen other quantifying measures that relate to the “marketability” of an area. While condition is perhaps the most important factor, the analysis also accounts for price; the incidence of crime; community facilities; and a number of other factors described below.
Housing Distress Factors 2.1.To potential investors or homeowners, signs of distressed housing can be a deterrent based on perceived or real declining conditions and lower property values. The factors in this category were assigned scores to reflect the negative effect that housing distress can have on a property and its surrounding properties. Given that the signs of housing distress manifest themselves in a visible manner and play an important role in investment decisions, factors in this category made up 46% of the total score for each parcel.
Assessed Value As discussed earlier in this report, assessed value of a property can be one measure used to determine the condition of a property. For the marketability analysis, the assessed value per square foot of each parcel was compared to the average assessed value per square foot of similar parcel types in all of Jefferson County. Parcels with an assessed value per
square foot of 80% to 100% of the County average received a score of +1. Parcels with values below 80% of the County average received decreasing scores from -1 to -4 in 20% increments. If a parcel’s assessed value per square foot was between 100% and 140% of the County average, scores of +1, +2 or +3 were awarded. Parcels with an assessed value per square foot of 141% of the County average or more received a score of +4. A weight of 14 was applied to all scores to reflect its high level of importance in the marketability of a parcel.
Foreclosure Sales Foreclosure sales are an indication of the level of foreclosure activity in a neighborhood or region. The marketability analysis expresses the negative relationship between high concentrations of foreclosure sales and increased housing distress. Using foreclosure sales from 2006-2010 by zip code, the consultant assigned each parcel a score based on the quantity of foreclosure sales. Zip codes with less than 50 foreclosure sales received a score of +1. For parcels in all other zip codes, the greater the quantity, the more negative the score. Therefore, parcels in zip codes with 636 to 918 foreclosure sales received a score of -3 while parcels in zip codes with 50 to 635 foreclosures sales were given scores of -1 or -2. A weight of 7 was applied to these scores reflecting the fact that foreclosure sales are a moderately important factor to marketability.
Block Condition Rating In addition to evaluating property condition based on assessed value, the block-level condition rating assigned by APD Urban Planning & Management was included for parcels in the West Louisville area. Parcels on stable blocks that had a rating of 1 or 2 received a score of +4 and +2 respectively. Blocks that were blighted but had stabilizing elements received a score of +1. For parcels on blocks that were blighted, a score of -1 or -2 was assigned based on the severity of blight. In blocks that were considered demolition candidates, parcels received a score of -4. Similar to assessed value, a weight of 14 was applied to scores assigned because condition has a high level of importance to marketability.

Page | 6-4
VAP Neighborhood Revitalization Study
Section
6
Homeownership Status Another factor related to housing distress is homeownership status. As discussed in Section 4, a residential unit that is owner-occupied or has a local owner has the potential to be better maintained than properties with absentee landlords. Based on the current address of the property owner in the assessor’s database, parcels were categorized by where the owner resides. Homeownership status was considered Optimal and received a score of +2 if the owner lived in Louisville, Kentucky. If the owner resided in the state of Kentucky, the homeownership status was Acceptable and the parcel received a score of +1. Owners whose current address were listed as outside the State of Kentucky were considered Not Ideal and parcels with this status scored a -1. In some cases, a parcel was Exempt and owned by Louisville Metro Government. This was considered to be as positive as having a local homeowner and a score of +2 was assigned. While not as important as assessed value or the condition rating, homeownership status was considered to be more important than foreclosure sales and scores in this category were weighted by a factor of 11.
Land Resources Factors Land resources that are ready for sale and easy to develop can make some parcels more marketable than others. In general, the factors in this category are seen as assets to the areas where they are located. Many of the parcels which received positive scores in this category are within government control and have the potential for immediate action. In this regard they are considered valuable assets or land resources that can be put to a higher and better use. By itself, a parcel’s availability does not make it marketable, but it can contribute to a site’s redevelopment or larger scale revitalization activities and is a notable factor that makes up the second largest percentage of the total score (31%).
City Owned/Actionable Parcels Parcels either owned by Louisville Metro Government or identified as properties to which Metro Government
can apply direct action (e.g., initiate a municipal foreclosure action) are considered one factor within the land resources category. Properties owned through the Landbank Authority received a score of +2. These parcels received a positive score because selling these parcels at a price that facilitates redevelopment efforts is a primary objective of the Landbank Authority. Metro-owned properties identified as potential surplus and available for sale received a score of +1. These parcels received a slightly lower score than Landbank parcels because at the time of the analysis, the sale of these parcels was primarily viewed as a source of revenue for Metro Government and not a way to meet redevelopment objectives. Finally, properties identified as vacant or abandoned were considered assets given their potential for rehabilitation and future part in neighborhood revitalization. These parcels also received a score of +1. A weight of 14 was applied to these scores to reflect the high level of importance that Metro Government ownership or interest plays in the marketability of a parcel.
City Interest Parcels City interest parcels are those properties whose fate is of interest to the City because they are properties in transition. These are parcels that Metro Government has initiated foreclosure on via abatement liens. Reflecting the potential and opportunity associated with these parcels, each property with these designations received a score of +1. This factor was considered only slightly important to overall marketability and scores received a weight of 3.
Residential Vacant Lots Residential vacant lots are viewed as assets because of their potential availability for development that can further neighborhood revitalization. A parcel was considered to be a residential vacant lot if it had a PVA property classification of Residential Vacant Lot, did not have an assessed value associated with an improvement (building) or only had a structure considered an accessory building of 400 square feet or less. These potentially development-ready parcels were given a score of +2. Vacant lots were considered moderately important to parcel

Page | 6-5
VAP Neighborhood Revitalization Study
Section
6
marketability and a weight of 7 was applied to all scores.
Minimum Residential Lot Size Lots were considered easier for redevelopment when they are large enough to build marketable, modern housing. Therefore, parcels with lot sizes of less than 4,500 square feet received a score of -2. Those parcels 4,500 square feet or greater received a score of +2. Similar to vacant lots, lot size was considered moderately important to the marketability of a parcel. Therefore, scores were weighted by a factor of 7.
Land Use Proximity Factors 2.2.The convenience of a nearby grocery store or proximity to a less desirable land use, such as a railroad line or industrial complex, can influence where people choose to live and where developers locate new residential projects. For the analysis, scoring of these factors was based on the advantage or disadvantage of a parcel’s proximity to these uses. While these factors play some role in investment decisions and perceptions of an area, it was determined that they were less critical when compared to other marketability factors. Therefore, they account for only 6% of the total score for each parcel.
Public Facilities/Amenities Many homeowners and renters look for housing that is near a park, public school or a church. These public amenities provide a variety of services for the neighborhood in which they are located. As an asset to a property’s marketability, parcels within a 500 foot radius of any of these public facilities or amenities were given a score of +1. The role that proximity to a public facility or amenity plays in marketability was considered to be minimally important, so a weight of 1.5 was applied to these scores.
Commercial/Retail Areas Convenience is another factor that is attractive to homeowners and renters. Properties near banks, grocery stores or pharmacies were considered more desirable due to the ease with which residents can access these businesses. Parcels within a one mile radius of a bank, grocery store or pharmacy received
a score of +1. Considered slightly more important to marketability than proximity to public facilities and amenities, scores for parcels near commercial and retail areas were weighted by a factor of 3.
Industrial/Railroad Areas Not all businesses or land uses add to the marketability of a property. Industrial sites are often considered less ideal neighbors due in part to noise and heavy traffic associated with production and manufacturing. For parcels within a 500 foot radius of industrial land uses,. a score of -1 was assigned. Similar to industrial properties, railroads were also considered less desirable land uses due to noise and safety concerns. Therefore, properties within a 500 foot radius of a railroad received a score of -1 as well. Similar to proximity to a public facility or amenity, being near an industrial area or railroad was considered minimally important to marketability and a weight of 1.5 was applied to scores for this factor.
Social Distress Factors 2.3.Marketability and what attracts investment depends on the perception of the area as a reflection of its environment. In an effort to capture the perception of a potential homebuyer or investor, social indicators related to these factors were scored relative to the degree to which they might impact marketability. Acknowledging that these social indicators play a role in investment decisions, this category makes up 17% of the total score for each parcel.
Crime Data To the extent that incidents of crime contribute to a perception of the level of crime in an area, the location of property and violent crimes were included in this analysis. Parcels within a 50 foot radius of the location of a property crime received a score of -1. Given that violent crime is more severe, parcels within a 300 foot radius of incidents of this type were assigned a score of -2. The perception of crime was considered to be moderately important to marketability of a parcel. Therefore, scores were weighted by a factor of 7.

Page | 6-6
VAP Neighborhood Revitalization Study
Section
6
Percent Below Poverty Similar to the perception of crime, the level of poverty that exists in an area can affect the perceived desirability of a property. To account for this, the percent of the population below poverty level (calculated in the 2011 5-year estimates from the American Community Survey) was used to evaluate this factor. For parcels in areas with 0% to 25% of the population below the poverty level, a score of +2 was assigned. If a parcel was in a census tract with 25% to 50% of the population below poverty level, the parcel received a score of +1. When 50% to 75% of the population was below the poverty level, the parcel was given a score of -1. Parcels in areas with the highest concentration of poverty – those with 75% to 100% of the population below the poverty level – received a score of -2. The level of poverty of an area was determined to be minimally important to the marketability of a parcel. Scores were weighted by a factor of 3 to reflect this level of importance.
Public Housing The existence of public housing and properties that accept Section 8 Vouchers have the potential to affect the perception of the neighborhood in which they are located. Public housing, particularly older vintage developments, can have a slightly negative perception due to their austere design, and in some cases, poor housing condition. To the extent that these conditions exist in Louisville, RKG assigned a slightly negative value of -1 to these properties. On the other hand, properties that accept Section 8 Vouchers were considered more advantageous given the standards residential units must meet to qualify to accept Section 8 Vouchers. Therefore, these parcels were given a slightly positive score of +1. Scores associated with the location of public or subsidized housing were determined to be moderately important to marketability and were given a weight of 7. It’s important to note that the values assigned to these factors are meant to reflect common perceptions, which in turn could affect people’s decision about where they live or the properties they invest in. However, as a marketability factor, it is considered fairly low in terms of its value and weighting in the overall marketability score.
Non-Residential Parcels 2.4.The factors outlined in the preceding section were developed from the perspective of the marketability to future homeowners, renters, and investors. Therefore, they are most relevant to residential parcels in Jefferson County. When non-residential parcel data was available, an alternate method of rating parcels was used. Non-residential parcels received a score and accompanying weight of 14 based on their assessed value when compared to the average assessed value for the property type. Therefore, the total scores for non-residential parcels are smaller based on the limited criteria upon which marketability was determined.
3. Neighborhood Marketability Findings
The final marketability score represents the total sum of each weighted factor. For residential parcels, these scores range from -159 to +140, for non-residential parcels the range is -56 to +56. This total was then applied to each parcel on a map using color coding to represent the range of total scores (Maps 6-1 to 6-3). For residential properties, green parcels indicate the balance of scores was positive and considered favorable to its marketability. A range of greens were used to reflect the strength of the positive score. Parcels with scores from +0.5 to +30 are pale green. A medium shade of green represents scores ranging from +30 to +60. High positive scores from +60 to +140 are represented by dark green. Red represents an overall negative score and a parcel which possesses fewer of factors that are considered favorable to investment. Parcels with a pale red or pink color received scores between -0.5 and -30. A bright, middle shade of red represents scores from -30 to -60. Parcels that received the highest negative scores, from -60 to -159, are represented in dark red. On the other hand, parcels that received a score of 0 are represented by yellow. Non-residential parcel marketability is expressed in a similar manner. Like residential parcels, the highest positive scores, +28 to +56, were represented by
Page | 6-7
VAP Neighborhood Revitalization Study
Section
6
dark green. A medium shade of green was used for the remaining positive score of 14. Alternatively, a moderately negative score of -14 was represented by a middle shade of red. Parcels with the highest negative scores of -28 and -56 were dark red. Due to the single criteria used to determine non-residential marketability, a limited number of final scores were possible. Therefore, the range of colors used to represent the variation among parcel marketability was similarly limited.
Jefferson County Suburbs 3.1.Overall, as seen in Map 6-1, the areas with the highest marketability were found in the northeastern and southern parts of Jefferson County. A mix of marketable parcels exists in the southwestern suburban neighborhoods. As a whole, marketability transitions from high positive scores to moderately positive and slightly negative scores when moving from East to West. Parcels closest to the urban areas in the northwestern parts of Jefferson County were generally less positive than those further out in the suburbs.
Downtown, East & South Urban 3.2.Neighborhoods
Map 6-2 shows that this area has similar marketability patterns to those seen across the County. The areas with the greatest number of positive factors are concentrated in the East. Moving closer to Downtown and West Louisville, a larger number of slightly green parcels and a range of red parcels represent a greater number of associated negative factors affecting marketability.
West Louisville Neighborhoods 3.3.Overall, the western and southern parts of West Louisville have a greater number of positive factors, as reflected by the concentration of green parcels seen in Map 6-3. The largest concentration of negative marketability scores are along the railroad corridor and I-264 right-of-way and in the north and eastern sections of this area. At a neighborhood level, Park DuValle, Chickasaw, Hallmark and Shawnee had the largest number of parcels with positive marketability scores. Portland, Parkland and the
western sections of Russell, California and Park Hill are overall less marketable and have more parcels with negative scores. Comparisons can also be made between the overall marketability of the West Louisville neighborhoods and the housing condition block analysis rating system used by the RKG Team based on an in-field visual inspection. In general, the visible conditions of the neighborhoods were consistent with their range of marketability described above. However, in Shawnee and Chickasaw, the conditions attributed to visual assessment were less severe in some areas than the marketability analysis suggests. This could be due to the fact that the marketability analysis takes into account factors such as crime, which do not always have a visible impact on the housing stock of a neighborhood but might affect the housing choices of future residents. In general, the trends observed in the field were similar to the trend in marketability scores in West Louisville.

Page | 6-8
VAP Neighborhood Revitalization Study
Section
6
Map 6-1

Page | 6-9
VAP Neighborhood Revitalization Study
Section
6
Map 6-2

Page | 6-10
VAP Neighborhood Revitalization Study
Section
6
Map 6-3

Page | 6-11
VAP Neighborhood Revitalization Study
Section
6
B. REAL ESTATE MARKET ACTIVITY The marketability of an area provides a broad perspective on the positive and negative factors that can impact where developers and homeowners choose to invest. Development trends and recent sale of residential properties in Jefferson County can provide a more in-depth analysis of the current status of the real estate markets in the West Louisville, Downtown, East & South Urban neighborhoods and the Jefferson County suburbs. To analyze the real estate markets in Jefferson County, the consultant used assessment data and real estate transaction records from the Jefferson County Property Valuation Administrator.
1. Residential Development Trends
Development Activity 1.1.By 2012, the Jefferson County suburbs had a total residential housing stock of 167,064 single family, condominium and duplex/triplex properties. Of those units, 23,692 (14.2%) have been added since 2001. In comparison, the West Louisville neighborhoods added 1,196 units (6%) and the Downtown, East & South Urban neighborhoods added 1,437 units (2.4%) during the same period of time (Table 6-2, Appendix Tables 4-1 to 4-3). The large percentage of residential units of all types added in the suburban neighborhoods is consistent with the large amount of readily developable land in this part of Jefferson County. Both of the urban areas added roughly the same number of residential units over the last 11 years, but the greater pace of activity in the West Louisville neighborhoods is especially noteworthy given the limited availability of land. This increased pace could be due in part to redevelopment activity facilitated by the low price for residential properties in this area, which have average assessed values that are notably lower than those in the Downtown, East & South Urban neighborhoods.
Leading up to 2006, the pace of development for both the West Louisville neighborhoods and Jefferson County suburbs was greater than the years during or after the 2008 recession. Decreased development activity during this time is consistent with the slowing of activity across the real estate industry on a national level. In contrast, the pace of development in the Downtown, East & South Urban neighborhoods remained consistent, though at a small volume, between 2001 and 2012. The average development rate per year of single family homes did drop in this area; however, the consistency in development appears to be due to the completion of a large number of condominiums after 2005. An article in Business First from 2011 reiterated that in the mid-2000s there was a notable increase in condominium development in downtown but development activity slowed after 2009 as added
Development Trends
Year BuiltResidential
UnitsShare of
InventoryWEST END NEIGHBORHOODSPre-2001 18,806 94.0%2001-2005 809 4.0%2006-2012 387 1.9%Total 20,002 100.0%Total Units Added 2001-2012 1,196 6.0%DOWNTOWN, EAST & SOUTH URBAN NEIGHBORHOODSPre-2001 57,554 97.6%2001-2005 767 1.3%2006-2012 670 1.1%Total 58,991 100.0%Total Units Added 2001-2012 1,437 2.4%JEFFERSON COUNTY SUBURBSPre-2001 143,372 85.8%2001-2005 15,604 9.3%2006-2012 8,088 4.8%Total 167,064 100.0%Total Units Added 2001-2012 23,692 14.2%Source: PVA of Jefferson County, KY & RKG Associates, Inc., 2013
Single Family, Duplexes, Triplexes and Condominiums; Comparative Neighborhoods
Table 6-2

Page | 6-12
VAP Neighborhood Revitalization Study
Section
6
inventory was not immediately sold1. As the development of single family homes decreased, the number of condominiums completed increased and helped to maintain the overall steady pace of development for the Downtown, East & South Urban neighborhoods during this period (Appendix Tables 4-1 to 4-3). The development activity in Jefferson County over the last 11 years is divided across several types of residential housing. Single family units comprised a substantial amount of West Louisville and suburban development between 2001 and 2012. However, in the Downtown, East & South Urban neighborhoods, development was more diverse. Due to the large number of condominiums developed during this period, single family units only accounted for half (50.4%) of the 1,437 units developed (Figure 6-1, Appendix Tables 4-1 to 4-3).
1 Karman III, John R (2011). “Data Analysis Turns Up Unexpected Facts about Louisville Downtown Housing,” Business First. Retrieved on 6/24/2013 from http://www.bizjournals.com/louisville/print-edition/2011/05/20/data-analysis-turns-up-unexpected.html.
Assessed Value 1.2.As discussed in Section 4, the assessed values of properties correlate strongly with their overall condition. Assessed value per square foot is overall lower for properties in the West Louisville neighborhoods than the Downtown, East & South Urban neighborhoods or the suburbs, regardless of when the home was built. Therefore, for units built after 2006, the average value per square foot was $66/SF in West Louisville neighborhoods, $34 less than the average value per square foot of a similarly-aged home in the suburbs ($100/SF) and $50 less than the average value per square foot for a newly-built home in the Downtown, East & South Urban neighborhoods ($116/SF) (Appendix Tables 4-1 to 4-3).
Development Trends 1.3.Overall, development patterns across Jefferson County suggest that the pace of development was affected by the 2008 recession and has slowed since 2006 in West Louisville and the suburbs. The quality and condition of the single family housing stock in these areas is inconsistent across Jefferson County as suggested by the variation in assessed value per square foot. The disparity in average assessed value between these two areas is important given the large amount of single family development, particularly in West Louisville. The Downtown, East & South Urban neighborhoods are different. While not adding substantially to the housing stock in the area, the pace of development activity since 2001 has been steady due to a surge in condominium development after 2005. This finding is common for areas with condominium development, as projects cannot stop once underway due to common elements (i.e. roofing and climate control), unlike single-family detached and attached developments. When compared to West Louisville, the Downtown, East & South Urban neighborhoods have a higher average assessed value per square foot for the single family homes developed since 2001.
0%10%20%30%40%50%60%70%80%90%
100%
West EndNeighborhoods
Downtown, East &South Urban
Neighborhoods
Jefferson CountySuburbs
DEVELOPMENT COMPOSITION2001-2013, by Housing Type
Single Family Duplex/Triplex Condos/Coops
Figure 6-1
Source: Jefferson County PVA & RKG Associates, Inc., 2013

Page | 6-13
VAP Neighborhood Revitalization Study
Section
6
2. Residential Sales Analysis
The latest sale of all residential housing units was used to analyze the recent sales patterns of the housing stock in Jefferson County. Of these sales, only those considered arm’s length were included in the analysis. For this analysis, an arm’s-length sale was determined to be one where the sales price was at least 50% of the assessed value of the property. To better understand the residential sales in Jefferson County, the county was divided into five areas as seen in Map 6-4: West Louisville Neighborhoods, Downtown, East & South Urban Neighborhoods, Suburban Submarket 3, Suburban Submarket 4 and Suburban Submarket 5.
Residential Sales Activity 2.1.Since 2008, the volume of sales of duplexes/triplexes and multi-family units has been greatest in the Downtown, East & South Urban neighborhoods. Alternatively, the greatest number of condominium sales occurred in the suburbs, although the change in sales since 2009 was not as substantial as the change in sales of condominiums in the Downtown, East & South Urban neighborhoods. For single family homes,
the largest amount of sales activity occurred in the suburban submarkets (Appendix Table 6-3). Sales activity has overall increased since 2009 from levels during the 2008 recession. Sales of residential units of all types increased between 40% and 150% after the recession. The most rapid increases in sales occurred in residential units other than single family homes. Multi-family properties saw a notable increase in sales in the West Louisville neighborhoods and the suburbs after the recession. Sales of multi-family properties increased by 150% in West Louisville between 2010 and 2012 over 2008-2009 levels and 130% in the suburbs. This substantial increase in interest in multi-family units is consistent with the national increase in the strength of the multi-family market discussed later in this section (Appendix Table 6-3). As mentioned earlier, the Downtown, East & South Urban neighborhoods had an increase in condominium sales activity of 61.5% (1,308 sales) since 2009. The increase in activity is parallel to the increase in
Source: LOJIC & RKG Associates, Inc., 2013
Map 6-4

Page | 6-14
VAP Neighborhood Revitalization Study
Section
6
condominium development in this area. However, some area developers view this as a modest change in sales based on interviews from an April 2013 article in Business First. The article suggested that developers have seen condominium sales stagnate since 2008 due to excess supply and higher price points from the boom in development of this type of unit earlier in the decade (Figure 6-2)2. Elsewhere in the county, the suburbs experienced a 91.7% increase in sales to 69 sales of duplexes and triplexes after the recession. While a nominally small number, the large proportional increase suggests that even in the suburbs, which has a primarily single family housing stock, there was a notable increase in sales activity of housing units that generally cater to a rental market (Appendix Table 6-3). Although single family homes in the three areas of Louisville-Jefferson County showed only a 50% to 68% increase in sales after the 2008 recession, sales of single family units made up the largest quantity of those sales. Single family home sales comprised 92.3% of the 2,480 sales in West Louisville, 79% of the 10,211 sales in the Downtown, East & South Urban neighborhoods, and 86.1% of the 26,710 sales in the suburban neighborhoods (Figure 6-3). The quantity of single family sales is consistent with the fact that these homes also make up the largest portion of the housing stock in the county (Appendix Tables 6-4 to 6-8). Among single family homes, most sales were for homes of 1,250 SF or less. However, the Downtown, East & South Urban neighborhoods and the suburbs experienced substantial sale volumes for moderately sized homes between 1,250 SF and 2,000 SF at rates comparable to the smaller home activity (Appendix Table 6-3).
2 Eigelbach, Kevin (2013). “Condo Owners Hope Brisker Home Sales Will Help Them, Too,” Business First. Retrieved on 6/24/2013 from http://www.bizjournals.com/louisville/print-edition/2013/04/05/condo-owners-hope-brisker-home-sales.html
3. Residential Sales Price Analysis
Sales price per square foot of single family homes varied across Louisville-Jefferson County. The average sales price per square foot for homes in the West Louisville neighborhoods was substantially lower than the rest of the county at $38/SF during the recession and $37/SF after the recession. In comparison, the Downtown, East & South Urban
Source: Jefferson County PVA & RKG Associates, Inc., 2013
Figure 6-3
0%10%20%30%40%50%60%70%80%90%
100%
West EndNeighborhoods
Downtown, East &South Urban
Neighborhoods
Jefferson CountySuburbs
SALES ACTIVITY2010-2012, Composition by Housing Type
Single Family Duplex/Triplex Condominiums/Coops
Source: Jefferson County PVA & RKG Associates, Inc., 2013
Figure 6-2
0%10%20%30%40%50%60%70%80%90%
100%
West EndNeighborhoods
Downtown, East &South Urban
Neighborhoods
Jefferson CountySuburbs
SALES ACTIVITYPercent Change, 2008-2009 vs. 2010-2012
Single Family Duplex/Triplex Condominiums/Coops
N/A

Page | 6-15
VAP Neighborhood Revitalization Study
Section
6
neighborhoods and the Jefferson County suburbs averaged $90/SF and $127/SF, respectively, during the recession and $82/SF and $125/SF, respectively, after the recession. There was not a substantial change in in the sales price per square foot for homes in Jefferson County during or after the recession, though Suburban Submarket 3 did see an $8/SF decrease in price. When compared to the assessed values of these single family homes, the proportion of sales price to assessed value for sales between 2008 and 2012 was greatest in the West Louisville neighborhoods. During the most recent recession (December 2007 – June 2009), the sales price was an average of 116% of assessed value and increased after the recession to 129% for properties in West Louisville neighborhoods. On the other hand, sales prices in the Downtown, East & South Urban neighborhoods and the suburbs were between 100% and 103% of assessed value during the recession with little change after the recession. While sales prices in the West Louisville neighborhoods were 16% to 29% higher than assessed value, the higher prices may be a product of factors other than a strong housing market. It is possible that because the assessed values of the
homes in the West Louisville neighborhoods are so low, paying more than the value of the home would only be a small increase in the nominal sales price (Figure 6-4). For example, a home valued at $30,000 might sell for $34,800, 16% above assessed value. However, this is only a $4,800 increase. Even during the recession, this amount would be considered minimal to some buyers and not a deterrent from purchasing the home, especially if real estate values were expected to rise in the future.
Investor Sales Activity 3.1.During the analysis of the latest sales in Jefferson County, the RKG Team observed that a number of parcels had multiple entries on the same date for the most recent sale. Further conversations with the Property Value Administrator suggested that these may be investor sales. In other words, a property is sold two or three times on a single day and often to an investor party. Using this assumption, between 3% and 6% of all single family home sales in each study area were investor sales during the recession. However, an anticipated increase in investor sales after the recession due to lower prices for single family homes was not conclusive from the data. Analysis did
116% 101% 103%
100%
101%129% 103%
99%
102% 104%
97%
98%
99%
100%
101%
102%
103%
104%
105%
West End Neighborhoods Downtown, East & SouthUrban Neighborhoods
Suburbs Submarket 3 Suburbs Submarket 4 Suburbs Submarket 5
SALES PRICE TO ASSESSED VALUE RATIOSingle Family Homes
2008-2009 2010-2013
Source: Jefferson County PVA, KY & RKG Associates, Inc., 2013
Figure 6-4

Page | 6-16
VAP Neighborhood Revitalization Study
Section
6
suggest that the transfer of these homes to or between entities was usually at or just below the assessed value before and after the recession. The exception was for the Suburban Submarket 5 after the recession, where investors paid 12% above the assessed value of the home (Appendix Tables 6-9 to 6-13).
Non-Arm’s Length Sales 3.2.Not all of the sales in Jefferson County are arm’s length sales. There has been an increase in the proportion and quantity of non-arm’s-length sales among single family homes since the recession. Arm’s-length sales typically occur between two unconnected entities and do not reflect a sale under duress. On the other hand, non-arm’s-length sales are those where the sale is conducted outside of the seller trying to maximize value and the buyer trying to minimize cost. To proxy these conditions, the RKG Team identified all sales where the selling price is below 50% of the assessed value. It is likely that these sales occur between family members or friends, are foreclosures, or have some other non-market based reason for the sale. Non-arm’s-length sales as a metric for distress are particularly relevant to the vacant and abandoned property problem in Louisville. The proportion of all single family home sales that are non-arm’s-length increased notably in all areas in Jefferson County after the recession except in the Downtown, East & South Urban neighborhoods and Suburban Submarket 5. In the Downtown, East & South Urban neighborhoods, the proportion of non-arm’s-length sales increased from 6% of 5,097 total sales during the recession to 11% of 8,972 total sales after the recession. Suburban Submarket 5 saw almost no proportional change, from 5% of 4,033 sales during the recession to 6% of 7,399 sales after the recession. West Louisville had consistently higher levels of non-arm’s length sales during or after the recession than any other part of Jefferson County. During the recession, 17% of 1,856 sales were non-arm’s-length in West Louisville and that proportion increased to roughly 1 in 4 sales after the recession. Suburban
Submarkets 3 and 4, which had a small proportion of non-arm’s-length sales during the recession, matched West Louisville in the high proportion of non-arm’s length sales after the recession. Suburban Submarket 3 increased in the number of non-arm’s-length sales, from 6% of 4,284 sales during the recession to 27% of 6,969 sales after the recession. Non-arm’s-length sales also increased in Suburban Submarket 4 - from 5% of 6,635 sales during the recession to 25% of 10,686 sales after the recession (Figure 6-5). The increase in non-arm’s-length sales in all of these areas reflects an increase in foreclosures and the economic hardship of homeowners after the 2008 recession.
Implications 3.3.Development in the West Louisville neighborhoods and Jefferson County suburbs has been affected by the recession and the pace of activity has slowed since 2006. However, development in the Downtown, East & South Urban neighborhoods has remained at roughly the same levels since 2001 due primarily to the influence of condominium development activity that began before the economic downturn.
Figure 6-5
Source: Jefferson County PVA, KY & RKG Associates, Inc., 2013
0%
5%
10%
15%
20%
25%
30%
2008 - 2009 Since 2010
NON ARM'S-LENGTH SALESPercentage of Sales; Comparative Periods
West End NeighborhoodsDowntown, East & South Urban NeighborhoodsSuburban Submarket 3Suburban Submarket 4Suburban Submarket 5

Page | 6-17
VAP Neighborhood Revitalization Study
Section
6
Recent sales of all residential property types have seen at least a moderate increase in sales since the recession. However, the overall number of distressed sales as measured by non-arm’s-length sales has also increased. With the highest proportion of non-arm’s-length sales since 2009 and the lowest sales price per square foot before or after the recession, the West Louisville neighborhoods have the most notable real estate market challenges in Jefferson County.
4. Demolitions
Demolition of abandoned structures is one tool that can help a local government provide a foundation for neighborhood revitalization. There have been 827 Metro-initiated demolitions since 2004. Given the age, structural composition and level of property abandonment, it is logical that the West Louisville neighborhoods have had the greatest number of candidates. Between 2004 and 2013, 71% of demolitions occurred in West Louisville (Appendix Table 6-15). How demolition impacts the return on investment of Metro Government related to actions associated with
neighborhood revitalization is discussed in Section 7. Additionally, what role demolition plays to address the vacant and abandoned property problem is addressed further in Section 2.
5. Multi-Family Rental Analysis
The primary source used to analyze the multi-family market in Jefferson County was the real estate reporting firm, REIS. REIS divides Jefferson County into six submarkets. In most cases, the RKG Team grouped these submarkets to best represent the three major areas of focus for this report. As seen in Map 6-5, the West Central submarket includes all of the West Louisville neighborhoods and most of downtown Louisville. The East Central submarket covers most of the remainder of the Downtown, East & South Urban neighborhoods. The Jefferson County suburbs are made up of the remaining four submarkets: Chenoweth/Taylorsville, South Central, Southwest Jefferson County and North East Jefferson County. All areas of Jefferson County are considered part of the Louisville Metro area submarkets by REIS except the Prospect, Kentucky area. Therefore, it is not included in this analysis.
Map 6-5
Source: REIS, LOJIC & RKG Associates, Inc., 2013
Page | 6-18
VAP Neighborhood Revitalization Study
Section
6
Recently, the Indianapolis-Cincinnati Multi-Housing Group of CBRE reported that rents and occupancy rates have increased over the last several years in the Louisville Metropolitan Statistical Area. This is generally consistent with vacancy rates and changes in average asking rents provided by REIS for Jefferson County, though there are some exceptions. The generally steady increase in asking rents and decrease in apartment vacancy reflects an overall stable and growing multi-family market in the Louisville Metro area3.
Current Inventory 5.1.As of 2012, 81.8% of the 39,454 apartment units inventoried by REIS were located in one of the four submarkets within the Jefferson County suburbs. The remainder was divided almost equally between the West Central (8.6%) and the East Central submarkets (9.6%). These more urban areas of Jefferson County have a combined 7,179 apartment units (Appendix Table 6-16). The current, positive outlook on growth of the multi-family market is consistent with the increase in multi-family inventory since 2000 in all but the East Central submarket of Jefferson County. Between 2000 and 2012, the inventory of apartments increased by 3,330 units in the Jefferson County suburbs and 333 units in the West Central submarket. However, in the East Central submarket, there was a loss of 177 units during the same period of time, potentially due to the conversion of units from rental to ownership. This decrease in units in the East Central submarket began in 2005 and coincides with an increase in condominium development in downtown Louisville and a preference for more urban-style rental units. Both of these inventory influences might be reflected in West Central instead, given the boundaries of the submarket (Appendix Table 6-16).
Vacancy and Occupancy 5.2.The overall low rates of vacancy in Jefferson County are an asset to the area and have encouraged recent 3 CBRE Group, Inc. (2012). The Louisville Market Pulse. Cincinnati, Ohio. Retrieved June 18, 2013, from http://www.cbre.us/o/cincinnati/ AssetLibrary/First%20Half%202013_Louisville_Newsletter.pdf
growth and investment in the multi-family sector. In 2012, the vacancy rate, or amount of available rental inventory at the end of the year as defined by REIS, was lowest in the Jefferson County suburbs, at 3.8%. Rates for the same area in 2000 were 5.4%, representing an overall decrease in vacancy between 2000 and 2012. On the other hand, levels of vacancy in the East Central submarket were similar between 2000 (6.3%) and 2012 (6.4%). The most noteworthy change in vacancy rates is in the West Central submarket. In 2000, the vacancy rate was 5.2%. In 2012, it increased to 10.6% (Appendix Table 6-16). The increase in vacancy rates in the West Central submarket is not consistent with overall lower rates of vacancy in Jefferson County (Appendix Table 6-16). When compared to the national rate of 5% apartment vacancy at the end of in 2012, the Jefferson County suburban rates were 1.2% below the national average, while those in the East Central submarket was 1.4% above the national rate and the West Central submarket was 5.6% higher than the national rate (Figure 6-6).4
Asking Rents 5.3.In general, the average asking rents in Jefferson County have increased between 2000 and 2012. To more accurately assess average asking rent, the REIS submarkets were analyzed individually. The highest asking rents in 2012 were in the suburban Northeast Jefferson County submarket. On average, one bedroom asking rents were $702 per month, two bedroom asking rents were $871 per month and three bedroom asking rents were $1,151 per month. The urban submarkets had the highest one bedroom asking rents after the Northeast Jefferson County submarket at $646 per month for West Central and $669 per month for East Central. The lowest asking rents in 2012 were in Southwest Jefferson County, where a one bedroom unit rented for $517, a two bedroom
4 CBRE Group, Inc. (2013). “U.S. Commercial Real Estate Continues Recovery in Fourth Quarter of 2012, According to CBRE Group, Inc.” Retrieved June 18, 2013 from http://www.cbre.com/ EN/aboutus/MediaCentre/2013/Pages/4Q2012-Commerical-Real-Estate-Recovery.aspx

Page | 6-19
VAP Neighborhood Revitalization Study
Section
6
unit for $576 and a three bedroom unit for $774 (Table 6-3).
Implications 5.4.The generally low vacancy rates and increasing rents in recent years in Jefferson County are creating a multi-family market that is gaining interest from investors at the regional and national level5. A strong apartment market also reflects an increase in demand. Local developers have noticed that a number of renters interested in their units are young professionals in their 20s and 30s, many of whom either work downtown or in the healthcare industry6. Another increasing source of prospective renters is from households that might prefer homeownership, but choose to rent because of their inability to qualify for a mortgage or concern about the stability of investing in real estate in the current market7. Balancing the demand of a mix of socioeconomic groups is a reality of the existing market. Both young professionals and households seeking affordable living situations are looking for multi-family units. If rents continue to increase and stabilize at levels above an amount that is affordable, creating opportunities for renters of a diverse range of socioeconomic standing may grow in importance.
5Eigelbach, Kevin. (February 11, 2013) “Regional Banks Seek Entry Into Louisville Apartment Market,” Business First. Retrieved March 22, 2013 from http://www.bizjournals.com/louisville/news/2013/02/11/regional-banks-seek-entry-into.html 6Eigelbach, Kevin. (January, 22, 2013) “RiverPark Place Apartments Nearly Finished and Leased,” Business First. Retrieved on March 22, 2013 from http://www.bizjournals.com/louisville/news/2013/01/22/riverpark-place-apartments-nearly.html?page=2 7Eigelbach, Kevin. (October 30, 2012) “CBRE Report Shows Spike in Louisville Apartment Rents,” Business First. Retrieved on March 22, 2013 from http://www.bizjournals.com/louisville/news/2012/10/30/cbre-report-shows-spike-in-louisville.html?page=all
Source: Jefferson County PVA & RKG Associates, Inc., 2013
0.0%
2.0%
4.0%
6.0%
8.0%
10.0%
12.0%
West Central East Central Jefferson CountySuburbs
MULTI-FAMILY VACANCY RATE2012; Jefferson County Submarkets
Jefferson County Average U.S. Average
Figure 6-6
Table 6-3
Comparative Rent AnalysisJefferson County Submarkets, 2012
Asking RentOne-
BedroomTwo-
BedroomThree-
BedroomWest Central $646 $663 $944East Central $669 $794 $866Jefferson County SuburbsSouth Central $525 $626 $786Chenoweth Taylorsville $632 $742 $871NE Jefferson County $702 $871 $1,151SW Jefferson County $517 $576 $774Source: REIS, Inc. and RKG Associates, Inc., 2013

Page | 6-20
VAP Neighborhood Revitalization Study
Section
6
C. PUBLIC INVESTMENT STRATEGY AND TARGETING AREAS FOR REVITALIZATION
1. Introduction
The marketability analysis helps to define areas where targeted policy and legislative action can take place to improve housing conditions in Jefferson County. It can be used in combination with other analyses to identify areas where vacancy and abandonment limit the potential of neighborhoods in Louisville. Focusing on the West Louisville neighborhoods as an example, there are two primary approaches to reinvestment when applying the marketability analysis. First, policy and programmatic initiatives can focus on transitional areas, or those areas that are threatened to become less stable. These are areas where the marketability is neutral (0), slightly negative or slightly positive. These neighborhoods are positioned to become stronger residential areas with the right targeted investments or could slide further into decline without action. Examples of West Louisville areas that appear to be in transition include the eastern parts of Shawnee, Chickasaw, Russell, the northern part of Hallmark and the northern sections of Park DuValle. A second approach to reinvestment addresses the areas with the greatest concentration of negative marketability scores. These areas are generally seen as undesirable by investors, developers and homebuyers. They represent an opportunity to create the greatest change to a “high need” area. Neighborhoods like Portland, Parkland, Park Hill and California are examples where blight conditions, crime and other factors have created many investment obstacles and will make revitalization more costly and higher risk. Similar approaches to the ones above could also be applied to the Downtown, East & South Urban neighborhoods and Jefferson County as a whole. Understanding which areas are most marketable to
investors and future homebuyers is an important element to determining where to target reinvestment efforts. The strongest strategy for addressing these issues involves a combination of analyses and a broad understanding of the existing environment.
2. Targeting Areas of Marketability
Using the marketability analysis results, the RKG team evaluated residential parcels throughout Jefferson County to identify potential Priority Project Areas (PPA). PPAs are those areas best suited to support future revitalization investments. The RKG Team strongly recommends that Metro Government focus its comprehensive revitalization efforts in areas characterized as transitional in their condition and marketability. This does not mean that public investments should not be made in “high need” neighborhoods, but rather PPAs should be designated based on their readiness for investment. In other words, the public investment should result in tangible improvements that spin-off other improvements and attract private and nonprofit investment. Transitional neighborhood areas typically possess characteristics that are more conducive to revitalization and are attractive to urban developers. The results of the marketability analysis demonstrated that there are a large number of transition parcels, or those with a marketability score between -29.9 to 29.9 in the Louisville Metro area, especially in the western part of Jefferson County. The analysis described below is a first step to narrowing down which transitional neighborhood areas are worthy of consideration as future PPAs. This initial evaluation is the application of a statistical analysis that is based upon a number of factors believed to affect the investment decisions of developers/investors, homebuyers and renters. The 14 areas identified through this analysis are a starting point for narrowing and focusing on what additional elements (i.e., funding, policy and legislation, etc.) should be taken into account in order to identify the PPAs.

Page | 6-21
VAP Neighborhood Revitalization Study
Section
6
In addition to the quantitative analysis conducted by the RKG Team, the Department of Community Services and Revitalization (CSR) has identified seven areas as potential locations for consideration, based on existing/recent revitalization activity. These seven areas are listed at the end of this section.
3. Methodology
3.1 Analysis Elements
Positive Transitional Areas In order to identify which areas were most applicable to potential PPAs, positive and negative zones were established using factors included in the Marketability analysis. To identify positive zones, an area of influence, or buffer, was created using GIS around a variety of points of interest. School parcels, parks, retail and commercial locations were all assigned varying distances within which they might be considered an asset to surrounding parcels. Each of these criteria was chosen based on what a potential home buyer or renter would find most desirable. The areas where all of these positive factors overlapped became the positive zone and are represented in Map 6-6 in orange.
Negative Transitional Areas Not all housing units are located in the most desirable areas to a potential homebuyer or renter. To represent the negative factors that can discourage these parties from investing, an area of influence was placed around major highways and interstates. Highways were chosen because they are commonly recognized as a less desirable factor. This negative zone is represented in Map 6-6 in blue.
Transition Marketability Scores As discussed in the marketability analysis, the lighter red, green and yellow parcels are those parcels with a combined score that is minimally negative, minimally positive, or neutral. Scores for these parcels range from -29.9 to 29.9. These are considered transition parcels. A modest level of investment can help to increase the positive attributes of these parcels while prolonged disinvestment might tip the balance of the
scores into the negative. These parcels are the focus of identifying potential PPAs. To increase their visibility on the map for this analysis, the colors of these parcels was darkened. Therefore, parcels with a score of -0.5 to -29.9 are bright red, parcels scoring 0 are yellow and parcels that scored 0.5 to 29.9 are bright green, as seen in Map 6-6.
3.2 Process After establishing the positive zone, negative zone and points of interest, the consultants began to identify potential PPAs. First, parcels that fall into the positive zone, but outside the negative zone, were given priority and became the focus of the analysis. Then, areas with concentrations of green or yellow parcels (positive) and red parcels (negative) were identified. Next, a comparison of these concentrations and their proximity to points of interest was made. Areas with high concentrations of green and yellow parcels that were also close to a school or park, and possibly a library or retail location, became Green Transition Areas. Concentrations of red parcels that were also close to a school or park, and often a library or retail location, were determined to be Red Transitional Areas. After determining the Green and Red Transition Areas, each area was evaluated based on its proximity to public transportation. Proximity was based on a quarter mile radius around each stop, which represents a generally accepted distance an individual is willing to walk to use public transportation, especially a bus. Finally, City Actionable Parcels and Vacant Lots were identified in each potential PPA. This provided the consultants with a perspective on what level of action was possible by Metro Government based on its current presence or potential future presence in these areas. The concentration of these parcels is further discussed in the Implications section.

Page | 6-22
VAP Neighborhood Revitalization Study
Section
6
!!
!!
!
!
!
!
!
!!
!!
!
!
!
!
!
!
!! !
!
!
!
!
!
!
!
!
!!
!
!
!!
!
!
!
!
!
!
!
!
!
!
!
!!
!
!
!
!!
!
!
!
!!
!
!
!!
!!
!!
!!
!!
!
!!
!
!!
!!
!!
!
!
!
!
!!
!
!
!
!
!!!
!!
!
!!!
!!
!
!!
!!!!!
!!
!!
!!!
!!!
!
!
!!!!!!
!
!!
!
!!
!!
!!
!!
!!!
!!
!!!
!
!!!
!
!
!
!!
!!
!
!
!
!
!
!
!
!
!!
!!
!!
!
!
!!
!!
!!
!!
!!
!!
!!
!!
!
!
!
!
!
!
!
!
!
!
!!
!!
!
!
!
!! ! !
! !
!
!
!
! !!
!!
!
!
!
!
!
!
!
!
!
!
!
!!
!!
!
!
!!
!
!
!
!
!
!
!
!! !
!
!
!!
!!
!
!!
!
!
! ! !
!
!
!
!
!!
!!
!!!!
!!
!
!!!
!
!
!!
!
!!
!!
!
!
!
!
!
!
!
!!
!
!
!
!
!
!!
!!
!
!
!
!
!
!
!
!
!
!!
!
!!!!!!!!
!!!!!
!!
!!
!!
!
!
!
!
!
!
!
!! !
!!
!
!!
!
!
!! !
!
!!
!
!
!
!!
!!
!!
! ! ! ! !
! ! ! ! ! ! !
!!
!!
!
!
!!
!!
!!
!!
!
!!
!
!!!
!!
!!
!
!!
!!!
!
!!
!
!!
!!
!
!
!
!
!
!
!!!
!!
!
!
!
!
!
!
!
!
!!
!!
!!
!!
!!
!!
!!
!!
!!
!!
!!
!
!
!
!
!!
!!
!!
!!
!!
!!
!!
!
!
!!
!
!!
!
!
!
!
!
!
!
! !!
!!
!! ! ! ! ! ! ! ! ! ! ! ! ! ! ! ! ! ! !
!!
!!
!!
!
!!
!!
!
!
!
!
!
!
!!
!
!
!
!
!!!
!
!!
!
!
!!
!
!
!!
!!!!!
!!!
!
!!!
!!!
!
!
!
!
!!!
!
!
!
!!
!!
!!
!!
!
!
!
!
!
! !
!
!
!
!
!
!
!
!! !
! ! !
!
!
!
!
!
!
!
! !
!! !
!
!
!
!!
!
!!
!!
!
!!
!!
!!
!!!!!!!!!!!!!!!!!!!!
!!
!!
!
!!
!
!!
!
!
!
!
!!
!
! ! ! !!
!!
!!
!!
! ! !
!!
!!
!!
!!
!
!!
!!
!!
!!
!!
!
!!!!!!!!!!!!!!!!!!!!!
!!
!
!!
! ! !
!!
!
!!
!
!
! ! ! !
!!
!
!
!
!
!!
!!
!
! ! !! !
! !
!!
!!
!!
!!
!!!!!!!
!!!
!!
!!
4 5
8
2
14
6
11
1
7
12
9 10
3
13
§̈¦64
§̈¦264
§̈¦265
§̈¦71
§̈¦65
§̈¦265
§̈¦71
§̈¦264
§̈¦65
¬«22
¬«841
¬«61
¬«1931
¬«329
¬«841
¬«841
¬«61
£¤31W
£¤60
£¤31E
£¤42
£¤150
£¤31E£¤150
£¤31W
£¤31W
£¤60
£¤60 £¤31E
£¤31W
£¤60
PotentialPriority Project Areas
.
LEGEND
0 1 2 3 40.5Miles
Source: LOJIC, U.S. Census Bureau, Jefferson County PVA, Louisville/Jefferson County Consolidated Government, Louisville Metropolitan Housing Authority & RKG Associates, Inc.
Red Transitional Areas
Green Transitional Areas
!
! !
!
!!! West End Neighborhoods
!
! !
!
!!! Downtown, South & East Neighborhoods
!
! ! !
!!! Jefferson Suburbs
Positive Zone
Negative Zone
Limited Access
Highway
Ohio River
INDIANA
OHIO RIVER
Louisville/Jefferson County, KY2013
Map 6-6

Page | 6-23
VAP Neighborhood Revitalization Study
Section
6
3.3 Data Sources This analysis used a variety of data sources. Most data came from data produced for LOJIC, including library locations, school parcels and park parcels. The sources used as the basis for the marketability scores are outlined in the marketability analysis portion of Section 6. Retail and commercial locations were assembled the U.S. Census Bureau and spatial references provided by Esri. Bus stops and bus line information came from TARC.
4. Potential Revitalization Areas
A detailed map of each of the Potential Priority Project Areas can be found in the Appendix as Maps 6-1 to 6-14.
4.1 Positive (Green) Transition Areas Two types of potential PPAs were established for this analysis. Green Transition Areas are those that had concentrations of green and yellow parcels representing slightly positive and neutral marketability scores.
Area 1 Area 1 is located in the Shawnee neighborhood in the West Louisville study area. Its borders are Duncan Street to the north, Southwestern Parkway to the west, River Park Drive to the south and S. 36th and S. 38th Street to the east.
Area 3 Area 3 is located in the Chickasaw neighborhood in the West Louisville study area. Garland Avenue creates the northern border and Virginia Avenue, the southern border. The eastern edge of the study area staggers from S. 39th Street to S. 41st Street. On the west, the border starts at S. 45th Street and ends at S. 42nd Street.
Area 6 Making up much of the Taylor Berry neighborhood and a small part of South Louisville, Area 6 is part of the Downtown, East & South Urban neighborhood study area. Its borders are generally Algonquin Parkway and Industry Road to the northeast, 7th Street Road to the northwest, Taylor Boulevard to the east,
Southgate Avenue to the south and Lawrence Drive and Faywood Way to the southwest.
Area 7 Area 7 is primarily located in the neighborhood of Schnitzelburg with a small amount also in the Germantown neighborhood. This area is in the Downtown, East & South Urban Neighborhoods study area. The borders for Area 7 are Ellison Avenue, Charles Street and Goss Avenue to the north, Eastern Parkway and Poplar Level Road to the east, Delor Avenue to the south and S. Shelby Street to the west.
Area 9 Area 9 is located in the Jefferson County Suburbs study area to the southwest of I-264 and to the west of U.S. Route 31 West. Cane Run Road creates the western border and Lencott Drive makes the southern-most border. The eastern edge of Area 7 comes out as far as Dover Road and circles north to connect back to Cane Run Road where it meets Teakwood Circle.
Area 10 Located in the Beechmont neighborhood, Area 10 is in the Jefferson County Suburbs study area. It is bordered primarily by Washland Avenue to the north, S. 3rd Street to the east, Southern Parkway to the south and Taylor Boulevard to the west.
Area 11 Area 11 is located in the Jefferson County Suburbs, to the northeast of Kentucky Route 61 and just south of U.S. Route 31 East. This area is bordered primarily by Petersburg Road to the northeast, Shepherdsville Road to the east, Fern Valley Road to the south, Hanses Drive and Lagoona Drive to the west and E. Indian Terrace to the northwest.
Area 12 Area 12 is in the Jefferson County Suburbs to the west of U.S. Route 31 West and just south of Area 9. The streets that primarily create the border of this area are Greenbelt Highway to the west, Wood Road to the south, Terry Road, Grandmeadow Lane and Triplett Drive to the east and Lower Hunters Terrace to the north.

Page | 6-24
VAP Neighborhood Revitalization Study
Section
6
Area 13 Located in the southwestern-most corner of the Jefferson County Suburbs, Area 13 is to the west of U.S. Route 31 West and north of Kentucky Route 841. Area 13 is bordered by Alanadale Drive to the north, Casa Landa Drive, Blaze Way and Oliverda Drive to the east, Greenbelt Highway to the south and Hedgeapple Way, Janna Drive and Plaudit Way to the west.
Area 14 Area 14 is in the southern-most part of the Jefferson County Suburbs. It is just south of KY Route 841 and west of I-65. The streets that create the border for Area 14 are W. Manslick Road and Fairdale Road to the northwest and northeast, National Turnpike and Mount Holly Road to the east, Allen Drive and Keys Ferry Road to the southeast and southwest and a continuation of Jefferson Hill Road to the northeast to meet W. Manslick Road to form the northwestern boundary.
4.2 Negative (Red) Transition Areas Similar to Green Transition Areas, the potential PPAs in the Red Transition Areas were selected based on the relatively higher concentration of parcels with slightly negative marketability scores. Also like the Green Transition Areas, these potential PPAs were also within the Positive Zone.
Area 2 Area 2 is located in the Russell neighborhood in the West Louisville study area. It is bordered by W. Market Street to the north, S. 24th Street and S. 25th Street to the east, W. Chestnut Street to the south and S. 30th Street to the west.
Area 4 Located in primarily in the Parkland and Park DuValle neighborhoods, Area 4 is in the West Louisville study area. This is a large area, with Howard Street making the northern-most border, S. 26th Street and S. 25th Street make up the eastern edge, Dr. William G. Weathers Drive makes up the southern border and S. 36th Street, Louis Coleman Jr. Drive, Woodland Avenue and S. 28th Street making up the curving western edge.
Area 5 Area 5 is divided between the neighborhoods of Park Hill and California in the West Louisville study area. W. Breckinridge Street is the northern edge, S. 15th Street is the eastern border, Dixie Highway is the western edge and the southern edge is just south of what would be a continuation of St. Louis Avenue.
Area 8 Area 8 is located primarily in the Wyandotte neighborhood, with a small section in the South Louisville neighborhood. It is within the Downtown, East & South Urban Neighborhood study area. Taylor Boulevard creates its western border and Queen Avenue, Wizard Avenue and Longfield Avenue its staggered northern border. S. 5th Street is the eastern edge of Area 8 and W. Whitney Avenue is the southern border.
4.3 Transition Areas and Public Transportation In general, the potential PPAs in the more urban environments in Jefferson County had the closest proximity to public transportation. Nearly all of the parcels in the five areas in West Louisville (Areas 1-5), were within a quarter mile of a bus stop. Additionally, Areas 6, 7 and 9 have the greatest number of parcels in close proximity to the TARC bus stops. Public transportation is partially available to parcels in Areas 8, 10, 11 and 12. Conversely, none of the parcels are within a quarter mile of a bus stop in Areas 13 or 14, the potential PPAs furthest from the city center.
5. Implications
When considering revitalization strategies, the Green and Red Transition Areas outlined in this section provide two approaches to identifying potential PPAs. In both cases, the transitional nature of the slightly negative or positive marketability scores suggest that smaller investments have the potential to more readily impact these areas than those with much larger negative marketability scores. Potential PPAs in the Green Transition Areas may need a helping hand to maintain what is currently positive and bolster aspects of the properties or community that may be beginning to deteriorate. Conversely, potential PPAs in the Red

Page | 6-25
VAP Neighborhood Revitalization Study
Section
6
Transition Areas are beginning to slip slightly into deterioration and might benefit from efforts that not only accentuate the positive, but also improve conditions that are contributing to the negative marketability scores. Another element to consider when reviewing the 14 potential PPAs identified in this analysis is which locations Metro Government has the capacity to have a more immediate impact. One way of evaluating this potential is through the location of city actionable parcels and vacant lots. City actionable parcels are those that are owned by the city and are ready for sale, parcels that are owned by the Landbank Authority and parcels identified as abandoned properties. Vacant lots are those parcels that are classified as residential vacant lots by the Jefferson County Property Valuation Administrator, parcels that have no building assessed value, or parcels that have a building that is 400 square feet or less. As seen in Table 6-4, Area 5 has both the largest number of city actionable parcels and vacant lots. It also has the highest concentration of these parcels.
City actionable land makes up 21% of the total parcels in Area 5 and vacant lots make up 15%. Areas 2 and 12 have the next highest portion of city actionable parcels and vacant lots at 26% and 19%, respectively. Many of the other transition areas have between 3% and 12% of area parcels that have the potential for immediate impact through Metro Government initiative. Only in Area 13, where less than 1% of parcels fall in either category, does this potential not apply. This analysis illustrates that the foundation for revitalization exists in all of these potential priority project areas. It serves to frame the discussion of where to begin identifying locations for revitalization based on the strategies outlined in this report.
Potential Priority Project Area Locations for Consideration (Existing Project Activities) The following seven neighborhood areas have been identified by the Department of Community Services & Revitalization (CSR) as potential locations for future PPAs. These areas have been identified in the past as potential revitalization target areas, but further
City Actionable Parcels & Vacant LotsRevitalization Areas, 2013
Parcels % of Total Parcels % of Total Parcels % of TotalArea 1 40 2.0% 120 5.9% 160 7.9%Area 2 64 8.0% 145 18.2% 209 26.2%Area 3 13 2.5% 33 6.3% 46 8.8%Area 4 98 4.8% 147 7.2% 245 11.9%Area 5 293 21.1% 214 15.4% 507 36.6%Area 6 15 0.6% 142 5.4% 157 6.0%Area 7 7 0.4% 92 4.7% 99 5.0%Area 8 5 0.3% 98 6.7% 103 7.1%Area 9 0 0.0% 73 11.4% 73 11.4%Area 10 6 0.4% 94 6.2% 100 6.5%Area 11 18 0.7% 58 2.3% 76 3.0%Area 12 14 1.2% 205 17.4% 219 18.6%Area 13 0 0.0% 4 0.8% 4 0.8%Area 14 3 0.3% 132 12.2% 135 12.4%Source: Jefferson County PVA, LOJIC, Louisville Metro Government, RKG Associates, 2013
City Actionable Vacant Lots City Actionable & Vacant
Table 6-4

Page | 6-26
VAP Neighborhood Revitalization Study
Section
6
review together with the results of the marketability analysis should determine if these areas are “ripe” for revitalization.
1. Shawnee – CSR partnered with the Department of Economic Growth & Innovation’s (EG&I) Long Range Planning division to create a neighborhood plan for Shawnee. While the neighborhood plan was being finalized, CSR leveraged stakeholder discussions to create the five-year neighborhood Revitalization Strategic Action (NRSA) plan. The major focus will be on economic development and owner-occupied housing rehabilitation. EG&I is also implementing the West Market Street Corridor improvement plan with major infrastructure improvements set to begin.
2. Portland – Currently in the second year of a
$2 million NRSA plan that includes owner-occupied rehabilitation and economic development loans. CSR is partnering with New Directions Housing Corporation to focus on exterior code alleviation, with Habitat for Humanity conducting an outreach campaign to stimulate interest in the program. EG&I continues to develop the “Life Zone” concept in Portland by providing loans to food-processing related businesses utilizing locally produced food items. Habitat for Humanity operates its administrative headquarters, staging center and restoration operation in the Portland area. The adaptive reuse of a vacant, underutilized bread bakery received over $1 million in funds from NSP, CDBG and the General Fund as well as a historic preservation award. Habitat is currently leveraging its neighborhood presence and collaborating with a private investor seeking to raise over $20 million in private funds for live-work housing, food related business and retail development.
3. Russell – This historic neighborhood was the focus of Louisville’s most recent Urban Renewal Plan. Outcomes from that effort include adaptive reuse of a historic trolley barn to house the African-American Heritage Center and creation of the Cedar Street Development. The Cedar Street development is a market-rate housing opportunity where vacant parcels are sold for $1 in exchange for the Louisville Historical Landmarks Commission retaining final design approval for the house. The “Louisville Historic Rising” is a proposed 44-unit Low Income Housing and Historic Tax Credit (LIHTC) proposal that would rehabilitate 14 historic structures in Russell and Shawnee. One significant property Includes the Ouerbacker Mansion which was the subject of tax foreclosure and housed in the Landbank for several years. The adaptive reuse of this building will save one the region’s most endangered historic properties.
4. Richmont Terrace – A subdivision in the Cane Run Road area in the unincorporated area of southwest Louisville. NSP-1 funds were used to acquire an entire block of vacant, blighted multifamily buildings which were demolished and replaced with 9 of 38 proposed single-family parcels. The units are currently available for homeownership or lease-purchase. The remaining undeveloped parcels will be returned to Metro as it tries to incentivize other developers to assist in building out the site. CSR is working to acquire as many blighted properties as possible to further raze and redevelop. CSR is also supporting existing multifamily property owners with rehabilitation assistance. Prospective plans call for a neighborhood market analysis and redesigned streetscaping to be completed with reoccurring neighborhood consultations. This subdivision is in close proximity to an undeveloped 15 acre green space owned by Louisville Metro which could also be used for housing or public facilities.

Page | 6-27
VAP Neighborhood Revitalization Study
Section
6
5. Smoketown – Construction of the Sheppard Square housing project is serving as a catalyst for private investment with replacement housing being produced on-site and off-site. The Louisville Metro Housing Authority is working with the local school system to enhance access to playing fields and green space. The new housing units will be mixed use at multiple price points and support the health related industries located just blocks away in the Central Business District. YouthBuild Louisville was able to establish its headquarters with NSP-1 assistance. A vacant, underutilized commercial building was converted into a “green campus” featuring drainage mitigation projects supported by the Metropolitan Sewer District. Several lines of business on the site feature include a live chicken coop, raised gardens, composting and rain barrels.
6. Shelby Park – New Directions Housing
Corporation has worked in collaboration with neighborhood residents to establish and implement a Quality of Life Action Plan for both Smoketown and Shelby Park (adjacent census tracts 62 & 65). Using NSP-1 funds, New Directions was able to acquire, demolish and redevelop six parcels in a single block. They plan to continue this block-by-block approach by leveraging NSP proceeds to complete similar redevelopment within the neighborhood. CSR recently supported two anchor multifamily projects, Jackson Woods and Saint Vincent DePaul Homes. The latter included the new construction of LIHTC units to provide comprehensive housing services for homeless families and persons in recovery. Right across the street, CSR was able to reinvest in Jackson Woods to preserve the availability of affordable rental units.
7. Oakdale – This neighborhood is in close proximity to the world famous Churchill Downs historic landmark and economic engine. The neighborhood includes the 4th Street corridor which is currently the subject of a planning fellowship awarded to Mayor Fischer as part of the 2012-2013 Daniel Rose Fellowship at the Urban Land Institute. The corridor connects the airport, race track and the University of Louisville. EG&I is working to redesign traffic flows to create better access to and from railways and expressways for commercial traffic. This highly visible area is mixed commercial and residential with great market potential.

Page | 7-1
VAP Neighborhood Revitalization Study
Section
7
A. PUBLIC RETURN ON INVESTMENT
MODEL
1. Introduction
Real estate developers and other investors often use
return on investment (ROI) models to assess the risks
and return associated with a given project and its
value as an investment. This analysis tool is used to
judge one investment against a variety of competing
investment alternatives. The use of a ROI analysis in
the evaluation of public sector investments is less
common, primarily due to the fact that many benefits
derived from public sector investments cannot be
monetized easily and thus cannot be factored into a
rate of return model. However, it is a useful and
innovative technique for judging the effectiveness of
Metro Government’s efforts to combat vacant and
abandoned properties.
In the urban revitalization arena, there are many
intangible benefits accrued to the target area or to
community that are not easily measured. For example,
successful revitalization efforts often improve the
appearance and function of neighborhoods, resulting
in reduced crime; which in turn improves the climate
for private investment. As conditions improve,
neighborhood residents often get more involved in
their community and start to engage with each other
and begin fixing up their properties, which further
strengthens the community. While all these things are
known to happen in revitalizing communities, it is not
possible to quantify all of them in financial terms or
predict their ”cause and effect” relationship.
For this study, the consultants developed a public
“return on investment” model to establish a
relationship between the public expenditures
associated with neighborhood revitalization actions
and the measurable financial returns in the form of tax
revenues received by Metro Government. The results
of the model, and the implications related to the level
of intervention, are the focus of this section.
2. Methodology and Approach
2.1. Purpose and Need
The primary purpose of the return on investment model
is to illustrate the connections between public sector
investments made in neighborhood revitalization by
Metro Government and quantifiable financial returns
from those investments. The model also provides a
framework for evaluating which investments will have
the greatest return. The model is a starting point for a
broader discussion about other returns that are less
quantifiable, but equally important in neighborhood
revitalization.
2.2. Modeling Approach
To illustrate the connection between public sector
investment and possible returns, the model focused on
a range of measurable actions of Metro Government
and the costs associated with those actions. It also
focused on how certain expenditures, or investments,
can lead to returns through revenue generation. This
connection is a fundamental element of the return on
investment model.
There are three main components of the VAP ROI
model: (1) development inputs, (2) annual revenue and
expenditure assumptions, and (3) ROI analysis output.
Development inputs drive the model results and
include critical assumptions about the level of new
development activity projected over the next 20-year
period (e.g., new housing construction & rehabilitation,
building demolitions, code enforcement inspections,
judicial foreclosures, etc.). The annual revenue and
expenditure assumptions include current and future
expenditures, tax rates, cost of construction and similar
data assumptions. Finally, the ROI analysis outputs
include a comparative analysis between a “Baseline
Maintenance Scenario” and a more aggressive
“Intervention Scenario.” The baseline scenario assumes
that Metro Government continues to approach the
VAP revitalization problem in the future in much the
same way as it does today. Accordingly, the number
of foreclosures, demolitions, new code enforcement
inspections and similar activities continue at roughly
the same level over time. In the more aggressive

Page | 7-2
VAP Neighborhood Revitalization Study
Section
7 intervention scenario, the types and magnitude of
investments, or intervention, are greater and the
results achieved are more closely linked to a
quantifiable return on investment.
These projected returns include tax revenues
generated by the development of residential,
commercial and industrial properties through the
expansion of the tax base. Many of the outputs have
compounding returns as properties developed and
sold generate value and appreciate over time.
Outputs also include total expenditures related to
Metro Government actions.
The ROI model results are most meaningful when
expenditures and revenues are analyzed over a 20-
year projection period. Unlike a real estate investment
where a development will be sold after a
predetermined holding period, a revitalized
neighborhood cannot be sold to recapture the original
investment. Whatever “returns” there are will accrue
over a number of years. Given that the revitalization
effort may require up-front costs that do not directly
generate new revitalization activity (a.k.a. returns) for
several years, the model looks at aggregate
expenditures and revenues after 20 years when
analyzing return on investment.
2.3. Data Resources
A number of data resources were used to establish the
primary assumptions that were used for the model.
Revenue assumptions related to tax rates and tax
code were established using Jefferson County
Property Valuation Administrator (PVA) data,
conversations with PVA staff, local and state tax
regulations, the Kentucky Department of Revenue and
the Jefferson County Clerk’s office as resources.
Sources associated with the U.S. Census Bureau, Urban
Land Institute, Institute of Transportation Engineers and
the Commercial Buildings Energy Consumption Survey
were referred to for employment and business
information need to establish occupational license tax
assumptions.
Jefferson County PVA data was also used for
residential land acquisition data and real property
values. The Jefferson County Property Valuation
Administrator provided insight into anticipated
changes in property value over the next 20 years.
These insights helped to determine real property
appreciation projections for each of the three
subareas: West Louisville, the Downtown, East & South
Urban neighborhoods and the Jefferson County
suburbs.
Assumptions associated with infrastructure costs were
provided by industry professionals and the consultants’
own experience. Other Metro Government
expenditures associated with administrative and code
enforcement efforts related to vacant and abandoned
properties were provided by the Mayor’s Innovation
Delivery Team. The Department of Community Services
& Revitalization provided data on affordable housing
subsidies, affordable housing construction and
rehabilitation costs.
To establish estimates for commercial and industrial
land acquisition, the online commercial real estate
listing and research site Loopnet was used.
Additionally, Marshall & Swift provided data for
construction and demolition costs associated with
residential, commercial and industrial buildings.
2.4. Limitations of the ROI Analysis
While a return on investment analysis can be an
effective way to illustrate the investment and revenue
relationship for a public sector project, it does have
limitations. First, the model is limited by the number of
inputs that could be quantified and tied directly to the
public action or revitalization investment. Not all
revitalization results can be monetized, nor can all
revenues be quantified or tied back to the original
public investment or action. Only those related to
neighborhood revitalization effort have been
included. Not all costs to Metro Government
associated with new development have been taken
into account. The model is an expression of an overall
return on investment and less an analysis of specific
fiscal impacts. Therefore, certain costs related to the

Page | 7-3
VAP Neighborhood Revitalization Study
Section
7 municipal cost of services, such as changes in education
costs or public safety calls (i.e., police, fire & EMT) are
not included.
Second, the model is based on a set of assumptions.
These assumptions are tailored to each of the three
geographic focus areas in this study: (1) West
Louisville Neighborhoods, (2) Downtown, East & South
Urban Neighborhoods and (3) Jefferson County
Suburbs (Map 7-1). However, these assumptions do
not address all of the nuances that can exist within a
smaller project area. The objective of the model is to
give a more general sense of what actions might
produce the most return and how they differ by
location. It is not a site specific or project-based
analysis tool.
Third, the model is focused on the direct results of
public sector actions. Therefore, it does not directly
address future returns generated by unrelated private
or non-profit sector investments. Any actions taken by
Metro Government would be designed to stimulate
revitalization in the general area of the original public
investment. However, only those developments that
are directly linked to the public investment are
captured in the ROI model results. Additional spin-off
development would add to Metro Government’s
investment return and would be expected to occur at
a rate of three to five times the original public
investment. Such private leverage ratios are typical of
many public sector revitalization projects and are
often required as targets for HUD-funded projects
across the country.
Map 7-1
Source: RKG Associates, Inc., 2013

Page | 7-4
VAP Neighborhood Revitalization Study
Section
7 B. PUBLIC INTERVENTION METHODS
AND METRICS
1. Code Enforcement Inspections,
Maintenance & Judicial Measures
Louisville Metro Government is currently conducting a
variety of code enforcement inspections, maintenance
and judicial measures as a regular and necessary part
of addressing issues associated with vacant,
abandoned and deteriorating property. Many of
these efforts are essential activities that have
associated costs which are part of the existing budget
of the consolidated government. They are also an
important part of any neighborhood revitalization
strategy.
Not all of the expenses related to code enforcement
inspections, maintenance and judicial foreclosures have
returns that are quantifiable and thus could not be
included in the return on investment model. Many of
the benefits associated with these actions are related
to reducing the presence of blighting influences and
slowing the pace of neighborhood decline.
1.1. Code Enforcement and Inspections
Code enforcement and property inspections are one
way of identifying vacant and abandoned properties
and tracking areas where blighting influences may
exist. Code enforcement and inspections are ongoing
activities of Metro Government and are incorporated
into the return on investment model as elements of
existing and future intervention strategies.
As seen in Table 7-1, more than 24,000 code
enforcement actions currently occur at vacant and
abandoned properties annually at a cost of
approximately $34 per inspection. On average, 2.9
inspections per property are conducted each year,
indicating that ~8,500 different vacant properties are
currently being monitored by code enforcement
inspectors. The estimated annual cost of these
inspections to Metro Government is roughly $630,000.
1.2. Cutting & Cleaning
Once a vacant property has been identified through
code enforcement and inspection, if the owner does
not take corrective action, the maintenance is often
taken over by Metro Government. Cutting grass and
weeds and cleaning illegal dumping are part of an
on-going maintenance program meant to decrease the
blighting influences of property abandonment and
Table 7-1
Louisville/Jefferson County Metro Government
Service Metrics and Costs Associated with Vacant & Abandoned Properties
Activity
Avg. Cost Per
Instance
(Baseline) Avg.
instances per
property per
year
Avg. annual
cost per
property/year
(Intervention)
Avg. instances
per property
per year
Avg. annual
cost per
property/year
Current #
of units per
year
Inspection $34.00 2.9 $98.60 4.35 $147.90 24,723*
Boarding $74.58 1.59 $118.88 1.0 $270.00 650
Cutting & Cleaning (Inc.Trash
Collection)
$443.86 1.2 $536.00 2.4 $1,065.26 2,416
Demolition $7263
(median)
1 $7,263.00 1 $7,263.00 100
Foreclosure $ 4,000 1 n/a n/a 100
Source: IDT and Louisville/Jefferson County Metro Government
*# of 2012 inspections on a property that was designated vacant residential or vacant lot (RV, RL, CV, or CL).

Page | 7-5
VAP Neighborhood Revitalization Study
Section
7 preserve public health and safety.
Metro Government currently provides cutting and
cleaning services for 2,416 properties per year at an
average cost of $444 per instance. On average, 1.2
cutting and cleaning events occur on each property
annually resulting in a cost of $536 per year. In 2012,
the costs associated with cutting and cleaning was
approximately $1.32 million. In addition to these
ongoing efforts, additional cutting and cleaning will
be necessary as Metro Government acquires
additional distressed properties as part of an
intervention strategy (Table 7-1).
1.3. Boarding
Similar to property maintenance, the boarding of
vacant and abandoned buildings helps stabilize
conditions and reduce the incidence of crime and
people living in abandoned structures. Annually, Metro
Government boards 650 new units that have come
online, and 1764 units in total. The cost associated
with each boarding is $75. In 2012, Louisville Metro
Government spent approximately $136,000 on
boarding units (Table 7-1).
1.4. Demolition
Demolition is used by Metro Government to remove
abandoned buildings after the legal owner has
refused to take remediative action. These structures
are typically beyond reasonable structural repair and
pose a threat to community health and safety.
Currently, Metro Government demolishes
approximately 100 residential units per year at a
median cost of $7,263 per unit. In fiscal year 2013
the total cost of demolitions was approximately
$815,000. A more aggressive intervention strategy in
the future might incorporate the demolition of
commercial and industrial buildings, which have
blighting influences as well. Based on cost information
provided by Marshall & Swift, RKG Associates
estimates that commercial demolition could cost
approximately $4.50 to $5.00 per square foot and
industrial could cost $3.50 to $4.00 per square foot,
not including environmental remediation (e.g., asbestos
removal) (Table 7-1).
1.5. Judicial Foreclosures
Metro Government initiates legal action against a
number of property owners through the judicial
foreclosure process when there are code enforcement
liens on a property. Properties that are foreclosed
upon through this process are then sold through auction
by the Jefferson County Master Commissioner’s Office.
Timely completion of this process can increase the
speed with which these properties return to private use
and become available to developers and investors.
Metro Government initiates foreclosure on
approximately 100 properties annually. Each
foreclosure costs an average of $4,000 to cover fees,
research, legal staff time and overhead expenses. This
level of activity results in annual estimated cost of
$400,000 in foreclosure proceedings (Table 7-1).
2. Pre-Development Activities
While many of the code enforcement inspections,
maintenance and judicial measures are already part
of Metro Government’s current revitalization efforts,
pre-development activities relating to land acquisition,
infrastructure investments and public subsidies are key
elements of a partnership-based intervention strategy.
Public expenditures in these areas have the most
direct impact on generating quantifiable revenues and
returns to Metro Government.
2.1. Land and Building Acquisition
The purchase of land and buildings through a
governmental entity, such as the Landbank Authority, is
one activity reflected in the ROI model. Acquiring
properties gives Metro Government site control and
allows it to assemble land for resale to private
individuals or development entities to facilitate
redevelopment. Land assemblage for redevelopment
is a traditional public sector function and is very
difficult for private or nonprofit development
companies to accomplish efficiently. The cost, time
commitment and complexity associated with land
assemblage create a disincentive and often stall
redevelopment.

Page | 7-6
VAP Neighborhood Revitalization Study
Section
7 RKG Associates calculated the average of recent and
comparable sales of land and buildings in the West
Louisville neighborhoods, Downtown, East & South
Urban neighborhoods and the Jefferson County
suburbs. To account for variation in real property
values and to reflect the fact that many of the
properties acquired will be distressed, a location
factor was applied to land and building acquisition
pricing to reduce them below current market value.
For example, in the West Louisville neighborhoods, it is
estimated that residential lots will be acquired at 66%
of their average sales price on a per lot basis. This
percentage increases to 75% in the Downtown, East &
South Urban neighborhoods and 85% in the Jefferson
County suburbs, where property values and market
conditions are stronger than West Louisville.
2.2. Infrastructure Investments
Infrastructure investments such as sidewalk and street
construction and water and sewer line replacement
are typical in neighborhood revitalization efforts.
Street and sidewalk improvements may be required to
enhance the physical appearance of a redevelopment
area and should be offered in support of private
redevelopment efforts. Streetscape improvements are
not a solution in and of themselves, but can enhance
redevelopment efforts by improving the public realm
and are often tied to key traffic or intersection
improvements.
Investing in infrastructure can also encourage
development by reducing the cost of these
improvements to a private developer. It is estimated
that neighborhood sidewalk improvements will cost
$30 per linear foot, with street reconstruction costing
up to $400/LF and water and sewer line replacement
at $40/LF. The ROI Model also accounts for new
publically financed parking facilities, which might be
necessary to support a larger private mixed-use
development project. The cost for structured and
underground parking can range from $18,000 to
$35,000 per space, depending on location and site
conditions. Given the high cost, it is recommended that
such investments be reserved for projects that achieve
a tangible public benefit and may be part of a larger
catalyst development. Such projects typically occur at
a larger scale and may require parking structures that
can be jointly used by public and private users.
2.3. Catalyst Redevelopment
Catalyst redevelopments are often used to anchor a
target area with a larger project that meets a number
of different revitalization objectives. Such projects
often include employment generation as a central
activity, supported by new housing development,
shopping and dining opportunities and additional
service businesses. Catalyst projects can also include
community facilities like libraries, parks, recreation
and community centers, hotel/conference facilities or
new government office buildings.
The City’s current HOPE VI project in the Sheppard
Square area is an example of a residential catalyst
project that is transforming Smoketown with a $22
million grant from HUD. The project is modeled on
LMHA's two award winning HOPE VI sites – Villages of
Park DuValle in West Louisville and Liberty Green in
downtown Louisville. This HOPE VI grant will provide
more than 450 new homes for local families, as well
as quality job and learning opportunities for
Sheppard Square households. To accomplish this
ambitious Revitalization Plan, HOPE VI funds will be
leveraged with more than $90 million in physical
development commitments and $4.2 million in
community and supportive services.1
2.4. Municipal Bond Debt
In order to implement a more aggressive revitalization
program, Metro Government will need to commit more
funding for critical investments in new and
rehabilitated housing, infrastructure, development
subsidies, demolition and a wide variety of
administrative, code enforcement inspections and
foreclosure activities. Currently, much of Louisville’s
community development and revitalization activities
are funded through various federal programs (i.e.,
CDBG, HOME, HOPE VI, etc.), tax increment financing
districts and other programmatic sources. These
1 Louisville Metro Housing Authority website: http://www.lmha1.org/hopevi/sheppard_square_hopevi.htm

Page | 7-7
VAP Neighborhood Revitalization Study
Section
7 sources are not currently large enough to support a
more ambitious revitalization program, which could
cost hundreds of millions of public dollars with the
intent of leveraging 1 to 5 times that amount in
private and nonprofit investments, depending on the
activity. In order to successfully revitalize the urban
neighborhoods, Metro Government must be able to
attract private investment on a level many times
greater than the public investment.
Metro Government’s ability to finance some, if not all
of its capital investments through its municipal bonding
capacity will greatly improve its revitalization results.
Financing such investments on a “pay as you go” basis
is not realistic and greatly limits Metro’s ability to
change the dynamics in some of its most challenged
neighborhoods. For example, a $1 million investment
could be used annually to subsidize the construction of
200 new homes over the first 10-year period, or it
could be used to make payments on a $13.2 million
bond issuance in Year 1. While borrowed money will
cost more to use, the impacts are many times greater
and more immediate than an annual appropriation. In
addition, the ability to increase public investment will
help to attract larger sums of private and nonprofit
money, which may not have been attracted by the
smaller investment.
C. MEASURING PUBLIC RETURN ON
INVESTMENT
1. Tax Base and Revenue Sources
The return on investment for a public sector project can
be measured by the expansion of the tax base and
changes in municipal tax revenue over time. Of the
revenues used to fund Metro Government, those from
real and personal property taxes and occupational
license taxes are the most substantial. In fiscal year
2010–2011, 87.9% of general fund revenues and
81.1% of all revenues came from property taxes and
Revenue Commission payments. Revenue Commission
payments represent the largest portion of revenues –
60% of the General Fund and 55% of all revenues2.
Revenue Commission payments include revenues
primarily generated by Occupational License Taxes.
Property tax revenues come primarily from real and
personal property taxes. Therefore, these taxes were
the measurements used to assess revenues for the
return on investment model.
The consultant acknowledges that not all sources of
revenue are accounted for within the taxes mentioned
above. Roughly 10% to 20% of revenues are
generated from other sources such as licenses and
permits, intergovernmental revenue and municipal aid.
Given that these sources of revenue make up a smaller
portion of the total revenue for Louisville Metro
Government, and could not be directly linked to
proposed revitalization investments, they were not
included in the return on investment model. In addition,
sales taxes were also excluded from the model
because they are collected by the Commonwealth of
Kentucky and then redistributed to local jurisdictions in
the form of intergovernmental transfer payments.
1.1. Real Property Taxes3
The real property tax base changes in value with local
market and economic fluctuations. Revenues derived
from real estate can fluctuate as the tax base
expands during healthy economic periods and
declines during economic recessions. Prior to 2008,
real property values had experienced steady
appreciation for over a decade. Figure 7-1 shows that
between 2008 and 2010, local real estate values
started to decline in certain areas of Jefferson County.
These conditions have started to improve and real
estate sales activity and pricing are increasing.
According to the Jefferson County PVA, 8,981 home
sales were recorded in 2012, up from 7,612 sales in
2011, but still 14.9% below pre-recession levels of
10,560 recorded in 2007.
2 Louisville Metro Government (2012) Revenue Estimates and Receipts Table: 2012 – 2013 Approved Budget. Retrieved May 6, 2013 from http://www.louisvilleky.gov/ yourtaxdollarsatwork/2012-13_budget.htm 3 In accordance with HB 44, property tax revenue cannot grow in the aggregate by more than 4% each year without a Metro Council vote (does not include new construction). To the extent that property tax revenue would grow as a result of the city’s revitalization activities, such growth would be limited to 4% in the aggregate (not including property tax revenue from new construction)”

Page | 7-8
VAP Neighborhood Revitalization Study
Section
7
However, some areas such as the West Louisville
neighborhoods have lost value. In early 2013, the
Jefferson County PVA announced that property
assessments in many West Louisville neighborhoods
would be reduced by a low of -4.6% in Shawnee to a
high of -17.9% in California based on recent
comparable sales activity.4 West Louisville has been
severely affected by hundreds of foreclosures and
high property vacancy and abandonment, which is
now being reflected in below market value sales
activity.
In the future, land and buildings acquired by Metro
Government through the Landbank Authority will be
removed from the tax rolls until they can be returned
to private use through resale and redevelopment.
However, development associated with the
repurposing of acquired properties will enhance
revenues by expanding the real property tax base.
Over time, the value of these properties will
4 Jefferson County PVA, 2013
appreciate as market conditions improve. Any new
construction or rehabilitation efforts, especially those
partially funded by affordable housing subsidies, will
not result in property value increases equal to the
amount of the subsidies or the cost of new construction
or rehabilitation. Depending on location and market
conditions, actual assessed values will vary. According
to the Department of Community Services &
Revitalization, only 54% of the cost associated with
constructing a new home in the West Louisville
neighborhoods will be reflected in the new appraised
and assessed value after construction. This indicates
that roughly 46% of the upfront investment is not
captured and cannot be taxed at full value, which is
largely due to poor market conditions and the lack of
comparable sales transactions to support the home’s
actual value. This problem is particularly acute in
distressed areas and makes it difficult to attract
private investors and developers without deep public
subsidies. If a newly constructed home cannot appraise
for a value equal to or greater than its actual cost,
Figure 7-1
Source: 2011 State of the Real Estate, Jefferson County PVA

Page | 7-9
VAP Neighborhood Revitalization Study
Section
7 developers will lose money on each home sold and
buyers will not be able to obtain suitable mortgage
financing to purchase the home.
Similarly, housing rehabilitation subsidies of
approximately $65,000 typically return only $28,600
or 44% of the actual amount invested in the form of
increased market and assessed value. As stated
previously, the percentage of recaptured value varies
in different parts of Louisville as conditions vary
(Table 7-2).
For commercial and industrial properties, similar
estimations were made about the costs associated with
new construction and rehabilitation and the actual
assessed value a development will produce. In the
West Louisville neighborhoods, the percentage of real
property value achieved through new construction
ranged from 66% to 85% of actual cost. In the
Downtown and Suburbs, RKG believes that 98% to
100% of market value could be achieved. This is
largely because the negative factors that are
depressing real estate values in West Louisville (e.g.,
poor conditions, crime, poverty, vacant & abandoned
properties, etc.) are less prevalent in these areas.
For rehabilitation, additional real property value was
estimated to be 44% to 50% of the total cost in West
Louisville and 55% and 65% in the Downtown, East &
South Urban neighborhoods and Jefferson County
suburbs. Again, the increased assessed property
value from rehabilitation investments is closer to
market value because blighting influences are not
depressing values to the same extent.
Real property tax rates also vary throughout
Jefferson County based on the location of the
property, mostly due to the presence of the Urban
Service District. The local tax rate on real property is
derived from four separate taxing districts including:
(1) Metro Louisville, (2) Fire District, (3) School District,
and (4) Urban Services District. These districts cover
the entire county and overlap. However, the Urban
Services District tax rate, which covers services such as
solid waste pickup and disposal, fire protection, street
lights, etc., is applied in the ROI to both the West
Louisville and Downtown, East & South Urban
neighborhoods. Properties in the Jefferson County
suburbs are not within the Urban Services District
boundaries and pay for the additional services
outside of their County tax rate for those services as
well as possibly paying a smaller city assessed tax.
Given that local tax revenues provide the return on
investment to Louisville Metro Government, state
imposed taxes were removed from the model. Based
on these assumptions, the 2012 real property tax
rates for the West Louisville neighborhoods and
Downtown, East & South Urban neighborhoods were
calculated at $1.2921 per $100 in taxable value and
the Jefferson County suburbs were calculated at
$0.9255 per $100 in value. This indicates that while
real estate values may be stronger in the suburban
areas, the tax rate applied to these values is lower on
average, mostly because fewer services and smaller
city taxes are included in the tax rate outside of the
Urban Service District and school district tax rates.
1.2. Personal Property Taxes
In addition to real property, most residential,
commercial and industrial properties have taxable
personal property that generates revenue through
taxation. For residential properties, this is typically a
Market Value Adjustments by Area
New Construction & Rehabilitation
Downtown, East
West End & South Urban Jefferson Co.
Neighborhoods Neighborhoods Suburbs
New Construction
Residential (Cost/Unit) 54% 75% 100%
Commercial - Multi-Family (Cost/SF) 66% 95% 100%
Commercial (Cost/SF) 75% 95% 100%
Industrial (Cost/SF) 85% 85% 100%
Rehabilitation
Residential (Value/Unit) 44% 55% 65%
Commercial - Multi-Family (Value/SF) 50% 55% 65%
Commercial (Value/SF) 50% 55% 65%
Industrial (Value/SF) 50% 55% 65%
Source: Department of Community Services & Revitalization & RKG Associates, Inc., 2013
Table 7-2

Page | 7-10
VAP Neighborhood Revitalization Study
Section
7 tax on the market value of motor vehicles, and for
commercial and industrial tax payers. Personal
property includes motor vehicles, business equipment
and supplies. When new residences and businesses
are created, the personal property tax base expands.
To estimate the value of personal property for each
new development, a proportional relationship was
established between the assessed value of all real
property and all personal property as components of
the county’s total assessed value. Based on known
values for real property, the value of personal
property for commercial and industrial development
was estimated. Similar proportional assumptions
related to real property values were used to establish
motor vehicle property value.
Similar to real property, personal property tax rates
vary not only by the location of the property, but also
between types of personal property. In the West
Louisville neighborhoods and Downtown, East & South
Urban neighborhoods, personal property is taxed at a
rate of $1.432 per $100 in value and the Jefferson
County suburbs the tax rate is $0.996 per $100 in
value. For motor vehicles, a rate of $0.751 is applied
per $100 in value for the West Louisville
neighborhoods and Downtown, East & South Urban
neighborhoods while motor vehicles associated with
residents or businesses in the Jefferson County suburbs
pay $0.815 per $100 in value in taxes.
1.3. Occupational License Taxes
Almost all businesses in Jefferson County must pay
occupational license taxes on net profits and
employee withholdings. Comprehensive neighborhood
revitalization often includes development of
residential, commercial and industrial properties.
Developing commercial and industrial buildings has
the potential to increase the tax base for occupational
license taxes by adding employees, payroll and net
profits of the company.
Estimated payroll was used to approximate employee
withholdings, which is annual compensation as
reported on employee W-2 forms. To determine the
revenue associated with net profits for each new
commercial or industrial development, a proportional
relationship was established between the revenues of
all employee withholdings and all net profits as
components of total occupational license tax revenue
for all businesses.
The total amount of employee withholdings and net
profits associated with each business added by
commercial and industrial development is converted to
revenue for Metro Government by applying a tax
rate based upon the county of residence of the
employees. Jefferson County employee wages are
taxed at a different rate than employees residing
outside the county.
According to the U.S. Census Bureau, 51.8% of
employees working in West Louisville live in Jefferson
County. Roughly 51.6% of employees working in the
Downtown, East & South Urban neighborhoods live in
Jefferson County and 48.4% of employees in the
Jefferson County suburbs live in Jefferson County.
Based on these proportions, the total employee
withholdings and net profits are taxed at $0.022 for
residents of Jefferson County and $0.0145 for non-
residents.5
1.4. Insurance Premium Taxes
Insurance premium taxes are collected from insurance
companies for all insurance holders living in Jefferson
County. When itemized as revenue by Louisville Metro
Government, they are included within Occupational
License Taxes. New residents associated with
employment opportunities through commercial and
industrial development will add to the revenues
generated from this tax.
As a part of the total revenues associated with
Occupational License Taxes, a proportional
relationship was established between the revenues of
all employee withholdings, all net profits and all
insurance premium taxes as components of total
occupational license tax revenue to determine the
5 Longitudinal Employer-Household Dynamics (LEHD) model, U.S. Bureau of Census, http://lehd.ces.census.gov/

Page | 7-11
VAP Neighborhood Revitalization Study
Section
7 portion associated with insurance premium taxes. To
this value, a $0.100 tax rate was applied in all areas
of Jefferson County.
2. Economic Development
As mentioned previously, comprehensive neighborhood
revitalization initiatives often combine new housing
with infrastructure investment, enhanced services and
economic development activities. In addition to
residential units, most projects areas will also
incorporate a mix of commercial and industrial
development. Ideally, this development will generate
employment opportunities within the project areas.
While all new jobs may not be filled by neighborhood
residents, RKG has assumed that roughly 50% will be
filled by employees living somewhere else in Jefferson
County.
3. Private Sector Leverage
The direct financial investments made by Louisville
Metro Government to revitalize its neighborhoods
should have the potential to leverage private sector
investment in the areas targeted for revitalization.
Typically, the level of private leverage will depend on
the project type and the City’s ability to attract
development partners and outside money. Typically,
leverage ratios ranging from one to three times the
public investment are achievable and larger
redevelopment projects can generate much higher
leverage ratios, perhaps greater than five times the
public investment.
The ability to attract private investment will be driven,
in part, by the project opportunity, the City’s
commitment to revitalization and the project’s location
and neighborhood conditions. As presented in the
marketability analysis (Section 6), factors such as
crime, property condition and blighting influences can
deter private investment, as well as the interest of
homebuyers, renters and developers. The ROI model
recognizes that public subsidies and other government
intervention will be required to attract investment in
the most challenging locations. This is because the most
difficult areas add potential risk and uncertainty
about the project outcome. The potential for project
delays, vandalism, the loss of construction materials,
complex land assembly, marketing challenges and
funding gaps make urban redevelopment a complex
and risky endeavor for most conventional developers.
This is why public sector participation is so critical,
because it can take positions and undertake activities
that reduce risk and uncertainty.
Public sector investment returns can be achieved as
areas start to revitalize and more developers are
attracted to project opportunities without public
subsidies or other interventions. This often takes
several years to achieve after some success has been
achieved, but the greatest public investments are
likely to occur during the early years of revitalization
as neighborhood conditions are unstable and it’s
difficult to leverage private money.

Page | 7-12
VAP Neighborhood Revitalization Study
Section
7 D. PUBLIC RETURN ON INVESTMENT
MODEL
1. Purpose and Need
The public Return on Investment Model was developed
to examine how different approaches to urban
revitalization can produce different financial returns to
a municipal government. The model compares a
Baseline Maintenance revitalization program to a more
aggressive Intervention program, which assumes a
more comprehensive revitalization approach and
larger financial commitment to more closely match the
size of the problem. The scenarios are not intended to
represent all of the total revitalization activity
occurring within a given area of the city, but rather
those activities directly involving Metro Government. It
is assumed that numerous other housing and
development partners will be carrying out projects,
independent of the City’s involvement, but that activity
is not captured in the model. The ROI model attempts
to quantify those impacts directly related to the
revitalization actions of Metro Government.
2. Locational Differences
The three study areas have some notable differences
in market conditions and real estate pricing, tax rates
and revitalization needs (Map 7-1). The ROI Model
illustrates how the same revitalization program could
produce different results in each area. The reader
should not assume that the proposed revitalization
program is appropriate in each location; instead, it is
meant to allow for an apples-to-apples comparison of
the relative ROI of taking action in different areas of
the city.
With regard to expenditures, the assumptions made in
the costs associated with land and buildings varied by
area. Generally, properties in the more urban areas
of Jefferson County are experiencing more severe
market conditions and the concentrations of distressed
properties are driving down market prices for land
and buildings, resulting in lower assessed and market
values. This is not true throughout the entire county, but
in those neighborhoods most likely to be targeted for
revitalization.
Regarding future revenue projections, local market
adjustments to the value of properties relative to the
cost of new construction or rehabilitation were more
substantial in the urban areas than in the suburbs. This
suggests that the value added to the tax base in the
urban areas is less, on average, than the value added
in the suburbs for the same dollar investment. While
this may be true, the level of need in the urban areas
is much greater than most suburban locations.
3. Baseline Maintenance Scenario
The baseline maintenance scenario assumes that
existing code enforcement inspections, administrative
and judicial measures on vacant and abandoned
properties continue for the next twenty years at levels
comparable to today. Given the desire of Metro
Government to further the goals of neighborhood
revitalization, a modest increase in the level of
activities such as code enforcement and property
maintenance was assumed to be part of this scenario.
Other activities, such as new housing construction and
rehabilitation, judicial foreclosures and demolitions
remained at existing levels. In addition, land
acquisition is part of the baseline scenario, as well as
the distribution of housing subsidies to achieve greater
affordability. This leads to a modest level of
development across the 20-year projection period of
the model.
4. Intervention Scenario
The Intervention scenario assumes a higher level of
investment in a more diverse set of program activities.
The main assumptions in the Intervention scenario are
designed to reduce the total number of vacant and
abandoned properties down to zero over a 20-year
period. While this level of intervention may not be
achievable due to its high cost, it establishes the upper
level of investment required to address the city’s VAP
problem within 20 years. This scenario also assumes
that by the end of a three year ramp-up period,
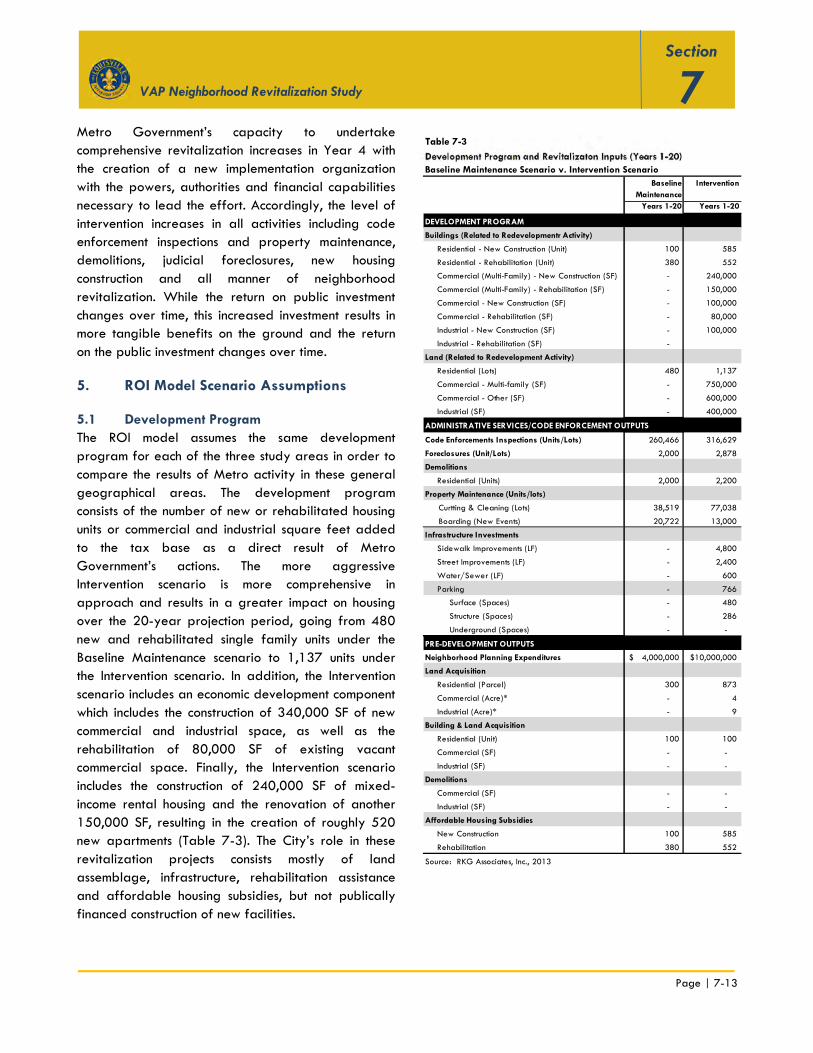
Page | 7-13
VAP Neighborhood Revitalization Study
Section
7 Metro Government’s capacity to undertake
comprehensive revitalization increases in Year 4 with
the creation of a new implementation organization
with the powers, authorities and financial capabilities
necessary to lead the effort. Accordingly, the level of
intervention increases in all activities including code
enforcement inspections and property maintenance,
demolitions, judicial foreclosures, new housing
construction and all manner of neighborhood
revitalization. While the return on public investment
changes over time, this increased investment results in
more tangible benefits on the ground and the return
on the public investment changes over time.
5. ROI Model Scenario Assumptions
5.1 Development Program
The ROI model assumes the same development
program for each of the three study areas in order to
compare the results of Metro activity in these general
geographical areas. The development program
consists of the number of new or rehabilitated housing
units or commercial and industrial square feet added
to the tax base as a direct result of Metro
Government’s actions. The more aggressive
Intervention scenario is more comprehensive in
approach and results in a greater impact on housing
over the 20-year projection period, going from 480
new and rehabilitated single family units under the
Baseline Maintenance scenario to 1,137 units under
the Intervention scenario. In addition, the Intervention
scenario includes an economic development component
which includes the construction of 340,000 SF of new
commercial and industrial space, as well as the
rehabilitation of 80,000 SF of existing vacant
commercial space. Finally, the Intervention scenario
includes the construction of 240,000 SF of mixed-
income rental housing and the renovation of another
150,000 SF, resulting in the creation of roughly 520
new apartments (Table 7-3). The City’s role in these
revitalization projects consists mostly of land
assemblage, infrastructure, rehabilitation assistance
and affordable housing subsidies, but not publically
financed construction of new facilities.
Development Program and Revitalizaton Inputs (Years 1-20)
Baseline Maintenance Scenario v. Intervention Scenario
Years 1-20 Years 1-20
DEVELOPMENT PROGRAM
Buildings (Related to Redevelopmentr Activity)
Residential - New Construction (Unit) 100 585
Residential - Rehabilitation (Unit) 380 552
Commercial (Multi-Family) - New Construction (SF) - 240,000
Commercial (Multi-Family) - Rehabilitation (SF) - 150,000
Commercial - New Construction (SF) - 100,000
Commercial - Rehabilitation (SF) - 80,000
Industrial - New Construction (SF) - 100,000
Industrial - Rehabilitation (SF) -
Land (Related to Redevelopment Activity)
Residential (Lots) 480 1,137
Commercial - Multi-family (SF) - 750,000
Commercial - Other (SF) - 600,000
Industrial (SF) - 400,000
ADMINISTRATIVE SERVICES/CODE ENFORCEMENT OUTPUTS
Code Enforcements Inspections (Units/Lots) 260,466 316,629
Foreclosures (Unit/Lots) 2,000 2,878
Demolitions
Residential (Units) 2,000 2,200
Property Maintenance (Units/lots)
Curtting & Cleaning (Lots) 38,519 77,038
Boarding (New Events) 20,722 13,000
Infrastructure Investments
Sidewalk Improvements (LF) - 4,800
Street Improvements (LF) - 2,400
Water/Sewer (LF) - 600
Parking - 766
Surface (Spaces) - 480
Structure (Spaces) - 286
Underground (Spaces) - -
PRE-DEVELOPMENT OUTPUTS
Neighborhood Planning Expenditures 4,000,000$ 10,000,000$
Land Acquisition
Residential (Parcel) 300 873
Commercial (Acre)* - 4
Industrial (Acre)* - 9
Building & Land Acquisition
Residential (Unit) 100 100
Commercial (SF) - -
Industrial (SF) - -
Demolitions
Commercial (SF) - -
Industrial (SF) - -
Affordable Housing Subsidies
New Construction 100 585
Rehabilitation 380 552
Source: RKG Associates, Inc., 2013
Baseline
Maintenance
Intervention
Table 7-3

Page | 7-14
VAP Neighborhood Revitalization Study
Section
7 5.2. Administrative Services, Code Enforcement
& Infrastructure Investments
Metro Government has been actively engaged in the
provision of services to reduce the effect that vacant
and abandoned properties are having on Louisville’s
neighborhoods. The scale of the problem over the past
several years has far exceeded the government’s
ability to substantially reduce the blighting impacts. In
the future, it is assumed that greater capacity and
financial commitments will allow the local government
to do more in the way of code enforcement
inspections, judicial foreclosures, demolitions, property
maintenance and similar blight elimination activities. In
addition, the model accounts for the likelihood that
government may be required to invest in infrastructure
improvements in partnership with private developers
to revitalize areas.
The Intervention scenario produces greater results over
twenty years - 878 additional foreclosures and 200
more demolitions than the baseline scenario, and the
more aggressive approach allows Metro Government
to more rapidly reduce its need for code enforcement
inspections and property maintenance services as
vacant and abandoned properties are either removed
or put back into productive use.
5.3. Pre-development Expenditures
Pre-development expenditures include those costs
required to prepare for future neighborhood
revitalization initiatives, from acquiring land and
buildings for future redevelopment to providing
affordable housing subsidies. These activities will occur
on an annual basis, usually in cooperation with other
development partners (both for-profit and non-profit)
that are interested in partnering with Metro
Government in targeted neighborhoods.
Under the Intervention scenario, Metro Government
through its Landbank Authority is much more proactive
and strategic with its land acquisition practices. One of
the most important factors contributing to successful
revitalization is the ability to achieve site control. In
the future, the Landbank would actively pursue
properties, both distressed and some market rate, to
accomplish redevelopment in key locations where the
projects can have a catalytic effect. These projects are
typically larger in size, scale and more complex.
6. ROI Model Results
The ROI model calculates a return on the public
investment after the end of Year 20 to account for the
fact that neighborhood revitalization can take several
years to plan, fund and implement. For all intents and
purposes, Louisville’s revitalization challenge is a
generational problem and will require a long-term
commitment to reverse the trends in some
neighborhoods.
The ROI calculation compares the City’s measurable
expenditures against its returns, in the form of
increased tax revenues over the 20-year projection
period. For example, if the City generates $5 million
in additional tax revenues over ten years as a result
of spending $50 million to revitalize an area, the
return would equal 10%, for an average annual
return of 1%. While such an investment would not be
considered viable compared to traditional financial
investment alternatives, local government must take a
longer-term view to such endeavors. While financial
returns may be modest, the stabilization of
neighborhoods and the preservation of public health
and safety are immeasurable and should not be
overlooked.
6.1. Increasing Return on the Public Investment
In order to increase its financial return on the public
investment, Metro Government must do the following:
� Increase Public, Private, and Non-profit
Partnerships – The ability to attract non-public
money to revitalization areas will have a greater
impact on financial return than any other single
action. This will require Metro Government to work
in close partnership with its private and non-profit
development partners to carry out activities in
targeted areas. In order to accomplish this, Metro
must carefully select the locations and methods
used to revitalize different areas. This may
require a change in approach and a commitment
to direct public dollars in a more targeted way,

Page | 7-15
VAP Neighborhood Revitalization Study
Section
7 rather than spreading limited funds through many
different areas and having very little impact.
� Increase Organizational and Financial Capacity –
In order to leverage greater amounts of non-
public money, Metro Government must be
prepared to make larger and more strategic
investments where they are needed to unlock
“Other People’s Money.”
This will require Metro to become more of an
equal partner and in some cases a “deal-maker,”
when appropriate. Committing financial resources
that are both significant and sustainable and
utilizing the City’s borrowing power are critical
elements. Urban revitalization requires public
action to mitigate risk and remove structural
problems requiring the government’s involvement.
In Louisville, the private real estate market is not
strong enough in some neighborhoods to justify the
investment risk without public intervention.
� Strategic Actions in Targeted Areas - This
approach concentrates Metro’s planning,
organizational, funding and implementation
efforts in areas that are ready for revitalization.
This means that the City is working in areas with
an established revitalization strategy and is
working in partnership with others that have the
capacity to implement change. This also includes
residents, who should be actively engaged in the
planning process leading up to implementation.
6.2. ROI Comparative Analysis
The results of the ROI model indicate that the Baseline
Maintenance approach would yield the highest return
on investment of 4.5% in the West Louisville
neighborhoods over the 20-year period. The
Intervention approach would be also more successful in
the West Louisville neighborhoods, resulting in a ROI
of 27.3% (Table 7-4). These results are largely due to
two reasons. First, the West Louisville area has a much
higher concentration of distressed properties, which is
lowering property values and makes property
acquisitions more affordable. Secondly, the West
Louisville neighborhood's property tax rates are
higher to reflect the number of additional services
provided within this area that are not provided
outside this area of the county.
Property acquisition accounts for the second largest
expense category behind affordable housing
subsidies over the projection period. The most costly
area is the Jefferson County suburbs, which has the
highest real estate values, which makes land and
building acquisition more costly, on average. Given
the importance of site control in redevelopment, it is
essential that the City be able to assemble properties
in an efficient and affordable manner.
Baseline Maintenance v. Intervention Approach
The Baseline Maintenance approach does not produce
suitable returns on the public investment, nor does it
produce enough tangible results on the ground to
make a real impact in the most distressed
neighborhoods. It is not until public dollars are used to
grow the tax base or grow employment that they start
to return revenue to local government. While the
current program of code enforcement, foreclosures,
demolitions and property maintenance are essential
elements of Metro’s response to the vacant and
abandoned property problem, they are not sufficient
in and of themselves to reverse the trend of decline.
However, they are effective at reducing the incidence
of blight and reducing crime, which is already a
problem in some neighborhoods.
On average, the Intervention approach produces 20-
year returns that are 5 to 6 times greater than the
Baseline Maintenance approach, with the largest
spread occurring in the West Louisville neighborhoods
(22.7% spread).
Impact of Private Leverage on ROI
As stated previously, Metro Government’s ability to
capture a greater return on its investment is based on
its ability to leverage private investment at a multiple
of the public investment. The results shown in Table 7-3
provide an estimated return at leverage ratios of 1.5,
3.0 and 5.0 times the direct public investment. If such
ratios can be achieved, the ROI at the end of Year 20

Page | 7-16
VAP Neighborhood Revitalization Study
Section
7 increases to 108.6% in West Louisville, 101.3% in the
Downtown, East & South Urban neighborhoods and
86.8% in the Jefferson County suburbs (Figure 7-2
and Table 7-4).
While a leverage ratio above five would be
exceptional, even higher ratios are sometimes
achievable for specific projects. According to the
Department of Community Services & Revitalization, in
responses to the City’s Request for Interest relative to
future site redevelopment project opportunities, early
development proposals are offering leverage ratios
of 2.0 to 4.0, which include heavy public subsidies.
However, as revitalization success occurs, the need for
subsidies will diminish as projects are able to attract
private equity and traditional sources of debt
financing. This will not be the case for projects such as
affordable housing developments, which can only
achieve affordability with outside subsidies given the
low income of targeted residents.
An important element of the City’s revenue stream in
the ROI model is taxes on employee withholdings,
insurance premiums and corporate net profits. This
source produces nearly as much revenue as property
taxes and is not present in the Baseline Maintenance
scenario. This speaks to the dual need of incorporating
economic development projects in future revitalization
programs; first to address the employment needs of
local residents, but also to increase tax revenues. In
the Intervention scenario, it is assumed that 572 new
jobs are created with an annual payroll of
approximately $38 million in Year 20. These
employment and payroll estimates do not include
construction employment but rather permanent
employment.
Net Present Value of the Public Investment
The net present value (NPV) is an investment analysis
and capital budgeting tool used to analyze the
profitability of an investment or project. Typically, a
project or real estate development produces a series
of annual cash flows over time representing the
different between revenues and expenses. The NPV
calculation represents the value of an investment
today in exchange for a series of future cash flows.
Net present value adjusts s future cash flows to reflect
the cost of capital plus the investor’s risk or discount
rate. In the ROI, the discount rate is assumed to be the
cost of capital (4%) or the City’s municipal borrowing
costs.
With these assumptions, none of the Baseline or
Intervention scenarios produce a positive NPV. None
of the projections actually return the City’s original
invested capital at the end of Year 20, but only a
portion of its original investment. Accordingly, each
scenario produces negative cash flows each year as
expenditures far exceed projected revenues. The NPV
values range from a high of -$72 million to a low of
-$85 million, meaning that a traditional investor would
not be willing to invest in such a venture without being
given money upfront to compensate for projected
losses.
Impact of Borrowing on ROI
One of the factors that increases the government’s ROI
is the ability to reduce its upfront investment in such
things as infrastructure, housing subsidies, land and
building acquisition and other capital expenses. Given
the size and scope of this effort, it is unlikely that
Metro Government will be able to “pay-as-you-go,”
when those annual outlays could range from $5.2
million to $8 million on just the baseline scenario. Any
expansion of revitalization activities would drive the
Figure 7-2
Source: RKG Associates, Inc., 2013
0%
20%
40%
60%
80%
100%
120%
Direct 1.5 x Leverage 3 x Leverage 5 x Leverage
Private Leverage Impacts to ROI
(Year 20)
West Louisville Downtown Jefferson Co. Suburbs

Page | 7-17
VAP Neighborhood Revitalization Study
Section
7 annual cost well above $10 million a year. However,
with the use of the City’s bonding capacity for capital
expenses or the bonding capacity of a redevelopment
authority, those same capital outlays could be reduced
substantially. Using the Downtown, East & South Urban
neighborhoods as an example, it is anticipated that
approximately $164.8 million in public investment
would be necessary to support the Intervention
scenario over twenty years if Metro Government
adopted the “pay-as-you-go” approach (Figure 7-3).
This approach assumes no municipal borrowing – these
investments would be paid for through annual
appropriations. While not likely to occur, this
demonstrates that Metro Government would have to
invest an average of $8.2 million per year over 20
years to reduce the current number of VAP to zero.
This amount would be in addition to the $2 to $4.5
million expended annually to carry out code
enforcement inspections, boarding vacant structures,
cutting and cleaning vacant properties and
foreclosures.
While such assumptions are very ambitious and
probably not financially feasible, they demonstrate
the benefits of borrowing at low interest rates to
reduce annual public outlays. Borrowing at municipal
bond rates, estimated at 4%, Metro Government
could reduce its 20-year outlays by roughly $66
million, from $164.8 million to $98.4 million (Figure 7-
3) if all assumptions and projections are accurate and
remain the same.
The ability to finance major capital investments is a
critical element of “right-sizing” the City’s response to
meet the size of the challenge. Currently, much of the
money used for housing and neighborhood
revitalization comes from federal sources, which are
diminishing over time. For example, if one assumes
that the revitalization of the West Louisville
Neighborhoods might cost a billion dollars, at a 4:1
leverage ratio, Metro might be expected to invest as
much as $250 million over perhaps a 20-year period.
If that investment was spread out in equal annual
installments and the City was able to borrow those
funds each year, in Year 21 the investment would
require annual debt service payments in excess of
$18 million. While this is an extreme investment
scenario, it speaks to the financial limitations of the
“pay-as-you-go” approach, particularly under a more
comprehensive revitalization scenario.
7. Implications
The ROI model illustrates a couple of important factors
that must be considered as Metro Government moves
forward with its revitalization initiatives. First, how can
it maximize the benefits derived from current and
future public investments in neighborhood
revitalization? In order to have a measurable impact
on declining neighborhoods and to improve conditions,
the City must work closely in concert with other
development interests and community residents.
Where the City makes investments in the future may
be as important as the type of investments it makes.
Dedicating tens of millions of public dollars into the
most severely challenged areas may not produce the
best results, despite the high level of need in those
areas. Dedicating and targeting resources in areas
where they can have a “catalytic” effect and spin-off
other development must be part of the strategy.
The traditional method of “pay-as-you-go” will
probably not have a significant impact in some of the
Figure 7-3
Source: RKG Associates, Inc., 2013
$98,521,247
$164,815,086
$0
$20,000,000
$40,000,000
$60,000,000
$80,000,000
$100,000,000
$120,000,000
$140,000,000
$160,000,000
$180,000,000
1 2 3 4 5 6 7 8 9 10 11 12 13 14 15 16 17 18 19 20
Impact of Municipal Borrowing v.
"Pay-as-You-Go (Year 1-20)
Muncipal Borrowing Pay-As-You-Go

Page | 7-18
VAP Neighborhood Revitalization Study
Section
7 City’s most economically challenged neighborhoods.
The scale of the investment needs to increase to meet
the size of the problem, and currently that is not
possible given the limited resources. Finally, if Metro
Government wants to maximize the return on its
investment to combat the vacant and abandoned
property problem, it needs to pursue strategies that
will stabilize and grow the tax base. The current
approach of code enforcement, property
maintenance, demolitions and foreclosures is essential
but will not produce the measurable financial results
Metro Government desires. This can only be achieved
through comprehensive neighborhood revitalization
efforts, with Metro Government providing the strategic
vision and investment in areas that will attract federal,
private and nonprofit investment.

Page | 7-19
VAP Neighborhood Revitalization Study
Section
7
WEST LOUISVILLE NEIGHBORHOODS
BASELINE MAINTENANCE SCENARIO Years 1-20 1.5 x Leverage 3 x Leverage 5 x Leverage
Public Investment
Total Administrative/Code Enforcement Costs 47,867,738$ 47,867,738$ 47,867,738$ 47,867,738$
Total Revitalization Investments (PAYGO) [1] 68,885,036$ 68,885,036$ 68,885,036$ 68,885,036$
Total - Public Investment 116,752,774$ 116,752,774$ 116,752,774$ 116,752,774$
Performance Metrics
Number of Code Enforcement Inspections 260,466 260,466 260,466 260,466
Number of Foreclosures 2,000 2,000 2,000 2,000
Number of Cutting & Cleanings 38,519 38,519 38,519 38,519
Number of Boardings 20,722 20,722 20,722 20,722
Number of Demolitions 2,000 2,000 2,000 2,000
Number of Jobs Created [2] - - - -
New Annual Payroll [2] -$ -$ -$ -$
New Homes Constructed 100 150 300 500
Existing Homes Rehabilitated 380 570 1,140 1,900
New Tax Revenues (Year 20) (Year 20) (Year 20) (Year 20)
Real Property Tax Base 3,932,769$ 5,899,153$ 11,798,306$ 19,663,844$
Personal Property Tax Base 1,374,080$ 2,061,120$ 4,122,240$ 6,870,401$
Occupational Tax Base -$ -$ -$ -$
Total - Tax Revenues 5,306,849$ 7,960,273$ 15,920,546$ 26,534,244$
ROI & Net Present Value Calculation
Net Present Value of Cash Flows (Yrs. 1-20) ($75,188,152)
Return on Public Investment 4.5% 6.8% 13.6% 22.7%
INTERVENTION SCENARIO Years 1-20 1.5 x Leverage 3 x Leverage 5 x Leverage
Public Investment
Total Administrative/Code Enforcement Costs 73,887,179$ 73,887,179$ 73,887,179$ 73,887,179$
Total Revitalization Investments (reflects municipal borrowing) 75,857,915$ 75,857,915$ 75,857,915$ 75,857,915$
Total - Public Investment 149,745,094$ 149,745,094$ 149,745,094$ 149,745,094$
Performance Metrics
Number of Code Enforcement Inpections 316,629 316,629 316,629 316,629
Number of Foreclosures 2,878 2,878 2,878 2,878
Number of Cutting & Cleanings 77,038 77,038 77,038 77,038
Number of Boardings 13,000 13,000 13,000 13,000
Number of Demolitions 2,200 2,200 2,200 2,200
Number of Jobs Created [2] 572 629 744 858
New Annual Payroll [2] 378,220,810$ 416,042,891$ 491,687,054$ 567,331,216$
New Homes Constructed 585 878 1,755 2,925
Existing Homes Rehabilitated 552 828 1,656 2,760
New Tax Revenues (Year 20) (Year 20) (Year 20) (Year 20)
Real Property Tax Base 19,621,845$ 29,432,767$ 58,865,534$ 98,109,223$
Personal Property Tax Base 9,365,131$ 14,047,696$ 28,095,393$ 46,825,655$
Occupational Tax Base 11,820,749$ 13,002,824$ 15,366,974$ 17,731,124$
Total - Tax Revenues 40,807,725$ 56,483,288$ 102,327,901$ 162,666,002$
ROI & Net Present Value Calculation
Net Present Value of Cash Flows (Yrs. 1-20) ($72,453,918)
Return on Public Investment 27.3% 37.7% 68.3% 108.6%
Source: RKG Associates, Inc., 2013
Discounty Rate 4.0%
Note:
[1] Assumes LMG pays for revitalization investments annually through direct outlays without using muncipal bonding
[2] Mutiplier of 1.1, 1.3 and 1.5 applied to direct jobs, payroll and occupational taxes to reflect leveraged effect
of the original public investment
Private Investment Leverage Impacts DOWNTOWN, EAST AND SOUTH URBAN NEIGHBORHOODS
BASELINE MAINTENANCE SCENARIO Years 1-20 1.5 x Leverage 3 x Leverage 5 x Leverage
Public Investment
Total Administrative/Code Enforcement Costs 48,983,096$ 48,983,096$ 48,983,096$ 48,983,096$
Total Revitalization Investments (PAYGO) [1] 93,670,758$ 93,670,758$ 93,670,758$ 93,670,758$
Total - Public Investment 142,653,854$ 142,653,854$ 142,653,854$ 142,653,854$
Performance Metrics
Number of Code Enforcement Inspections 260,466 260,466 260,466 260,466
Number of Foreclosures 2,000 2,000 2,000 2,000
Number of Cutting & Cleanings 38,519 38,519 38,519 38,519
Number of Boardings 20,722 20,722 20,722 20,722
Number of Demolitions 2,000 2,000 2,000 2,000
Number of Jobs Created [2] - - - -
New Annual Payroll [2] -$ -$ -$ -$
New Homes Constructed 100 150 300 500
Existing Homes Rehabilitated 380 570 1,140 1,900
New Tax Revenues (Year 20) (Year 20) (Year 20) (Year 20)
Real Property Tax Base 4,236,849$ 6,355,273$ 12,710,546$ 21,184,244$
Personal Property Tax Base 1,480,323$ 2,220,485$ 4,440,970$ 7,401,617$
Occupational Tax Base -$ -$ -$ -$
Total - Tax Revenues 5,717,172$ 8,575,758$ 17,151,517$ 28,585,861$
ROI & Net Present Value Calculation
Net Present Value of Cash Flows (Yrs. 1-20) ($92,104,036)
Return on Public Investment 4.0% 6.0% 12.0% 20.0%
INTERVENTION SCENARIO Years 1-20 1.5 x Leverage 3 x Leverage 5 x Leverage
Public Investment
Total Administrative/Code Enforcement Costs 75,632,015$ 75,632,015$ 75,632,015$ 75,632,015$
Total Revitalization Investments (reflects municipal borrowing) 98,521,247$ 98,521,247$ 98,521,247$ 98,521,247$
Total - Public Investment 174,153,261$ 174,153,261$ 174,153,261$ 174,153,261$
Performance Metrics
Number of Code Enforcement Inpections 316,629 316,629 316,629 316,629
Number of Foreclosures 2,878 2,878 2,878 2,878
Number of Cutting & Cleanings 77,038 77,038 77,038 77,038
Number of Boardings 13,000 13,000 13,000 13,000
Number of Demolitions 2,200 2,200 2,200 2,200
Number of Jobs Created [2] 572 629 744 858
New Annual Payroll [2] 378,220,810$ 416,042,891$ 491,687,054$ 567,331,216$
New Homes Constructed 585 878 1,755 2,925
Existing Homes Rehabilitated 552 828 1,656 2,760
New Tax Revenues (Year 20) (Year 20) (Year 20) (Year 20)
Real Property Tax Base 21,212,949$ 31,819,423$ 63,638,847$ 106,064,744$
Personal Property Tax Base 10,539,562$ 15,809,343$ 31,618,687$ 52,697,812$
Occupational Tax Base 11,799,786$ 12,979,765$ 15,339,722$ 17,699,679$
Total - Tax Revenues 43,552,297$ 60,608,532$ 110,597,256$ 176,462,235$
ROI & Net Present Value Calculation
Net Present Value of Cash Flows (Yrs. 1-20) ($84,930,265)
Return on Public Investment 25.0% 34.8% 63.5% 101.3%
Source: RKG Associates, Inc., 2013
Discounty Rate 4.0%
Note:
[1] Assumes LMG pays for revitalization investments annually through direct outlays without using muncipal bonding
[2] Mutiplier of 1.1, 1.3 and 1.5 applied to direct jobs, payroll and occupational taxes to reflect leveraged effect
of the original public investment
Private Investment Leverage Impacts JEFFERSON COUNTY SUBURBS
BASELINE MAINTENANCE SCENARIO Years 1-20 1.5 x Leverage 3 x Leverage 5 x Leverage
Public Investment
Total Administrative/Code Enforcement Costs 48,440,063$ 48,440,063$ 48,440,063$ 48,440,063$
Total Revitalization Investments (PAYGO) [1] 81,603,351$ 81,603,351$ 81,603,351$ 81,603,351$
Total - Public Investment 130,043,413$ 130,043,413$ 130,043,413$ 130,043,413$
Performance Metrics
Number of Code Enforcement Inspections 260,466 260,466 260,466 260,466
Number of Foreclosures 2,000 2,000 2,000 2,000
Number of Cutting & Cleanings 38,519 38,519 38,519 38,519
Number of Boardings 20,722 20,722 20,722 20,722
Number of Demolitions 2,000 2,000 2,000 2,000
Number of Jobs Created [2] - - - -
New Annual Payroll [2] -$ -$ -$ -$
New Homes Constructed 100 150 300 500
Existing Homes Rehabilitated 380 570 1,140 1,900
New Tax Revenues (Year 20) (Year 20) (Year 20) (Year 20)
Real Property Tax Base 3,090,509$ 4,635,763$ 9,271,527$ 15,452,545$
Personal Property Tax Base 1,708,256$ 2,562,384$ 5,124,768$ 8,541,281$
Occupational Tax Base -$ -$ -$ -$
Total - Tax Revenues 4,798,765$ 7,198,148$ 14,396,295$ 23,993,825$
ROI & Net Present Value Calculation
Net Present Value of Cash Flows (Yrs. 1-20) ($84,301,060)
Return on Public Investment 3.7% 5.5% 11.1% 18.5%
INTERVENTION SCENARIO Years 1-20 1.5 x Leverage 3 x Leverage 5 x Leverage
Public Investment
Total Administrative/Code Enforcement Costs 74,714,750$ 74,714,750$ 74,714,750$ 74,714,750$
Total Revitalization Investments (reflects municipal borrowing) 86,381,259$ 86,381,259$ 86,381,259$ 86,381,259$
Total - Public Investment 161,096,009$ 161,096,009$ 161,096,009$ 161,096,009$
Performance Metrics
Number of Code Enforcement Inpections 316,629 316,629 316,629 316,629
Number of Foreclosures 2,878 2,878 2,878 2,878
Number of Cutting & Cleanings 77,038 77,038 77,038 77,038
Number of Boardings 13,000 13,000 13,000 13,000
Number of Demolitions 2,200 2,200 2,200 2,200
Number of Jobs Created [2] 572 629 744 858
New Annual Payroll [2] 378,220,810$ 416,042,891$ 491,687,054$ 567,331,216$
New Homes Constructed 585 878 1,755 2,925
Existing Homes Rehabilitated 552 828 1,656 2,760
New Tax Revenues (Year 20) (Year 20) (Year 20) (Year 20)
Real Property Tax Base 15,160,893$ 22,741,339$ 45,482,679$ 75,804,465$
Personal Property Tax Base 9,351,715$ 14,027,573$ 28,055,146$ 46,758,577$
Occupational Tax Base 11,464,372$ 12,610,810$ 14,903,684$ 17,196,558$
Total - Tax Revenues 35,976,981$ 49,379,722$ 88,441,509$ 139,759,600$
ROI & Net Present Value Calculation
Net Present Value of Cash Flows (Yrs. 1-20) ($81,737,317)
Return on Public Investment 22.3% 30.7% 54.9% 86.8%
Source: RKG Associates, Inc., 2013
Discounty Rate 4.0%
Note:
[1] Assumes LMG pays for revitalization investments annually through direct outlays without using muncipal bonding
[2] Mutiplier of 1.1, 1.3 and 1.5 applied to direct jobs, payroll and occupational taxes to reflect leveraged effect
of the original public investment
Private Investment Leverage Impacts
Table 7-4

Page | 7-20
VAP Neighborhood Revitalization Study
Section
7
E. MEASURING REVITALIZATION -
“Reducing the Impact of Vacant
and Abandoned Properties”
The consultants, in conjunction with the Mayor’s
Innovation Delivery Team, prepared a 20-year
projection model driven by the development
assumptions contained in the Public ROI Model
described earlier in this section. The purpose of the
projections was to examine how the Baseline
Maintenance approach, a proxy for Metro’s current
approach, would differ from the Intervention
approach in terms of reducing the number of vacant
and abandoned properties and revitalizing
neighborhoods.
The projections assume that as revitalization occurs in
impacted neighborhoods and underutilized property is
put back into productive use, the number of vacant
properties will be reduced over time. Consequently,
the financial burden on Louisville Metro Government
associated with managing this problem will be
reduced as new tax revenues are generated through
redevelopment.
1. Methodology
The public ROI model assumptions were used to drive
the financial projections, which included total projected
expenditures on such items as: administrative and
code enforcement, infrastructure investments, and pre-
development expenses. The model also projected
future tax revenues resulting from the Baseline
Maintenance and Intervention scenarios, based on the
tangible and measurable development results from
each approach. In parallel with the financial
implications, the model projects the rate at which the
number of vacant properties are reduced once
redeveloped, foreclosed or otherwise removed from
the Metro Government property maintenance
program, which includes cutting and cleaning vacant
lots, boarding abandoned buildings and carrying out
regular code enforcement actions.
Modeling such a dynamic and unpredictable process is
a challenge, but the model can be used as a
comparative tool to evaluate the impacts of the two
different revitalization approaches. Similar to the ROI
analysis, the consultants measured the revitalization
results in the same three study areas: (1) West
Louisville, (2) Downtown, East & South Urban
neighborhoods, and (3) Jefferson County suburbs. The
assumptions made by the consultants relative to the
rate of VAP reduction were reviewed Metro
Government staff to ensure that reasonable
assumptions were made.
Although derived from the same data inputs, the
results presented in Table 7-4 are not identical to
those presented in Tables 7-5 through 7-7. This is
because each table is tracking slightly different data
for different purposes. Because the ROI model is
calculating a financial return to Metro Government,
the data presented in the table is expressed
differently than in the VAP Impact Model Results
tables. Tables 7-5, 7-6 and 7-7 track expenditures,
revenues and changes in the number of VAP
properties, but do not account for such things as
changes in annual outlay due to municipal borrowing.
2. Cost Saving Benefits of VAP Reduction
In order to reduce its annual outlays, Metro
Government must first reduce the number of properties
that it is managing each year, as well as reduce the
rate at which new properties become vacant. Once a
property requires municipal action for code
enforcement actions, boarding, cutting and cleaning,
demolition or foreclosure, a cost is incurred by the
local government to manage these properties.
However, once they are put back into productive use,
either through government actions or the actions of
private or nonprofit entities, the cost burden to local
taxpayers is reduced.

Page | 7-21
VAP Neighborhood Revitalization Study
Section
7 According to RKG’s projections, the most significant
annual cost savings occur once the emphasis is placed
on redevelopment and revitalization rather than
property maintenance and code enforcement.
Although property maintenance and code
enforcement activities are essential activities to
combat the progression of neighborhood decline, they
do not always translate into measurable revenue
increases.
In all three study areas, the more comprehensive
Intervention approach yields greater annual
maintenance cost savings because the approach is
more actively engaged in reducing the City’s
inventory of vacant and abandoned properties.
Cumulative maintenance cost savings range from
roughly $7.2 million over the first 10 years to nearly
$38 million by the end of Year 20. This occurs as the
number of vacant and abandoned properties is
reduced each year and the cost of maintaining the
properties is also reduced. In order to properly assess
Metro Government’s total cost commitment to the VAP
problem, the long-term capital investments required to
eliminate the problem would be partially offset by the
annual maintenance cost savings over 20 years. Using
West Louisville as an example, in exchange for a total
public investment of $75.8 million over 20 years
(assuming Metro Government bonds the revitalization
costs as presented) under the Intervention scenario, the
government would realize an annual maintenance cost
savings of nearly $38 million.
Under the Baseline Maintenance scenario, an
investment of $68.9 million would only yield a
cumulative maintenance cost savings of roughly $9.4
million over 20 years (Table 7-5 to 7-7). The cost
savings under the Baseline scenario is not as
impressive over the 20-year period because the VAP
property inventory is being reduced at a much slower
rate each year. At the same time, the cost of
redevelopment rises as land values and the cost of
property management services rise and Metro
increases its investment in property acquisition and the
provision of affordable housing subsidies. This
effectively reduces the cost saving benefits each year
as a result of a decreasing VAP inventory and the
resulting property maintenance costs.
3. VAP Inventory Reduction
Logically, the rate at which the VAP inventory is
reduced directly impacts the cost savings over time.
RKG has assumed that as VAP properties are
foreclosed upon, sold and/or redeveloped, they
effectively become the responsibility of an entity other
than Metro Government and the costs associated with
maintaining the property transfers to the new
responsible owner.
For the purposes of projecting future reductions in the
VAP inventory, RKG assumed that there are roughly
6,000 vacant properties, of which 50% of these
properties will be “cured” on their own as market
conditions improve and properties find other uses. This
is probably less likely to occur in the hardest hit areas
of the city where there are a myriad of factors
keeping vacant properties in an underutilized status.
Not least of which is the condition or status of adjacent
properties, which are often in decline and have
equally uncertain futures. This is why concerted City
action is required to eliminate some of this uncertainty
in areas that have real revitalization potential if the
appropriate intervention occurs before conditions
worsen.
Figure 7-5
$(40,000,000)
$(35,000,000)
$(30,000,000)
$(25,000,000)
$(20,000,000)
$(15,000,000)
$(10,000,000)
$(5,000,000)
$-
Cumulative Maintenance Cost SavingsBaseline v. Intervention Scenarios
(Years 1-20)
Baseline Maintenance Intervention
Years 1-10) Years 1-15) Years 1-20)

Page | 7-22
VAP Neighborhood Revitalization Study
Section
7
Of the remaining 3,000 vacant properties that require
Metro intervention, approximately 1,200 properties
are considered abandoned, meaning they have been
receiving property maintenance services from Metro
Government and have been vacant for one year. The
abandoned property inventory is assumed to be a
subset of the vacant property inventory. Accordingly,
the 20-year inventory projections assume that when an
abandoned property is removed from the inventory,
one property is removed from the vacant property list.
Based on RKG’s projections, the Baseline Maintenance
approach results in the reduction of approximately
1,400 vacant and abandoned properties over 20
years, for a net reduction of 70 properties per year.
The more aggressive Intervention scenario results in the
reduction of 3,000 properties, for a reduction of 150
properties per year. However, it should be noted that
the actual number of VAP properties removed from
the inventory is actually larger because as properties
are removed and put back into productive use, new
properties are added to the VAP list through natural
causes. Under the Baseline scenario, a total of 2,290
properties are put back into product use, but that total
includes 875 new VAP properties added during the
20-year period. For the Intervention scenario, the
total number of “cured” properties is 3,649, which
includes 649 new properties added during the 20-
year period.
4. Implications
As the data and conventional wisdom would suggest,
the faster the number of VAP properties are reduced,
the sooner they become revenue-producing real estate
and the sooner they start to have positive effects on
their surrounding neighborhoods. However, these
accelerated results come at a significant cost. Over
the 20-year projection period, the total Metro
expenditures range from a low end of $206 million in
the West Louisville area to $247 million in the
Downtown study area. This includes raw costs for all
activities and does not reflect the method in which
these costs may be funded (i.e., PAYGO or municipal
borrowing) (Tables 7-5 to 7-7). The biggest factor
influencing the difference in cost is the value of real
estate, which is much higher in the downtown and
suburban study areas than in West Louisville.
VAP INVENTORY ASSUMPTIONS
� Of an estimated 6000 "vacant" properties, 50% will be remedied through normal market forces. This model therefore assumes a "backlog" of 3000 vacant properties which require Metro intervention.
� Approximately 1200 "abandoned" properties identified in Hansen - conditions are such that Metro is actively maintaining property to meet code and the property has been vacant for one year.
� Landbank/Metro-Owned Properties are NOT considered to be “vacant” because Louisville Metro has site control and can maintain to high standard.
� Need to foreclose to take title on all properties where we have conducted demolition – demolition in and of itself is not considered “disposition.”

Page | 7-23
VAP Neighborhood Revitalization Study
Section
7
Table 7-1
Vacant & Abandoned Properties Impact Model (YearS 1-20)
Baseline Maintenance & Intervention Scenario
WEST LOUISVILLE STUDY AREA Units
Yr. 1
Cost/Value Units
Cum. Total Cost
(Yrs. 1-10) Units
Cum. Total Cost
(Yrs. 1-15) Units
Cum. Total Cost
(Yrs. 1-20)
BASELINE MAINTENANCE SCENARIO
Total Expenditures (inc. infrastructure investments) 5,228,948$ 55,330,837$ 85,373,573$ 116,752,774$
Administrative Services/Infrastructure/Code Enforcement 3,233,682$ 33,106,539$ 49,920,411$ 66,420,823$
Code Enforcement/Inspection 6,000 591,600$ 4,599 5,829,602$ 3,765 8,545,717$ 2,889 10,973,354$
Administrative Staff Time (Metro Govt.) - 151,670$ - 1,693,396$ - 2,705,080$ - 3,845,726$
Cutting/Cleaning 2,416 1,286,839$ 1,663 12,099,461$ 1,215 17,087,244$ 744 20,856,900$
Boarding 650 77,272$ 6,500 865,712$ 9,750 1,385,642$ 13,000 1,973,895$
Demolition 100 726,300$ 1,000 8,137,016$ 1,500 13,023,958$ 2,000 18,553,085$
Foreclosure 100 400,000$ 1,000 4,481,353$ 1,500 7,172,771$ 2,000 10,217,863$
Pre-Development Expenditures 1,995,267$ 22,224,298$ 35,453,163$ 50,331,951$
Neighborhood Planning 0.2 100,000$ 2.0 1,120,338$ 3.0 1,793,193$ 4.0 2,554,466$
Infrastructure Improvements - -$ - -$ - -$ - -$
Affordable Housing Subsidies 24 1,385,000$ 240 15,516,684$ 360 24,835,718$ 480 35,379,351$
Property Acquisition (Residential & Nonresidential) 20 510,267$ 200 5,587,276$ 300 8,824,252$ 400 12,398,134$
Tax Revenues 16,690$ 1,127,383$ 2,736,941$ 5,306,849$
Real Property Tax Revenue 15,901$ 943,534$ 2,149,936$ 3,932,769$
Personal Property Tax Revenue 789$ 183,849$ 587,005$ 1,374,080$
Occupational Tax Revenue -$ -$ -$ -$
Economic Development - -$ - -$ -$ -$
Employment - - - -
Annual Payroll -$ -$ -$ -$
Change in Vacant & Abandoned Property Inventory
Vacant - (602) (948) (1,412)
Abandoned - (602) (948) (1,200)
Total Cummulative Maintenance Cost Savings - - (2,274,510)$ (5,073,269)$ (9,421,809)$
INTERVENTION SCENARIO
Units
Yr. 1
Cost/Value Units
Cum. Total Cost
(Yrs. 1-10) Units
Cum. Total Cost
(Yrs. 1-15) Units
Cum. Total Cost
(Yrs. 1-20)
Total Expenditures (inc. infrastructure investments) 7,060,140$ 94,932,180$ 152,916,036$ 206,314,302$
Administrative Services/Infrastructure/Code Enforcement 4,914,873$ 53,430,813$ 76,511,248$ 94,069,464$
Code Enforcement/Inspection 6,000 887,400$ 3,835 8,268,269$ 2,398 11,218,045$ 888 12,887,819$
Administrative Staff Time (Metro Govt.) - 151,670$ - 4,938,666$ - 9,803,096$ - 13,712,914$
Cutting/Cleaning 2,416 2,573,678$ 1,238 22,380,923$ 383 27,540,037$ - 27,904,339$
Boarding 650 175,825$ 6,500 1,969,835$ 9,750 3,152,881$ 13,000 4,491,389$
Demolition 100 726,300$ 1,200 9,766,217$ 1,700 14,653,159$ 2,200 20,182,285$
Foreclosure 100 400,000$ 1,350 6,106,904$ 2,100 10,144,031$ 2,878 14,890,718$
Pre-Development Activities 2,145,267$ 41,501,367$ 76,404,788$ 112,244,838$
Neighborhood Planning 0.50 250,000$ 5.0 2,800,845$ 7.5 4,482,982$ 10.0 6,386,164$
Infrastructure Improvements - -$ - 647,516$ - 1,436,451$ - 1,436,451$
Affordable Housing Subsidies 24 1,385,000$ 447 25,353,778$ 787 46,164,669$ 1,137 70,144,771$
Property Acquisition (Residential & Nonresidential) 20 510,267$ 388 12,699,228$ 687 24,320,687$ 990 34,277,451$
Revenues 33,381$ 7,057,021$ 19,690,801$ 40,807,725$
Real Property Tax Revenue 15,901$ 3,670,703$ 9,871,645$ 19,621,845$
Personal Property Tax Revenue 789$ 982,555$ 3,643,474$ 9,365,131$
Occupational Tax Revenue 16,690$ 2,403,764$ 6,175,682$ 11,820,749$
Economic Development - -$ 286 76,911,661$ 572 197,599,256$ 572 378,220,810$
Employment - 286 572 572
Annual Payroll -$ 76,911,661$ 197,599,256$ 378,220,810$
Change in Vacant & Abandoned Property Inventory
Vacant - (1,069) (1,883) (3,000)
Abandoned - (1,069) (1,200) (1,200)
Total Cummulative Maintenance Cost Savings - - (7,195,431)$ (18,760,587)$ ($37,966,082)
Source: RKG Associates, Inc., 2013
Year 1 Year 10 Year 15 Year 20
Year 20Year 15Year 10Year 1
Table 7-5

Page | 7-24
VAP Neighborhood Revitalization Study
Section
7
Table 7-2
Vacant & Abandoned Properties Impact Model (YearS 1-20)
Baseline Maintenance & Intervention Scenario
DOWNTOWN, EAST & SOUTH URBAN
NEIGHBORHHOODS STUDY AREA Units
Yr. 1
Cost/Value Units
Cum. Total Cost
(Yrs. 1-10) Units
Cum. Total Cost
(Yrs. 1-15) Units
Cum. Total Cost
(Yrs. 1-20)
BASELINE MAINTENANCE SCENARIO
Total Expenditures (inc. infrastructure investments) 6,294,952$ 67,003,277$ 103,808,416$ 142,653,854$
Administrative Services/Infrastructure/Code Enforcement 3,279,586$ 33,609,180$ 50,714,255$ 67,536,181$
Code Enforcement/Inspection 6,000 591,600$ 4,599 5,829,602$ 3,765 8,545,717$ 2,889 10,973,354$
Administrative Staff Time (Metro Govt.) - 197,575$ - 2,196,037$ - 3,498,924$ - 4,961,084$
Cutting/Cleaning 2,416 1,286,839$ 1,663 12,099,461$ 1,215 17,087,244$ 744 20,856,900$
Boarding 650 77,272$ 6,500 865,712$ 9,750 1,385,642$ 13,000 1,973,895$
Demolition 100 726,300$ 1,000 8,137,016$ 1,500 13,023,958$ 2,000 18,553,085$
Foreclosure 100 400,000$ 1,000 4,481,353$ 1,500 7,172,771$ 2,000 10,217,863$
Pre-Development Expenditures 3,015,366$ 33,394,097$ 53,094,160$ 75,117,674$
Neighborhood Planning 0.2 100,000$ 2.0 1,120,338$ 3.0 1,793,193$ 4.0 2,554,466$
Infrastructure Improvements - -$ - -$ - -$ - -$
Affordable Housing Subsidies 24 1,385,000$ 240 15,516,684$ 360 24,835,718$ 480 35,379,351$
Property Acquisition (Residential & Nonresidential) 20 1,530,366$ 200 16,757,075$ 300 26,465,249$ 400 37,183,857$
Tax Revenues 17,981$ 1,214,552$ 2,948,560$ 5,717,172$
Real Property Tax Revenue 17,130$ 1,016,488$ 2,316,168$ 4,236,849$
Personal Property Tax Revenue 850$ 198,064$ 632,392$ 1,480,323$
Occupational Tax Revenue -$ -$ -$ -$
Economic Development - -$ - -$ -$ -$
Employment - - - -
Annual Payroll -$ -$ -$ -$
Change in Vacant & Abandoned Property Inventory
Vacant - (602) (948) (1,412)
Abandoned - (602) (948) (1,200)
Total Cummulative Maintenance Cost Savings - - (2,274,510)$ (5,073,269)$ (9,421,809)$
INTERVENTION SCENARIO
Units
Yr. 1
Cost/Value Units
Cum. Total Cost
(Yrs. 1-10) Units
Cum. Total Cost
(Yrs. 1-15) Units
Cum. Total Cost
(Yrs. 1-20)
Total Expenditures (inc. infrastructure investments) 8,126,143$ 110,214,863$ 179,245,552$ 246,833,265$
Administrative Services/Infrastructure/Code Enforcement 4,960,778$ 54,088,919$ 77,645,055$ 95,814,300$
Code Enforcement/Inspection 6,000 887,400$ 3,835 8,268,269$ 2,398 11,218,045$ 888 12,887,819$
Administrative Staff Time (Metro Govt.) - 197,575$ - 5,596,772$ - 10,936,903$ - 15,457,749$
Cutting/Cleaning 2,416 2,573,678$ 1,238 22,380,923$ 383 27,540,037$ - 27,904,339$
Boarding 650 175,825$ 6,500 1,969,835$ 9,750 3,152,881$ 13,000 4,491,389$
Demolition 100 726,300$ 1,200 9,766,217$ 1,700 14,653,159$ 2,200 20,182,285$
Foreclosure 100 400,000$ 1,350 6,106,904$ 2,100 10,144,031$ 2,878 14,890,718$
Pre-Development Activities 3,165,366$ 56,125,944$ 101,600,497$ 151,018,965$
Neighborhood Planning 0.50 250,000$ 5.0 2,800,845$ 7.5 4,482,982$ 10.0 6,386,164$
Infrastructure Improvements - -$ - 647,516$ - 1,436,451$ - 1,436,451$
Affordable Housing Subsidies 24 1,385,000$ 447 25,353,778$ 787 46,164,669$ 1,137 70,144,771$
Property Acquisition (Residential & Nonresidential) 20 1,530,366$ 388 27,323,805$ 687 49,516,396$ 990 73,051,579$
Revenues 35,962$ 7,477,995$ 20,942,763$ 43,552,297$
Real Property Tax Revenue 17,130$ 3,968,436$ 10,670,446$ 21,212,949$
Personal Property Tax Revenue 850$ 1,110,058$ 4,107,587$ 10,539,562$
Occupational Tax Revenue 17,981$ 2,399,501$ 6,164,729$ 11,799,786$
Economic Development - -$ 286 76,911,661$ 572 197,599,256$ 572 378,220,810$
Employment - 286 572 572
Annual Payroll -$ 76,911,661$ 197,599,256$ 378,220,810$
Change in Vacant & Abandoned Property Inventory
Vacant - (1,069) (1,883) (3,000)
Abandoned - (1,069) (1,200) (1,200)
Total Cummulative Maintenance Cost Savings - - (7,195,431)$ (18,760,587)$ ($37,966,082)
Source: RKG Associates, Inc., 2013
Year 1 Year 10 Year 15 Year 20
Year 20Year 15Year 10Year 1
Table 7-6

Page | 7-25
VAP Neighborhood Revitalization Study
Section
7
Table 7-3
Vacant & Abandoned Properties Impact Model (YearS 1-20)
Baseline Maintenance & Intervention Scenario
JEFFERSON COUNTY SUBURBS STUDY AREA Units
Yr. 1
Cost/Value Units
Cum. Total Cost
(Yrs. 1-10) Units
Cum. Total Cost
(Yrs. 1-15) Units
Cum. Total Cost
(Yrs. 1-20)
BASELINE MAINTENANCE SCENARIO
Total Expenditures (inc. infrastructure investments) 5,775,947$ 61,320,324$ 94,833,057$ 130,043,413$
Administrative Services/Infrastructure/Code Enforcement 3,257,237$ 33,364,459$ 50,327,757$ 66,993,147$
Code Enforcement/Inspection 6,000 591,600$ 4,599 5,829,602$ 3,765 8,545,717$ 2,889 10,973,354$
Administrative Staff Time (Metro Govt.) - 175,225$ - 1,951,316$ - 3,112,426$ - 4,418,050$
Cutting/Cleaning 2,416 1,286,839$ 1,663 12,099,461$ 1,215 17,087,244$ 744 20,856,900$
Boarding 650 77,272$ 6,500 865,712$ 9,750 1,385,642$ 13,000 1,973,895$
Demolition 100 726,300$ 1,000 8,137,016$ 1,500 13,023,958$ 2,000 18,553,085$
Foreclosure 100 400,000$ 1,000 4,481,353$ 1,500 7,172,771$ 2,000 10,217,863$
Pre-Development Expenditures 2,518,711$ 27,955,865$ 44,505,300$ 63,050,266$
Neighborhood Planning 0.2 100,000$ 2.0 1,120,338$ 3.0 1,793,193$ 4.0 2,554,466$
Infrastructure Improvements - -$ - -$ - -$ - -$
Affordable Housing Subsidies 24 1,385,000$ 240 15,516,684$ 360 24,835,718$ 480 35,379,351$
Property Acquisition (Residential & Nonresidential) 20 1,033,711$ 200 11,318,843$ 300 17,876,389$ 400 25,116,449$
Tax Revenues 13,477$ 970,024$ 2,419,260$ 4,798,765$
Real Property Tax Revenue 12,495$ 741,463$ 1,689,496$ 3,090,509$
Personal Property Tax Revenue 981$ 228,561$ 729,765$ 1,708,256$
Occupational Tax Revenue -$ -$ -$ -$
Economic Development - -$ - -$ -$ -$
Employment - - - -
Annual Payroll -$ -$ -$ -$
Change in Vacant & Abandoned Property Inventory
Vacant - (602) (948) (1,412)
Abandoned - (602) (948) (1,200)
Total Cummulative Maintenance Cost Savings - - (2,274,510)$ (5,073,269)$ (9,421,809)$
INTERVENTION SCENARIO
Units
Yr. 1
Cost/Value Units
Cum. Total Cost
(Yrs. 1-10) Units
Cum. Total Cost
(Yrs. 1-15) Units
Cum. Total Cost
(Yrs. 1-20)
Total Expenditures (inc. infrastructure investments) 7,607,139$ 102,093,355$ 164,947,208$ 225,532,342$
Administrative Services/Infrastructure/Code Enforcement 4,938,428$ 53,739,189$ 77,029,337$ 94,897,035$
Code Enforcement/Inspection 6,000 887,400$ 3,835 8,268,269$ 2,398 11,218,045$ 888 12,887,819$
Administrative Staff Time (Metro Govt.) - 175,225$ - 5,247,042$ - 10,321,184$ - 14,540,485$
Cutting/Cleaning 2,416 2,573,678$ 1,238 22,380,923$ 383 27,540,037$ - 27,904,339$
Boarding 650 175,825$ 6,500 1,969,835$ 9,750 3,152,881$ 13,000 4,491,389$
Demolition 100 726,300$ 1,200 9,766,217$ 1,700 14,653,159$ 2,200 20,182,285$
Foreclosure 100 400,000$ 1,350 6,106,904$ 2,100 10,144,031$ 2,878 14,890,718$
Pre-Development Activities 2,668,711$ 48,354,166$ 87,917,871$ 130,635,306$
Neighborhood Planning 0.50 250,000$ 5.0 2,800,845$ 7.5 4,482,982$ 10.0 6,386,164$
Infrastructure Improvements - -$ - 647,516$ - 1,436,451$ - 1,436,451$
Affordable Housing Subsidies 24 1,385,000$ 447 25,353,778$ 787 46,164,669$ 1,137 70,144,771$
Property Acquisition (Residential & Nonresidential) 20 1,033,711$ 388 19,552,028$ 687 35,833,770$ 990 52,667,920$
Revenues 26,954$ 6,126,424$ 17,217,626$ 35,976,981$
Real Property Tax Revenue 12,495$ 2,825,637$ 7,612,924$ 15,160,893$
Personal Property Tax Revenue 981$ 969,493$ 3,615,208$ 9,351,715$
Occupational Tax Revenue 13,477$ 2,331,294$ 5,989,494$ 11,464,372$
Economic Development - -$ 286 76,911,661$ 572 197,599,256$ 572 378,220,810$
Employment - 286 572 572
Annual Payroll -$ 76,911,661$ 197,599,256$ 378,220,810$
Change in Vacant & Abandoned Property Inventory
Vacant - (1,069) (1,883) (3,000)
Abandoned - (1,069) (1,200) (1,200)
Total Cummulative Maintenance Cost Savings - - (7,195,431)$ (18,760,587)$ ($37,966,082)
Source: RKG Associates, Inc., 2013
Year 1 Year 10 Year 15 Year 20
Year 20Year 15Year 10Year 1
Table 7-7


